Abstract
A common feature of lithium-excess layered oxides, nominally of composition xLi2MnO3•(1-x)LiMO2 (M = transition metal) is a high-voltage plateau (∼4.5 V vs. Li/Li+) in their capacity-voltage profile during the first delithiation cycle. This plateau is believed to result from activation of the Li2MnO3 component, which makes additional lithium available for electrochemical cycling. However, oxides cycled beyond this activation plateau are known to display voltage fade which is a continuous reduction in their equilibrium potential. In this article we show that these oxides display gradual voltage fade even on electrochemical cycling in voltage ranges well below the activation plateau. The average fade is ∼0.08 mV-cycle−1 for Li1.2Ni0.15Mn0.55Co0.1O2 vs. Li cells after 20 cycles in the 2–4.1 V range at 55°C; a ∼54 mV voltage hysteresis, expressed as the difference in average cell voltage between charge and discharge cycles, is also observed. The voltage fade results from a gradual accumulation of local spinel environments in the crystal structure. Some of these spinel sites result from lithium deficiencies during oxide synthesis and are likely to be at the particle surfaces; other sites result from the migration of transition metal atoms in the partially-delithiated LiMO2 component into the lithium planes during electrochemical cycling. The observed rate of voltage fade depends on a combination of factors that includes the phase equilibrium between the layered and spinel components and the kinetics of transition metal migration.
Export citation and abstract BibTeX RIS

This is an open access article distributed under the terms of the Creative Commons Attribution 4.0 License (CC BY, http://creativecommons.org/licenses/by/4.0/), which permits unrestricted reuse of the work in any medium, provided the original work is properly cited.
Lithium- and manganese- rich transition metal oxides (LMR-NMC) are being extensively studied at various laboratories worldwide for use in high-energy density lithium-ion cells.1–15 These oxides are often described as xLi2MnO3•(1-x)LiMO2 (M = Ni, Co, Mn), i.e., as structurally integrated composites of Li2MnO3 and a Li-stoichiometric transition-metal bearing layered oxide.16–20 To achieve high energy densities (>900 Wh-kg−1) the oxides are cycled at high voltages (>4.5 V vs Li/Li+). On extended cycling, however, cell energy decreases because of increasing cell resistance, loss of mobile lithium, and a continuous reduction in the average open circuit voltage of the oxide (termed "voltage fade").21–23 In addition to reducing usable energy voltage fade also complicates state-of-charge (SOC) determination, which is required for effective cell management.
Previous studies have shown that voltage fade occurs when cells are cycled beyond the oxide "activation" plateau.24–26 An example of this oxide activation is shown in the inset of Figure 1 which contains first 2–4.7 V cycle data at 30°C and 55°C for a Li1.2Ni0.15Mn0.55Co0.1O2 vs. Li cell; this oxide has a theoretical capacity of 377 mAh-g−1. Oxide delithiation commences at ∼3.74 V at 30°C and at ∼3.64 V at 55°C; the oxide activation commences at ∼4.37 V at 30°C and at ∼4.33 V at 55°C. The charge and discharge capacities at 30°C are 324 and 274 mAh-g−1; the corresponding capacities at 55°C are 342 and 313 mAh-g−1. Peaks corresponding to first oxide delithiation and oxide activation are seen in the differential capacity plots (Figure 1).

Figure 1. First cycle differential capacity (dQ-dV−1) plots from Li1.2Ni0.15Mn0.55Co0.1O2 vs. Li cells, cycled between 2–4.7 V with a 15 mA-g−1 current at 30°C (blue) and 55°C (red). Inset shows the corresponding capacity-voltage plots. The columbic efficiency (CE) is the ratio of lithiation to delithiation capacity.
In recent articles Croy and coworkers have shown that voltage fade, in LMR-NMC oxides cycled beyond the ∼4.5 V activation plateau, is associated with voltage hysteresis, which can be expressed as the difference between average voltages for the charge and discharge cycles.27–29 They propose that partially reversible migration of transition metal and/or lithium ions at high states of charge is responsible for these phenomena. The energy barrier that needs to be overcome for reversible migration of transition metal ions into the original octahedral sites is responsible for the voltage hysteresis. The transition metals that do not return to their original positions create new environments for lithium intercalation at lower voltages and, therefore, voltage fade.
Voltage fade is often attributed to the Li2MnO3 component in the LMR-NMC oxides: removal of lithium and oxygen30–32 from this component during oxide activation is believed to trigger this fade. In this article we show that (i) voltage fade also occurs in lithium-excess layered oxides cycled well below the activation plateau, and (ii) the crystal structure of the Li2MnO3 component remains unchanged during electrochemical cycling in the 2–4.1 V vs. Li/Li+ range. We postulate that the observed voltage fade results from a gradual conversion of the layered LiMO2 component into a spinel LixM2O4 (1 ≤ x ≤ 2) component. This conversion is driven by a combination of factors that includes (i) phase equilibrium between the spinel and layered components, which depends on local lithium concentrations and (ii) competing kinetics of transition metal and lithium ions migration within the evolving crystal.
Experimental
All electrochemical data reported in this article are from positive electrodes containing Li1.2Ni0.15Mn0.55Co0.1O2 (0.5Li2MnO3•0.5LiMn0.375Ni0.375Co0.25O2) as the active material. The electrodes are prepared by coating an Al foil with a mixture containing the oxide, SFG-6 graphite, acetylene black, and polyvinylidene fluoride (PVDF) binder (84:4:4:8 by weight). Electrochemical experiments are conducted in 2032-type coin cells (1.6 cm2 area electrodes) containing a Li-metal counter electrode, EC:EMC (3:7 by wt.) + 1.2 M LiPF6 electrolyte, and a Celgard 2325 separator. The cells were assembled in an argon-atmosphere glove box and galvanostatically cycled within a constant temperature oven held either at 30°C or 55°C. Additional details on electrode preparation and cell testing are described elsewhere.1,22
Results
Figure 2 shows data from a Li1.2Ni0.15Mn0.55Co0.1O2 cell cycled with a 15 mA-g−1 current at 55°C in the 2–4.1 V vs. Li range, which is well below the commencement of oxide activation. Capacity-voltage plots are shown in Figure 2a. The first cycle discharge capacity is 76 mAh-g−1, much lower than the 313 mAh-g−1 obtained for the first discharge cycle (4.7–2 V) after oxide activation. The discharge capacity rises from 76 to 82 mAh-g−1 during the 100 cycles; most of this rise occurs during the first 50 cycles (see Figure 2b). Even though the columbic efficiency (CE, ratio of lithiation to delithiation capacity) is less than one for all 100 cycles, the cell capacity rises; that is, additional lithium is accessed from within the oxide upon subsequent charge cycles even though the voltage-cycling range is kept constant.
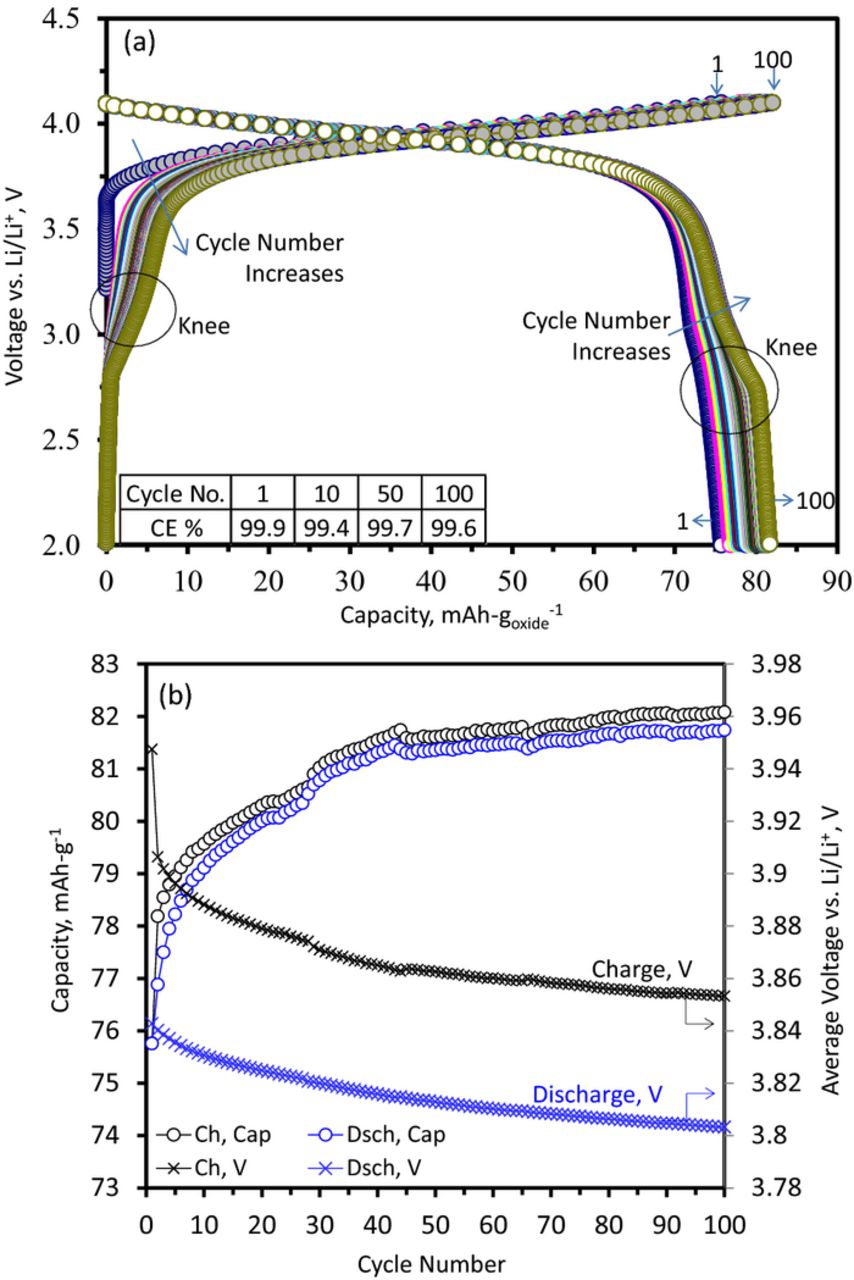
Figure 2. Data from Li1.2Ni0.15Mn0.55Co0.1O2 vs. Li cells cycled between 2–4.1 V vs. Li/Li+, with a 15 mA-g−1 current at 55°C. (a) Capacity-voltage plots. Cycle numbers, 1 and 100, are indicated. Coulombic efficiency (CE) is shown in the inset table. (b) Capacity and Average voltage changes with cycle number during both charge (Ch) and discharge (Dsch).
Figure 2b also shows that the average cell voltage decreases (i.e., voltage fade) during the charge and discharge cycles. The average discharge voltage decreases continuously, from 3.842 V (cycle 1) to 3.803 V (cycle 100), a 39 mV drop over 100 cycles. This voltage fade is evident for the charge cycles in Figure 2a. However, it is not immediately apparent for the discharge cycles because the voltage decrease is masked by the gradual capacity increase displayed by the cell. The discharge voltage decreases at a rate of ∼0.08 mV-cycle−1 over the first twenty 2–4.1 V cycles, much smaller than the ∼5 mV-cycle−1 observed for cells cycled at 55°C in the 2–4.7 V range. The difference between the average cell voltage during charge and discharge cycles is an indicator of voltage hysteresis displayed by the oxide. This difference decreases from ∼66 mV (cycle 2) to ∼50 mV (cycle 30) and remains at ∼50 mV for cycles between 30 and 100. At cycle 20, this voltage difference is ∼54 mV, much smaller than the ∼233 mV observed for cells cycled at 55°C in the 2–4.7 V range, i.e., beyond the oxide activation plateau.25
In Figure 2a, a "knee" develops with increasing cycle number in the charge-discharge plots. This feature is evident in the differential capacity plots of Figure 3. Figure 3a shows the expected features at ∼3.95 V, but also peak development in the 2.5–3.5 V range, which is significantly smaller than the main peaks. A gradual reduction in the ∼3.95 V peak intensity with cycle number accompanies the 2.5–3.5 V peak development. Figure 3b, an expanded view of Figure 3a, shows that these peaks develop gradually and continuously on cycling. These peaks indicate the creation of new, lower potential (<3.5 V), lithium environments. For the 100th cycle, the peak has developed (at least) three clearly resolved components (at 2.86, 2.96, 3.07 V) for the charge (delithiation) cycle, and two (at 3.0 and 2.79 V) for the discharge (lithiation) cycle. The splitting of the peaks into well-defined components suggests the presence of several lithium environments in the structure with similar, but not equal, site energies.
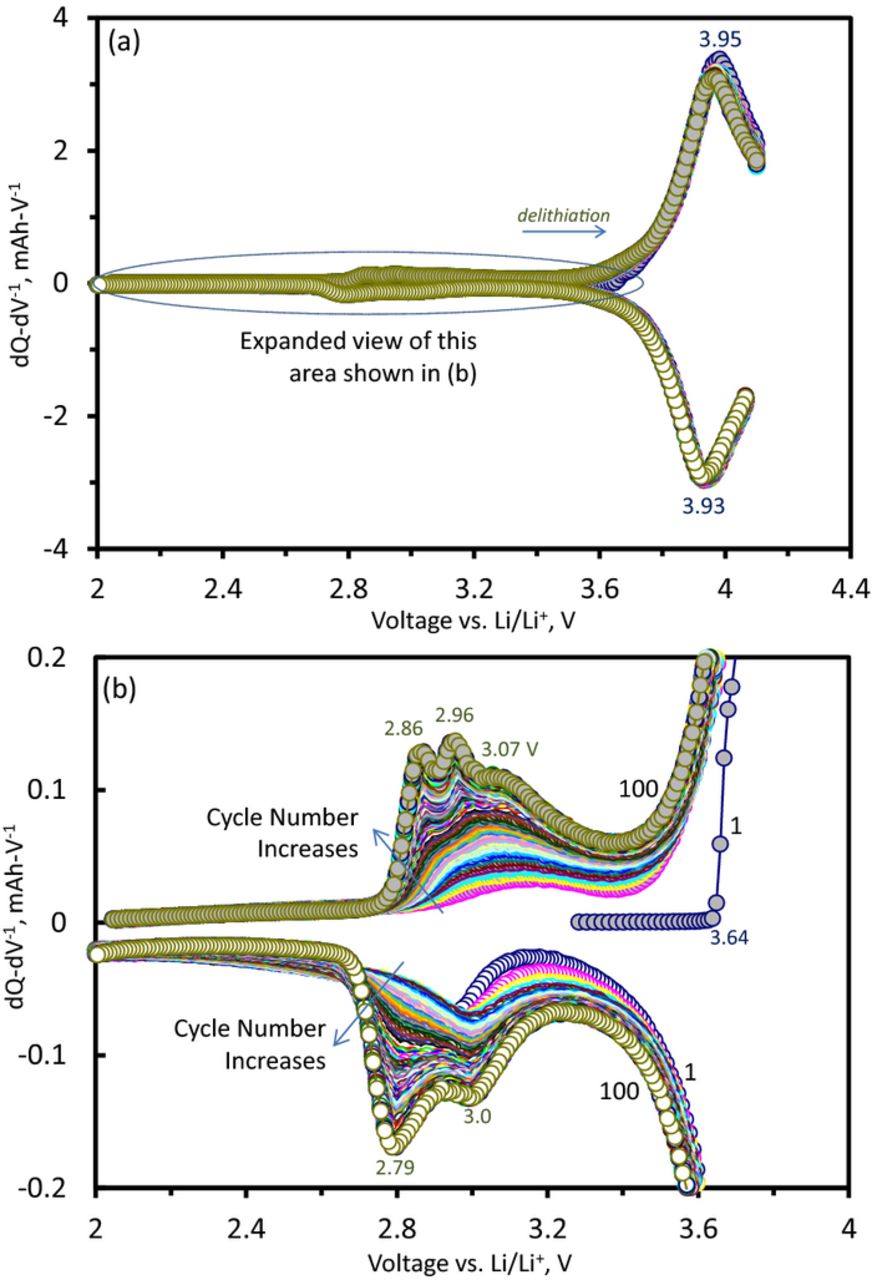
Figure 3. (a) Differential capacity (dQ-dV−1) plots from a Li1.2Ni0.15Mn0.55Co0.1O2 vs. Li cell, cycled 100 times between 2–4.1 V with a 15 mA-g−1 current at 55°C. (b) An expanded view of the data in (a) showing continuous changes resulting from oxide structure changes. Cycle numbers, 1 and 100 are indicated in the plots. Voltage values for various features in the plots are also shown.
High-resolution X-ray diffraction (XRD) data, on the pristine and 100-cycle Li1.2Ni0.15Mn0.55Co0.1O2 electrodes (of Figures 2 and 3), were obtained at Argonne's Advanced Photon Source (APS). The overall XRD patterns could be indexed based on the α–NaFeO2 (R-3m) structure, as described in an earlier article.1 The patterns also include additional peaks associated with the presence of monoclinic Li2MnO3 regions topotaxially integrated with the structure. Figure 4 shows a detail of this region in the XRD patterns. Consistent with previous reports33 the 2–4.1 V cycling causes no discernible changes in these peaks, which indicates that the Li2MnO3 component is a spectator and its structure remains unchanged during cycling in this voltage window.

Figure 4. X-ray diffraction data showing similarities between data from a pristine Li1.2Ni0.15Mn0.55Co0.1O2 electrode (black line) and an aged electrode (red line) harvested from a cell that underwent 100 2–4.1 V cycles at 55°C. The data are truncated to highlight peaks arising from the monoclinic (C2/m) Li2MnO3 component.
In order to further explore the lithium environments below 3.5 V, Li1.2Ni0.15Mn0.55Co0.1O2 vs. Li cells were cycled between 2–3.4 V, starting with a lithiation (discharge) cycle. Note that this voltage range is well below the commencement of oxide delithiation at 3.64 V (see Figure 3b). Three different cycling conditions were examined. In the first case (continuous), the cells were cycled continuously between 2–3.4 V. In the second case (hold), the cells were held at 2 V for 1h before each charge cycle. In the third case (rest), the cells were allowed to rest (zero current) for 1h before each charge cycle.
Figure 5a shows the first cycle differential capacity plots for the three cases. The first cycle discharge (lithiation) capacity curve is nearly the same in all three cases, consisting of a broad asymmetric peak at 2.7 V with a long tail to 2 V; the minor differences result from cell-to-cell variations that result from small differences in active-material loading, coin cell construction, etc. The lithiation capacity for the continuous, rest, and hold cells are 2.3, 2.5, and 4.4 mAh-g−1, respectively; clearly, additional capacity is accumulated during the 2 V hold step. On charge (delithiation), a peak shows in all three cases at ∼3.2 V. For the continuous and rest cases the first cycle charge capacities are 1.7 and 1.5 mAh-g−1, respectively, i.e., ∼74% and 60% of the discharge capacity. In the continuous case some capacity is observed below ∼2.9 V in addition to the broad peak around 3.2V. The rest cell, however, relaxed to ∼2.9V during the 1h rest step (zero current) and all the charge capacity (accessible Li) lies within the 3.2 V peak. The charge capacity for the cell held potentiostatically at 2 V was 3.2 mAh-g−1; i.e. ∼72% of the discharge capacity. In contrast to the continuous and rest cases, this charge capacity occurs both in the range below 2.9 V and within the 3.2 V peak, showing more capacity in each region than the other two cases.
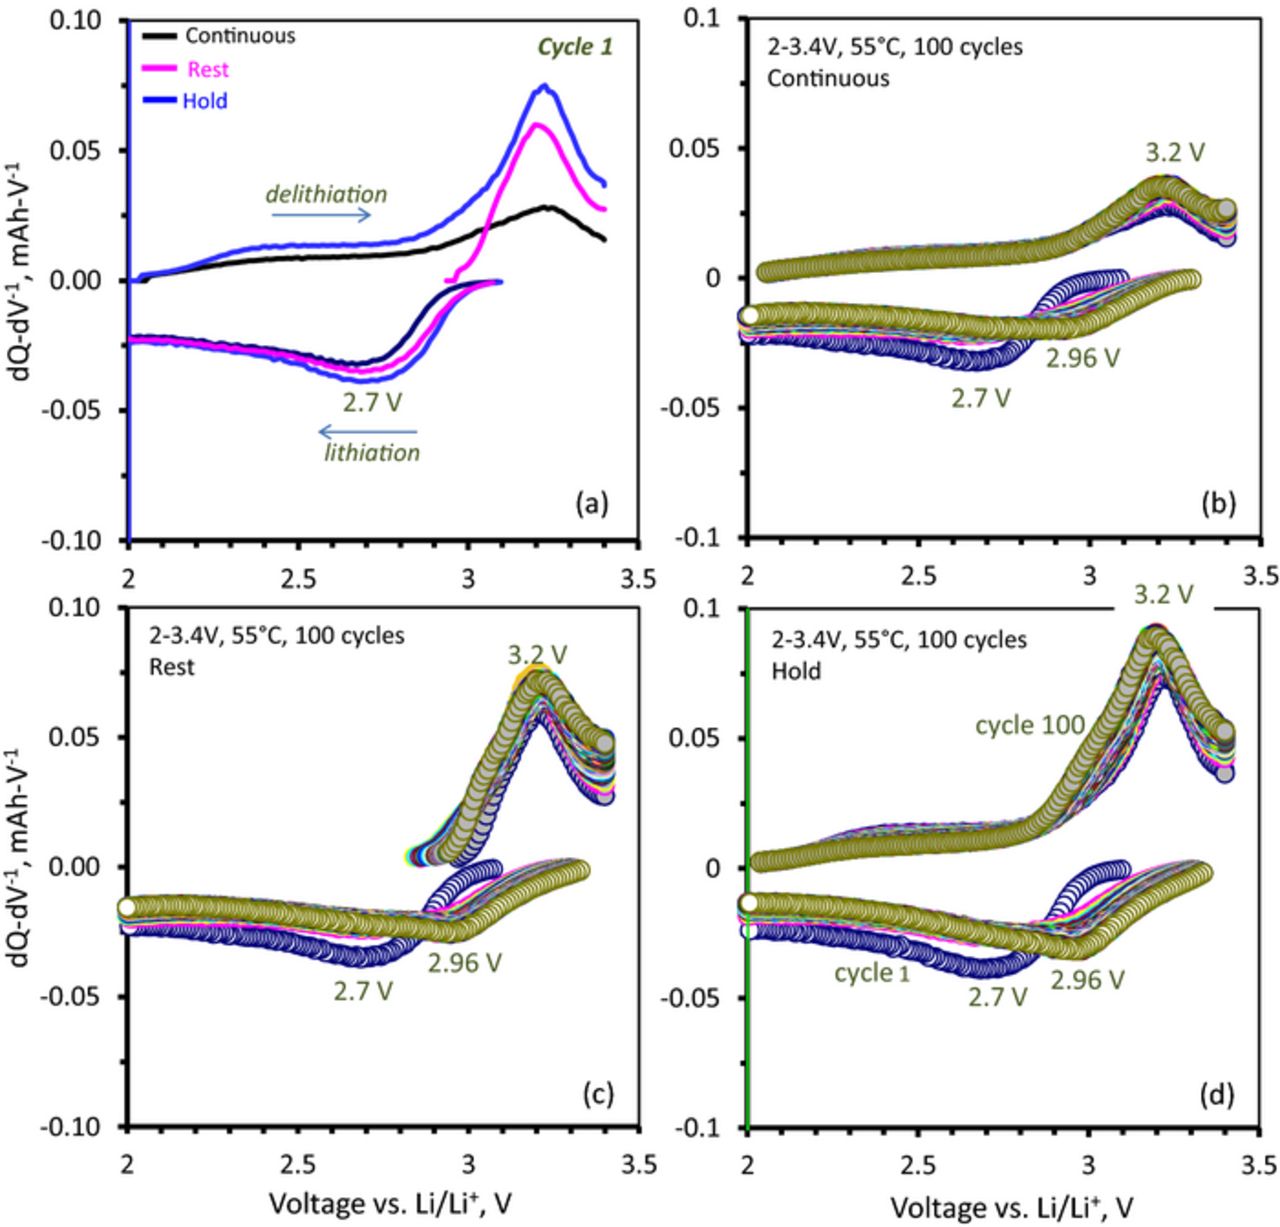
Figure 5. dQ-dV−1 plots from Li1.2Ni0.15Mn0.55Co0.1O2 vs. Li cells, cycled between 2–3.4 V with a 15 mA-g−1 current at 55°C. The cells were first discharged to 2 V. (a) First cycle – Continuous implies that the charge cycle immediately followed the discharge cycle (black); Hold implies that the cell was held for 1 h at 2 V before charge (blue); Rest implies that the cell was allowed to rest for 1 h after the 2 V discharge (magenta); the voltage gradually relaxed to ∼2.9 V before the charge cycle commenced. (b) – (d) 2–3.4 V, 55°C, 100 cycles for the Continuous, Rest and Hold cases.
Figures 5b through 5d show 100 charge-discharge cycles in the 2–3.4 V range for the continuous, rest, and hold cases, respectively. In all three cases both discharge and charge peaks evolve similarly after the first cycle. The discharge peak at 2.7 V shifts abruptly to ∼2.9 V after the first cycle, and subsequently continues to shift gradually to higher voltage, peaking at ∼2.96 V at cycle 100. In all three cases, the discharge capacity in the ∼2.9 V process increases continuously after the second cycle. The charge cycles retain the same qualitative features of the first cycle for all 100 cycles. All three cases show gradual increases in the 3.2 V peak during cycling. The continuous and hold cases show additional capacity in a broad feature below 2.9 V, which decreases gradually after the first cycle. The rest case, on the other hand, does not show any charge capacity below ∼2.9 V, as the open circuit voltage of the cell relaxes to this equilibrium voltage value during all the rest steps.
Figure 6 shows the capacity ratio (CR) of these cycles, defined as the ratio of the delithiation (charge) to lithiation (discharge) capacity, for all three cases. Note that the X-axis (cycle number) is presented in a logarithmic scale to emphasize changes occurring during the initial cycles. In all three cases the CR reaches unity after ∼10 cycles; i.e. all lithium inserted into the oxide between 3.4 and 2 V is extracted in the same voltage range. During the early cycles, however, the CR is lower than 100% and increases continuously with cycle number. Except for the first cycle, the CR is smallest for the continuous case, and largest for the hold case, with the rest case between the other two. In addition, the CR for the hold case reached unity faster, by the fourth cycle, while the values for the other two cases continue to increase.
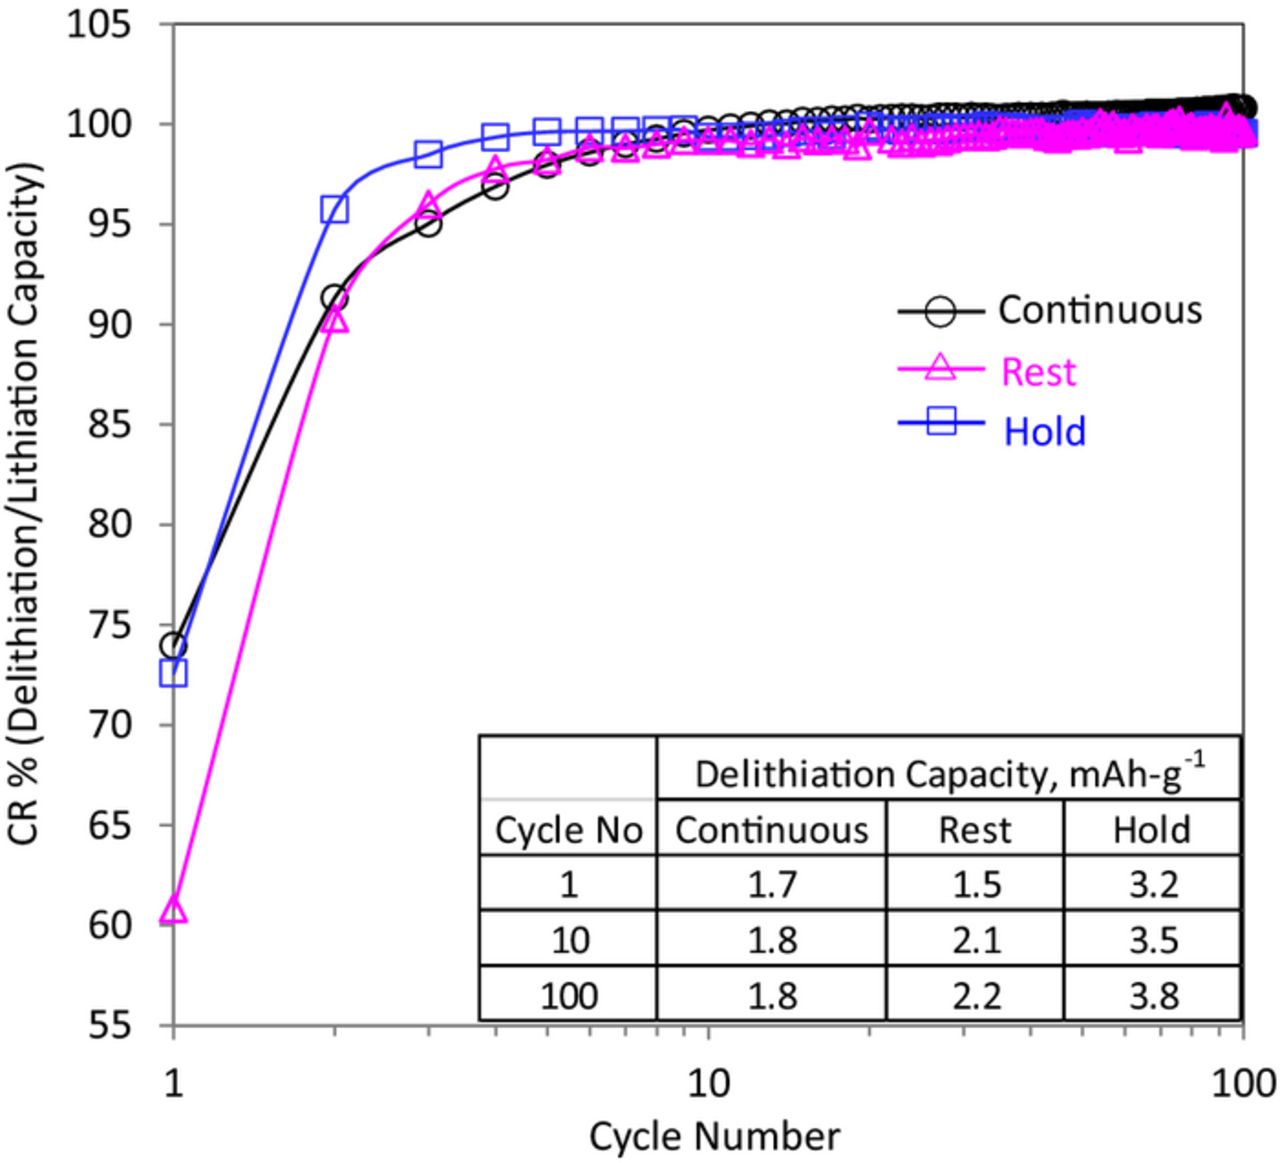
Figure 6. Capacity ratio (CR) vs. cycle number for the Continuous, Rest and Hold cases described in Figure 5. The inset table shows the delithiation capacity for cycles 1, 10 and 100.
The higher CR and faster CR rise for the hold case suggests that its origin is not in a parasitic reaction or leakage current affecting the measurement. If this were the case, holding the cell at 2V for 1h should consistently result in the smallest CR as the capacity associated with these loss processes cannot be recovered during the subsequent delithiation cycle. Therefore, there must be some internal processes transferring some of the lithium inserted below 3.4 V to higher voltages. The data in Figure 7 are used to check this hypothesis. Here two cells are compared: (i) a continuously cycled cell that was first discharged (oxide-lithiation) to 2 V and then charged to 4.1 V (black line), and (ii) a cell with its first delithiation cycle as presented in Figure 3b corresponding to a standard charge to 4.1 V (blue line) without a prior discharge cycle. Additional capacity is seen between 3.4 and 3.64 V in the pre-discharged cell that is not present in the first standard charge cycle. A similar behavior is observed for the second and subsequent charge cycles in Figure 3b indicating that this capacity is the consequence of cell discharge to 2 V.
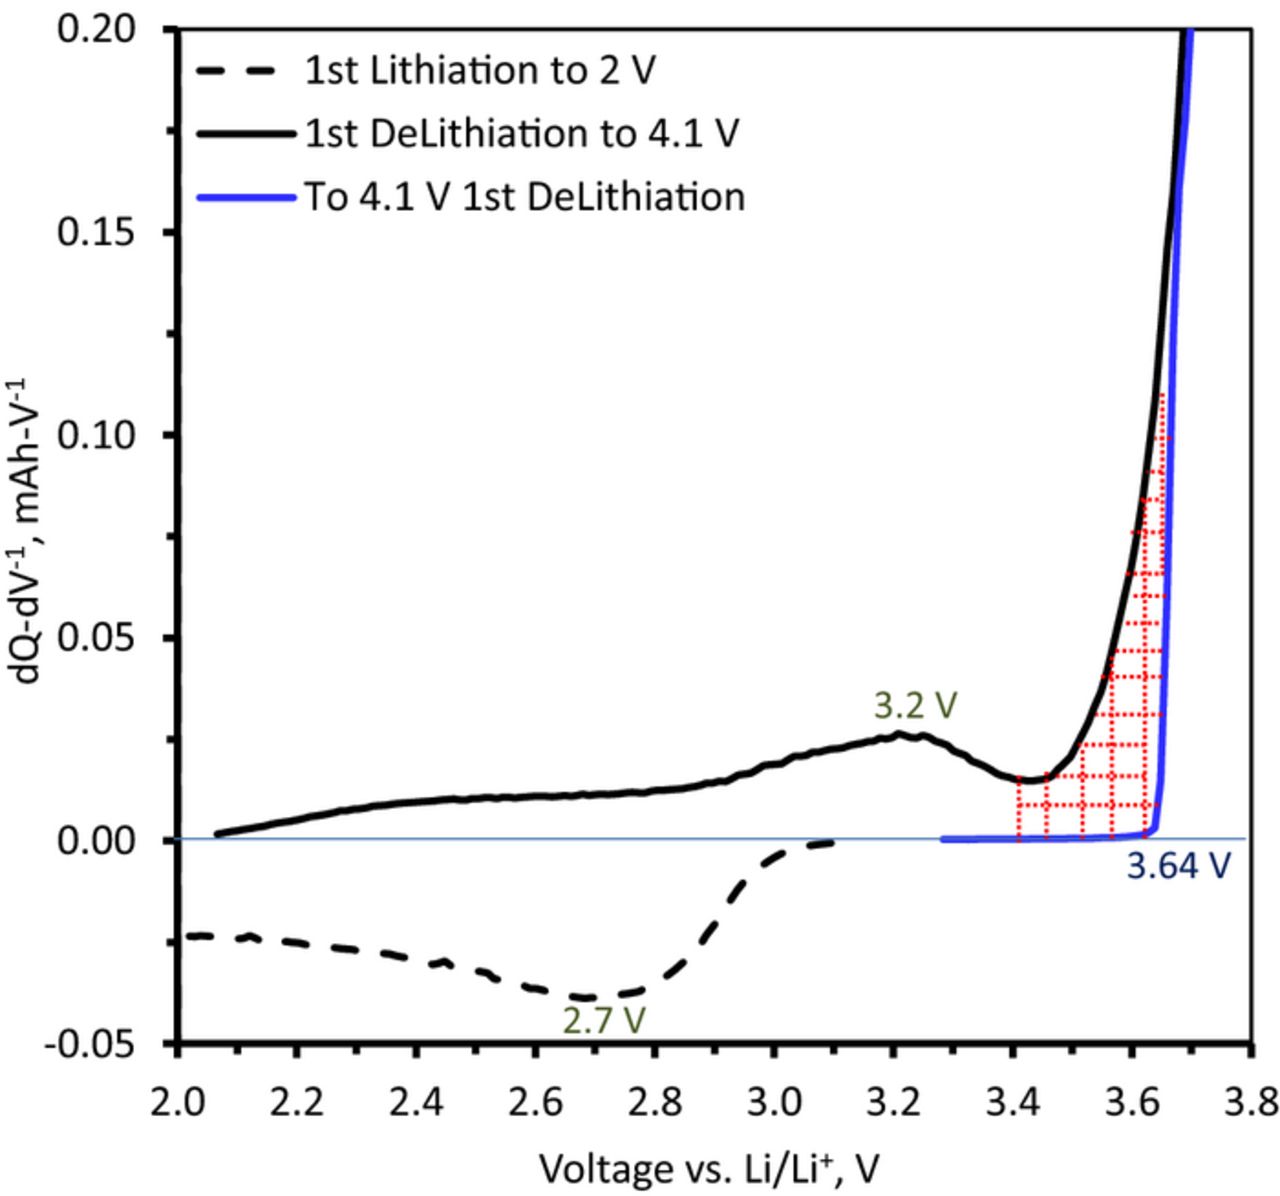
Figure 7. dQ-dV−1 plots comparing data from Li1.2Ni0.15Mn0.55Co0.1O2 vs. Li cells that were (i) first discharged to 2 V and then charged to 4.1 V (black lines), and (ii) directly charged to 4.1 V (blue). The cycling was conducted with a 15 mA-g−1 current at 55°C. The cross-hatched area indicates the charge capacity transfer to voltages above 3.4 V.
Discussion
The 2–3.4 V cycles
The data presented in Figures 5 through 7 suggest the presence of a minority environment that can intercalate lithium reversibly at an average voltage of ∼3 V, and the existence of another mechanism that can transfer some of the lithium inserted at these voltages to higher voltages. One explanation for this phenomenon is the existence of spinel environments in the oxide particles. In the following paragraphs, we present arguments drawn from the literature to support this hypothesis and discuss how the presence of these spinel environments can explain the observed electrochemical behavior.
In an earlier article we demonstrated that as-prepared Li1.2Co0.4Mn0.4O2 contains a quasi-random distribution of Li2MnO3-like monoclinic structures topotaxially integrated within a rhombohedral LiCoO2 framework.17,34 These domains result from "excess" lithium in the layered structure occupying sites in the transition metal plane and charge ordering with manganese to form LiMn6-regions, which are the building blocks of Li2MnO3.35,36 The presence of atomically-integrated Li2MnO3-like domains has also been reported by other authors in a variety of oxides, suggesting that this feature is common to LMR-NMC oxides.37–39 However, monoclinic Li2MnO3 is not the only arrangement of Li and transition metal ions that is structurally compatible with the layered structure. Spinel-environments,40–44 in which one quarter of the transition metal atoms occupy octahedral sites in the Li plane are also possible. Furthermore, in their overlithiated state Li2M2O4 ( = 2*LiMO2) spinels (where M = Ni, Mn, Co) are isostoichiometric with their layered LiMO2 counterparts. The only differences between these structures are the arrangement of lithium and M atoms in the octahedral interstitial lattice of the close packed oxygen framework and the distance between basal planes, which in the spinel arrangement corresponds to the spacing in a cubic structure. Therefore, it appears likely that the layered and overlithiated-spinel structures can transform into each other provided that there is sufficient energy for cation mobility.
Wolverton and Zunger explored this possibility for LiCoO2 employing Density Functional Theory (DFT) calculations.44 They found that the structural energy difference between rhombohedral (layered) LiCoO2 and cubic Li2Co2O4(=2*LiCoO2) is very small; the layered form is favored by only ∼0.01 eV/formula unit (fu). On the other hand, the spinel LiCo2O4 is thermodynamically favored over delithiated layered Li0.5CoO2 by ∼0.16 eV/fu. However, the fully-delithiated layered phase Li0CoO2 is preferred by ∼0.14 eV/fu over the fully-delithiated spinel Li0Co2O4 structure.
Wolverton and Zunger's analysis suggests that the thermodynamic preference of spinel over layered arrangements in partially-delithiated Li0.5MO2 layered oxides is a general feature. In fact, spinel-like arrangements of M atoms in the lithium plane have been reported in some LMR-NMC materials resulting from partial lithium loss during synthesis8 or electrochemical cycling.3 Additionally, a variety of layered-spinel compounds can be synthesized under intentionally lithium-deficient conditions.45–47 Furthermore, a variety of M-substoichiometric "defect spinels", such as Li4Mn5O12 = Li1.33Mn1.66O4 are also known, indicating that accommodation of M vacancies in the layered structure also plays a role in stabilizing spinel environments.48 Note that spinel structures generally present two clear processes in their dQ-dV−1 profiles. The lower voltage (∼3.0 V) process, corresponds to a Li2M2O4 <–> LiM2O4 equilibrium; while the higher voltage (∼4.0–5.0 V) process49 corresponds to a LiM2O4 <–> M2O4 equilibrium.
In Figures 5b through 5d a discharge peak at ∼2.9 V and a charge peak at 3.2 V are observed after the first cycle. Taken together these peaks suggest the presence of a process similar to the low voltage process in spinels, i.e., lithium intercalation into LiM2O4 (M = Ni, Co, Mn) regions in the oxide, resulting in Li2M2O4. We propose that these LiM2O4 regions are present at or near oxide particle surfaces, resulting from small Li losses during oxide synthesis and subsequent transformation of partially-delithiated Li1-xMO2 into LiM2O4. Additionally, we propose that these regions are not fully developed into well-crystallized spinels in the as-synthesized oxide particles, but are in a distorted state crystallographically between the delithiated-layered and spinel structures. The difference between the three different cycling conditions described in Figure 5 can be rationalized in terms of the recrystallization/development kinetics of the spinel structures, which is expected to be slow because of the need for M atoms to move.
When the testing starts with a discharge cycle (i.e., by lithiating the oxide, see Figure 5), lithium is forced into the delithiated spinel domains resulting in a discharge peak at 2.7 V. Due to the slow kinetics of lithium insertion at these low potentials, the cell polarizes rapidly and the process stops when the 2 V cut-off is reached. When the cell is recharged right away (continuous cycles, Figure 5b) the capacity is spread over the whole 2–3.4 V range, and the 3.2 V peak is weak. When the cell is allowed to rest for 1h before the delithiation cycle, (rest cycles, Figure 5c) the Li inserted in the low voltage tail of the lithiation process relaxes to higher voltages, pushing the OCV of the cell to ∼2.9 V, and the 3.2 V peak is much more pronounced. If, on the other hand, the voltage is held at 2 V for the same time (hold cycles, Figure 5d), additional Li is forced into the oxide; this results in additional charge capacity both at the 3.2 V peak and in the 2–2.9 V region.
We attribute the abrupt change in peak potential between the first and second 3.4–2 V lithiation cycles (∼0.26 V, see Figure 5) to the overpotential needed in the first lithiation cycle to force M atoms to move to form better crystallized LiM2O4 environments. Note that while lithium is being supplied to the oxide at voltages below 3 V, all processes capable of accepting lithium are active. Therefore, some of the lithium inserted below 3 V ends up in the high voltage sites of the spinel structure. This lithium is unavailable for cycling in the 2–3.4 V range and contributes to the coulombic inefficiency of these cycles (see Figure 6). In other words, not all the lithium inserted is extracted. However, lithium in the low voltage sites of the spinel environments (corresponding to the Li2M2O4 <–> LiM2O4 process) is extracted reversibly during the 3.2 V charge process.
During the second and subsequent discharge cycles, the low voltage sites of these recrystallized (more developed) spinel environments accept lithium at ∼2.9 V. But the high voltage sites of these environments cannot accept any lithium, because they were not emptied in the previous cycle. Additional lithium inserted at voltages <2.9 V contributes to further development of spinel structures from the remaining untransformed surface phase, which involves a partial loss of lithium to higher voltage sites. As the process repeats the fraction of lithium being cycled reversibly around 3 V increases and the charge and discharge peaks at 3.2 V and 2.9 V, respectively, grow. Eventually, the surface phase is fully transformed to spinel and the capacity ratio reaches unity (see Figure 6). It does so faster in the rest cycles than in the continuous cycles because the rest time allows for further cation redistribution to accommodate the inserted lithium into spinel environments, which is reflected in the relaxation of the cell's open circuit voltage (OCV). In the hold cycles, charge is replenished at 2 V as the oxide relaxes, resulting in the most Li inserted per cycle and the fastest capacity ratio increase between cycles.
Finally, even when the spinel phase development is complete, the total capacity in the ∼3 V process is very small, less than <3.8 mAh-g−1 or 0.012 Li+ per M atom, after 100 cycles. In comparison, the cells cycled between 2 and 4.1 V (see Figure 2) starting with a delithiation cycle, display a higher capacity, 6.1 mAh-g−1 or 0.019 Li+ per M atom, in the same 2–3.4V region over 100 cycles.
The 2–4.1 V cycles
Processes similar to those discussed above can be invoked to explain changes during the 2–4.1V cycles (Figures 2 and 3). Table I presents a closer look at the charge and discharge capacities of cycles 1–5 and cycles 96–100 in this cycling range. The table is divided into three sections; each section contains three columns and corresponds to a different voltage range. The first two columns in each section list the charge (delithiation) and discharge (lithiation) capacities at the corresponding voltage range. The third column lists the capacity gain between cycles, defined as the delithiation capacity of the cycle minus the lithiation capacity of the previous cycle. This number is a measure of the additional lithium extracted from the oxide at each cycle that was not supplied in the previous lithiation cycle. The first section lists capacities associated with the full 2–4.1 V voltage range. The second and third sections list the partial capacities associated with the voltage sub-ranges between 2–3.4 V and between 3.4–4.1 V, i.e., the integrated capacities under each of the two distinct processes seen in the differential capacity plots shown in Figures 3a and 3b.
Table I. Charge (Ch) and discharge (Disch) capacities in various ranges of the 2–4.1 V cycles. Gain is delithiation capacity of a particular cycle minus lithiation capacity of the previous cycle. Data for cycles 1–5 and cycles 96–100 are shown.
| 2–4.1 V range | 2–3.4 V range | 3.4–4.1 V range | |||||||
|---|---|---|---|---|---|---|---|---|---|
| Cycle No | Ch mAh-g−1 | Disch mAh-g−1 | Gain mAh-g−1 | Ch mAh-g−1 | Disch mAh-g−1 | Gain mAh-g−1 | Ch mAh-g−1 | Disch mAh-g−1 | Gain mAh-g−1 |
| 1 | 75.76 | 75.76 | 0.01 | 4.90 | 75.75 | 70.86 | |||
| 2 | 78.18 | 76.88 | 2.43 | 2.08 | 5.23 | -2.82 | 76.10 | 71.65 | 5.25 |
| 3 | 78.55 | 77.50 | 1.66 | 2.32 | 5.44 | -2.91 | 76.23 | 72.06 | 4.57 |
| 4 | 78.79 | 77.95 | 1.29 | 2.56 | 5.54 | -2.88 | 76.24 | 72.41 | 4.18 |
| 5 | 78.95 | 78.22 | 1.00 | 2.76 | 5.74 | -2.78 | 76.19 | 72.48 | 3.78 |
| 96 | 82.03 | 81.68 | 6.08 | 8.28 | 75.95 | 73.40 | |||
| 97 | 82.05 | 81.71 | 0.37 | 6.03 | 8.38 | -2.24 | 76.02 | 73.33 | 2.62 |
| 98 | 82.07 | 81.73 | 0.36 | 6.04 | 8.32 | -2.34 | 76.03 | 73.40 | 2.70 |
| 99 | 82.07 | 81.72 | 0.34 | 6.06 | 8.33 | -2.27 | 76.01 | 73.39 | 2.61 |
| 100 | 82.08 | 81.74 | 0.36 | 6.08 | 8.34 | -2.24 | 76.00 | 73.40 | 2.61 |
Ch = Charge (delithiation); Disch = Discharge (lithiation); thGain = Charge capacity (n cycle) – Discharge capacity (n-1th cycle)
An important observation in Table I is that, other than for the first cycle, the discharge capacity over the 2–4.1 V range is always lower than the corresponding charge capacity; that is, the coulombic efficiency (CE) is always lower than, albeit close to, one. However, the charge capacity is always larger than the discharge capacity of the previous cycle. In other words, at each cycle more lithium is extracted than was inserted in the previous cycle, as seen from the positive capacity gain. This additional lithium has to come from the reservoir of lithium available in the oxide particles at voltages initially above the 4.1 V cut-off, which was previously inaccessible. The partial shift of this reservoir into the 2–4.1 V range indicates the existence of voltage fade processes during cycling below the oxide activation plateau. Access to this additional lithium manifests in steady capacity gain during the first few cycles. After 100 cycles, the capacity reaches a steady value, ∼82 mAh-g−1 for charge and ∼81.7 mAh-g−1 for discharge, and ∼99.6% CE.
In order to identify the relative contribution of the two electrochemical processes visible in Figure 3 (Li2M2O4 <–> LiM2O4 around 3 V and LiM2O4 <–> M2O4 around 4 V) we examined the partial charge and discharge capacities in the 2–3.4 V and 3.4–4.1 V regions of the full cycle. The 3.4 V position was chosen as a qualitative boundary because it lies close to the "dQ-dV−1 valley" between the low and high voltage processes (see Figure 3b). In Table I we see that the charge and discharge capacities in both voltage ranges increase during the early cycles (1–5) and reach steady values during the later cycles (96–100).
For the 2–3.4 V region in Table I, not all the lithium inserted into the oxide during the discharge cycle can be extracted in the subsequent charge cycle, resulting in a negative gain, which is similar to the observations for samples cycled in the 2–3.4 V range. However, this negative gain persists even after 100 cycles, which is in contrast to the data in Figures 5 and 6. Also, the capacities associated with insertion/extraction of lithium into/out of spinel environments are higher than the corresponding capacities obtained from samples cycled in the 2–3.4 V range.
The negative gain in the 2–3.4 V range is compensated by the positive gain in the 3.4–4.1 V process, resulting in a net capacity increase during the 2–4.1 V cycles. In other words, even though the lithium inserted in the 2–3.4 V range is extracted in the same voltage range of the next cycle, more lithium is extracted in the 3.4–4.1 V range than was inserted in the previous discharge. That is, additional lithium becomes available in the 3.4–4.1V range from the previously untapped layered component of the oxide. This additional lithium (capacity increase) results from newly created spinel environments in the oxide particles as explained below.
At the 4.1 V upper cut-off voltage, a significant fraction of the layered component in the oxide becomes partially delithiated. In fact, the 75.8 mAh-g−1 charge capacity of the first cycle corresponds to 54.5% of the theoretical capacity associated with the layered component of the oxide. Therefore, a significant fraction of the layered component will be close to a local Li0.5MO2 stoichiometry, at which point there is a thermodynamic driving force for M atoms to migrate to the lithium plane to accommodate the remaining lithium into a lower energy LiM2O4 local environment. That is, the process produces new LiM2O4 which converts to Li2M2O4 at the low voltages and makes additional lithium available for the next cycle, which explains the steady increase in charge capacity in the 2–3.4V process. However, this charge capacity is a lower estimate of the amount of newly created Li2M2O4 <–> LiM2O4 sites in spinel environments. The negative gain in this range results from a capacity transfer into the 3.4–4.1 V range; that is, the additional lithium inserted into the oxide between 3.4–2 V is extracted in the 3.4–4.1 V range. This charge capacity transfer to higher voltages results from the conversion of some Li2M2O4 sites back to the layered phase during cell discharge to low voltages (i.e., to 2 V), thereby also reducing the discharge capacity of the 3.4–4.1 V process.
In contrast to the initial surface spinel environments, the creation of new spinel sites at higher voltages is not limited to the particle surfaces. In fact, presence of the Li2MnO3 component in the oxide provides internal domain boundaries at which creation of the spinel environments could be facilitated by heterogeneous nucleation. Lithium accessibility to spinel nuclei trapped inside the layered matrix could be limited, thereby inducing kinetic limitations to phase growth. Kinetic factors could also explain capacity shifts between the lower and higher voltage ranges. For example, during discharge (oxide lithiation) the spinel areas could hinder lithium transfer to nearby layered areas thereby shifting the capacity from the 3.4–4.1 V to the 2–3.4 V range. Conversely on charge, lithium from the internal spinel regions needs to traverse the layered matrix to reach the electrolyte, thereby shifting some of the spinel capacity above 3.4 V. That is, the observed capacity shifts could be a consequence of the partial reversibility of the layered to spinel transformation and/or induced by kinetic limitations to the lithium transfer process.
A distinct feature of Figure 3b is the clearly resolved components in the charge (delithiation) and discharge peaks. These sub-peaks indicate the presence of different lattice sites with characteristic Gibbs free energies and are apparently related to the local transition metal composition of the spinel areas. For example, modulations of the nickel, cobalt, and manganese contents can induce local distortions in the transition metal-oxygen, and corresponding lithium-oxygen, octahedra. These distortions could result in a range of local lattice configurations with distinct site energies for lithium insertion-extraction reactions. That is, the sub-peaks suggest the development of several transition metal arrangements within the spinel environments during electrochemical cycling. Further studies by techniques, such as transmission electron microscopy and electron energy loss spectroscopy, which probe crystal structure and composition at atomic scales are needed to examine this hypothesis.
Conclusions
Voltage fade in Li1.2Ni0.15Mn0.55Co0.1O2 (0.5Li2MnO3•0.5LiMn0.375Ni0.375Co0.25O2) on cycling above the oxide activation plateau is well documented. This fade is often attributed to the removal of lithium and oxygen from Li2MnO3 component in the oxide. Here, we show that gradual voltage fade is also observed in Li1.2Ni0.15Mn0.55Co0.1O2 cells cycled well below the voltage needed for oxide activation. Crystal structure examination shows that the structure of the Li2MnO3 component in the oxide is unchanged during cycling, i.e., the observed fade cannot be attributed to this component.
During 55°C cycling in the 2–4.1 V range, a ∼0.08 mV/cycle voltage reduction is observed over the first twenty cycles; this reduction is much smaller than the ∼5 mV/cycle observed for cells cycled in the 2–4.7 V range, i.e., in a voltage range beyond the oxide activation plateau. A ∼50–66 mV voltage hysteresis is also observed, much smaller than the >200 mV voltage hysteresis observed after oxide activation. In addition to the main peaks at ∼3.95 V, differential capacity plots show features in the 2.5–3.5 V range, which develop gradually and continuously on cycling and indicate the creation of new, lower potential lithium environments. Although columbic efficiency is less than one, cell capacity rises indicating that additional lithium from within the oxide is accessed even though the 2–4.1 V cycling range is kept constant. We postulate that this additional lithium (capacity increase) results from newly created spinel environments, which result from migration of transition metal atoms in the partially-delithiated LiMO2 component into the lithium planes during electrochemical cycling.
Gradual growth of new lithium environments is also seen for cells cycled in the 2–3.4 V range, which is below the voltage required for delithiation of the LiMO2 component in the oxide. To explain these changes we postulate the existence of minority regions (probably at or near oxide particle surfaces) resulting from small Li losses during oxide synthesis. These regions develop into spinel environments that reversibly intercalate lithium at an average voltage of ∼3 V and may serve as nucleation sites for the well-documented structural changes after oxide activation.
Acknowledgments
Support from the U.S. Department of Energy's Vehicle Technologies Program, specifically from Peter Faguy and Dave Howell, is gratefully acknowledged. We are grateful to A. Jansen, B. Polzin, and S. Trask from the U.S. Department of Energy's (DOE) CAMP Facility, Argonne for the electrodes used in this study. The CAMP is fully supported by the DOE Vehicle Technologies Program (VTP) within the core funding of the Applied Battery Research (ABR) for Transportation Program. Use of the Advanced Photon Source (APS) was supported by the U. S. Department of Energy, Office of Science, Office of Basic Energy Sciences, under Contract No. DE-AC02–06CH11357. We are grateful to Matt Suchomel at APS beam line 11-BM for obtaining the high-resolution powder diffraction data. We are also grateful for the support and feedback from members of the Argonne Voltage Fade Team (A. Abouimrane, M. Balasubramanian, R. Benedek, I. Bloom, T. Burrell, Z. Chen J. Croy, D. Dees, F. Dogan, K. Gallagher, H. Iddir, B. Ingram, C. Johnson, B. Key, E. Lee, B. Long, W. Lu, D. Miller, M. Thackeray, Y. Ren, L. Trahey, Q. Wu, J. Vaughey).
The submitted manuscript has been created by UChicago Argonne, LLC, Operator of Argonne National Laboratory ("Argonne"). Argonne, a U.S. Department of Energy Office of Science laboratory, is operated under Contract No. DE-AC02–06CH11357. The U.S. Government retains for itself, and others acting on its behalf, a paid-up non-exclusive, irrevocable worldwide license in said article to reproduce, prepare derivative works, distribute copies to the public, and perform publicly and display publicly, by or on behalf of the Government.