
Abstract
Nickel–iridium (Ni–Ir) alloy system is of great interest for catalytic and corrosive environment applications. In this study, Ni-Ir alloys were galvanostatically electrodeposited on copper substrates from citrate aqueous solutions in a three-electrode cell system. The effects of deposition variables, including pH, temperature and current density, on the faradaic efficiency (FE), chemical composition, surface morphology and crystallographic structure of the films were studied. The electrochemical behaviors of Ir, Ni and co-deposited alloys were investigated using cyclic voltammetric, chronopotentiometric and chronoamperometric techniques. The results show that Ni–Ir alloys as thick as 25.7 μm with Ir–content as high as 15 at% and the FE as high as 36% were obtained. By adjusting these deposition parameters, the optimum pH, temperature and current density for deposition of Ni-Ir alloys were 5.0, 70°C and 60 mA·cm−2, respectively. As the deposition variables were varied, the abundant of Ni-content in the deposit was obtained. The alloy was composed of nanocrystalline phase. The deposition of Ni ions was favored, and the co-deposition of Ni-Ir alloy was a normal deposition. The chronoamperometric transient nucleation at the potentials of −0.25 and −3.0 V were consistent with the model of diffusion-controlled 3D nucleation.
Export citation and abstract BibTeX RIS
Rhenium (Re), tungsten (W), iridium (Ir) or molybdenum (Mo) can be difficult to be deposited alone from aqueous solution. However, these metals could be co-electrodeposited with iron-group elements to form alloy deposits.1–5 Recently, the electrodeposition of alloys bwteen platinum group metals and iron group metals has received a great attention as an alternative catalytic or anti-corrosion application. The platinum group metals could be used at high temperatures under mechanical loads and corrosive attack, which have high melting points, excellent chemical stability and oxidation resistance.6,7 Therefore, the platinum group metals could compensate for the shortage in certain characteristics of iron group metals. According to the published works, Pd-Ni, Pd-Fe, Pt-(Ni, Co, Cu, Pb), Ir-Ni and Ir-Co alloys could be electrodeposited in aqueous solutions.4,5,8–13
Ir is a promising candidate for a wide range of applications due to its high melting point, low oxygen permeability, high chemical stability, superior oxidation resistance and electrocatalytic activity performance.14–17 Therefore, Ir doped Ni may lead to potential wide use, especially in catalytic and anti-corrosive environment applications.18,19 Ir-Ni alloy is of particular interest because of the completely miscibility of Ir and Ni and the absence of intermetallic compounds in Ir-Ni isomorphous phase diagram. At present, Ni-Ir film could be produced by magnetron sputtering19 and electrodeposition.13 For vapor deposition process, the film is obtained by the expensive devices at a high-vacuum condition. Electroplating is a powerful cost-effective and reliable film process without vacuum. The electroplating of metals and alloys may become an alternative, which is widely employed in the deposition of pure, uniform, adherent metals and alloys at low temperature in aqueous solution.20–22 Cohen-Sagiv et al.13 developed suitable plating baths for electroplated Re-Ir-Ni alloys and pointed out that Ni-Ir alloy could be deposited from aqueous solution, however only the effect of complexing agent on Ni-Ir alloy electrodeposition has been reported. In our recent work,9 the effects of bath composition and deposition time on electrodeposition of Ni-Ir alloys were studied, and discovered that the co-deposition of Ni–Ir alloy with Ir content as high as 37 at% and faradaic efficiency (FE) as high as 44% was a normal deposition. Näther et al.4 studied the Ir-Ni alloys electrodeposited from hexabromoiridate solution and found that crack-free Ir-Ni layers for thicknesses smaller than 2 μm possessed a hardness of 900 HV.
The electrodeposition of alloy is more complex than the deposition of single metal, and involves the control of bath chemistry and deposition variables. The deposition variables, such as pH, temperature and current density/deposition potential, could influence the nucleation and electrocrysallization of alloys.11,23 The reversible/equilibrium potential at a metallic electrode that is in equilibrium with its ions is given by the Nernst Equation:24
![Equation ([1])](https://content.cld.iop.org/journals/1945-7111/164/14/D985/revision1/d0001.gif)
where E is the reversible electrode potential, E0 is the standard oxidation electrode potential, R is the universal gas constant, T is the temperature in kelvins, F is the Faraday constant, ν is the number of moles of electrons transferred in the cell reaction or half-reaction, αion is the actual ionic activity. According to Eq. 1, the reversible electrode potential depends on the temperature and the actual ionic activity. The latter is the activity of the depositing cation at the surface of cathode electrode, which is dependent on pH. Wu et al.25 studied the effects of pH and temperature on the FE, composition and microstructure of electroplated Re-Ir-Ni alloys in citrate aqueous solution, and found out that the pH 8.0 and temperature 70°C were the best suitable for the electroplating of alloys. Generally, high quality alloy can be obtained by addition of complexing agents, which diminish the activity of the metallic ion in aqueous solution.26 However, the variation of pH in citrate-Ni electrolytes results in the formation of different Ni-citrate complex ions, which has an impact on the overall electroplating process and the nature of the deposits. The temperature is another important parameter in electroplating of alloys. A rise in the temperature causes a decrease of the cathode polarization. The current density is also an important variable in electrodeposition of alloys. The current density could affect the grain growth and the number of nucleation. In the present work, Ni-Ir alloys were galvanostatically electrodeposited on copper (Cu) substrates from citrate aqueous solutions. In order to optimize the deposition variables, the effect of electroplating variables on the FE, chemical composition, deposition potential, morphology, and crystallographic structure of Ni-Ir alloys were studied. At the same time, a detailed investigation must be carried out to better understand Ni, Ir and Ni-Ir alloys deposition. The electrochemical behaviors of Ir, Ni and co-deposited alloys were investigated using cyclic voltammetric, chronopotentiometric and chronoamperometric techniques.
Experimental
A three-electrode cell was used for electrodeposition of Ni-Ir alloys on the working electrode. The three electrodes consisted of a Cu disc as the working electrode, two platinum foils as the counter-electrode placed ∼5 mm away from both sides of the working electrode, and a reference Ag/AgCl 3 M KCl electrode. The Cu disc with exposed surface area of ∼1.6 cm2 was welded with Cu wire with a diameter of 0.9 mm by a spot welder machine. The galvanostatical electrodeposition and electrochemical process were carried out in the cell, using an electrochemical workstation 660E (CHI style) coupled to a computer with specific data acquisition software installed. The cyclic voltammetry was performed at scanning rate of 10 mV·s−1. The working electrode of Cu with a surface area of 0.8 cm2 was cold covered in epoxy resin on one side for electrochemical analysis.
The temperature was controlled by a HH-501 thermostatic bath (Jintan Baita Xinbao Instrument Factory). Prior to electroplating, the Cu disc was cleaned with surfactant soap water in an ultrasonic bath for 10 min, and subsequently immersed in nitric acid solutions with a volume ratio of 1:1 by nitric acid and deionized water for ∼1 min, and then rinsed and cleaned with deionized water, and finally followed by cleaning with acetone in an ultrasonic bath for 5 min.
Ni-Ir alloys were electrodeposited galvanostatically from aqueous solution containing 35 mM iridium(III) chloride hydrate IrCl3·nH2O, 115 mM nickel(II) sulfamate tetrahydrate Ni(NH2SO3)2·4H2O and 90 mM citric acid C6H8O7 in a three-electrode cell system. The bath chemistries and deposition variables are displayed in Table I. Iridium(III) chloride hydrate, the most commonly available compound of Ir, is a greenish-black crystalline powder.27 Nickel(II) sulfamate tetrahydrate is a greenish powder as a salt of the strong monobasic sulfamic acid (NH2SO3H), which could yield a high throwing power and reduce residual stress in the deposit.28 The citric acid is a white crystalline powder used as complexing agent, which has three carboxylic groups and one alcoholic group. Citric acid deprotonates gradually from a neutral molecule to a series of negatively charged ions from −1 to −4, as the solution pH is changed. Citric acid could form stable complexes with Ni2+ ions, which influences the electrodeposition of alloys.29–31
Table I. Bath chemistry and deposition conditions.
| Bath chemistry | Deposition conditions | ||
|---|---|---|---|
| Ni(NH2SO3)2·4H2O (mM) | 115 | pH | (2.0 – 8.0) ± 0.1 |
| IrCl3·nH2O (mM) | 35 | Temperature (T,°C) | (50 – 90) ± 1 |
| C6H8O7 (mM) | 90 | Current density (j, mA·cm−2) | 30 – 80 |
| Volume of the electrolyte (mL) | 12 | Deposition time (h) | 1 |
The bath components were dissolved completely in deionized water using a magnetic stirring apparatus. The pH determined by a PHS-3C pH meter was adjusted to the desired value by the addition of 5 M sodium hydroxide solution while being stirred. The bath solution was purged with pure N2 for 15 min before turning on the current. A N2 blanket was passed over the solution during electroplating. A magnetic stir bar was used to stir the solution. All experiments were carried out under the same stirring condition in order to maintain similar mass transport conditions near the working electrode.
The mass gain of the specimens before and after deposition was measured by an electronic analytical balance (FA2004B, resolution 0.1 mg). The average FE was calculated from the added mass, the charge passed and the chemical composition of the films. The thickness of the films was calculated from the added mass, the exposed surface area of the substrate and the composition of the deposit. Further details can be found in Ref. 13.
The crystallographic structure of the alloy was determined by X-ray diffraction (XRD, Scintag, USA) equipped with a Cu-Kα radiation source. The measurements were performed in the 2θ range of 20 to 90°. The morphology and microstructure of the top surface of the deposits were examined by a scanning electron microscopy (SEM, JSM-6360) operated in a high vacuum mode and electron beam acceleration voltage of 20 kV, equipped with the attached liquid-nitrogen-cooled Oxford Si X-ray energy dispersive spectroscopy (EDS) detector. The chemical composition of the film was tested by the EDS detector. For each deposit, the quantitative analysis was realized in quintuplicate.
Results and Discussion
The effect of pH
According to preliminary studies, the low pH values of 2.0–3.0 led to black precipitate formed on the surface of the substrates. Raising pH value could form the silvery deposits from aqueous solution. Therefore, the pH was varied from 4.0 to 8.0, while keeping all other variables constant. The temperature and current density were 70°C and 50 mA·cm−2, respectively. The effect of electroplating variables on the characteristics of as-deposited samples is shown in Table II. The mass gain and film thickness increased with increasing pH from 4.0 to 5.0, and then steadily decreased with increase in pH from 5.0 to 8.0. Figure 1 shows the plots of the Me-content (Me = Ir and Ni) in the deposit, the FE and the measured potential as a function of pH. In Fig. 1a, the Ir-content kept in a range of 10–15 at% with increasing pH from 4.0 to 8.0. The abundant of Ni-content in the deposit was obtained. In Fig. 1b, the FE reached a maximal value of 35% at pH 5.0, but the FE kept stable in the range of 20–30% at high pH. The measured cathodic potential increased from –0.704 to –1.323 V, resulting in an increase of 0.619 V with an increase in pH. This variation corresponds well to the change of the reversible potential for hydrogen evolution according to the Nernst equation. The measured cathodic potential shifted toward more cathodic potential with increase in pH, indicating the equilibrium potential shift of oxidation reaction. According to above results, the electrolyte pH 5.0 is the best suitable for the deposition of Ni-Ir alloys.
Table II. Effect of electroplating variables on the characteristics of as-deposited samples.
| pH* | w^ (mg) | h (μm) | T@ (°C) | w^ (mg) | h (μm) | j# (mA·cm−2) | w (mg) | h (μm) |
|---|---|---|---|---|---|---|---|---|
| 4 | 24.6 | 13.7 | 50 | 19.6 | 11.4 | 30 | 18.4 | 11.5 |
| 5 | 35.0 | 20.8 | 60 | 23.1 | 13.5 | 40 | 25.8 | 15.0 |
| 6 | 27.8 | 16.7 | 80 | 31.7 | 20.3 | 60 | 43.6 | 25.7 |
| 7 | 24.5 | 14.3 | 90 | 33.8 | 19.4 | 70 | 28.3 | 16.2 |
| 8 | 15.9 | 10 | 90 | 33.8 | 19.4 |
Note: pH*: T = 70°C, j = 50 mA·cm−2; T@: pH = 5.0, j = 50 mA·cm−2; j# : pH = 5.0, T = 70°C. The deposition time of all experiments was 1 h. w^ is the gained mass, h is the thickness of the alloy film.
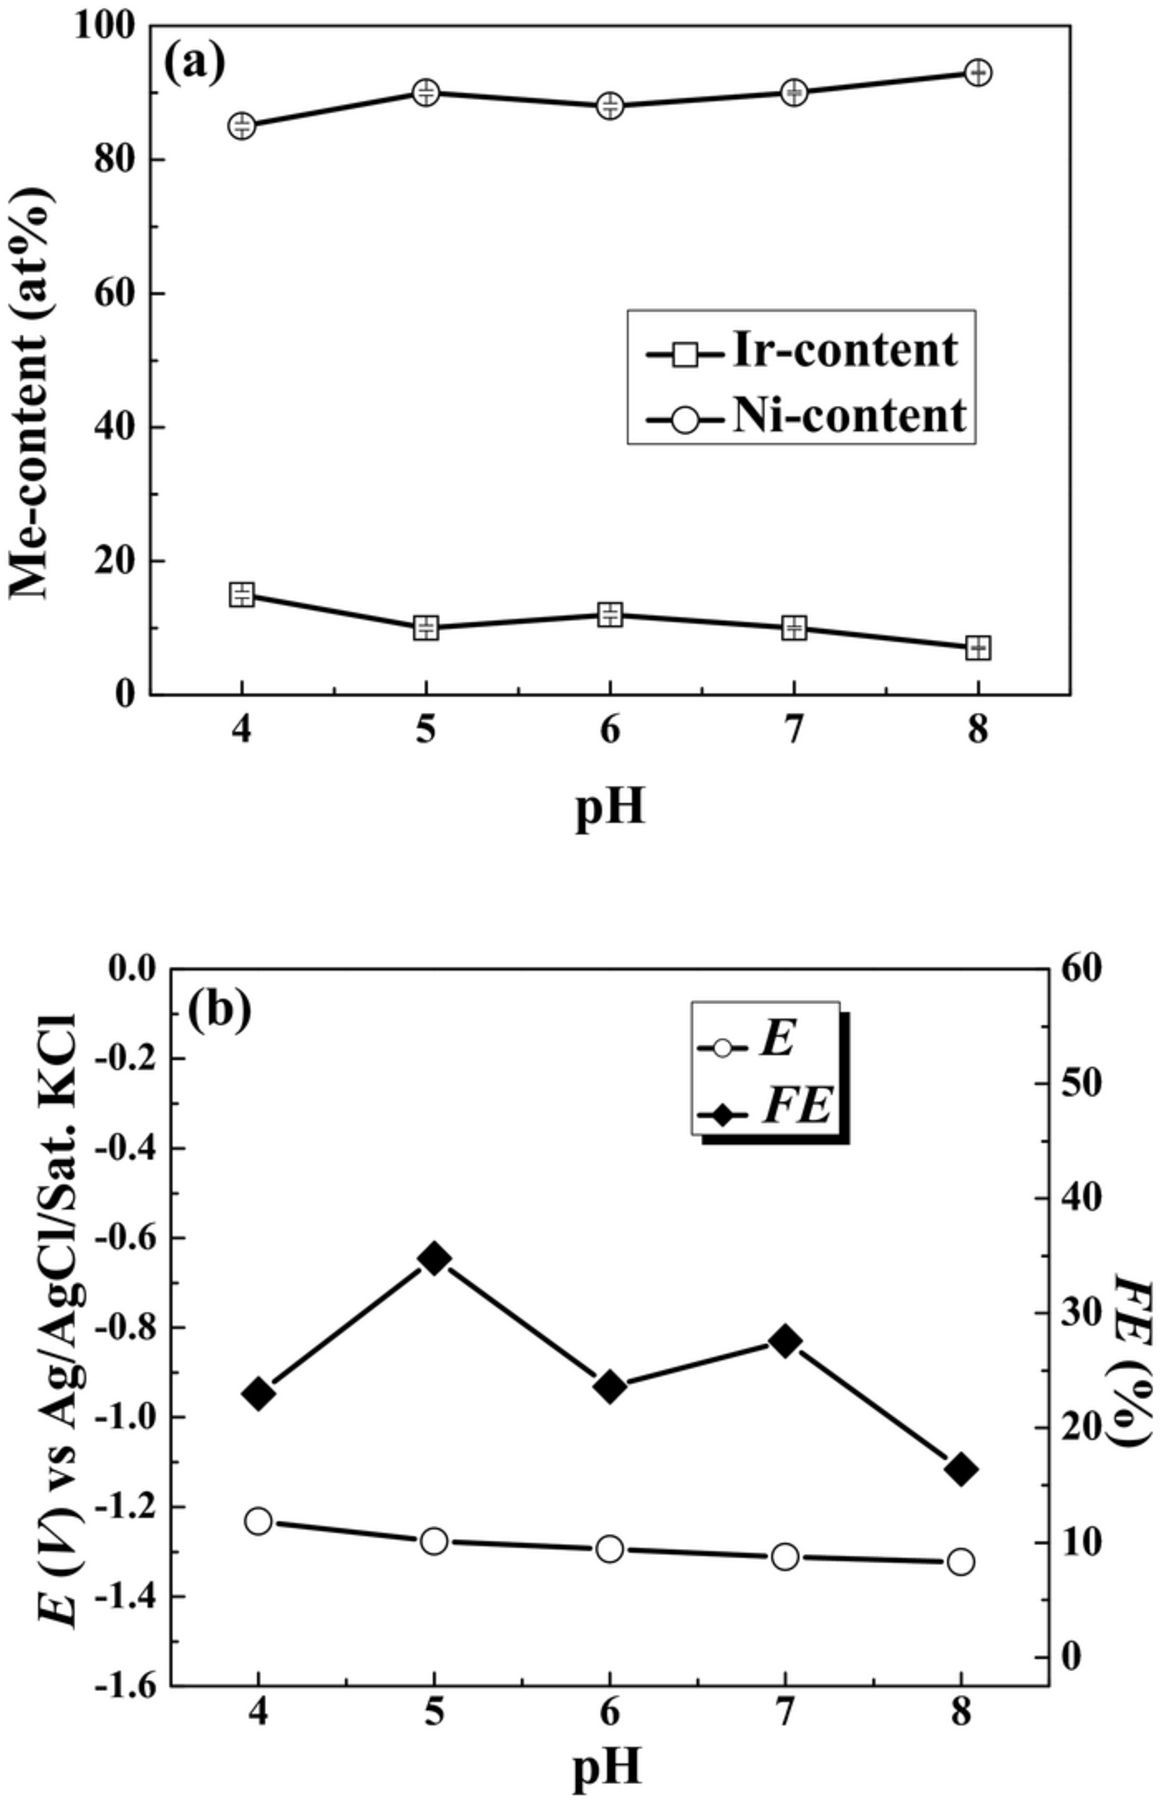
Figure 1. Plots of the Me-content in the deposit (a), the FE and the measured potential (b) as a function of bath pH. The plating temperature and applied current density were 70°C and 50 mA·cm−2, respectively.
The effect of bath temperature
The bath temperature was varied from 50 to 90°C, while keeping all other variables constant. The pH and current density were 5.0 and 50 mA·cm−2, respectively. The mass gain and film thickness increased with increasing temperature from 50 to 70°C, and then remained stable (Table II). The increase of temperature could result in the increase in the rates of both diffusion and charge transfer. However, there are different complexing ions in the solution, the equilibrium constant could be changed with an increase in the temperature. At T = 90°C, the vaporization of the electrolyte was accelerated, leading to the degeneration of the electrolyte. Figure 2 presents the plots of the Me-content in the deposits, the FE and the measured potential as a function of plating temperature. In Fig. 2a, the Ir-content had little change with increasing the temperature, except the minimal Ir-content of 6 at% at T = 80°C. However, the Ni-content was higher than Ir-content in the deposits, which is independent of the change of the temperature. As shown in Fig. 2b, the FE increased steadily with increasing temperature from 50 to 70°C, and then slightly decreased with increasing the temperature. The FE had a maximal value of 35% at T = 70°C. The difference between the measured cathodic potentials from 50 to 90°C is about – 0.26 V, indicating that the temperature has a large effect on the cathodic overpotential. A rise of bath temperature shifted deposition potential to less negative values, suggesting that the overpotential needed to start the electrodeposition process of the alloy is lower at higher temperatures, which is in accordance with the Nernst Equation.26 An increase in temperature enhanced the concentration of the reducible species in the diffusion layer as a result of increasing their diffusion rates. This behavior could be relative to the decrease in the overpotential of both hydrogen evolution and Ni-Ir deposition reaction. To sum up, the bath temperature 70°C seems to be the best choice for deposition of Ni-Ir alloys, since above it heavy evaporation take place.
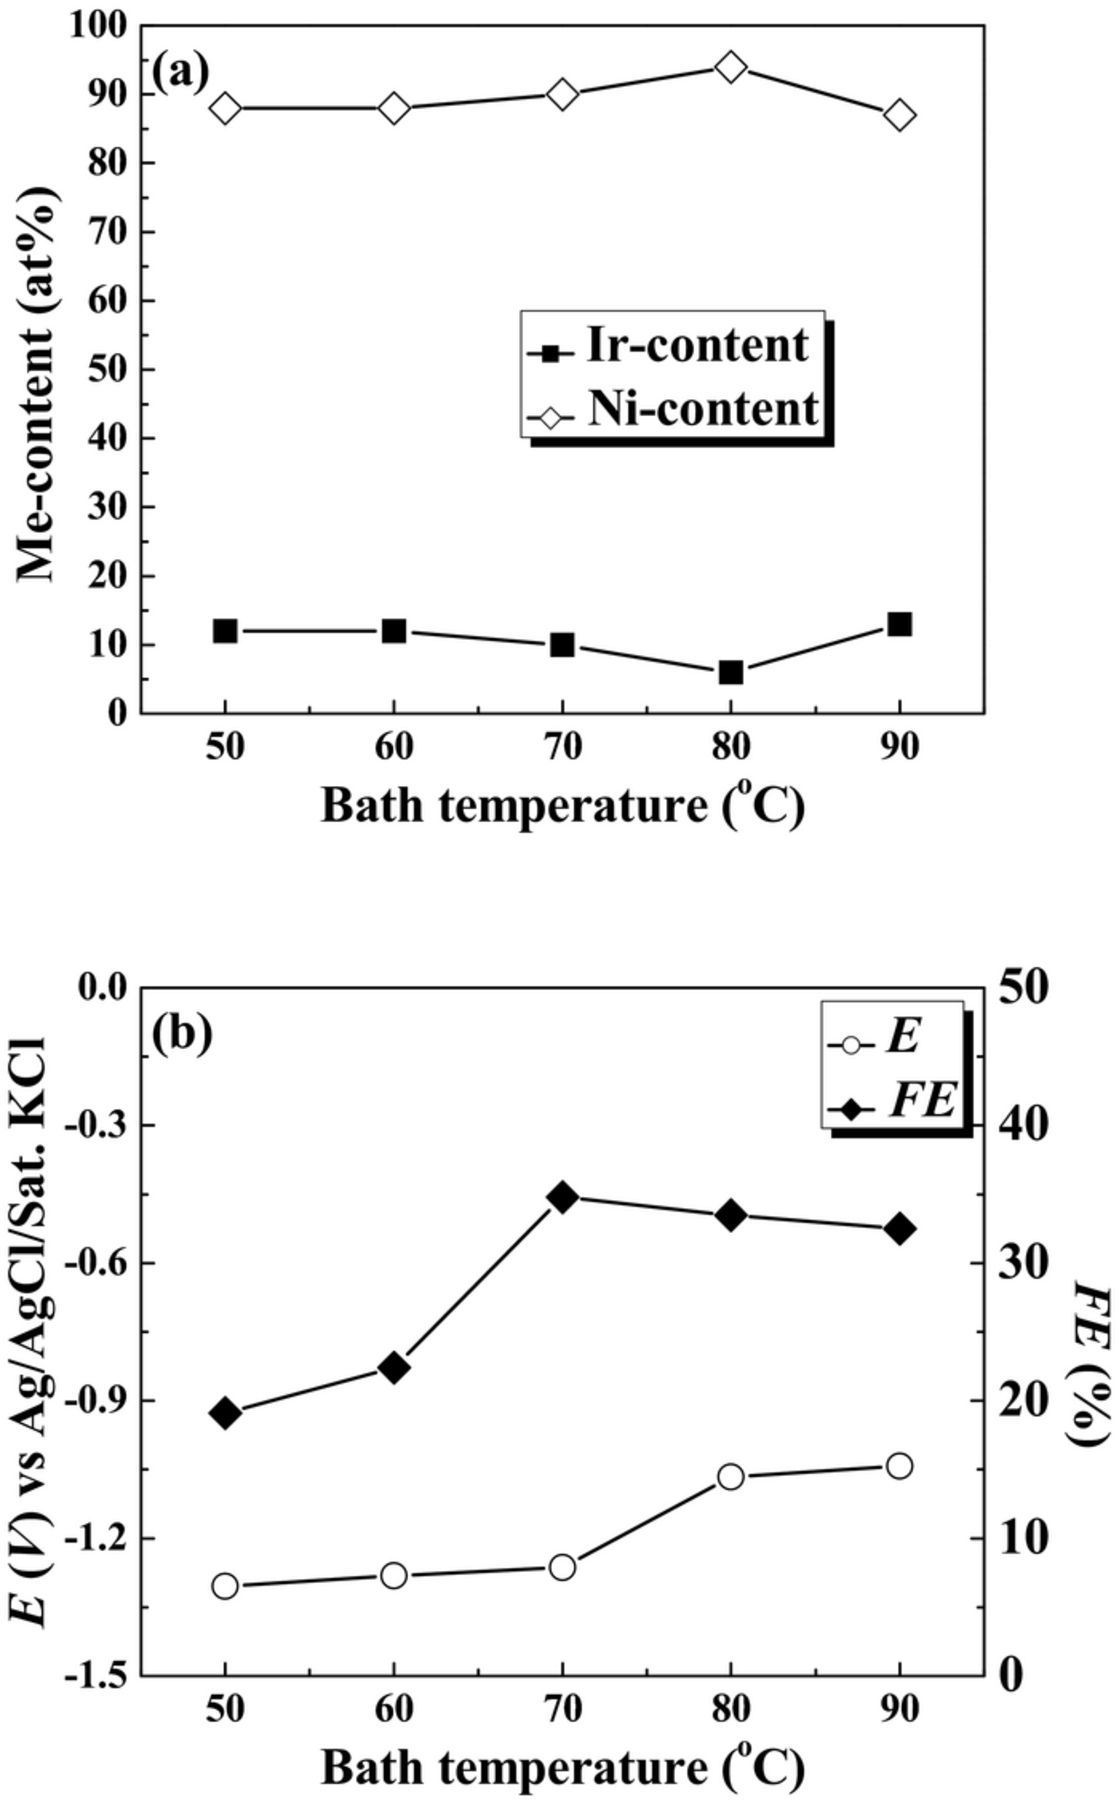
Figure 2. Plots of the Me-content in the deposit (a), the FE and the measured potential (b) as a function of plating temperature. The applied current density was 50 mA·cm−2.
The effect of current density
The current density was in the range of 30 – 80 mA·cm−2, while keeping all other variables constant. The optimal pH and temperature were 5.0 and 70°C, respectively. As shown in Table II, the mass gain and deposition rate increased with increasing current density from 30 to 60 mA·cm−2, and then decreased with increase in current density from 60 to 80 mA·cm−2. At j = 60 mA·cm−2, the mass gain and the rate of the film deposition were maximal, corresponding to 43.6 mg and 25.7 μm·h−1, respectively. Figure 3 inllustrates the plots of the Me-content in the deposit, the FE and the measured potential as a function of current density. In Fig. 3a, the Ir-content was minimal at j = 30 mA·cm−2. With the increase of current density, the Ir-content increased. The rich Ni-content in the alloys (up to 93 at%) was obtained, indicating that the deposition of Ni2+ ions was favored. In Fig. 3b, the FE steadily increased with increasing current density from 30 to 60 mA·cm−2, and then dramatically decreased with increase in current density from 60 to 80 mA·cm−2. At j = 60 mA·cm−2, the FE got a maximal value of 36%. In the present work, the optimized current density was 60 mA·cm−2 for the deposition of Ni–Ir films. An increase in current density enhanced the amount of hydrogen evolved during electrodeposition, resulting in a decrease in the FE for alloy deposition.24 On the other hand, Ir is much better catalysts for hydrogen evolution than Ni, so that increasing the proportion of Ir in the alloy would result in an increase in the hydrogen evolution rate and, consequently, a decrease of the FE. The existance of a maximal FE is in agreement with the diffusion control of the Ni deposition process from citrate electrolytes at high current density.32 The increase of current density beyond 60 mA·cm−2 caused intensively hydrogen evolution, while the deposition of Ni is limited by partial mass transport control.
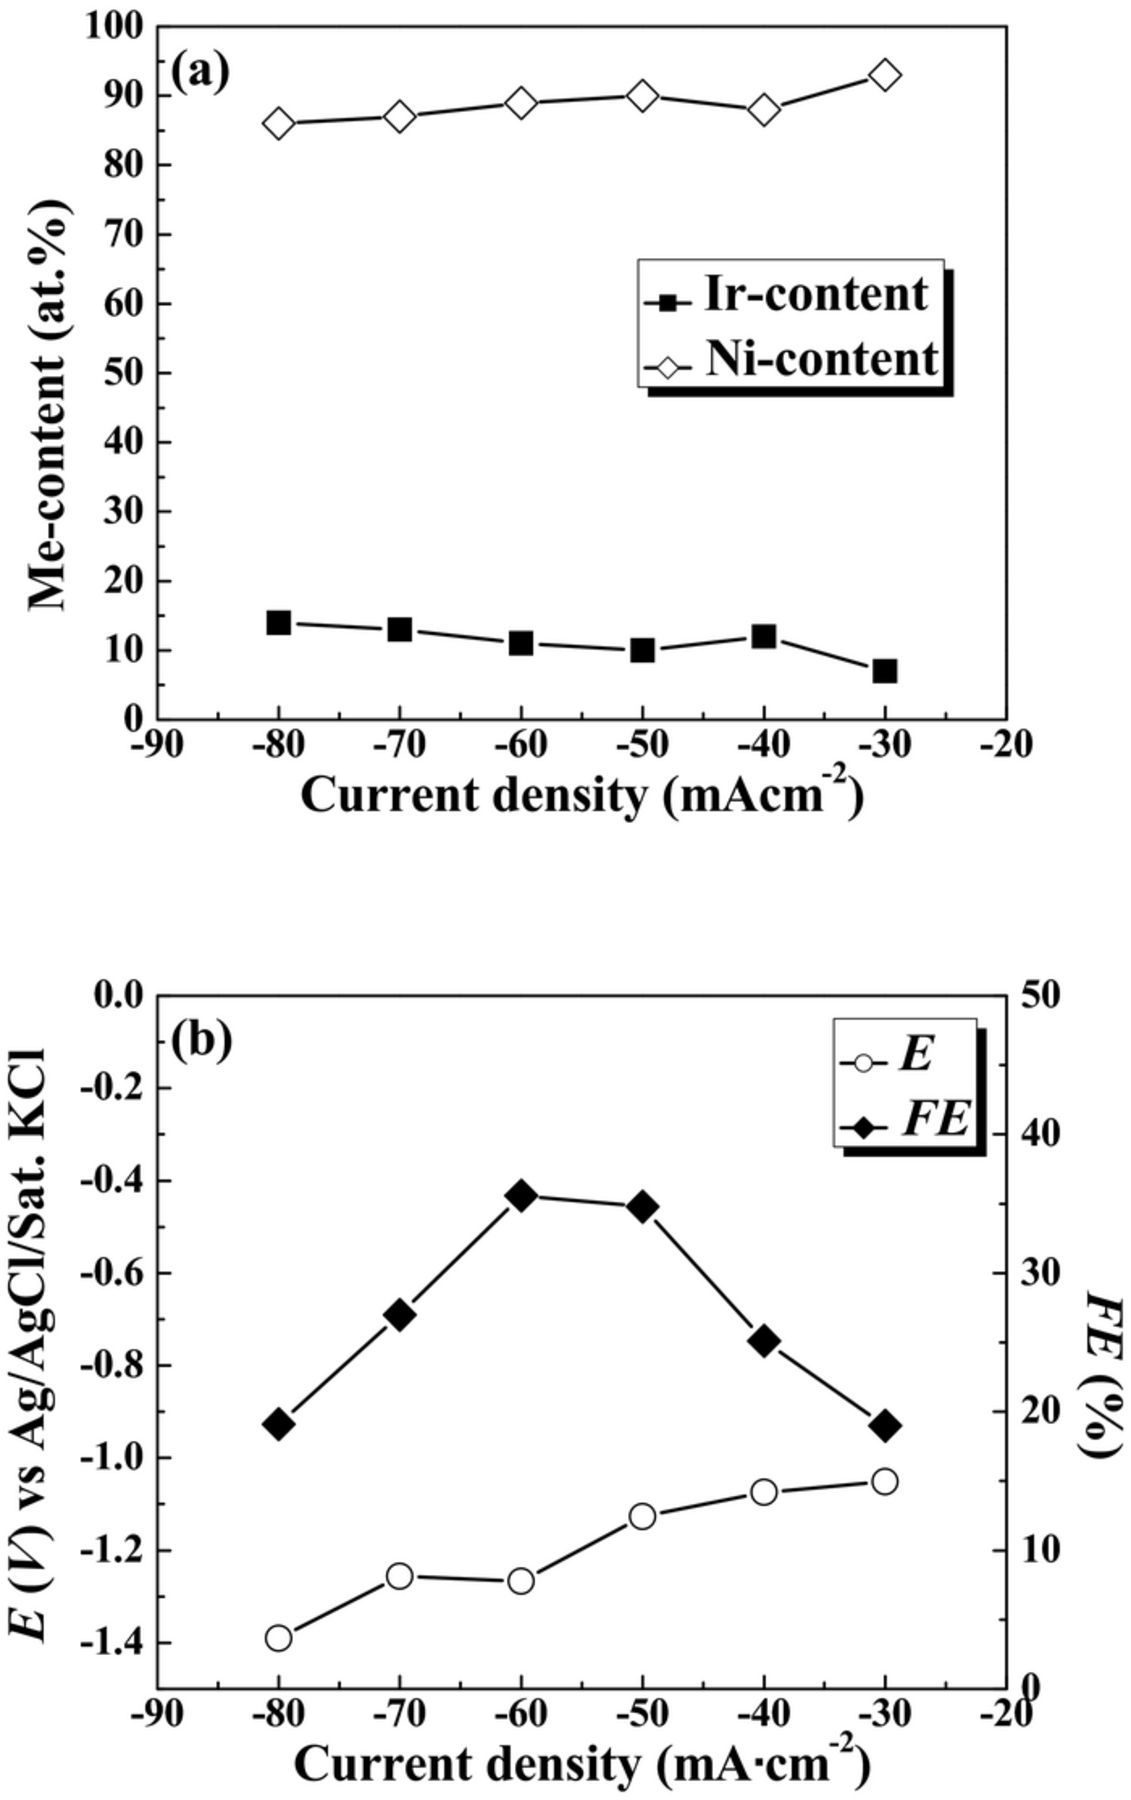
Figure 3. Plots of the Me-content in the deposit (a), the FE and the measured potential (b) as a function of applied current density.
The measured cathodic potential decreased from –1.051 to –1.390 V, resulting in an increase of 0.34 V, as the current density increased from 30 to 80 mA·cm−2. The measured cathodic potential shifted toward more negative cathodic potential with increasing current density. Figure 4 shows the evolution of the deposition potential during Ni-Ir alloy electrodeposition. A further increase in current density led to a notable shift of deposition potential toward low values. Ni-Ir alloys at 30, 40 60, 80 mA·cm−2 exhibited an average deposition potential −1.05, −1.07, −1.29 and −1.42 V vs. Ag/AgCl, respectively. Cohen-Sagiv et al.13 pointed out that increasing current density above 50 mA·cm−2 led to the increase of Ni-content in the Re-Ir-Ni alloys. However, the above data indicated that the increase in current density is beneficial for enhancing Ir-content in the Ni-Ir alloy. The increase of Ir-content could be explained by the fact that the current density is applied where Ni2+ ions are reduced under diffusion limiting current density. Thus, a further increase in current density could enhance the Ir deposition and hydrogen evolution Reaction.33
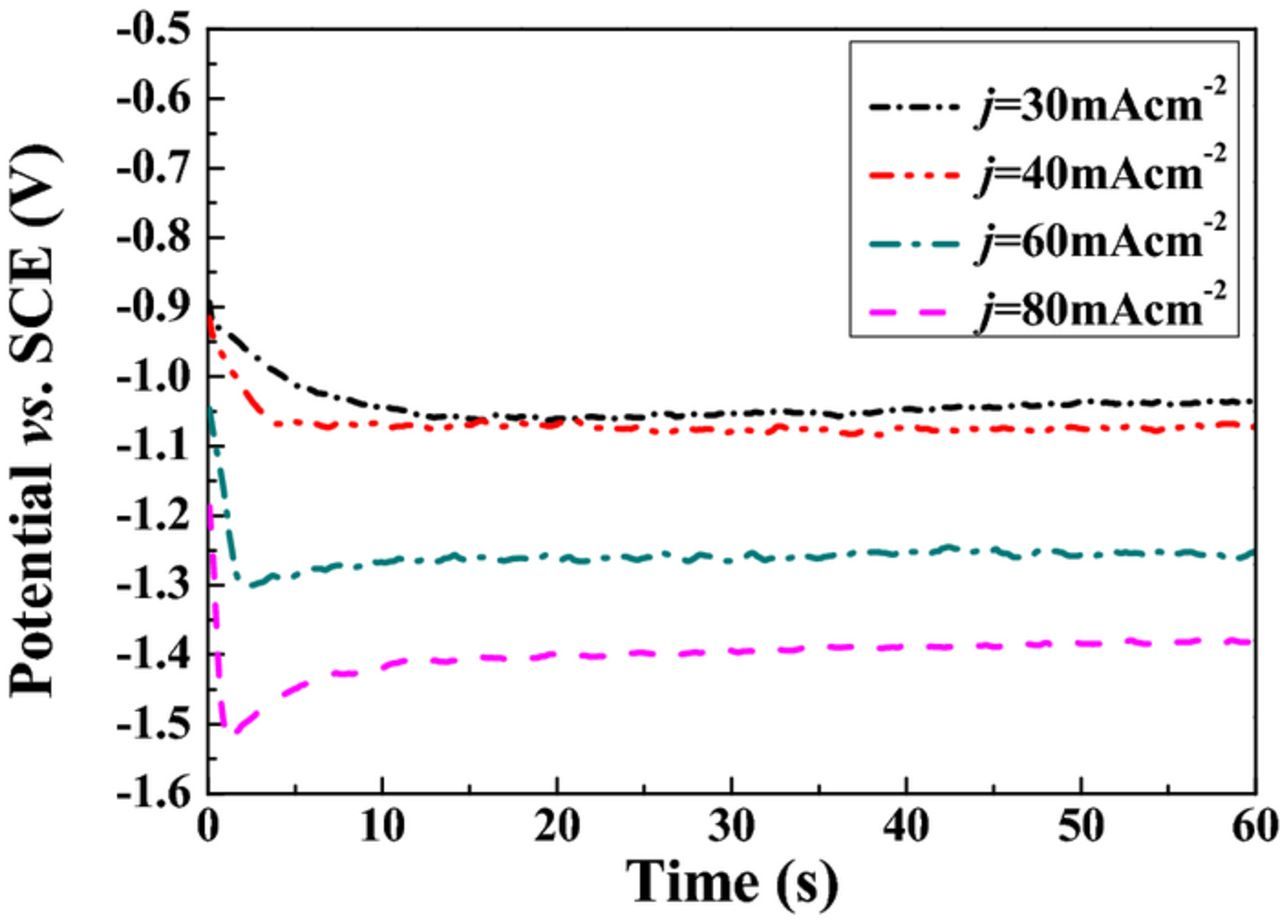
Figure 4. Potential-time transients for Ni-Ir alloy electrodeposition.
Morphology
Figure 5 shows the SEM images of the top surface of Ni-Ir films deposited at different electroplating conditions. The deposits appeared visibly bright and shiny. At low pH of 4.0, the surface was fully covered by the deposits (Fig. 5a). With the increase of pH, the surface was composed of cauliflower-shaped spherical aggregates (Fig. 5b). The silvery deposit was obtained, as visually observed. Some micropores were evident on the surface, but microcracks were not observed due to the abundant of Ni-content in the deposit. Ohsaka et al.5 studied that the surface-cracking size of electrodeposited Ir-Co alloys could be reduced with increasing Co-content in the deposits. The pH above 5.0 had little or no effect on the surface morphology of the film (Figs. 5c, 5d and 5e).
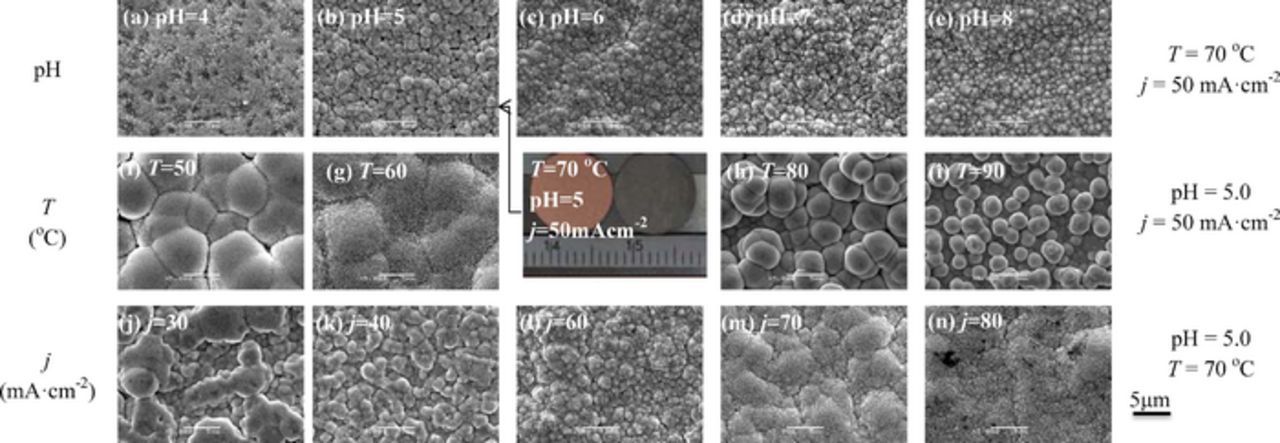
Figure 5. SEM images of the top surface of Ni-Ir films deposited at different electroplating conditions. The size bar is the same.
The temperature had a significant influence on the surface morphology of the alloys. At T = 50°C, many large aggregates and some microcracks were present (Fig. 5f). The intercolony boundaries and grooves were clearly visible. With the increase in the temperature, the aggregates were composed of small nanoparticles, and the intercolony boundaries became blurry (Fig. 5g). At T = 80°C (Fig. 5h), some large aggregates look like the cherry-shaped structure. The film consisted of agglomerated mesoscale colony and nodules with clear intercolony boundaries and surface grooves, which met and coalesced each other to form a compact layer. At T = 90°C (Fig. 5i), the top surface was composed of some long nodulars. However, the deposit under the nodulars were dense. The appearance of these islands indicated a Volmer-Weber growth mode.34,35 This growth mode was preferred, regardless of the crystallographic misfit between the film and the substrate. The formation of nodules might be the outcome of nucleation extending laterally from an existing structural defect and sweeping deposit substances ahead of the growth front of the films.
Furthermore, the surface morphology of the alloys was evolved from rough into smooth with increase in current density. At j = 30 mA·cm−2, the surface was rough. The large aggregates and microcracks were observed (Fig. 5j). As the applied current density increased, the surface morphology was evolved into relatively small aggregates, which were composed of many nanoparticles (Fig. 5k). At j = 60 mA·cm−2, the surface became relatively dense, and consisted of many small aggregates (Fig. 5l). At j = 70 mA·cm−2, the surface became smooth and some fine cracks were present (Fig. 5m). At j = 80 mA·cm−2, a low density of micro-crack was observed on the smooth surface (Fig. 5n). The difference in the surface morphologies arises, because low current density allows only a few crystals to nucleate, and long deposition time allows the grain growth leading to their impingement.36 Hence, the large aggregates were present at j = 30 mA·cm−2. As the current density increased, the gain size became small and the number of nucleation increased.
The proposed mechanism of Ni-Ir electrodeposition
In this work, the ratio of Cit3−/Ni2+ concentration is 0.78, free nickel ions are the predominant specie. Here citrate is abbreviated to Cit. Both at pH = 5.0 and 8.0, the rate of Ni deposition decrease in the order of Ni2+ > NiCit > NiCit2.37 Thus, the ratio between the concentrations of citric acid and Ni2+ in solution is an important factor, controlling the deposition rate, the FE and the composition of the alloy. Naor et al.38 calculated that the relative abundance of citrate-containing species as a function of pH for 343 mM analytical concentration of citric acid at the temperature of 70°C. At pH = 4.0, there are four anions H2Cit−, HCit2−, H3Cit and Cit3−, corresponding to the concentrations of 58%, 35%, 5% and 2%, respectively. When the pH was increased to 5.0, the three anions of H2Cit−, HCit2− and Cit3− exist at significant concentrations of 11.6%, 67.7% and 20.7% respectively. With increase in pH, the concentration of Cit3− increased significantly. The content of Cit3− ion is ∼98% at pH = 8.0. The equilibrium constants of nickel-citrate complexes were logk1 = 5.72, logk2 = 3.362, logk3 = 1.748 provided for [NiCit]−, NiHCit and [NiH2Cit]+, respectively.39 Because the concentration of the citrate ion is lower than that of Ni2+ ion, there will be significant amounts of free Ni2+ present in the solution at all values of pH. Thus, the [NiCit]− is the predominant complex species in the solution at high pH, which could inhibit the parallel paths for deposition of Ni. According to the above data, the concentration of Cit3− in the solution increased significantly with increasing pH. Therefore, the deposition rate and the FE of Ni-Ir alloy decreased with increase in pH. The following electroreduction reactions are possible, therefore with hydrogen evolution from an independent side reaction at high pH value:
![Equation ([2])](https://content.cld.iop.org/journals/1945-7111/164/14/D985/revision1/d0002.gif)
![Equation ([3])](https://content.cld.iop.org/journals/1945-7111/164/14/D985/revision1/d0003.gif)
However, the reduction of Ni2+ ions and hydrogen evolution reaction at pH 5.0 occurred according to the following Reactions.37
![Equation ([4])](https://content.cld.iop.org/journals/1945-7111/164/14/D985/revision1/d0004.gif)
![Equation ([5])](https://content.cld.iop.org/journals/1945-7111/164/14/D985/revision1/d0005.gif)
![Equation ([6])](https://content.cld.iop.org/journals/1945-7111/164/14/D985/revision1/d0006.gif)
![Equation ([7])](https://content.cld.iop.org/journals/1945-7111/164/14/D985/revision1/d0007.gif)
The formation constant of the [Ni(Cit)2]4− complex cannot sustain the high concentration of the [Ni(H2O)3Cit]− complex.37 Therefore, following reaction Eqs. 4 and 7, the [Ni(Cit)2]4- complex dissociates releasing free Ni2+ ions, which promptly reduces to metallic Ni. The hydrogen evolution reaction causes the interfacial pH to increase, the Ni-citrate complexes start to dissociate releasing free Ni2+ ions. So, the reduction of Ni is always confluent with hydrogen evolution reaction.21 In an acid chloride solution, the reduction of [IrCl6]3− ion takes place in parallel with Reactions 2–7,
![Equation ([8])](https://content.cld.iop.org/journals/1945-7111/164/14/D985/revision1/d0008.gif)
However, in an alkaline solution, the Ir3+/hydroxyl species play the role in the electrodeposition process. Karthik et al.40 suggested that the complex [Ir(OH)6]2− was present in a dilute solution of 10 mM IrCl3·3H2O at pH = 13, which was attributed to the presence of Ir4+–O–Ir4+ linkages. Cusanelli et al.41 studied on complexation reactions and water exchange, and found that hexa-aqua Ir complex [Ir(H2O)6]3+ had a high degree of inertness toward ligand substitution. Its hydrolysis in water was a kinetically important process due to the production of a significant amount of the conjugate base [Ir(H2O)5(OH)]2+, which could lead to an alternative pathway for water exchange. It was indicated that [Ir(H2O)5(OH)]2+ species was much more reactive and had more dissociative character than the hexa-aqua ion. The reduction of Ir was obtained through the following reaction, simultaneously the hydrogen evolution reaction also occurred.
![Equation ([9])](https://content.cld.iop.org/journals/1945-7111/164/14/D985/revision1/d0009.gif)
![Equation ([10])](https://content.cld.iop.org/journals/1945-7111/164/14/D985/revision1/d0010.gif)
The formation of metallic Ir immediately increases the rate of the hydrogen evolution reaction. Furthermore, the FE and deposition rate for pH 4.0 was less than these for pH 5.0. This reason is that the hydrogen evolution reaction occured significantly at low pH. Li et al.39 pointed out that a decrease in pH increased the concentration of the uncompleted Ni2+ ions in the bath and allowed decreasing in the overpotential of the simultaneous hydrogen evolution reaction. At the same time, the release of hydrogen could result in the reduction of Ir3+ ions. Therefore, Ir-content in the deposit for pH 4.0 was higher than that for pH 5.0.
The dependence of composition of Ni-Ir alloys on mole concentration ratio of [Ni2+]/([Ir3+]+[Ni2+]) in the electrolyte is show in Figure 6. In one bath chemistry of 115 mM Ni2+, 35 mM Ir3+ and 90 mM Cit−, the mole concentration ratio of [Ni2+]/([Ir3+]+[Ni2+]) in the electrolyte is about 0.77. The electrodeposition of Ni-Ir alloy was performed with changing deposition conditions. The chemical composition of the alloys was almost independent of the deposition conditions. However, the Ni-content in the deposit is always higher than that in this electrolyte. It could be inferred that the deposition of Ni2+ was favored during electrodeposition. In this work, the Ni content enriched in the deposits, indicating that the deposition of Ni2+ was favored. Therefore, it could be concluded that the co-deposition of Ni-Ir alloy is a normal deposition. This result was good in agreement with our recent work.9
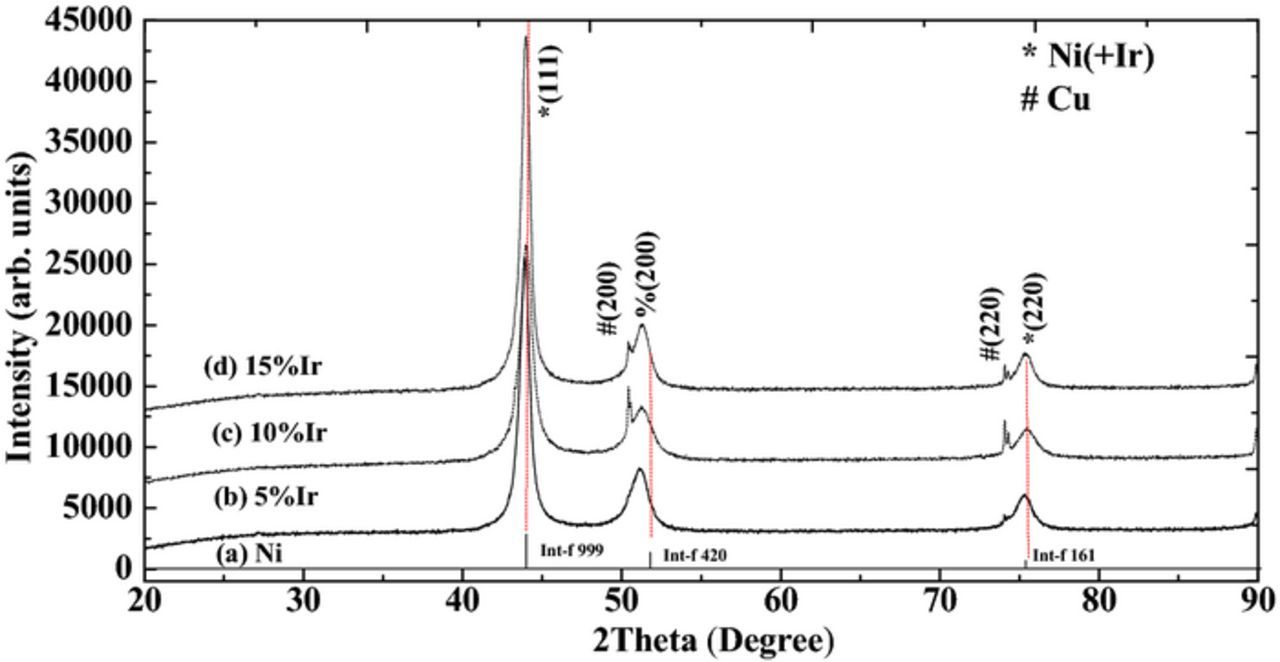
Figure 6. Dependence of composition of Ni-Ir films on mole concentration ratios of [Ni2+]/([Ir3+]+[Ni2+]) in the electrolyte.
Crystallographic structure
The crystallographic structures of Ni-Ir alloys with 5 at%, 10 at% and 15 at% Ir-content are shown in Figure 7. The diffraction peaks from Cu substrate are apparent (JCPDS file #04-0836), thus indicating a thin deposit. The (111), (200) and (220) three reflections from Ni-Ir deposits were present. These diffraction peaks appear to shift toward low 2-theta values, according to the reflections of pure Ni (JCPDS file #87-0712), which was due to the incorporation of Ir into the deposit. Ni and Ir have identical crystal structure and the close atomic radius (Ni = 0.125 nm and Ir = 0.136 nm), which is approximate to 8.8% misfit. Therefore, it is feasible to systhesize solid solution of Ni-Ir micro-strain alloys by electrodeposition. As per Vegard's law,36 with increasing Ir-content in the deposit, the lattice parameter reaches from that of pure Ir (3.839 Å) toward that of Ni (3.523 Å), indicating the formation of Ni-Ir solid solution. The Ni-Ir alloy was composed of nanocrystalline phase. To further estimate the average grain size (d) for the deposits using the following Debye-Scherrer Equation :11
![Equation ([11])](https://content.cld.iop.org/journals/1945-7111/164/14/D985/revision1/d0011.gif)
where K is a constant, λ is the wavelength, β is the full width at half maximum (FWHM) of the (111) diffraction peak of the deposit and θ is the incident angle of the X-ray beam. The average crystal size of the deposits was about 12 nm, respectively. To obtain a more accurate assessment of the grain size, further work would need to be done using a transmission electron microscopy.
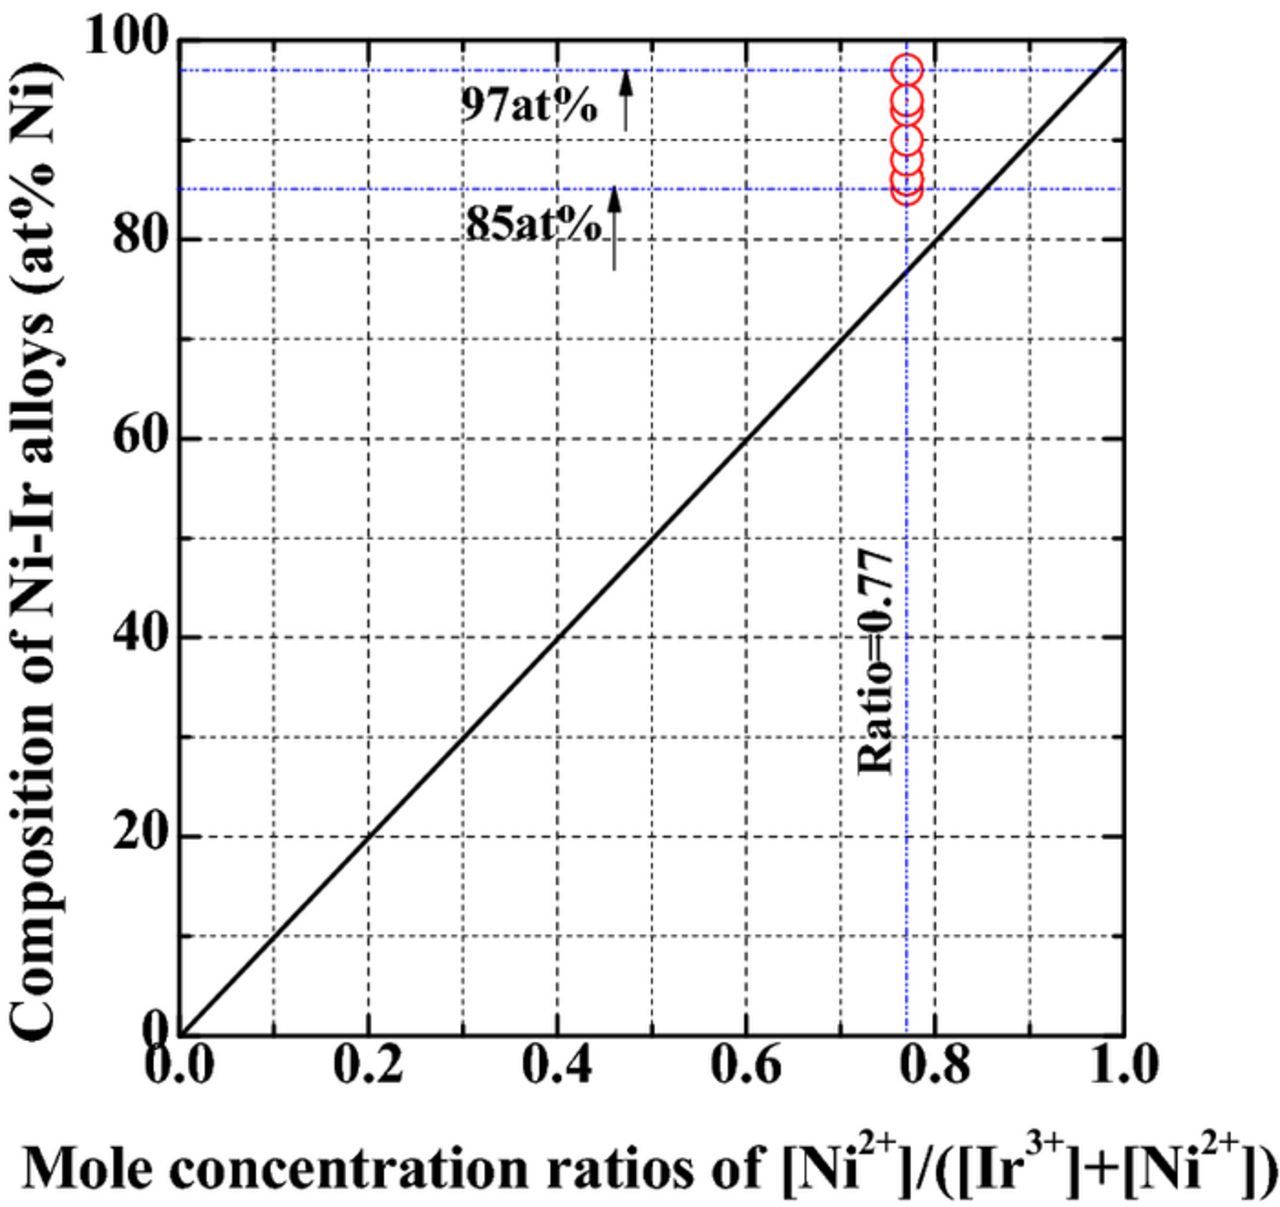
Figure 7. Crystallographic structures of Ni-Ir films with 5 at%, 10 at% and 15 at% Ir-content.
Electrochemical behavior
The cyclic voltammograms measured in citrate aqueous solutions containing either or both Ir and Ni salts are shown in Figure 8. In Fig. 8, the curves show that these deposition processes for Ni, Ir and Ni–Ir deposits were irreversible, which were controlled by thermodynamic driving forces due to the complex formation, such as Ni-citrate or Ir-sulfamate.42 The electrodepositions have mostly been carried out around −1 V. Furthermore, the Ni is deposited with Ir in the citrate electrolyte at more negative potential in the presence of Ir3+ ion than that of the deposition of only Ni in the –1 V region. The both of nickel reduction features are enhanced in the presence of iridium in the –0.2 V region, with Ir addition causing increased currents at the same potentials. The deposition of Ir and Ni appears at the potential of –0.125 V and –0.10 V vs. Ag/AgCl, respectively. However, the co-deposition of Ni and Ir appears at –0.225 V vs. Ag/AgCl, which is more negative than that of the deposition of Ni alone in the solution without Ir salt. The standard electrode potential of Ni2+/Ni system is negative, –0.25V. Citric acid as a complexant could form complex ions with Ni2+ in the solution, resulting in the increase in the reduction potential. The potential shift was initially explained by the decrease in the activity of the Ni2+ ions due to the formation of Ni-citrate complex species. There is a cathodic shoulder on Ni CV at –0.8 V. The current wave for Ni2+ reduction was not distinguishable because it was convoluted with the current due to hydrogen evolution. The potential at which the hydrogen evolution reaction occured was significantly shifted anodically indicating that Ni2+ ions catalyzed the proton reduction.37 The Ni2+ ions increased the citric acid buffer capacity by making the alcoholic proton of the organic molecules acidic and generating additional acidic protons from the water molecules directly coordinated to Ni2+ ions. The reduction of Ni2+ ion depends on the reduction of protons rather than controlled by activity of Ni2+ in solution through the Nernst equation.

Figure 8. Cyclic voltammograms of Cu electrode in the bath containing 115 mM Ni2+ or/and 35 mM Ir3+ and 90 mM Cit−. The electrolyte pH and temperature were 5.0 and 70°C, respectively. Black (solid) line: 115 mM Ni2+ and 90 mM citric acid; red (dash) line: 35mM Ir3+ and 90mM citric acid solution; blue (dash dot) line: 115 mM Ni2+, 35 mM Ir3+ and 90 mM citric acid. The scanning rate was 10 mV·s−1.
Figure 9 shows current transient for initial stage of Ni–Ir electrodeposition on Cu at cathodic potentials range between –0.2 and –0.35 V vs. Ag/AgCl. It can be observed that the transient could be divided into three regions.33 Region I: an initial decrease in current density relates to the charging of the double layer. Region II: an increase in current density until a maximum current value jmax reached at a time tmax, which is due either to the growth of a new phase or to an increase of the number of nuclei. Region III: a plateau of current density, which is a diffusion–controlled process. As the deposition potential was shifted to be more negative, jmax increased, denoting the increase in the nucleation and growth rate. Scharifker and Hills43 developed a theoretical model to analyze the current-time transient result of chronoamperometric experiment. According to this model, there are two limiting nucleation mechanisms: the instantaneous and the progressive. Instantaneous nucleation corresponds to a slow growth of nuclei on a small number of active sites. The number of nuclei would be constant during the deposition process and all nuclei have similar age and size. However, progressive nucleation corresponds to fast growth of nuclei on many active sites. The number of nuclei increases during electrodeposition process. The experimental chronoamperometric data, shown in Fig. 9, are normalized to a non-dimensional plot (j/jmax)2 vs. t/tmax and compared with the theoretical plots derived for instantaneous and progressive three-dimensional (3D) nucleation and growth models.43 The following equations are given for instantaneous 10 and progressive nucleation 13:
![Equation ([12])](https://content.cld.iop.org/journals/1945-7111/164/14/D985/revision1/d0012.gif)
![Equation ([13])](https://content.cld.iop.org/journals/1945-7111/164/14/D985/revision1/d0013.gif)

Figure 9. Current transient for initial stage of Ni-Ir electrodeposition on Cu at cathodic potentials range between −0.2 and −0.39 V vs. Ag/AgCl.
Non-dimensional plots (j/jmax)2 vs (t/tmax) of the chronoamperometric curves for Ni-Ir alloys are presented in Figure 10. Fig. 10 shows the nucleation mechanism of Ni-Ir alloy deposition. An increase in potential deposition until E = –0.35V induces a deviation in the 3D nucleation mechanism. The two curves recorded at potentials of –0.25 and –3.0 V are consistent with the model of diffusion-controlled 3D nucleation. However, the rising parts of the transients (1 > t/tmax > 0) are located near to the progressive nucleation. As soon as the potential turns to –2.5 and –3.0V values, the nucleation process confirms well the progressive nucleation process at 2.3 > t/tmax > 1. But at the time of t > 2.3tmax, the experimental (j/jmax)2 is much larger than that calculated from the theoretical model. Two facts can explain this behavior: hydrogen reduction, and Ir incorporated in Ni-Ir deposits.33,44 Therefore, the applied potential shifted to more negative values could influence the nucleation process.
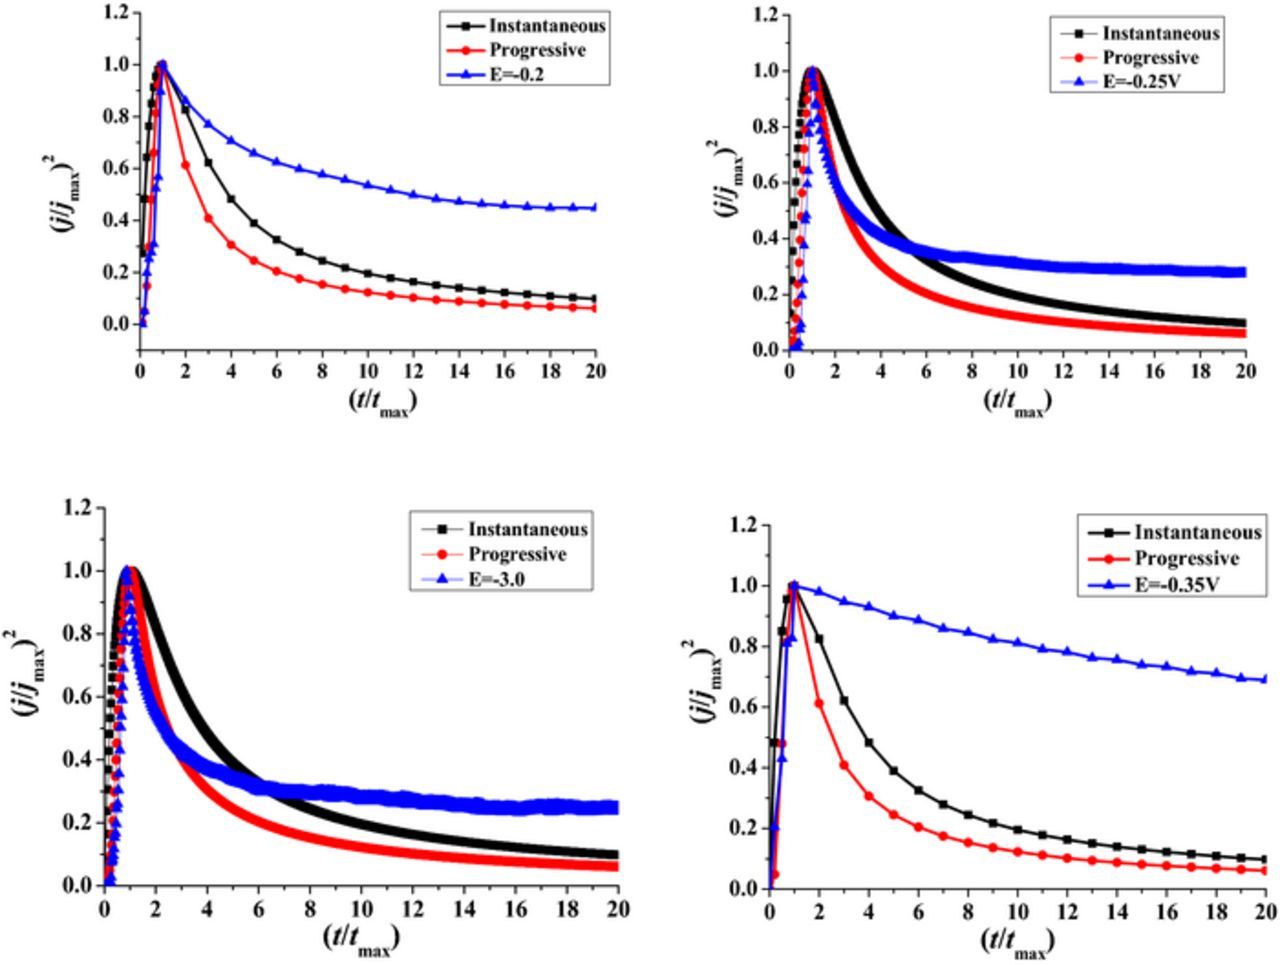
Figure 10. Non-dimensional plots (j/jmax)2 vs (t/tmax) of the chronoamperometric curves for Ni-Ir alloys deposited from citrate aqueous solutions.
Conclusions
Ni-Ir alloys were electroplated from citrate aqueous solutions containing 35 mM iridium(III) chloride hydrate, 115 mM nickel(II) sulfamate tetrahydrate and 90 mM citric acid. The effects of pH, temperature and current density on the faradaic efficiency (FE), chemical composition, deposition potential, surface morphology and crystallographic structure of the alloy films were determined. Ni–Ir alloys as thick as 25.7 μm with Ir-content as high as 15 at% and the FE as high as 36% were obtained. By adjusting deposition variables, the pH, temperature and current density were optimized, corresponding to 5.0, 70°C and 60 mA·cm−2, respectively.
As the deposition parameters were changed, the chemical composition of the alloys was almost independent of the deposition conditions. The Ni content enriched in the deposits, indicating that the deposition of Ni2+ was favored. The co-deposition of Ni-Ir alloy was a normal deposition. The FE and deposition rate increased with increasing pH from 2.0 to 5.0, and then steadily decreased with the increase of pH. With increasing temperature, the FE and deposition rate increased, and then remained nearly constant. The FE and deposition rate increased with increasing current density from 30 to 60 mA·cm−2, and then decreased with the increase of current density from 60 to 80 mA·cm−2.
The Ni-Ir alloys consisted of nanocrystalline phase. The deposition parameters had a significant effect on the top surface morphology of the films, as shown in Fig. 5. With increasing pH, the film became dense and the surface morphology had little change at high pH. Some large aggregates with visible intercolony boundaries and some cracks were present at low temperature. Large nodulars were formed at high temperature. Furthermore, the current density and applied potential has an influence the grain growth and nucleation. The transient nucleation at the potentials of –0.25 and –3.0 V confirmed the model of diffusion-controlled 3D nucleation.
Acknowledgments
This work has been supported by the Natural Science Foundation of Jiangsu Province (grant Number: BK20150260). The authors thank Guang Yang from Testing &Analysis Center, Dr. Jianjun Xue from Nanjing Institute of Technology for their help in XRD and SEM/EDS characterizations, respectively, and Yaliang Yu for his help in the preparation of copper samples.