Abstract
The initiation site and morphology during the early stage of pitting on AISI 1045 carbon steel that has a microstructure of primary ferrite and pearlite were investigated in boric-borate buffer solutions with and without NaCl at pH 8.0. The pits initiated by micro-scale polarization were in the pearlite only and not in primary ferrite. In situ real-time observations during the micro-scale polarization of pearlite in a boric-borate buffer solution with 100 mM NaCl indicated that the pits were polygonal or rod-like in shape. In addition, it was found that the pit growth direction was the same as that of the pearlite lamellae that consisted of ferrite and cementite. Field-emission electron probe micro analysis detected segregated points of sulfur in the ferrite lamellae. On the basis of their etching behavior in 3% nital, the corrosion resistance of the cementite was estimated to be higher than that of the ferrite lamellar structure. Thus, pits readily initiated in the ferrite lamellae and proceeded along the ferrite lamellae.
Export citation and abstract BibTeX RIS

This is an open access article distributed under the terms of the Creative Commons Attribution 4.0 License (CC BY, http://creativecommons.org/licenses/by/4.0/), which permits unrestricted reuse of the work in any medium, provided the original work is properly cited.
Ferrite-pearlite steel is widely used in the production of bars, plates, steel wires, etc.1–3 because of its high strength, ductility, toughness, wear resistance, and low cost.3–5 Pearlite has a lamellar structure that consists of ferrite and cementite (Fe3C) phases. A fine pearlite structure improves the mechanical properties of steels in terms of strength and ductility.6–8 While ferrite-pearlite steels exhibit excellent mechanical properties, their pitting corrosion resistance is relatively low. It is widely believed that the boundaries between the different phases act as initiation sites for localized corrosion in chloride environments.9,10 When ferrite-pearlite steel that does not undergo any surface treatment is exposed to chloride environments, the steel readily suffers from pitting corrosion. Although the steel is successfully protected from corrosion by coating and/or painting, to prolong their service life and improve their reliability, it is necessary to elucidate the initiation mechanism of pitting on ferrite-pearlite steel.
The pitting corrosion process involves two stages: initiation and propagation.11 In chloride environments, pitting is initiated by a breakdown of the passive film on steel during a local active dissolution process that exposes the bare steel surface to the environment. This film-free dissolution involves the hydrolysis reaction of metal cations and results in acidification. Chloride ions migrate into the pit to maintain electrical neutrality, and the simultaneous accumulation of chloride ions combined with the high level of acidification accelerates the active dissolution inside the pit. There have been many reports about the propagation stage of pitting corrosion in ferrite-pearlite steels. A comparison of the active dissolution rates and the electrochemical properties of ferrite and cementite have been widely discussed. It is commonly believed that cementite has a lower dissolution rate than ferrite. Yumoto et al. synthesized stoichiometric Fe3C films with Fe:C = 75:25 (at.%) and demonstrated that the dissolution rate of the cementite was one-half of that of metallic iron (ferrite) in 1 mass% NaCl.12 Despite the lower dissolution rate of cementite, cementite seems to act as the cathodic site, and this accelerates the anodic dissolution of ferrite.13–20 Staicopolus clarified that hydrogen over-voltage on cementite is relatively low, and the cathodic reaction on cementite accelerates the anodic dissolution of ferrite.14 Hao et al. revealed that ferrite dissolves more rapidly than cementite in chloride solutions, and the dissolution rate of ferrite increased with the amount of cementite at the open circuit potential (OCP) in NaCl solutions. Thus, the galvanic reaction between ferrite and cementite is an important factor when discussing the corrosion rate of the pearlite structure.20 Although there have been many reports on the propagation stage of pitting corrosion on ferrite-pearlite steels, the initiation mechanism of pitting corrosion is not yet understood. In particular, it is not clear where the pit initiation sites are located. Clarifying details of the pit initiation sites and the mechanism of pitting corrosion for carbon steels may contribute to the development of corrosion-resistant steels with low contents of alloying elements.
Micro-electrochemical measurements are promising techniques for investigating the initiation process of pitting. Suter et al. developed a capillary-based micro-electrochemical measurement system and investigated the electrochemical behavior of a small area that contained only a single MnS inclusion in stainless steels.21,22 The development of this technique led to advances in the past twenty years regarding the understanding of pitting corrosion at non-metallic inclusions in stainless steels.23–28 Chiba et al. developed a micro-electrochemical system for in situ high-resolution optical microscopy, which can be used for the morphological analysis of pitting during the very beginning of the initiation process.29–31 In this study, we used this technique to investigate the initiation site of pitting of AISI 1045 ferrite-pearlite steel.
The objective of this study was to investigate the relationship between the microstructural characteristics of the ferrite-pearlite steel and the initiation site of pitting. For AISI 1045 steel (0.47% carbon), a ferrite-pearlite structure was obtained via slow cooling from the austenitic temperature. Micro-scale polarization measurements of a small area that contained only the ferrite (primary ferrite) or the pearlite were performed in boric-borate buffer solutions (pH 8.0) with and without NaCl. In situ real-time observations of the initiation and the very early stage of the pitting process were performed during potentiodynamic anodic polarization. A FE-EPMA (field-emission electron probe micro analyzer) was employed to characterize the microstructure of the steel and to determine the distribution of alloy elements. Finally, the initiation mechanism of the pitting is discussed.
Experimental
Specimens
The specimens used in this study were machined from a commercial AISI 1045 carbon steel bar (20 mm in diameter). Table I shows the chemical composition of the steel. The steel was cut into approximately 20 mm × 15 mm × 5 mm coupons. To obtain the typical primary ferrite and pearlite stricture of AISI 1045 steel, all of the specimens were heat-treated at 1523 K for 1.8 ks. Then, they were furnace-cooled to room temperature. After heat-treatment, the specimen surfaces were mechanically ground using SiC paper through 1500 grit and were finished by polishing with a 1 μm diamond paste. The specimens were then degreased with ethanol.
Table I. Chemical composition of the specimen (mass%).
| C | Si | Mn | P | S | Ni | Cr |
|---|---|---|---|---|---|---|
| 0.47 | 0.19 | 0.85 | 0.015 | 0.015 | 0.02 | 0.18 |
| Mo | Cu | Ti | Nb | Al | N | O |
| 0.01 | 0.01 | <0.001 | <0.002 | 0.024 | 0.005 | 0.002 |
Electrolytes
Electrochemical measurements were performed in boric-borate buffer solutions with and without NaCl (pH 8.0). The buffer solution was made by mixing 0.35 M H3BO3 and 0.075 M Na2B4O7. For the buffer solutions that contained NaCl, NaCl-added 0.35 M H3BO3 and NaCl-added 0.075 M Na2B4O7 solutions were used for mixing. The NaCl concentrations were 1, 10, and 100 mM. All of the solutions were prepared from deionized water and analytical grade chemicals.
Macro-scale polarization measurements
Macro-scale anodic polarization curves were created for samples in the boric-borate buffer solutions with and without NaCl (pH 8.0) under deaerated conditions at 298 K. With the exception of the electrode area (approximately 10 mm × 10 mm), the specimen surfaces were coated with an epoxy resin and subsequently with paraffin. Measurements were performed in a conventional three-electrode cell; the counter electrode was a Pt plate, and the reference electrode was Ag/AgCl (3.33 M KCl solution). All potentials cited in this paper are expressed in terms of the Ag/AgCl (3.33 M KCl) electrode (0.206 V vs. standard hydrogen electrode at 298 K). Before measurements were taken, cathodic treatment (−1.2 V, 600 s) was conducted to remove any surface film that may have formed on the specimens. Potentiodynamic anodic polarization began at −1.0 V immediately afterwards. The scan rate of the electrode potential was set at 3.8 × 10⁻⁴ V s−1 (23 mV min−1). The electrode areas were scaled to convert the measured current value to the current density after the polarization measurements.
Micro-scale polarization measurements
To compare the polarization behavior of the primary ferrite and the pearlite, micro-scale electrodes were fabricated. In this procedure, the specimen was first etched with 3% nital to reveal the microstructure. After etching, the specimen surface was indented using a Mitutoyo Vickers hardness tester (HM 210A) to mark the positions of the primary ferrite and pearlite. The specimen was then re-polished with a 1 μm diamond paste and coated with a sealant. The size of the micro-scale electrode area was approximately 100 μm × 100 μm.
The micro-scale anodic polarization curves of the primary ferrite and pearlite were measured in the boric-borate buffer solutions (pH 8.0) with and without NaCl under naturally aerated conditions at 298 K. For the in situ real-time optical micro-scale observation of the electrode area, a system similar to that developed by Chiba et al. was used in this study.29 An acrylic cell was put into place to preserve the electrolyte on the specimen surface with a small working electrode area. A small Ag/AgCl reference electrode and a platinum wire counter electrode were used. For the electrolytes with NaCl, the reference electrode was filled with the buffer solution. For the electrolyte without NaCl, the reference electrode was filled with a saturated KCl solution, and an agar bridge made of a saturated K2SO4 solution connected the reference electrode and the electrolyte. The reference electrode was calibrated with the Ag/AgCl (3.33 M KCl) electrode before the experiments, and a battery-powered potentiostat23 was used for the micro-scale electrochemical measurements to reduce electrical noise. The potential scan rate was 3.8 ×10⁻⁴ V s−1 (23 mV min−1). The current and potential signals were measured using a data recorder with a time interval of 20 ms. During the micro-scale measurements, the electrode area was observed using an optical microscope with a water immersion objective lens that had a magnification of 100. Both the lens and the electrode surface were immersed in the electrolyte. The theoretical lateral resolution was approximately 350 nm.
Surface observations and analysis
An optical microscope, a confocal laser scanning microscope (CLSM), and a field emission scanning electron microscope (FE-SEM) were used to observe the surfaces and the microstructure of the specimens. An accelerating voltage of 5 kV was used for the FE-SEM observation. In addition, the existence of the segregated region of the substitutional alloying elements was analyzed by a field emission electron probe micro analyzer (FE-EPMA). An electron acceleration voltage of 10 kV was used. The beam diameter was approximately 100 nm.
Results and Discussion
Characterization of the microstructure
Metallographic inspection was performed to ascertain the characteristics of the microstructure of the specimen. Figure 1 shows the optical micrograph and the SEM image of a specimen that was surface etched with 3% nital. The image in Figure 1a confirms that the microstructure of the specimen was a ferrite-pearlite mixture. The dark areas in Figure 1a represent pearlite, and the bright areas represent ferrite (primary ferrite). Figure 1b shows the FE-SEM image of the primary ferrite phases and the lamellar structure of the pearlite. The surfaces of the primary ferrite phases were very smooth. However, the surface of the pearlite was quite rough due to the lamellar structure of the ferrite and cementite phases, which make up the morphology of the pearlite and the different etching rates of these phases. In the pearlite structure, the dark areas in Figure 1b represent the ferrite lamellae, and the bright areas represent the cementite. The difference in their brightness was attributed to the convexity formed by etching. The etching rate of the ferrite lamellae appears to have been higher than that of the cementite. A comparison of the etching behavior between these phases in the pearlite suggests that the corrosion resistance of the ferrite lamellae was lower than that of the cementite in terms of the dissolution rate. From Figure 1b, the thickness of the ferrite lamellae was estimated to be approximately 0.3 μm.
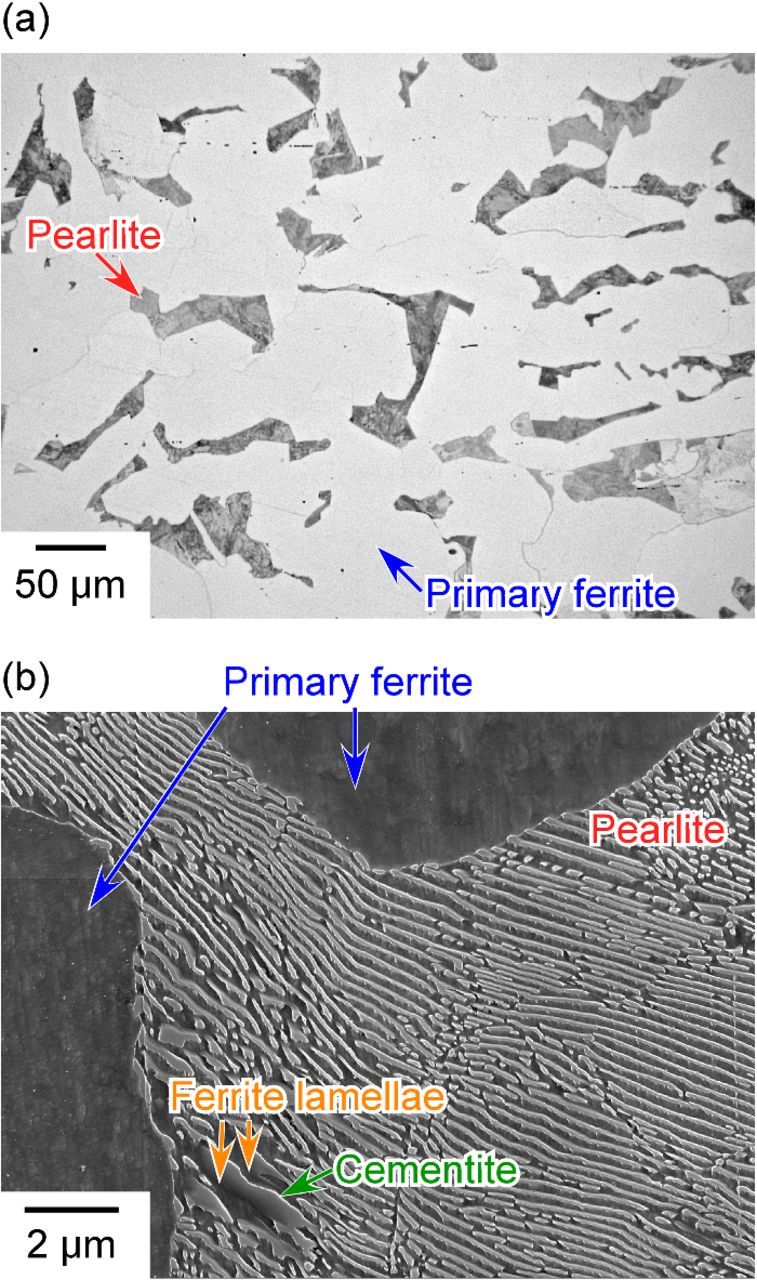
Figure 1. (a) Optical microscopy and (b) SEM images of the specimen that had a ferrite-pearlite structure and was etched in 3% nital.
In this study, all of the specimens were heat-treated at 1523 K for 1.8 ks and then furnace-cooled overnight. According to the Fe-Fe3C binary phase diagram,32 the primary ferrite phases are formed at approximately 860 K (A3 point), and then at approximately 1000 K (A1 point), residual austenite phases are transformed to a pearlite structure, which has a lamellar structure of ferrite and cementite phases.
FE-EPMA was conducted to elucidate the relationship between the distributions of alloying elements in the microstructure of the specimen. The SEM image and the EPMA mappings are shown in Figure 2. The lower left section of the image in Figure 2a shows the primary ferrite phase, and the area with the lamellar structure represents the pearlite. The image in Figure 2b confirms that carbon accumulated in the cementite lamellae of the pearlite. Stripe-like accumulated areas of manganese can be faintly seen in the upper section of the pearlite in Figure 2c. The blue arrows indicate two of these stripes. Figure 2d is the color-composite image of the carbon (green channel) and manganese (red channel) maps in the area surrounded by the blue lines shown in Figure 2a. In this figure, yellow indicates the co-existence of carbon and manganese at the same position due to the rule of three primary colors. As shown in Figure 2d, dark-yellow (or dull olive) stripes are observable. The shapes and positions of the accumulated areas of manganese were consistent with those of the cementite lamellae. In general, the alloying elements that readily form carbides in steels are enriched in the cementite during the eutectoid decomposition from austenite to pearlite. Dawson et al. reported that manganese carbides, such as Mn23C6, Mn7C3, and Mn5C7, are readily formed.33 The accumulation of manganese was reasonably detected in the cementite lamellae in the steel that was used in this study.
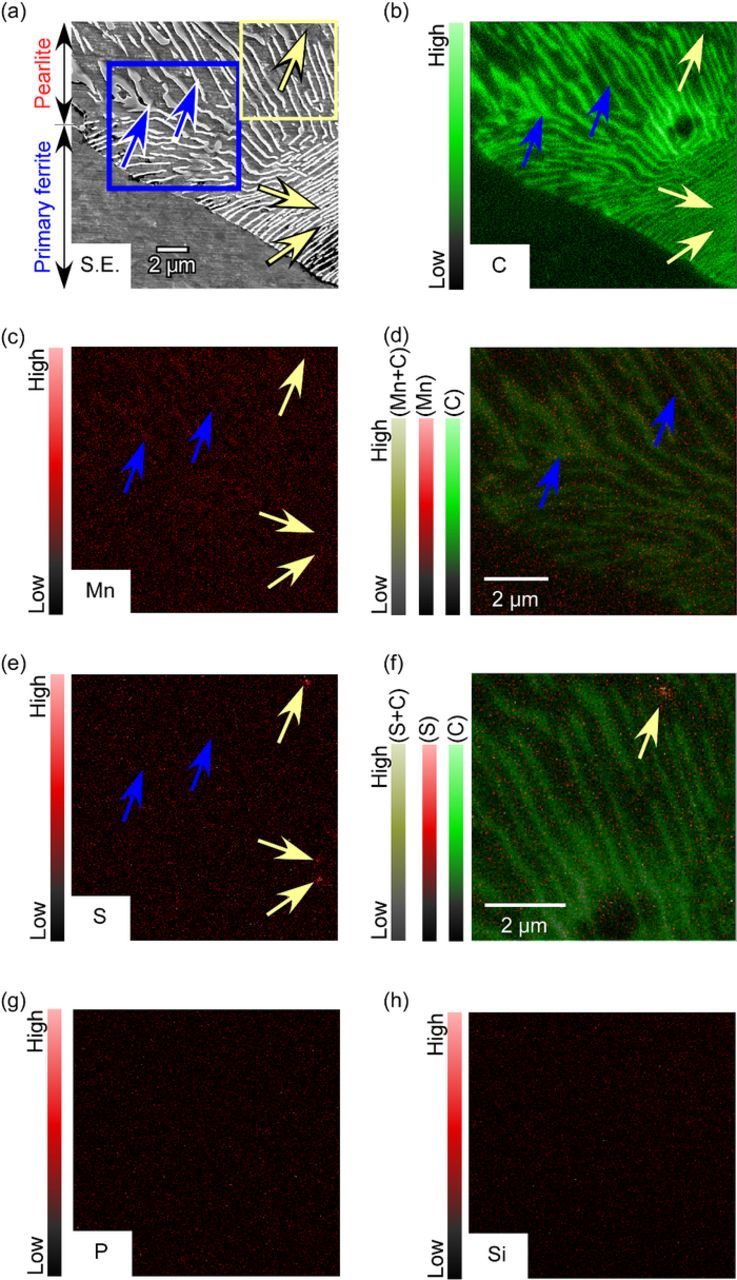
Figure 2. (a) SEM image and (b-h) EPMA mappings of the ferrite-pearlite structure: (b) carbon, (c) manganese, (d) manganese and carbon, (e) sulfur, (f) sulfur and carbon, (g) phosphorus, and (h) silicon; (d) color-composite image of the manganese and carbon in the area surrounded by blue lines in (a); (e) color-composite image of the sulfur and carbon in the area surrounded by yellow lines in (a).
As shown in Figure 2e, sulfur was locally concentrated at three points in the pearlite (indicated by the yellow arrows). At these sulfur-concentrated points, neither non-metallic inclusions nor manganese-accumulation was detected. Figure 2f shows the color-composite image of carbon (green channel) and sulfur (red channel). In this figure, the lack of yellow (or dark yellow) suggests that the sulfur-concentrated points do not correspond to the carbon-concentrated points. It was confirmed that the sulfur-concentrated points were located in the ferrite lamellae but not in the cementite. The sulfur-concentrated points were generated as the result of segregation not carbosulfide formation. Carbosulfides are well known to form in some cases in stainless steels,34,35 whereas in the case of our specimen, judging from the EPMA analysis, sulfur did not form the carbosulfides. Oikawa et al. reported that the solubility limit of sulfur in ferrite at approximately 850 K is approximately 0.01 mass%,36 which is lower than the sulfur concentration of the specimen used in this study. Sulfur segregation is thought to occur locally at the boundaries of the ferrite and cementite lamellae in the pearlite. Additional research is needed to clarify the exact positions of sulfur segregation.
In contrast to the elements already discussed, no segregation of phosphorus and silicon was detected in this study, as shown in Figures 2g and 2h. According to the literature, phosphorous and silicon sometimes segregate at the grain boundaries in carbon steels.37,38 However, no segregation of phosphorus and silicon was observed even in the pearlite. In our specimen, both phosphorus and silicon appeared to have dissolved homogeneously into the ferrite phases.
Macro-scale polarization behavior of ferrite-pearlite steel
Macro-scale polarization measurements were conducted to assess the pitting corrosion resistance of the ferrite-pearlite steel. Figure 3 shows the anodic polarization curves for the specimens in the deaerated boric-borate buffer solutions with and without NaCl at 298 K. As shown in this figure, the region of active dissolution appeared at approximately −0.6 V even at a near-neutral pH of 8.0. Above −0.5 V, the current density decreased with the electrode potential, and a transition from the active to the passive state was observed. In the solution that had 1 mM NaCl, the passive range was not clearly observed. However, in the solution without NaCl, the passive range was observed from ca. −0.5 V to 1 V. In the solution without NaCl, the current density decreased to a steady value of approximately 2×10⁻² A m−2, indicating that a protective passive film had formed on the specimen surface. However, a logarithmic increase in the current density to above approximately 0 V for the solution that had 1 mM NaCl indicated the breakdown of the passive film due to chloride ions. After the polarization, we removed the coating and checked the corrosion morphology. This included inspecting the junction between the bare metal surface and the epoxy resin for crevice corrosion. The results clearly indicated that chloride ions had caused pitting corrosion of the ferrite-pearlite structure above 0 V. With respect to the sample without chloride, as shown in Figure 3, the large increases in current densities above 1 V were due to oxygen evolution. In addition, the current peak between ca. −0.2 V to 0 V seems to be due to the oxidation reaction from Fe2+ to Fe3+.
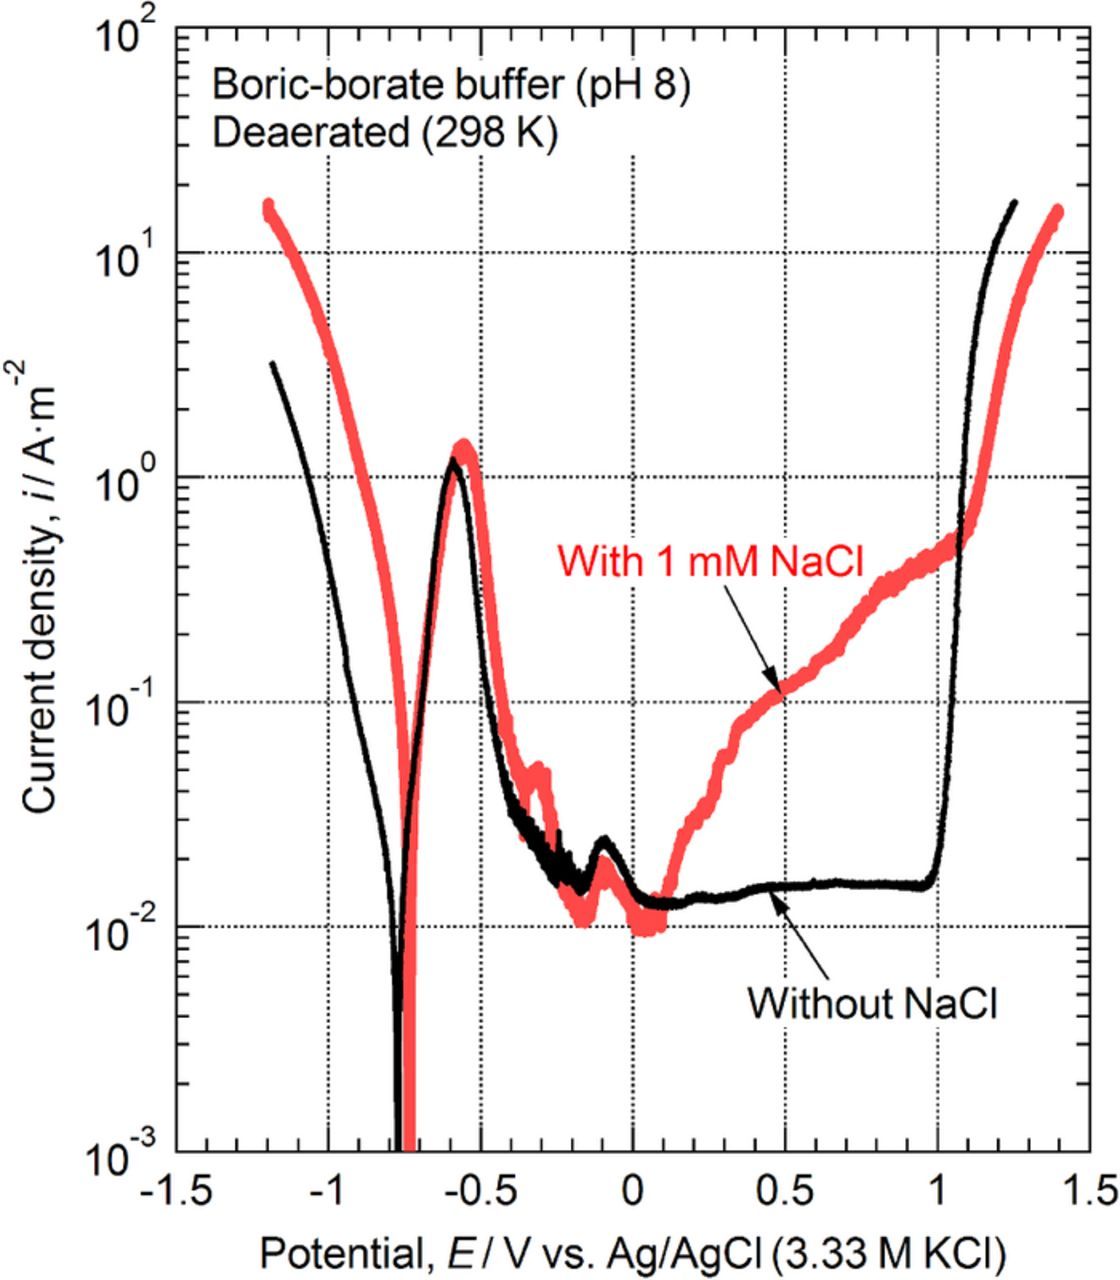
Figure 3. Macro-scale anodic polarization curves of the specimens that had a ferrite-pearlite structure in deaerated boric-borate buffer (pH 8.0) with and without 1 mM NaCl at 298 K.
Comparison of the pitting corrosion resistance of ferrite and pearlite
To clarify the difference between the pitting corrosion resistance of the primary ferrite and the pearlite, micro-scale polarization curves for a small electrode area that included the primary ferrite or pearlite were created for the boric-borate buffer solutions. Figure 4 shows the micro-scale anodic polarization curves for the naturally aerated boric-borate buffer solutions. To elucidate the effect of chloride ions on the pitting corrosion resistance, the concentration of chloride ions was changed from 0 to 100 mM. For the macro-scale polarization, the OCP of the specimen was approximately −0.75 V. However, for the micro-scale polarization, the OCPs of the specimens in all solutions were approximately −0.2 to −0.1 V. This difference was likely due to surface films on the specimens. For the micro-scale polarization, no cathodic treatment was performed prior to the potentiodynamic polarization, and the polarization was started at −0.3 V. As shown in Figure 4, the cathodic currents were measured initially in all of the solutions, and the anodic currents were measured above approximately −0.2 V. As shown in Figures 4a to 4c, for the solutions containing less than 10 mM NaCl, there were negligible differences between the corrosion behavior of the primary ferrite and the pearlite. No pitting was observed on the small areas that consisted of either primary ferrite or pearlite. In these solutions, the passive current densities were approximately 2 × 10⁻² A m−2, which are equivalent to those of the macro-scale samples shown in Figure 3. This indicated that the surfaces of the primary ferrite and the pearlite were well passivated in these solutions. At potentials above 1 V, the rapid increase in the current densities indicated that an oxygen evolution reaction occurred in this potential region. These results clearly indicate that the micro-scale electrode surfaces were successfully passivated in the solutions that contained less than 10 mM NaCl. However, for the macro-scale polarization, the increase in the current density due to pitting was observed even in the solution that contained 1 mM NaCl (see Figure 3). This difference is likely due to the effect of non-metallic inclusions in the electrode areas. For the EPMA analysis (see Figure 2), no non-metallic inclusions like MnS were observed because the area without the inclusions was chosen for the analysis. However, the specimens used in this study included the MnS inclusions. Because a commercial AISI 1045 carbon steel bar (sulfur concentration was 0.015 mass%) was used, for the macro-scale polarization, it was inevitable that the electrode areas contained non-metallic inclusions, such as manganese sulfide (MnS). On the other hand, for the micro-scale polarization, the extremely small size of the electrode areas (approximately 100 μm × 100 μm) made it possible to choose a small area without inclusions as the electrode area. Chiba et al. and Lillard et al. demonstrated that a trench formed at the boundary of a MnS and steel matrix, was the initiation site of the pitting of stainless steels.30,39,40 It is also known that the presence of MnS inclusions readily results in the pitting corrosion of carbon steels.41,42 In this study, a small area without inclusions was selected as the electrode area during the micro-scale polarization. This explains the absence of pit initiation during the micro-scale polarization in the solution that contained less than 10 mM NaCl.

Figure 4. Micro-scale anodic polarization curves of a small area consisting of primary ferrite or pearlite in the boric-borate buffer (pH 8.0) (a) without NaCl, (b-d) with NaCl at 298 K: (b) 1 mM NaCl, (c) 10 mM NaCl, and (d) 100 mM NaCl.
In the boric-borate buffer solution with 100 mM NaCl (Figure 4d), a sharp increase in current density was observed on the pearlite at approximately 0 V. This current increase was due to the initiation of pitting. In contrast, no pit was generated on the primary ferrite even in the solution with 100 mM NaCl. To verify the reproducibility, the micro-scale polarization of primary ferrite was repeated twice. We confirmed that no pitting occurred on the primary ferrite. The experiments for the pearlite were also performed three times. The pitting potential of the pearlite varied from 0 to 0.5 V during the micro-scale polarization.
Figure 5 shows the optical microscopy images of the micro-scale electrode areas before and after polarization in the solution with 100 mM NaCl shown in Figure 4d. All the images were taken in air. As shown in Figures 5a and 5b, for the primary ferrite, no pit was detected on the electrode area after polarization, and anodic polarization resulted only in discoloration. However, for the pearlite (Figures 5c and 5d), one large pit and many small ones were observed after polarization. After the micro-scale polarization, the coating was removed with an organic solvent, and the surface was examined for corrosion damage include whether or not crevicing below the coating had taken place. No corrosion attack was observed under the coating. In Figure 5d, the black dots were corrosion products, and they existed on the coating. The corrosion products were deposited on the coating. These surface appearances and the corrosion morphology are consistent with the results of the micro-scale polarization curve shown in Figure 4d. To conclude, the pitting corrosion resistance of the pearlite is lower than that of the primary ferrite, and pitting resistance is dependent on the microstructure of the steel.

Figure 5. Optical microscopy images of electrode surfaces before and after polarization from Figure 4d: (a) before and (b) after polarization of primary ferrite, (c) before and (d) after polarization of pearlite.
In situ observation of pit initiation in pearlite
Pearlite, which consists of ferrite and cementite, is a lamellar product of the eutectoid decomposition of austenite. To clarify the initiation site of pitting in the pearlite, in situ observation during micro-scale polarization was conducted. Figure 6a shows the micro-scale polarization curve of the pearlite in the boric-borate buffer solution that contained 100 mM NaCl. To prevent active dissolution on the specimen's surface during anodic polarization, no cathodic treatment was applied, and the potentiodynamic polarization was started at −0.1 V. This potential was slightly higher than the OCP in the naturally aerated solution; hence, the anodic current was already observed at the beginning of the polarization. In Figure 6a, a large increase in current density was generated at 0.537 V. This was due to the initiation and growth of pitting. Figures 6b to 6e show the optical microscopy images of the micro-scale electrode area that was observed with the water immersion objective lens during anodic polarization. Figure 6b shows the surface appearance just after polarization began (−0.092 V). No corrosion was observed on the electrode surface because the starting potential of the polarization (−0.1 V) was located in the passive region of the steel. Figure 6c is the surface appearance at 0.537 V, which was the potential just after pit initiation. The pit, marked by the red arrow, was initiated near the edge of the coating. At 0.540 V, the first pit became larger, and many small pits had been initiated. The first pit and the small ones grew with the electrode potential (see Figure 6e). To clarify the details of the initiation process of pitting, the morphological changes of the pits that formed in the areas marked by "A" and "B" in Figure 6e were analyzed. Figure 7 displays the optical microscopy images of the initiation process of the pit that formed in the area marked by "A". Figure 7a shows the electrode surface just before pit initiation, and this point was defined as 0 s for the following analysis. The electrode potential at 0 s was 0.537 V. After 0.09 s, a small pit, marked "A1" by the arrow in Figure 7b, was initiated. After initiation, the pit grew with time. As shown in Figure 7b, the pit at the moment of initiation was round. Then, it proceeded isotropically, and the diameter of the pit was approximately 1.5 μm at 0.25 s. After 0.32 s, the pit developed the shape of a polygon. From 0.32 to 0.58 s, the polygonal pit grew in size. After 0.65 s, the polygonal pit proceeded in all directions, and it eventually became round again.
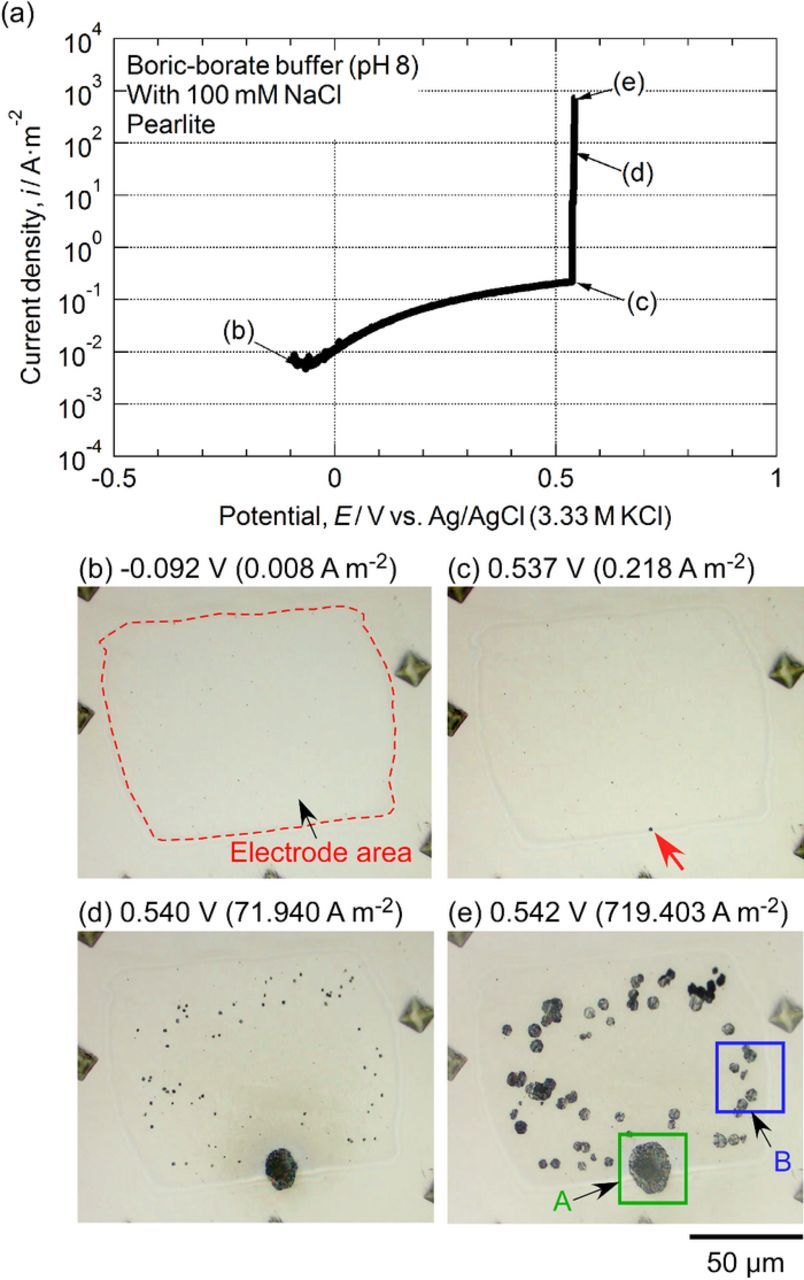
Figure 6. (a) Micro-scale polarization curve of a small area consisting of pearlite in boric-borate buffer (pH 8.0) with 100 mM NaCl. (b-e) Optical microscopy images of the electrode surface with a water immersion objective lens: (b) −0.092 V, (c) 0.537 V, (d) 0.540 V, and (e) 0.542 V.

Figure 7. Optical microscopy images of the initiation processes of pit "A1" formed in the area marked as "A" shown in Figure 6e.
Figure 8 shows the optical microscopy images of the initiation process of the pits that were formed in the area marked by "B". Figure 8a shows the electrode surface just before pit initiation: this point was defined as 0 s in this analysis. The electrode potential at 0 s was 0.539 V. At 0.03 s (Figure 8b), the small pits marked as "B1" and "B2" were initiated at the points indicated by the arrows. Then, the pit marked as "B1" became rod-shaped, and it grew in length from 0.10 to 0.55 s. At 0.62 s, a dark spot was clearly visible at the lower end of the rod-shaped pit, and this spot grew as a function of time. The dissolution of the pit likely proceeded along the lamellar structure of the pearlite during the early stage of pit growth. Afterwards, the pit became round. Additionally, for the pit marked as "B2", the pit was initiated at 0.03 s (Figure 8b). This pit became elliptical in shape and grew as a function of time. From 0.03 to 0.55 s, the growth observed was mainly the length axis of the elliptical shape, which increased steadily with time. After 0.62 s, the elliptical pit gradually changed to a round one.
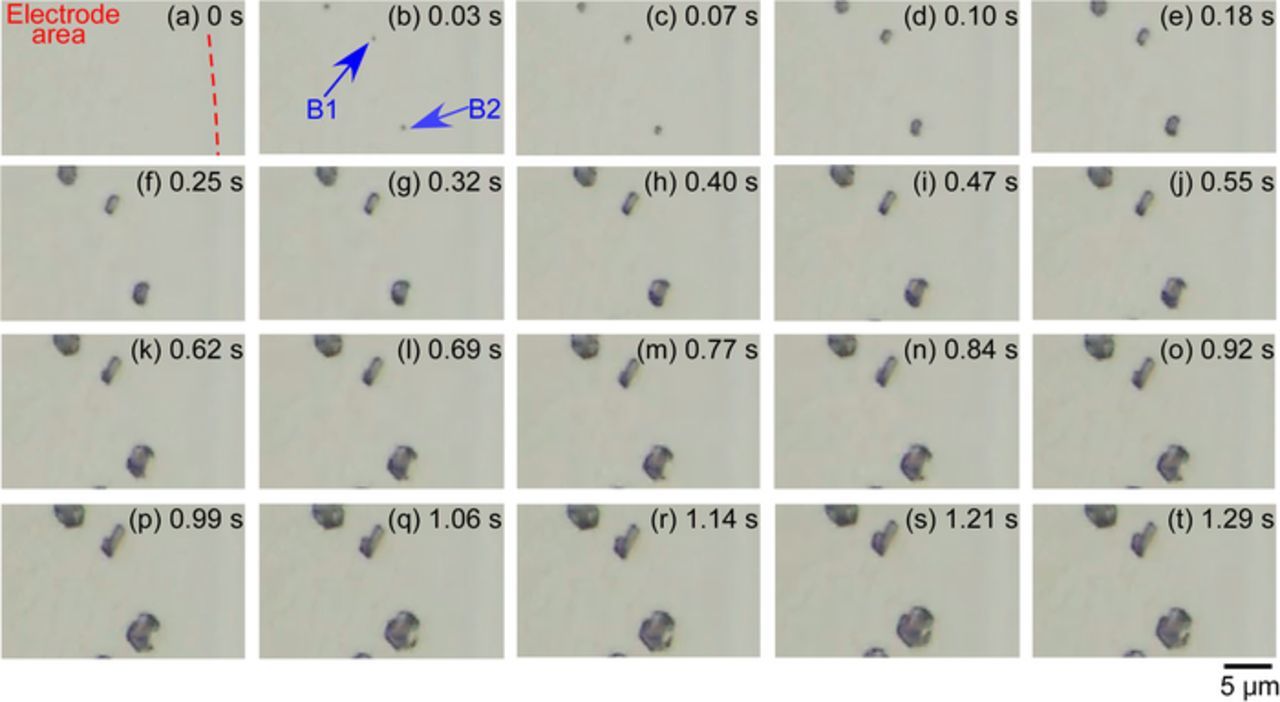
Figure 8. Optical microscopy images of the initiation processes of pits "B1" and "B2" that formed in the area marked as "B" shown in Figure 6e.
The above results suggest that the growth direction of the pits that initiated in the pearlite was along its lamellar structure. To clarify the effect of the pearlite structure on the growth direction of the pits during the early stage of pitting, the relationships between the direction of the lamellar structure and the growth direction of the pits were analyzed via digital image processing. Figure 9a shows the CLSM reflectance image of the microstructure in and around the electrode area of the pearlite that was used during the micro-scale polarization shown in Figure 6. This image was taken before polarization with 3% nital etching. Figure 9b shows the composite image of Figure 9a and Figure 6e. From Figure 9b, the lamellar direction at the pit initiation sites can be confirmed. The lamellar structure in the area marked as "C" is shown in Figure 9c and the morphological change of the pit marked by "A1" is shown in Figure 9d. Judging from Figures 9c and 9d, the lamellar structure and pit growth directions were almost the same. In the case of areas "D" and "E", Figures 9e and 9g show the lamellar structures, and Figures 9f and 9h show the morphological changes of the pits marked as "B1" and "B2", respectively. As was the case for area "C", it was indicated that the pits grew in almost the same direction as the lamellar structure. These results confirmed that the pits tend to grow along the lamellar structure of the pearlite.
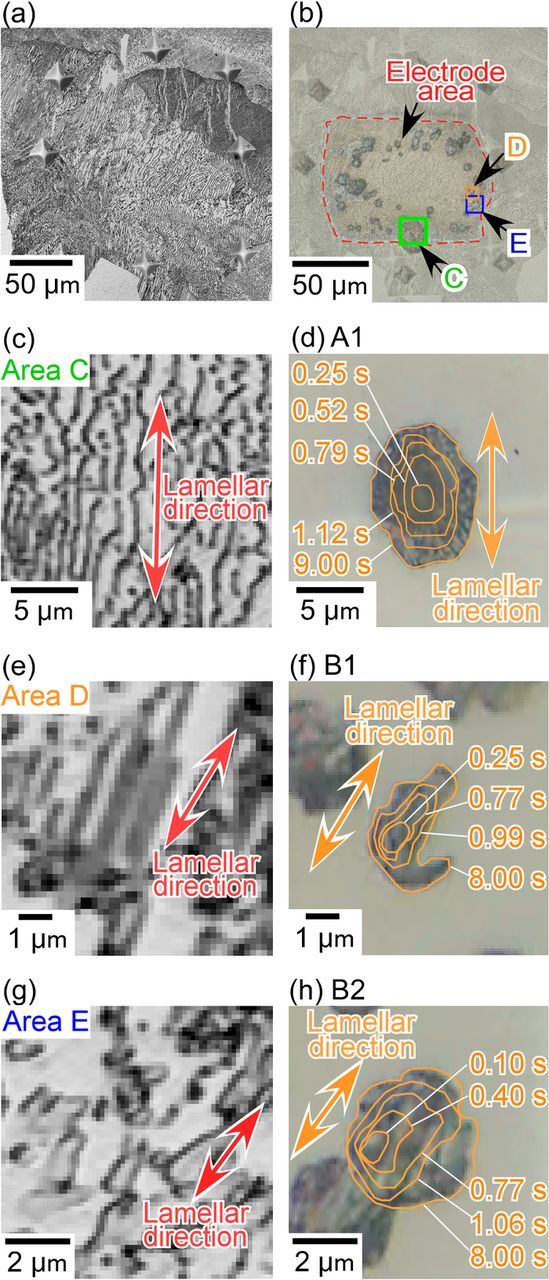
Figure 9. Relationship between pearlite lamellae and pit growth directions: (a) CLSM reflectance image of the microstructure of pearlite in and around the electrode area, (b) composite image of the microstructure and electrode area shown in Figure 6e, (c) microstructure of area "C" surrounded by green lines shown in (b), (d) changes in the outlines of the mouth of pit "A1", (e) microstructure of area "D" surrounded by orange lines shown in (b), (f) changes in the outlines of the mouth of pit "B1", (g) microstructure of area "E" surrounded by blue lines shown in (b), and (h) changes in the outlines of the mouth of pit "B2".
As indicated in Figure 1b, the dissolution rate of the cementite phase in 3% nital was significantly lower than that of the ferrite lamellae. Xu et al. reported that the dissolution of the cementite in 1 M HCl was inhibited by a surface carbon layer that formed on the cementite. This surface layer was thermodynamically stable in the potential area of the active dissolution range for carbon steels.43 Yumoto et al. demonstrated that the surface of the cementite was oxidized naturally at room temperature, and the oxide film on the cementite was not corroded even in a 3 mass% NaCl solution and was protected from corrosion.12 Therefore, it was concluded that the pits are initiated in the ferrite lamellae, and the pit then proceeds along the lamellar structure via selective dissolution of the ferrite lamellae. Then, the dissolution of the ferrite lamellae brings about acidification and chloride accumulation on the corroded area, causing the passive-active transition of the pearlite to spread isotropically. Unfortunately, we could not obtain a direct image that proves that the pit was initiated in the ferrite lamellae due to insufficient positioning accuracy between the video and the images of the microstructure. Additionally, the indentations around the electrode area were too large to align the two images with submicron accuracy. However, we believe that the pit initiation site in the pearlite structure is the ferrite lamellae. Moreover, the cementite lamellae act as a barrier against pit growth during the very early stage of pitting.
As shown in Figure 4, we confirmed that the primary ferrite phase exhibited a higher pitting corrosion resistance than the pearlite lamellae; however, as discussed above, the pit seemed to be initiated in the ferrite lamellae in the pearlite. What is most remarkable is that the primary ferrite and the ferrite lamellae exhibited different corrosion behaviors despite both having body-centered cubic (bcc) structures. One possible explanation is the difference in their chemical compositions. The segregation of sulfur, as shown in Figure 2, likely caused pit initiation on the ferrite lamellae in the pearlite. Elemental sulfur can cause localized corrosion of carbon steel,44–47 and sulfur-containing compounds, such as H2S, S2O32−, and SO42−, also promote the initiation of pitting.44 Manning et al. reported that the sulfur segregation in duplex stainless steels also acted as initiation sites of pitting in chloride environments.48 Chiba et al. proposed the pit initiation mechanism at MnS inclusions in stainless steels.30 They found that the boundary between the inclusion and the steel matrix dissolved selectively only in NaCl solutions, and they found that a trench formed due to the active dissolution of the steel side of the boundary. Elemental sulfur was deposited on the inclusion and at the boundary after anodic polarization in 3 M NaCl. The active dissolution of the steel matrix occurs in solutions in which chloride ions and elemental sulfur coexist. The synergistic effect of elemental sulfur and chloride ions is likely to result in trench formation, and the decrease in both the pH and potential inside the trench results in pit initiation. According to this pitting mechanism, the coexistence of sulfur and chloride ions is the critical factor resulting in pitting corrosion in the pearlite. For the ferrite lamellae, the sulfur was concentrated locally (see Figure 2), and these points are thought to act as initiation sites of the pits in the boric-borate buffer solution that contained NaCl. Then, the pits proceeded along the ferrite lamellae. In contrast, no sulfur segregation was found in the primary ferrite phase, as shown clearly in Figure 2. During heat-treatment, the primary ferrite phases formed first and at high temperatures. The primary ferrite phases were more homogeneous than the ferrite lamellae from both chemical and metallurgical points of view. Homogeneity is expected to be a substantial requirement for the corrosion resistance of steels. Further studies are needed to clarify a more detailed mechanism of the pit initiation process in ferrite-pearlite steels. Improving the resolution of in situ real-time observation is also necessary to explore the exact position and to elucidate the mechanism of pit initiation.
Conclusions
- (1)Based on the EPMA, a local accumulation of manganese and sulfur was observed in the pearlite. The positions of manganese segregation were consistent with those of the cementite lamellae. Sulfur-concentrated points were observed in the ferrite lamellae. These points may readily act as initiation sites of pitting of ferrite-pearlite steel. In contrast, no segregation of manganese or sulfur was found in the primary ferrite phase.
- (2)Under macro-scale polarization in the boric-borate buffer that contained 1 mM NaCl (pH 8.0), a large increase in current density was observed at approximately 0 V. We confirmed that the breaking of the passive film on the ferrite-pearlite steel occurred due to chloride ions above this potential, and pits were initiated and began to proceed on the specimen surface.
- (3)Under micro-scale polarization, no pitting was observed on the primary ferrite in the boric-borate buffer that contained 10 mM NaCl. However, pits were initiated on the pearlite. The pitting potential of the pearlite was from 0 to 0.5 V.
- (4)From the in situ observation during the micro-scale polarization for the pearlite in the boric-borate buffer that contained 100 mM NaCl, we found that the pits in the initial stage were polygonal shaped. The pit growth and lamellar directions were almost the same. The lower dissolution rate of the cementite compared to that of the ferrite lamellae indicates that the pits were initiated in the ferrite lamellae and proceeded along the lamellar structure of the pearlite with the dissolution of the ferrite lamellae.
Acknowledgments
This research was supported by the Innovative Structural Materials Association (ISMA) and JSPS KAKENHI grant Number JP15K14175. This research was also supported by the Program for Leading Graduate Schools, "Interdepartmental Doctoral Degree Program for Multi-dimensional Materials Science Leaders", by the Ministry of Education, Culture, Sports, Science and Technology.