
Abstract
Though 2,5-di-tert-butyl-1,4-bis(2-methoxyethoxy)benzene (DBBB) is a promising active species for non-aqueous redox flow batteries, the development and optimization of suitable electrolytes is still required to realize this potential. Given the breadth and diversity of non-aqueous electrolytes, combinatorial screening using automated platforms offers an efficient means of mapping out the design space. Employing an automated electrolyte synthesis and characterization system, we studied electrolytes consisting of DBBB, various alkali ion salts, and carbonate solvents, with an overarching goal of improving DBBB solubility and ionic conductivity. Via this high-throughput approach, mixtures of linear and cyclic carbonates were found to improve solubility and conductivity including certain mixtures that demonstrated both improved DBBB solubility (>0.5 M) and electrolyte conductivity (>5 mS/cm), over the base case scenario. In general, the addition of LiTFSI as a salt (or co-salt) improved DBBB solubility in electrolytes and the ionic conductivity of solutions. Furthermore, the electrochemical behavior of DBBB was systematically investigated over a range of concentrations (0.005 M to 0.3 M) in an optimized electrolyte using both macroelectrode and ultramicroelectrode techniques. Determining the trends of key electrochemical parameters may help bridge the gap between low concentration screening experiments and higher concentration energy storage applications.
Export citation and abstract BibTeX RIS
Over the past decade, large investments have been made worldwide to design, build, and install renewable electricity generation systems which draw from a variety of energy sources (e.g., solar, wind, tidal). In many regions, this choice was made not only to establish local control over power generation, but also to build industries, to create jobs, and to satisfy political goals. A significant limitation of these sources identified by utilities is intermittency, as many of these technologies cannot be relied upon to produce power on demand.1 To enable more consistent power delivery, a range of energy storage systems have been investigated including pumped hydroelectric, compressed air, electrochemical capacitors, advanced lead acid batteries, lithium-ion batteries (LIBs), and redox flow batteries (RFBs).2 Of these options, RFBs may offer the best combination of performance, cost, and versatility to be coupled with renewable energy conversion systems.3 Unlike conventional rechargeable batteries which store energy within solid electrodes in a single vessel, RFBs store energy in flowable solutions, or suspensions, of electroactive species, which are housed in external tanks and pumped to a power-generating electroreactor.3–6 When compared to single vessel rechargeable batteries, this architecture offers several advantages including (i) decoupled power (reactor size) and energy (tank size), (ii) high active-to-inactive materials ratio, (iii) simplified manufacturing, (iv) thermal management quality, (v) long service life, and (vi) improved safety.7
Though the first systematic studies were performed by NASA in the early 1970s, RFBs are still a relatively immature technology as compared to other rechargeable batteries. However, with increasing interest in coupling large scale energy storage systems with intermittent renewable electricity generators, RFBs are presently experiencing a renaissance.3,4 The vast majority of RFBs employ aqueous electrochemical couples with all-vanadium systems being the most commercially successful chemistry to date.5,7,8 Unfortunately, widespread adoption of aqueous RFBs has been limited by their low energy densities (<40 Wh/L) due, at least in part, to low solubility of redox species and operating voltages that are bounded by water electrolysis, translating to prohibitive system costs ($280–600/kWh).5,9 In contrast, non-aqueous solvents offer a wider window of electrochemical stability (1–5 V), enabling cell operation at significantly higher potentials. Higher cell voltage leads to higher energy density and typically higher round-trip efficiency, which together reduce the cost of energy. Moreover, the transition from aqueous electrolytes to non-aqueous electrolytes enables the use of new redox couples with desirable properties (e.g., multi-electron transfer, increased solubility). To take full advantage of this extended window, electrochemical couples must be developed with suitably different redox potentials, high solubility, and good long-term stability. For the positive electrolyte (sometimes referred to as the catholyte), promising initial candidates are the high potential organic redox shuttles employed in LIB packs to prevent overcharging of individual cells.10–13 Recently, Brushett et al. proposed and investigated an all-organic Li-ion redox flow battery that employed 2,5-di-tert-butyl-1,4-bis(2-methoxyethoxy)benzene (DBBB) and quinoxaline derivatives as the positive and negative active species, respectively.14 While this non-aqueous system demonstrated promising performance in a proof-of-concept electrochemical cell, the theoretical system energy densities (based only on particular electrolytes used) ranged from ca. 12–16 Wh/L with the limiting factor being the DBBB solubility (0.4 M in propylene carbonate). By comparison, current state-of-the-art aqueous technologies offer ca. 40 Wh/L at the cell-level and ca. 25 Wh/L at the system-level.3,15 By improving DBBB solubility, high concentration redox-active electrolytes can be developed, leading to an increased system energy density. Moreover, such studies may provide fundamental insights into the design of electrolytes that maintain high solubility of active species over different states of charge during RFB operation. For example, Shinkle et al. recently studied the physical and electrochemical properties of five solvents and four supporting electrolytes (20 total combinations) to determine the optimum vanadium acetylacetonate solubility and ionic conductivity.16
Given the breadth and diversity of non-aqueous electrolytes in terms of both salts and solvents, the systematic exploration required for the electrolyte optimization could be time-consuming and materials-intensive when performed via traditional manual bench-scale methods. In principle, automation may offer a means of performing such tasks in a high-throughput manner with exceptional reproducibility and minimal materials investment.17 Indeed, a diverse set of combinatorial approaches, often coupled with electrochemical or spectroscopic techniques, have been developed to synthesize, validate, and characterize promising energy materials including heterogeneous catalysts,18,19 LIB electrodes,20,21 polymer electrolytes,22 and porous alumina membranes.23 Liquid electrolytes are ideally suited for combinatorial preparation because an array of different variants can be achieved via simple mixing.
Here, we employ an automated robotic synthesis and characterization system within an inert gas-filled glove box to perform combinatorial studies of DBBB-based electrolytes as a function of concentration, composition, and temperature with the overarching goal of enhancing the solubility of DBBB while maintaining (or improving) the electrolyte conductivity. We explore combinations of alkali ion salts and carbonate solvents that are commonly used in advanced LIB technologies.24–27 In addition, systematic electrochemical studies are performed on optimized electrolytes as a function of active species concentration, to determine trends in several key parameters (e.g., diffusivity, standard rate constant) that impact the expected performance of non-aqueous redox flow batteries.
Experimental
Chemicals
The redox-active material investigated was 2,5-di-tert-butyl-1,4,-bis(methoxyethoxy)benzene, DBBB, which was synthesized in-house by the Materials Engineering Research Facility at Argonne National Laboratory (99.9% purity, battery grade). The solvents investigated were propylene carbonate (PC, anhydrous, 99.7%, Sigma Aldrich), ethylene carbonate (EC, anhydrous, 99%, Sigma Aldrich), dimethyl carbonate (DMC, anhydrous, ≥99%, Sigma Aldrich), and diethyl carbonate (DEC, anhydrous, ≥99%, Aldrich). The salts investigated were lithium tetrafluoroborate (LiBF4, anhydrous, 98%, Acros Organics), lithium hexafluorophosphate (LiPF6, Stella Chemifa Corp.), bis(trifluoromethane)sulfonimide lithium (LiTFSI, ≥99.0%, Aldrich), lithium trifluoromethanesulfonate (LiTf, 99.995% trace metals basis, Aldrich), sodium hexafluorophosphate (NaPF6, 98%, Aldrich), and sodium tetrafluoroborate (NaBF4, 98%, Aldrich). All chemicals were used as received and stored in an argon (Ar)-filled glove box prior to being transported, under air- and moisture-free conditions (<0.1 ppm O2 and H2O), to a nitrogen (N2)-filled glove box for combinatorial testing.
Combinatorial testing
Figure 1 shows the automated synthesis platform – a Freeslate Inc. core module deck (CM3) that is located in a custom-built N2-filled glove box (MB 200B, MBraun) in Argonne National Laboratory's High Throughput Research Laboratory. The CM3 is designed to perform solid and liquid handling as well as to process samples with on-deck heating, cooling, and stirring. Multi-well plates of either 48 glass vials of 2 mL or 24 glass vials of 4 mL were used. For dispensing solid powders, disposable shaker vials (SV) with PTFE hoppers were used. An automated balance (±0.2 mg accuracy) was used to weigh the solids. Sample vials were transported to and from the balance using a vial gripper. The platform is equipped with an extended syringe tip for transferring solutions, and a rinsing/washing station. Between transfers, PC was used as the washing reagent to prevent cross-contamination. The deck has a cooling and heating bay (−30 to 150°C) with magnetic stirring (up to 750 rpm). The disposable vials were loaded with PTFE-coated stirring bars and then capped. To accelerate solubilization, samples were stirred at 200 rpm and heated to 50°C in sealed vials and then slowly cooled to room temperature.
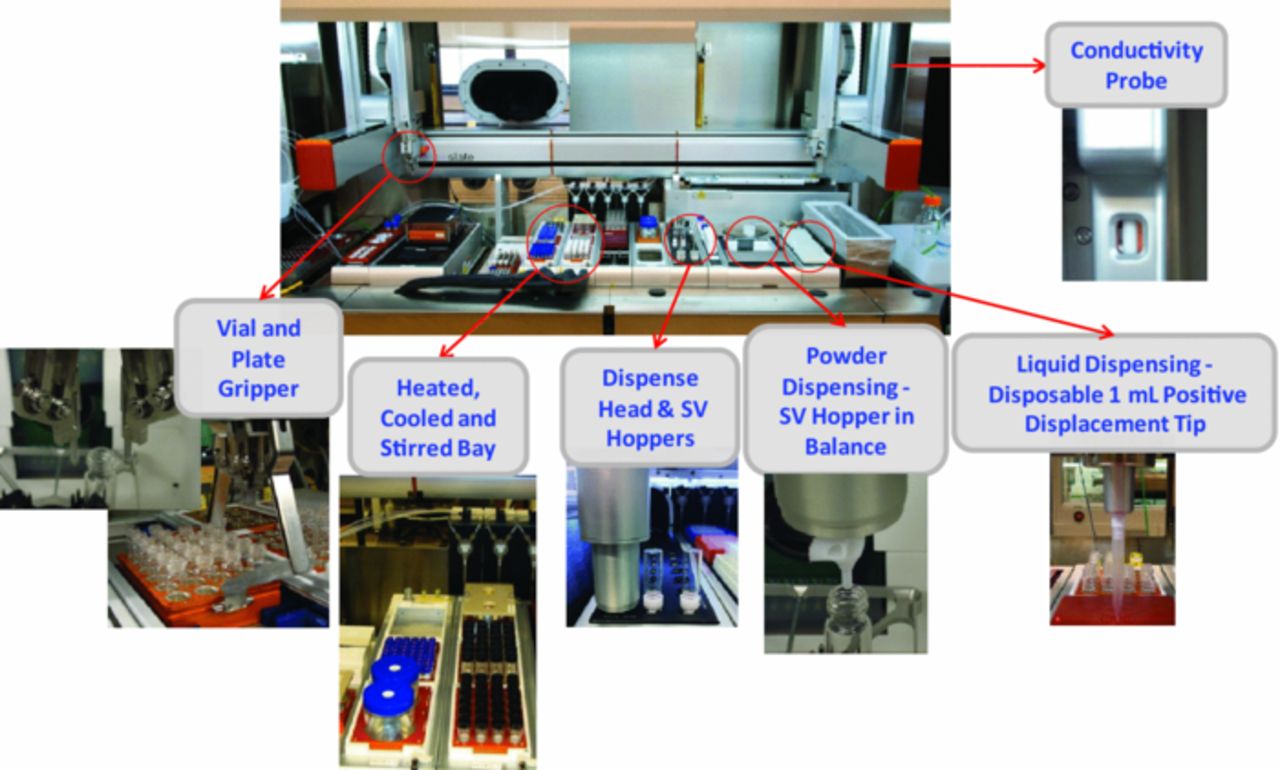
Figure 1. Modular robotic platform (Core Module 3, Freeslate Inc.) that is designed to perform solid handling, liquid handling, sample processing with on-deck heating/cooling/stirring and conductivity measurement.
For solubility measurements, samples were transferred into a 96-well quartz plate (Hellma GmbH) after being stirred and heated to 55°C in sealed vials for 1 hr. They were then investigated using a dynamic light scattering analyzer equipped with an optical camera and a temperature controller (DynaPro Plate Reader II, Wyatt Technologies Co.) located also in the N2-filled glove box. The assessment was performed using the produced images of each well as a function of temperature starting from high values and moving to low values in 2.5°C increments. The highest and lowest measurable temperatures are indicated in each case. The error on the temperature required for complete solubilization is estimated to be ±2.5°C.
Conductivity measurements were carried out only on samples that showed complete solubility at a certain temperature. Measurements were performed with an Orion 3 Star conductivity meter (Thermo Scientific) with a MI-915 Dip-type conductivity probe (Microelectrodes, Inc.) that was dipped into each vial on the plate. The conductivity probe is also one of the integrated tools on Freeslate's robotic platform. Between each measurement, the probe was washed with ethanol (anhydrous, 99.5%, Fisher Scientific) and dried over adsorbing mats to avoid cross contamination. The probe was regularly calibrated with standard solutions (0.1, 1, 5, 10, and 20 mS/cm, Ricca Chemical). The salts and DBBB are expressed as molar concentrations (M), while the carbonate solvent mixtures are expressed as mole fractions. The error on the reported conductivities is estimated at ± 5%.
Electrochemical testing
Cyclic voltammetry was performed in a three-electrode electrochemical cell with a 3-mm diameter glassy carbon disk electrode (CH Instruments, Inc.) or 11 μm carbon fiber microelectrode (BASi) and lithium metal (Alfa Aesar) counter and reference electrodes. The glassy carbon disk (GCE) was consecutively polished on a MicroCloth pad with 1 μm and 0.05 μm alumina powders (Buehler Ltd.), thoroughly rinsed with deionized water (Millipore), and sonicated for 1 min after polishing on each powder. The ultramicroelectrode (UME) was polished on a MicroCloth pad with 0.05 μm alumina powder and thoroughly rinsed with deionized water. The polished electrodes were dried under Ar before being transferred into the glove box. The electrochemical cell was assembled and used in an Ar-filled glove box (MBraun Labmaster). The electrochemical data were collected and recorded using a VSP-300 potentiostat (Bio-Logic). An automatic iR correction with a compensation level of 75% was applied before the cyclic voltammetry (CV) measurement. The electrolyte viscosities were measured using a Viscolite 700 laboratory viscometer (Vindum Engineering).
The diffusion coefficients of reduced (original) and oxidized DBBB were estimated using the Randles-Sevcik equation for reversible electron transfer reactions:
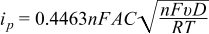
where ip is the peak current (A), n is the number of electrons transferred in the redox event (n = 1), F is Faraday's constant (96485 C/mol), A is the electrode area (cm2), C is the active species concentration (mol/cm3), υ is the scan rate (V/s), D is the diffusion coefficient (cm2/s), R is the universal gas constant (8.314 J/K-mol), and T is the absolute temperature (K). All experiments were performed at 35°C (box temperature). The kinetic parameters, namely the standard rate constant (k0) and transfer coefficient (α), are calculated based on CV results from UME according to the Butler-Volmer equations when i < 0.1ilim:
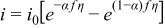

where i is the current in the cyclic voltammogram (A), i0 is the exchange current, f = F/(RT), and η is the overpotential (V), A is the geometric area of the ultramicroelectrode (cm2), C is the active species concentration (mol/cm3).
Results and Discussion
Freeslate CM3 automation platform validation
For the automated system to be an effective high-throughput tool, the reproducibility and accuracy of the results must be validated. To this end, a range of LiBF4-PC electrolytes were prepared and tested on the platform at 25°C and 55°C. Solutions of 6 different concentrations, from 0.2 to 1.2 M LiBF4 in PC, were randomly prepared and distributed within a 48-well plate (8 separate solutions per concentration). As shown in Figure 2, the system demonstrated excellent reproducibility with the standard deviations of 0.09–0.17 mS/cm at 25°C and 0.09–0.32 mS/cm at 55°C over the tested concentration range. Therefore, the error on the measured conductivities is estimated at ± 5%. Moreover, these measured conductivity values and trends are in good agreement with prior reports.28
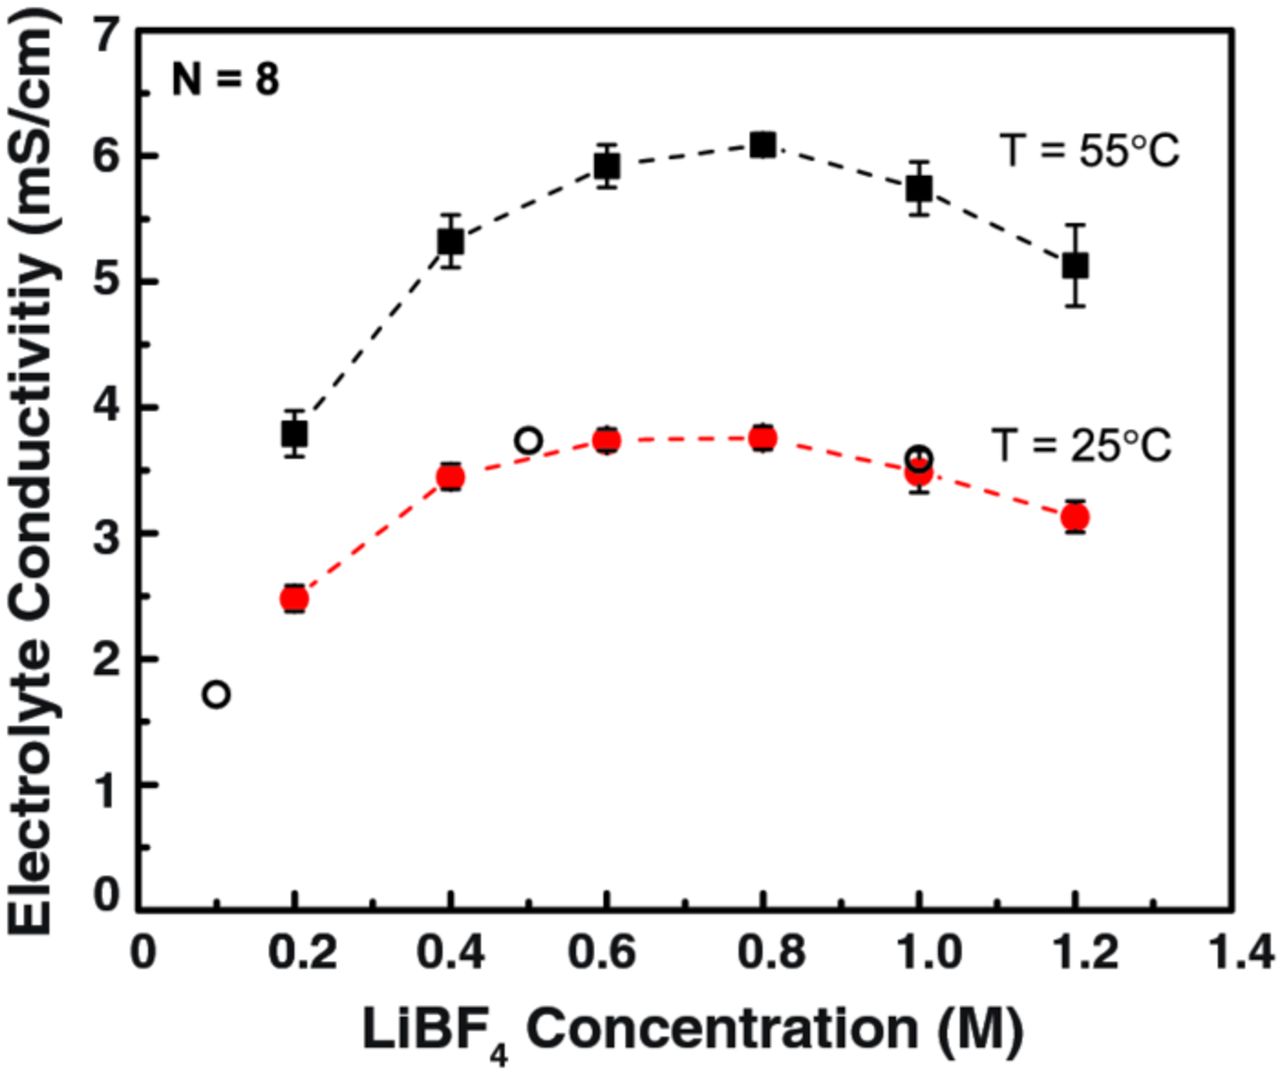
Figure 2. LiBF4-PC electrolyte conductivity, measured at 25°C and 55°C, as a function of salt concentration. Each concentration was validated with 8 independent samples on the same 48 well plate. For comparison, literature data (○), obtained at 25°C and over a similar concentration range, is added from Ref. 28.
Base case: DBBB-LiBF4-PC
Building on the previous work of Brushett et al., the solubility and conductivity of DBBB and LiBF4 in PC were measured as a function of temperature (Figure 3). Figure 3a shows that LiBF4 is broadly soluble in PC over the range of tested concentrations and temperatures; but with increasing DBBB concentration (>0.1 M), the solubility range of the electrolyte decreases. For example, in the presence of 0.2 M DBBB, the maximum LiBF4 concentration at 25°C is 0.8 M. However, such a DBBB concentration is too low to be applicable in RFBs. Higher DBBB solubilities, up to 0.4 M, can be achieved at 25°C albeit with lower salt concentrations. The conductivity of each electrolyte combination was measured at 55°C, to ensure that all were fully solubilized (Figure 3b). The overall solution conductivity decreases with increasing DBBB concentration. For electrolytes without DBBB and with 0.1 M DBBB, the maximum conductivity was observed at 0.8 M LiBF4. For higher DBBB concentrations, the maximum conductivity is observed at 0.6 M LiBF4. For all cases, the conductivity decreases when the salt concentration increases above 0.8 M. This decrease occurs more drastically at higher DBBB concentrations. This maximum conductivity is a well-known effect due to a simultaneous increase of the number of carrier ions and the electrolyte viscosity as predicted by the Jones-Dole relationship.29 Beyond a certain concentration, the effective mobility of the ionic carrier decreases as a result of the increase in viscosity, which leads to a lower conductivity.
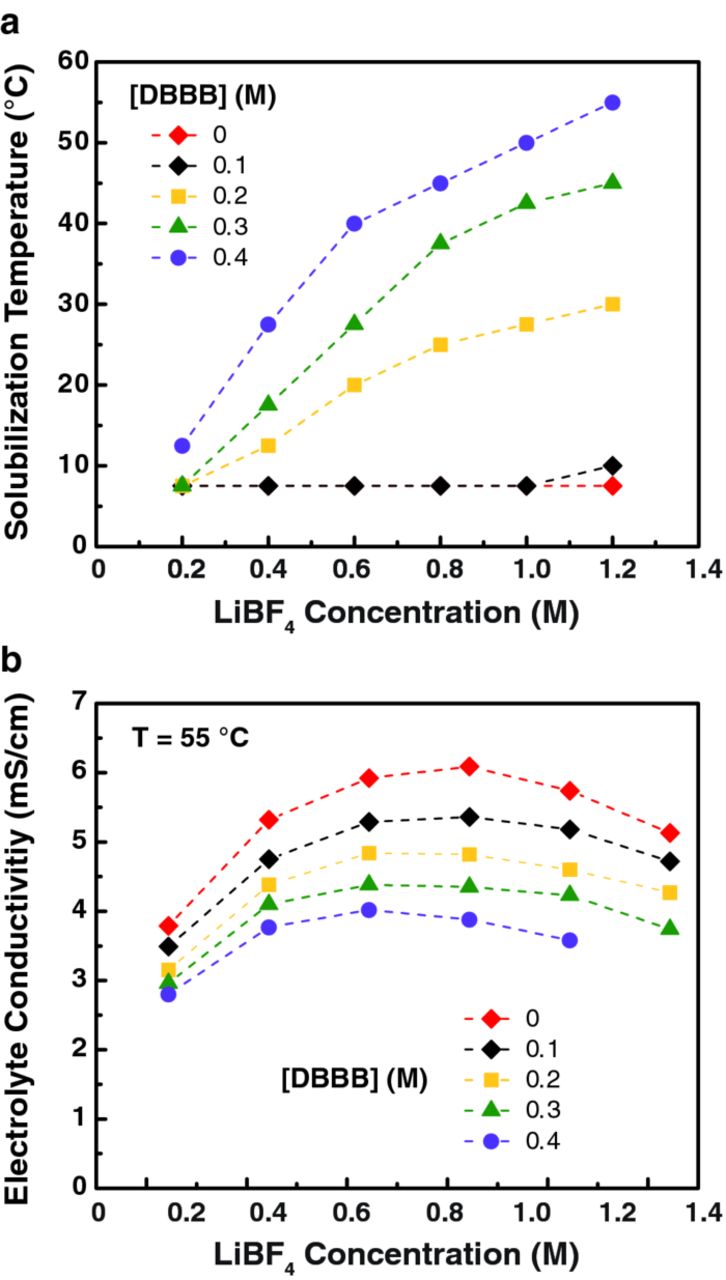
Figure 3. (a) The temperature required for complete component solubilization in the DBBB-LiBF4-PC electrolyte as a function of [DBBB] and [LiBF4]. (b) Electrolyte conductivity, measured at 55°C, as a function of [DBBB] and [LiBF4] in PC. Note that the maximum and minimum measurable temperatures are 55°C and 7.5°C, respectively.
DBBB-Salt-PC combinations
The solubility and conductivity of DBBB-Salt-PC electrolytes were measured with a series of lithium and sodium salts often employed in rechargeable batteries. Figure 4 shows the conductivity of a series of electrolytes based on (a) LiBF4, (b) LiPF6, (c) LiTFSI, (d) LiTf, (e) NaPF6, and (f) NaBF4 studied between 25 and 55°C and at increasing DBBB and salt concentrations at a constant ratio (1 : 2). The solution temperature was increased in an increment of 5°C. The curves that begin above room temperature approximate the lowest temperatures at which complete solubilization was observed. Figure 4a (DBBB-LiBF4-PC), represents the base case from Brushett et al.14 In general, the conductivity decreases in the following order: LiPF6 > LiTFSI > LiBF4 > LiTf, which is in good agreement with literature (without redox compound).30 At 25°C, LiTFSI provides slightly higher conductivity than LiPF6; but at elevated temperatures, the conductivity of LiPF6 is the highest. As expected, increasing temperature leads to both higher conductivity and solubility. The DBBB-salt solubility decreases in the following order: LiTFSI > LiTf > LiBF4 ∼ LiPF6, based on the samples that were soluble over the range of temperatures and concentrations. The conductivity increases up to [DBBB] : [salt] = 0.2 M : 0.4 M for LiBF4 and LiTf and up to 0.3 M : 0.6 M for LiPF6 and LiTFSI. The conductivity is reduced for all electrolytes at a ratio of 0.4 M : 0.8 M. Switching from Li-based to Na-based salts introduced some effect on the solution conductivity, as shown by comparing Figure 4a to 4f and Figure 4b to 4e. When shifting from LiBF4 to NaBF4, a large reduction in conductivity was observed. In contrast, a small improvement was observed when switching from LiPF6 to NaPF6. At higher temperatures, the solution conductivity of NaPF6 tends to plateau. The maximum conductivity for NaPF6, LiPF6, and LiTFSI is at a ratio of 0.3 M : 0.6 M, for LiBF4 between 0.2 M : 0.4 M and 0.3 M : 0.6 M, for LiTf, 0.2 M : 0.4 M and for NaBF4, 0.1 M : 0.2 M. While LiPF6 and NaPF6 show the highest conductivities at elevated temperatures, LiTFSI shows the highest conductivity and the highest DBBB : salt molar ratio at 25°C.

Figure 4. Electrolyte conductivity as a function of temperature and salt type (a) LiBF4, (b) LiPF6, (c) LiTFSI, (d) LiTf, (e) NaPF6 and (f) NaBF4 for various total concentrations of DBBB and salt, at a constant ratio (1:2), in PC.
The impact of linear carbonates
LiPF6 was employed, as the salt, for further studies on the effect of linear carbonate solvents, specifically DEC and DMC. Table I summarizes the conductivity of various concentrations of LiPF6 and DBBB in either DMC or DEC at 25°C. At all concentrations, the solution conductivity is higher in DMC. Higher salt concentrations give higher conductivity; but increasing DBBB concentrations lead to lower conductivity. The highest solution conductivity obtained is 3.47 mS/cm at 25°C for [DBBB] : [LiPF6] = 0.8 M : 0.5 M in DMC. This result represents an improvement compared to electrolytes based on PC alone. Indeed, similar conductivities were observed for both LiPF6 in PC (3.69 mS/cm) and for LiTFSI in PC (4.04 mS/cm) but at markedly lower concentrations: [DBBB] : [LiPF6] = 0.2 M : 0.4 M and [DBBB] : [LiTFSI] = 0.3 M : 0.6 M, respectively (Figures 4b and 4c). However, note that DBBB concentrations greater than the salt concentration may be undesirable as, during charging (DBBB oxidation), the electrolyte capacity could be limited by the salt concentration (i.e., counter-ion availability). Beyond single component linear solvent systems, the effect of the mixture of DMC and DEC on the LiPF6 based electrolyte was investigated as well. [DBBB] : [LiPF6] was fixed at 0.4 M : 0.8 M and 0.6 M : 0.6 M. At these concentrations, the electrolyte is not fully soluble at 25°C if only cyclic carbonate solvents (i.e., PC, EC) are used but are soluble in linear carbonate solvents (i.e., DEC, DMC). Figure 5 shows the linear shift in conductivity as a function of DEC-DMC ratios for the two DBBB-LiPF6 systems. The electrolyte conductivity is a function of the salt concentration, the viscosity, and the dielectric constant. Both linear carbonate solvents have similar dielectric constants (2.805 and 3.107 for DEC and DMC, respectively), but different viscosities (0.75 and 0.59 cP at 25°C for DEC and DMC, respectively).27 Thus increasing the DMC concentration results in a reduction in solution viscosity and can explain the behaviors seen in the linear mixing at both concentrations tested.
Table I. Electrolyte conductivity (mS/cm) of various concentrations of LiPF6 and DBBB in a linear solvent, DMC or DEC. Here, n.s. represents not soluble. All measurements were taken at 25°C.
| [DBBB] (M) in DMC | [DBBB] (M) in DEC | |||||||||
|---|---|---|---|---|---|---|---|---|---|---|
| [LiPF6] (M) | 0.5 | 0.6 | 0.7 | 0.8 | 0.9 | 0.5 | 0.6 | 0.7 | 0.8 | 0.9 |
| 0.6 | 2.34 | 2.08 | 1.44 | 1.20 | 1.20 | 1.02 | 0.92 | 0.77 | 0.67 | n.s. |
| 0.8 | 3.47 | n.s | n.s. | n.s. | n.s. | 1.49 | 1.47 | 1.28 | n.s. | n.s. |
| 1.0 | n.s. | n.s. | n.s. | n.s. | n.s. | 1.74 | n.s. | n.s. | n.s. | n.s. |
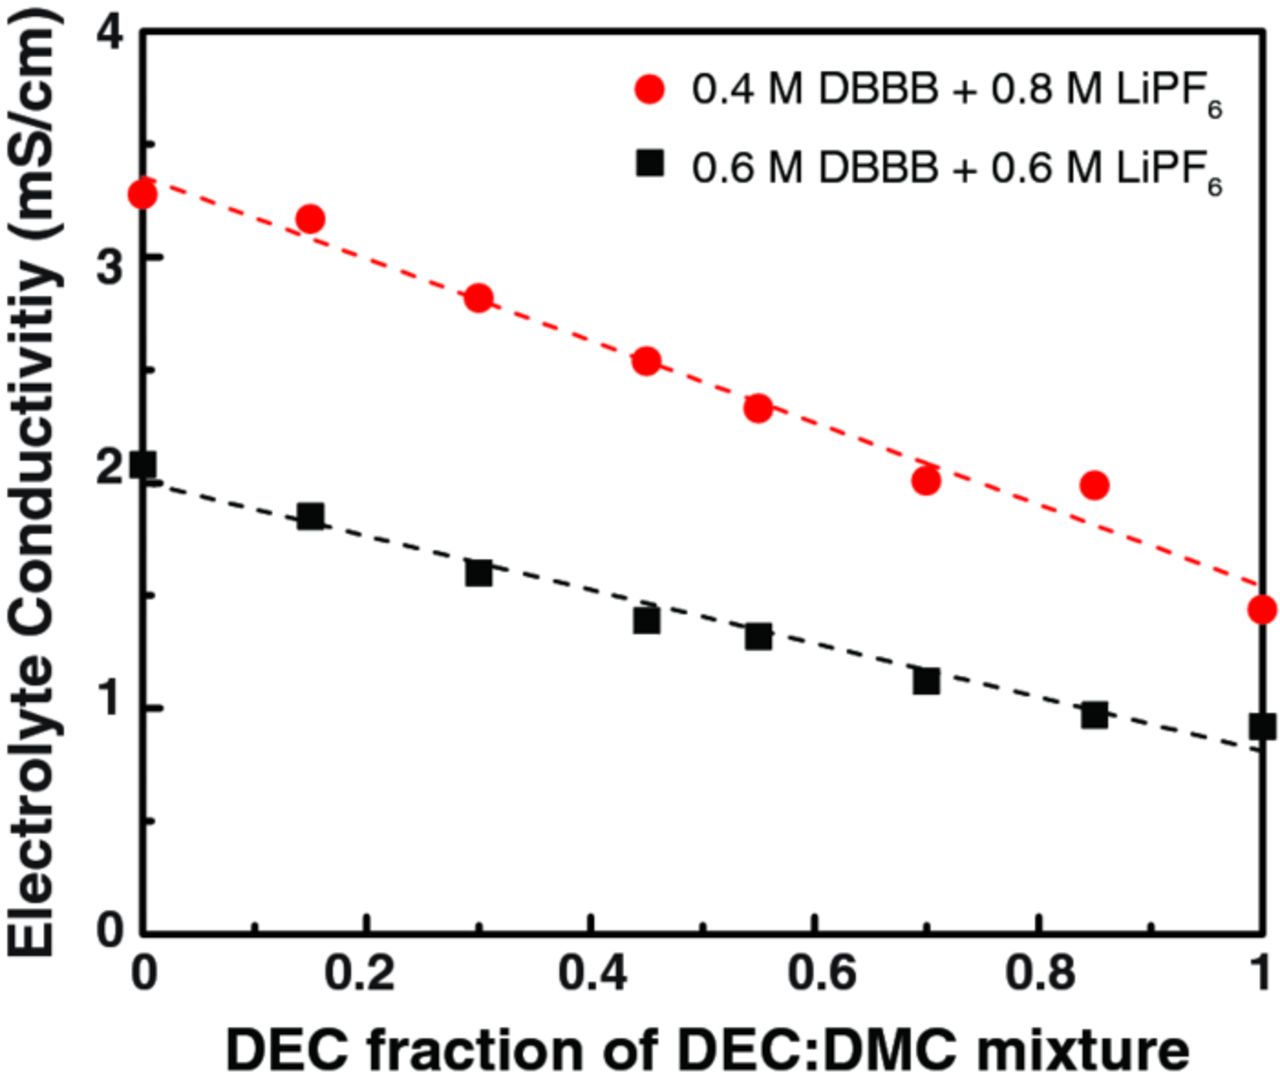
Figure 5. Electrolyte conductivity for two different DBBB + LiPF6 combinations with varying mole fractions of DEC : DMC. All measurements were taken at 25°C.
The impact of mixed cyclic and linear solvents
The effect of mixing cyclic and linear solvents was investigated using LiBF4 and LiPF6 without any redox species to determine whether conductivity could be improved. Indeed, many LIB electrolytes employ mixed solvents that are tailored to enhance cell performance or enable the solubilization of additives such as redox shuttles for overcharge protection.27,31–36 Figure 6 shows the conductivity at 25°C for the salts in each solvent and in the mixture of cyclic : linear solvents at a mole fraction ratio of 0.15 : 0.85. The highest conductivity value (11.1 mS/cm) was obtained for 1 M LiPF6 in EC : DMC (0.15 : 0.85). The conductivity values of LiPF6 in EC : DMC, PC : DMC and EC : DEC are in agreement with previous reports.33,37 Moreover, as previously reported, lower conductivity values were obtained for 1 M LiBF4 in EC : DMC and in EC : DEC.38 The conductivity is higher for mixtures of EC : DMC compared to PC : DMC due to the higher dielectric constant of EC as compared to PC, resulting in an increased degree of ionic dissociation of Li salts.27,33 Moreover, synergistic effects of binary solvent mixtures were observed as evidenced by higher conductivities than would be expected from the relative mole fraction contribution of each pure solvent. For LiPF6 the conductivity decreases in the following order:

For LiBF4 the conductivity decreases in the following order:

The effect of mixing cyclic and linear solvents in the presence of DBBB was then investigated using LiPF6 as the salt. Two concentration ratios, [DBBB] : [LiPF6] = 0.6 M : 0.6 M and 0.4 M : 0.8 M (Table II), were investigated with varying cyclic : linear solvent mole fractions. At [DBBB] : [LiPF6] = 0.6 M : 0.6 M, the DBBB + salt mixture is not soluble at 25°C when PC or EC mole fraction is greater than 0.15. However, at [DBBB] : [LiPF6] = 0.4 M : 0.8 M, solubility can be maintained over higher cyclic to linear solvent mole fraction ratios. The greatest improvement to the conductivity was found when using EC : DMC. The highest solution conductivity (4.54 mS/cm) was obtained at a mole fraction of EC : DMC = 0.15 : 0.85 and [DBBB] : [LiPF6] = 0.6 M : 0.6 M, which is a marked improvement compared to the same concentration of DBBB and LiPF6 in DMC alone (2.08 mS/cm).
Table II. Electrolyte conductivity (mS/cm) of DBBB and LiPF6 in binary mixtures of cyclic : linear solvents of three different mole fractions. Total active species and salt concentration is maintained at 1.2 M. Here, n.s. represents not soluble. All measurements were taken at 25°C.
| 0.6 M DBBB + 0.6 M LiPF6 | 0.4 M DBBB + 0.8 M LiPF6 | ||||||
|---|---|---|---|---|---|---|---|
| Solvents | 0.0:1.0 | 0.15:0.85 | 0.30:0.70 | 0.0:1.0 | 0.15:0.85 | 0.30:0.70 | 0.45:0.55 |
| PC : DMC | 2.08 | 4.07 | n.s. | 3.28 | 2.78 | 3.25 | 3.35 |
| PC : DEC | 0.92 | 1.92 | n.s. | 1.44 | 2.73 | 3.33 | 3.93 |
| EC : DMC | 2.08 | 4.54 | n.s. | 3.28 | 3.3 | 3.6 | n.s. |
| EC : DEC | 0.92 | 2.15 | n.s. | 1.44 | 2.99 | n.s. | n.s. |
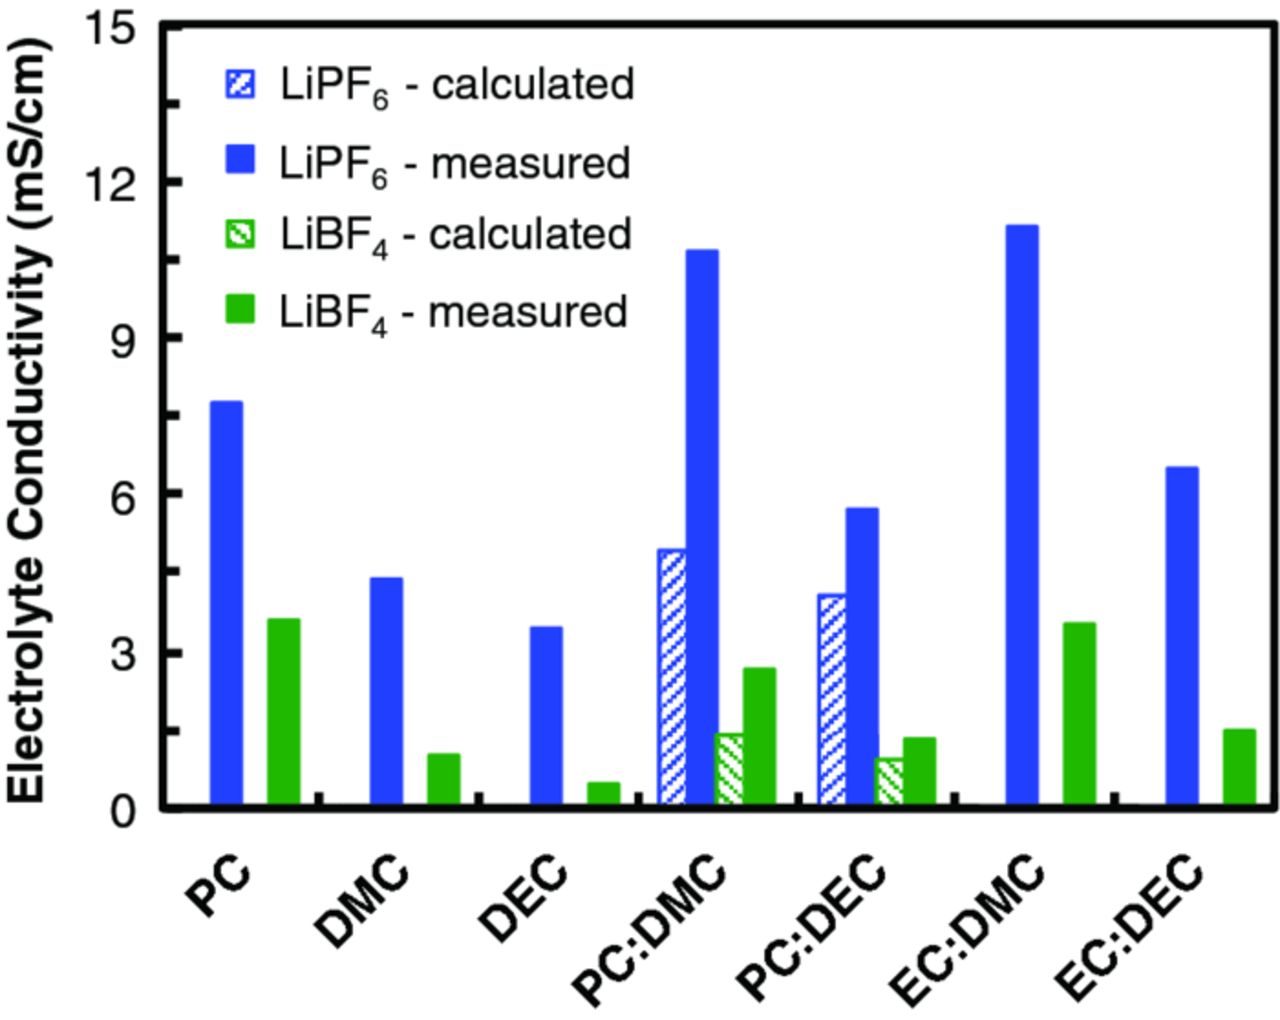
Figure 6. Conductivity of electrolytes comprised of 1 M LiBF4 or 1 M LiPF6 in a single cyclic or linear carbonate solvent or binary mixtures of carbonate solvents. For all the binary mixtures, the cyclic : linear solvent mole fraction is 0.15 : 0.85. The calculated data for binary mixture is based on the conductivity measured for individual solvent, weighted for 0.15 : 0.85 mole fraction ratio of each solvent. All measurements were taken at 25°C.
We further investigated the solution conductivity of various [DBBB] : [LiPF6] ratios in binary solvent mixtures consisting of the best performing carbonate solvents: PC or EC, and DMC (Figure 7). In general, electrolyte conductivity increases with increasing cyclic carbonate fraction. The highest conductivity was seen for the mixture EC : DMC = 0.45 : 0.55 with [DBBB] : [salt] of = 0.3 M : 0.6 M. However, this aforementioned electrolyte required a slight elevated temperature at 32.5°C to be fully solubilized. All the other mixtures are soluble below 25°C.
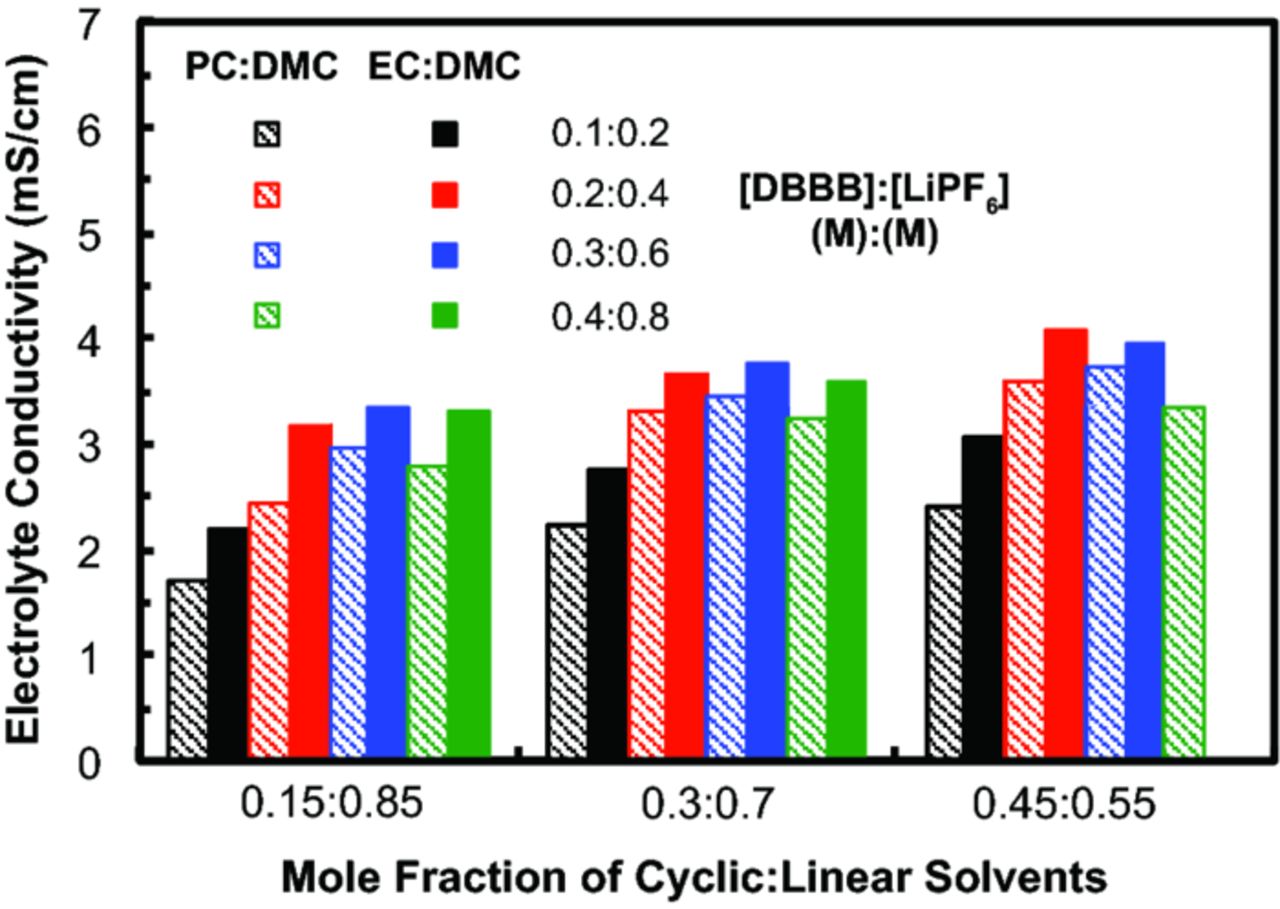
Figure 7. Electrolyte conductivity as a function of varying [DBBB] : [LiPF6], at a constant ratio (1:2), in two different binary carbonate solvent mixtures with varying cyclic : linear mole fractions. Note that [DBBB] : [LiPF6] = 0.4 M : 0.8 M was not soluble in EC : EMC (0.45 : 0.55). All measurements were taken at 25°C.
Taking the best carbonate mixtures, PC : DMC and EC : DMC, a ternary mixture of solvents (PC : EC : DMC) was investigated using [DBBB] : [LiPF6] = 0.6 M : 0.6 M. The mole fraction of cyclic carbonates was kept between 0.15 and 0.4 to avoid the aforementioned solubility issues (Figure 7). In that region, the mixture should be liquid in the absence of DBBB at -3°C.39 The solution conductivity at 55°C is presented in Figure 8a and the minimum temperature for solubility in Figure 8b. At temperatures lower than 25°C, full solubility could only be maintained at 4 coordinates (indicated by the green dots). The maximum conductivity at 25°C (5.25 mS/cm) was found at a mole fraction of PC : EC : DMC = 0.08 : 0.12 : 0.8.
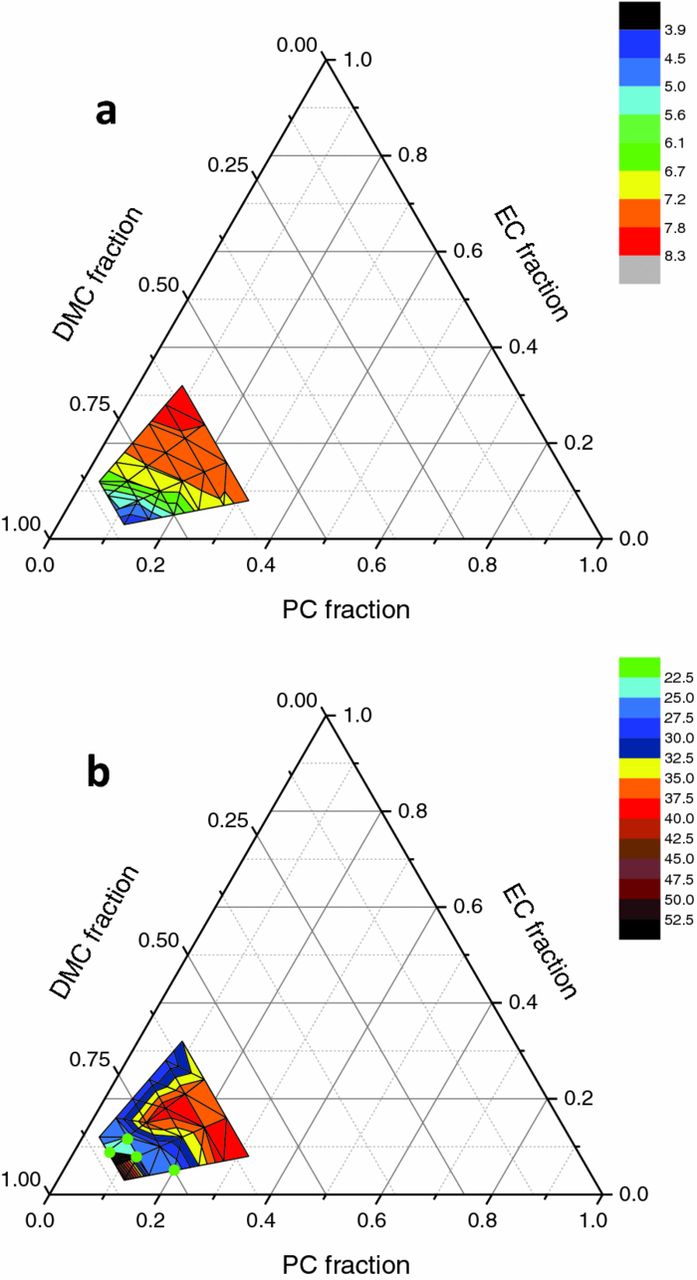
Figure 8. (a) Electrolyte conductivities (mS/cm), measured at 55°C, and (b) required temperatures (°C) for full solubilization of 0.6 M DBBB and 0.6 M LiPF6 in various PC : DMC : EC solvent fractions. The maximum and minimum measurable temperatures are 55°C and 7.5°C, respectively.
Impact of mixing Li salts in binary cyclic and linear carbonate solvents
In addition to mixing solvents, the impact of mixing salts was studied to determine any synergistic effects for solubility and conductivity. Three lithium ion salts, LiPF6, LiBF4, and LiTFSI, were investigated in 4 different binary mixtures of solvents (PC : DMC, PC : DEC, EC : DMC, EC : DEC) at a constant mole fraction ratio of 0.15 : 0.85. The total salt concentration is 0.8 M with 0.4 M DBBB as the active species. To determine if any promotional or deleterious effects occur when combining salts, the measured conductivities were compared to those calculated from the conductivity of each single salt and its fraction in the mixture. A negative effect on the conductivity was observed for all salt mixtures in PC : DMC and PC : DEC (plain text in Table III). Improvements in conductivity were seen with the combination of LiPF6 + LiTFSI in EC : DMC and EC : DEC as well as of LiBF4 + LiPF6 in EC : DMC (bold text in Table III). The remaining values (italicized text in Table III) were similar to those expected from calculations. The highest conductivity (5.23 mS/cm) obtained was for the mixture of LiPF6 and LiTFSI in EC : DMC. In general, the addition of LiTFSI improved component solubility within the electrolyte; Table IV shows the minimum temperature required for the solubilization of various electrolyte combinations comprised of 0.4 M DBBB, 0.8 M salt, in a range of binary cyclic : linear solvents. For 0.8 M LiPF6 in 0.4 M DBBB, the electrolytes appear cloudy, indicating a lack of solubility. However, upon the presence of LiTFSI in binary salt mixtures (with LiPF6 or LiBF4), the electrolyte solubility improved in all solvent mixtures except for EC : DEC.
Table III. Ionic conductivity (mS/cm) of electrolytes consisting of 0.4 M DBBB, 0.8 M LiPF6, LiTFSI, LiBF4, or binary salt combinations thereof; and different cyclic : linear solvent combinations at a constant mole fraction of 0.15 : 0.85. The conductivity values indicated in parentheses are the calculated values for each binary salt combination based on the average of the two single salt conductivities. The bold, plain, and italicized values represent where the measured conductivities are higher, lower, and the same as these calculated values. All measurements were taken at 25°C.
| 0.4 M DBBB + 0.8 M salt | 0.4 M DBBB + 0.4 M salt #1/0.4 M salt #2 | |||||
|---|---|---|---|---|---|---|
| Solvents | LiPF6 | LiBF4 | LiTFSI | LiPF6/LiTFSI | LiBF4/LiPF6 | LiBF4/LiTFSI |
| PC:DMC | 2.78 | 1.37 | 3.42 | 2.74 (3.10) | 1.46 (2.08) | 0.82 (2.40) |
| PC:DEC | 2.73 | 0.55 | 2.17 | 1.21 (2.45) | 0.59 (1.64) | 0.51 (1.36) |
| EC:DMC | 3.3 | 1.54 | 3.93 | 5.23 (3.62) | 3.68 (2.42) | 2.72 (2.74) |
| EC:DEC | 2.99 | 0.7 | 2.43 | 3.13 (2.71) | 1.89 (1.85) | 1.64 (1.57) |
Table IV. Minimum temperature required for solubilization (°C) for various electrolyte combinations comprised of 0.4 M DBBB, 0.8 M LiPF6, LiTFSI, LiBF4, or binary salt combinations thereof in a range of binary cyclic : linear solvents at a constant mole fraction of 0.15 : 0.85. Here, n.s. represents not soluble. The maximum and minimum measurable temperatures are 40°C and 0°C, respectively.
| 0.4 M DBBB + 0.8 M salt | 0.4 M DBBB + 0.4 M salt #1/0.4 M salt #2 | |||||
|---|---|---|---|---|---|---|
| Solvents | LiPF6 | LiBF4 | LiTFSI | LiPF6/LiTFSI | LiBF4/LiPF6 | LiBF4/LiTFSI |
| PC : DMC | n.s. | 17.5 | 15 | 0 | 40 | 7.7 |
| PC : DEC | n.s. | 0 | 0 | 0 | 0 | 0 |
| EC : DMC | n.s. | 22.5 | 20 | 0 | >40 | 2.8 |
| EC : DEC | n.s. | 0 | 0 | 5.1 | 0 | 27.5 |
Electrochemical testing
Based on the results from the combinatorial screening, the electrochemical behavior of DBBB at different concentrations was investigated in 0.6 M LiTFSI/PC via voltammetric analysis using a 3-mm glassy carbon electrode and an 11-μm carbon fiber ultramicroelectrode. As shown in Figure 4c, for PC-based electrolytes, DBBB-LiTFSI represents the best combination of high active species concentration and ionic conductivity at room temperature. Figure 9 shows representative cyclic voltammograms, performed on the macro-electrode, of the redox compound over a range of concentrations, specifically 0.005 M, 0.1 M, 0.2 M, and 0.3 M DBBB dissolved in 0.6 M LiTFSI/PC, at scan rates from 0.005 to 0.1 V/s. The key electrochemical parameters derived from these CVs are shown in Table V. At 0.005 M (Figure 9a and 9b), DBBB displays well-defined oxidation and reduction peaks with a redox potential of 3.957 ± 0.001 V based on the average of the anodic and cathodic peak potentials [(Epa + Epc)/2)]. The peak separations (ΔE = Epa - Epc) are consistently at ca. 65 mV for all scan rates, which is very close to the theoretical 61 mV (at 35°C) expected for a reversible redox process. Note that the 4 mV deviation may include the contribution from uncompensated resistances, which are particularly impactful in non-aqueous electrolytes. Further, the observed ratio of the oxidative (ipa) and the reductive (ipc) peak current is near unity indicating a chemically reversible system. From Randles-Sevcik analysis, diffusion coefficients of 1.529 × 10⁻⁶ cm2/s and 1.540 × 10⁻⁶ cm2/s are estimated for DBBB and DBBB+, respectively, which are in good agreement with previous reports for similar redox active organic compounds.12,14 The observed behavior is similar to previous reports of ferrocene, a well-established reversible standard, in carbonate solvents.40,41
Table V. Electrochemical parameters of DBBB at 0.005 M, 0.1 M, 0.2 M, and 0.3 M in 0.6 M LiTFSI/PC obtained with a 3 mm glassy carbon electrode (GCE). Here, ΔEp is the peak separation, Epa is the anodic peak position, Epc is the cathodic peak position; ipa is the anodic peak current, ipc is the cathodic peak current; Danodic is the diffusion coefficient of the neutral DBBB, Dcathodic is the diffusion coefficient of the oxidized DBBB, and μ is the dynamic viscosity of the solution. The values shown from ΔEp, (Epa+Epc)/2, and ipa/ipc are all taken at a scan rate of 0.1 V/s. All measurements were performed in an Ar-filled glove box.
| 3 mm Glassy Carbon Electrode | ||||||
|---|---|---|---|---|---|---|
| [DBBB] | ΔEp | (Epa +Epc)/2 | ipa /ipc | Danodic | Dcathodic | μ |
| M | mV | V | – | × 10−6 cm2/s | × 10−6 cm2/s | cP |
| 0.005 | 66 ± 2 | 3.957 ± 0.001 | 0.996 ± 0.008 | 1.529 ± 0.021 | 1.540 ± 0.034 | 5.767 ± 0.067 |
| 0.1 | 167 ± 3 | 3.961 ± 0.001 | 0.964 ± 0.003 | 0.985 ± 0.019 | 1.040 ± 0.019 | 6.133 ± 0.033 |
| 0.2 | 262 ± 13 | 3.964 ± 0.001 | 0.937 ± 0.003 | 0.648 ± 0.020 | 0.717 ± 0.020 | 6.567 ± 0.033 |
| 0.3 | 305 ± 13 | 3.966 ± 0.002 | 0.864 ± 0.038 | 0.477 ± 0.006 | 0.615 ± 0.041 | 7.133 ± 0.120 |
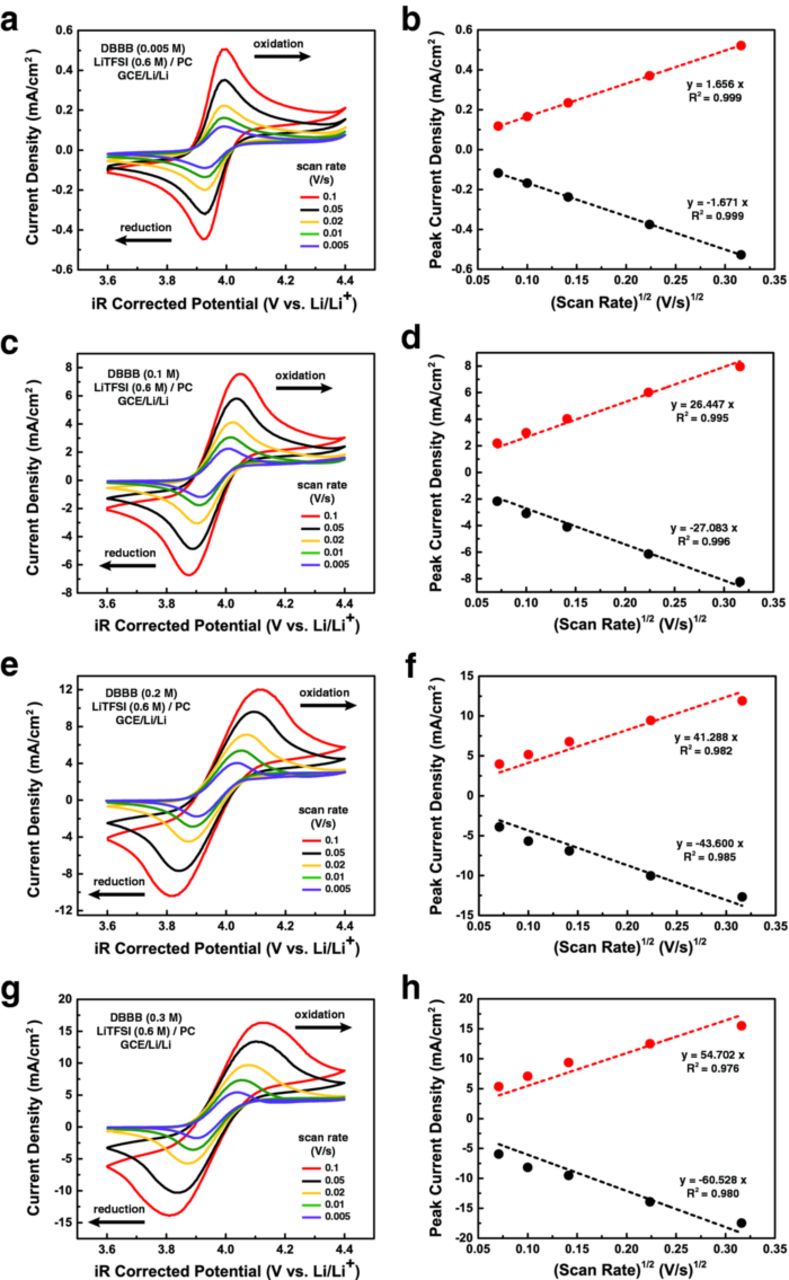
Figure 9. Cyclic voltammograms of DBBB at (a) 0.005 M, (c) 0.1 M, (e) 0.2 M, and (g) 0.3 M in 0.6 M LiTFSI/PC electrolyte at scan rates of 0.005, 0.01, 0.02, 0.05, and 0.1 V/s, and the corresponding Randles – Sevcik plots shown in (b), (d), (f), and (h), respectively. All experiments were performed in a GCE/Li/Li cell at box temperature (35°C).
While CV analysis at low active species concentrations is useful for probing intrinsic electrochemical properties, studies at high concentrations, closer to what would be required for practical RFBs, are necessary to confirm metrics of performance and longevity. Figure 9c–9h show the CVs and corresponding Randles-Sevcik plots of higher DBBB concentrations at 0.1 M, 0.2 M, and 0.3 M, respectively, dissolved in 0.6 M LiTFSI/PC. With the increase of DBBB concentration, while the oxidation and reduction peaks are broadened (particularly at high scan rates), the redox potential shows minimal shift in the positive direction. Given the higher currents and reduced solution conductivity, as compared to the lower concentration study, the impact of uncompensated resistances is magnified as shown in the deviation from the theoretical linear relationship in Randles-Sevcik analysis (particularly at 0.05 and 0.1 V/s). The ipa/ipc ratio and the directly proportional DDBBB/DDBBB+ ratio increasingly deviate from unity at higher DBBB concentrations. While the calculated diffusivity values for DBBB and DBBB+ decrease with increasing concentration and electrolyte viscosity, these changes do not follow the expected inverse proportionality (D vs. 1/μ) predicted by the Stokes-Einstein equation.
As mentioned above, at higher DBBB concentrations, the uncompensated resistance increasingly impacts electrochemical measurements and convolutes the analysis. To this end, we employed the carbon fiber ultramicroelectrode (UME) to probe changes in the electrochemical parameters of the redox reaction as a function of DBBB concentration under near iR-free conditions. Figure 10 shows representative steady-state voltammograms (cathodic sweeps) of DBBB at 0.005 M, 0.1 M, 0.2 M, and 0.3 M in 0.6 M LiTFSI/PC with the corresponding parameters summarized in Table VI. The half-wave potentials (E1/2) obtained by UME are consistent with the redox potential values obtained with the macro-scale electrode, validating the results from both techniques. The exchange current density (j0), standard rate constant (k0) and transfer coefficient (α), which reflect the intrinsic kinetics of the reaction, were obtained from Butler–Volmer analysis. As the Allen and Hickling form of the Butler-Volmer equation is only applicable for quasi-reversible systems, kinetic data could not be extracted from the 0.005 M DBBB electrolyte which appears practically reversible (see Table V).42,43 While, as expected, the exchange current density increases with increasing DBBB concentration, the observed rate constant slightly decreases. Note that a three-fold increase in active species concentration (0.1 M → 0.3 M) results in ∼40% decrease in k0 suggesting that high electrode reaction rates may be possible in non-aqueous cells.44 The transfer coefficient slightly decreases with the increase of DBBB concentration, which might be attributed to the stronger interaction between the oxidized form of the redox species (DBBB+) and the anion of the electrolyte (TFSI−) at higher DBBB concentrations.41 The diffusion coefficient (D0) of the neutral DBBB is derived from the steady-state current plateau of the UME scan (see Figure 10). As predicted by the Stokes-Einstein equation, the decrease in measured diffusivity, with higher DBBB concentration, is inversely proportional to the increase in electrolyte viscosity (μ). The changes in these properties are relatively minor (∼23%) despite a two order of magnitude increase in DBBB concentration. Note the discrepancies between the diffusivity values measured using the UME and the disk electrode, particularly at higher DBBB concentrations. This observation is likely due to the growing influence of secondary effects (e.g., migration, local viscosity changes, etc.) on the macro-electrode measurements which will be reported in due course. Understanding the sensitivity of these fundamental parameters to concentration may enable more accurate electrochemical models of cell performance and durability.
Table VI. Electrochemical parameters of DBBB at 0.005 M, 0.1 M, 0.2 M, and 0.3 M in 0.6 M LiTFSI/PC obtained with an 11 μm carbon fiber ultramicroelectrode (UME). Here, E1/2 is the half-wave potential, j0 is the exchange current density (normalized by the nominal surface area of UME), k0 is the standard rate constant, α is the transfer coefficient, D0 is the diffusion coefficient of neutral DBBB, and μ is the dynamic viscosity of the solution. All measurements were performed in an Ar-filled glove box.
| 11 μm Carbon Fiber Ultramicroelectrode | ||||||
|---|---|---|---|---|---|---|
| [DBBB] | E1/2 | j0 | k0 | α | D0 | μ |
| M | V | mA/cm2 | × 10−4 cm/s | – | × 10−6 cm2/s | cP |
| 0.005 | 3.960 ± 0.002 | – | – | – | 1.441 ± 0.007 | 5.767 ± 0.067 |
| 0.1 | 3.961 ± 0.001 | 2.625 ± 0.152 | 2.721 ± 0.157 | 0.666 ± 0.040 | 1.278 ± 0.005 | 6.133 ± 0.033 |
| 0.2 | 3.963 ± 0.001 | 3.942 ± 0.107 | 2.043 ± 0.056 | 0.568 ± 0.008 | 1.187 ± 0.010 | 6.567 ± 0.033 |
| 0.3 | 3.965 ± 0.001 | 4.986 ± 0.368 | 1.723 ± 0.127 | 0.536 ± 0.021 | 1.106 ± 0.008 | 7.133 ± 0.120 |
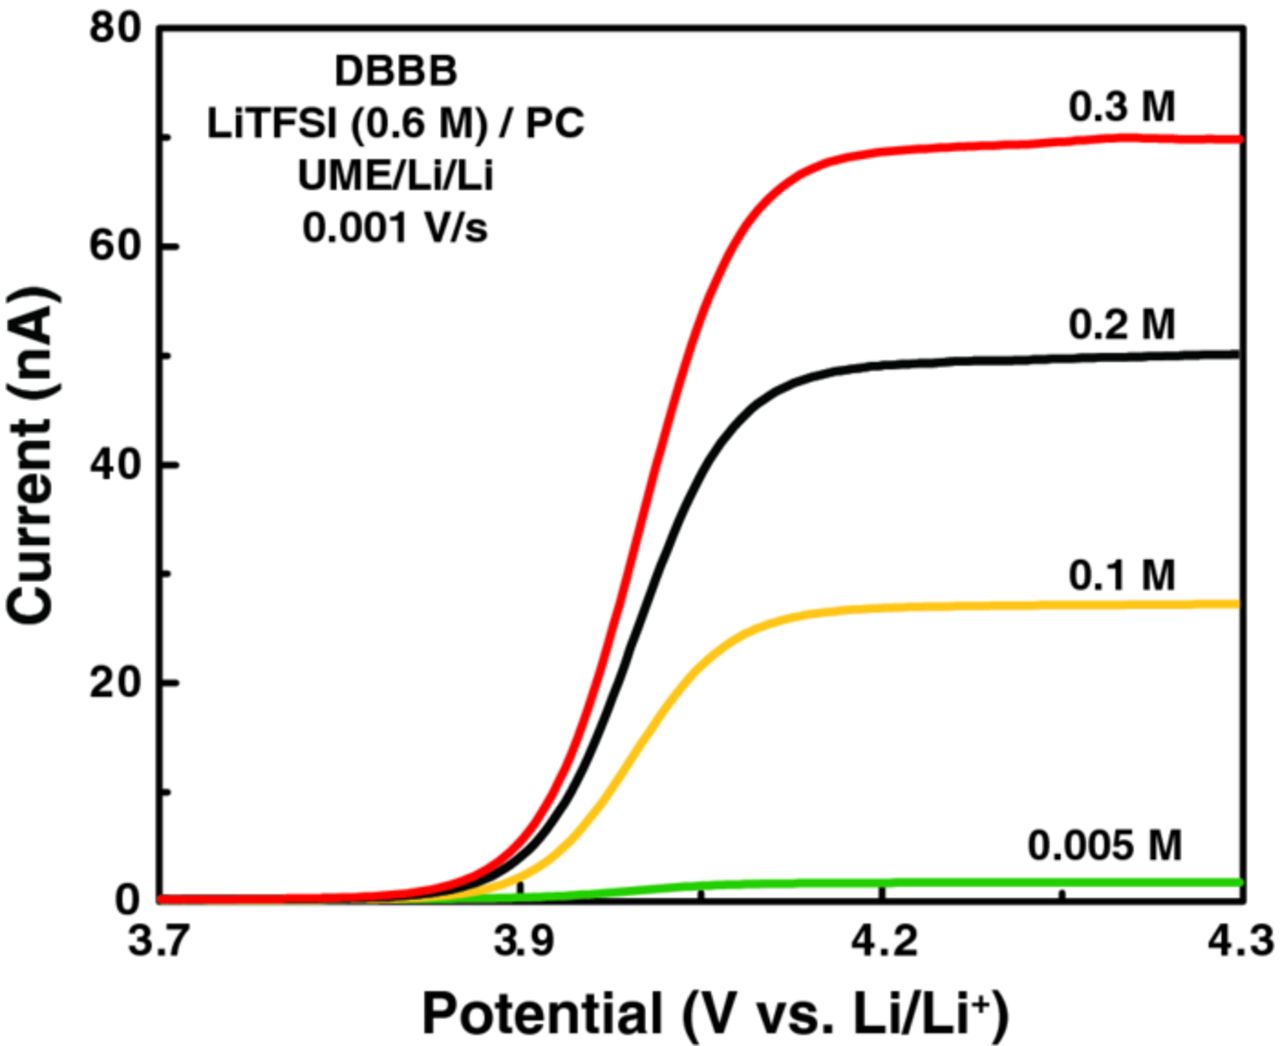
Figure 10. Steady state voltammograms of DBBB at 0.005 M, 0.1 M, 0.2 M, and 0.3 M in 0.6 M LiTFSI/PC electrolyte at scan rates of 0.001 V/s. All experiments were performed in a carbon fiber UME/Li/Li cell at box temperature (35°C).
Conclusions
Here, we report on the use of an automated electrolyte synthesis and characterization platform for combinatorial screening of electrolytes consisting of DBBB, various alkali ion salts, and carbonate solvents, with an overarching goal of improving electrolyte conductivity and DBBB solubility. In general, increasing DBBB concentration lowered electrolyte conductivity and increased temperature requirements for full solubilization of electrolyte components. Binary and ternary mixtures of linear and cyclic carbonates were found to improve both DBBB solubility and electrolyte conductivity. The highest solution conductivity at 25°C was obtained for a ternary mixture of PC : EC : DMC (0.08 : 0.12 : 0.8) at 0.6 M DBBB and 0.6 M LiPF6 (5.25 mS/cm) and also for a binary mixture of EC : DMC (0.15 : 0.85) at 0.4 M DBBB and 0.4 M LiPF6 + 0.4 M LiTFSI (5.23 mS/cm). These ionic conductivity values represent a two-fold improvement at twice the total species concentration (active species + salt) when compared to the base case electrolyte, LiBF4 in DBBB in PC (2.59 mS/cm at [DBBB] : [LiBF4] = 0.2 M : 0.4 M). Moreover, the addition of LiTFSI as a salt (or co-salt) was shown to improve both ionic conductivity and DBBB solubility in the electrolyte. The electrochemical properties of DBBB-based electrolytes (LiTFSI/PC) were investigated as a function of active species concentration using a glassy carbon electrode and a carbon fiber UME. Of particular note, the measured properties (k0 and D0) decreased marginally with orders of magnitude increase in active species concentration. Developing a better understanding of these trends will enable more accurate modeling of the high concentration redox electrolytes required for practical non-aqueous flow batteries. Building on this work, future studies will focus on integrating electrochemical techniques into the platform and extending the investigation to other electrolyte families and redox active species.
Acknowledgments
This work was supported as part of the Joint Center for Energy Storage Research, an Energy Innovation Hub funded by the U.S. Department of Energy, Office of Science, Basic Energy Sciences. The submitted manuscript has been created by UChicago Argonne, LLC, Operator of Argonne National Laboratory ("Argonne"). Argonne, a U.S. Department of Energy Office of Science Laboratory, is operated under Contract No. DE-AC02–06CH11357. DBBB, also referred to as ANL-RS2, was synthesized by Krzysztof Pupek and Trevor Dzwiniel at Argonne's Materials Engineering Research Facility and was funded by DOE-EERE Office of Vehicle Technologies. F.R.B. was supported by a Director's Postdoctoral Fellowship. The authors thank Kyler Carroll (MIT), Emily Carino (MIT), Andrew Jansen (ANL), and Jun Chen (ANL) for stimulating discussions.