Abstract
The effects of electrolyte additive combinations containing vinylene carbonate (VC), ethylene sulfate (DTD), tris(trimethylsilyl) phosphate (TTSP) and tris(trimethylsilyl) phosphite (TTSPi) in Li[Ni1/3Mn1/3Co1/3]O2/graphite pouch cells have been investigated using the ultra high precision charger (UHPC) at Dalhousie University, electrochemical impedance spectroscopy (EIS), gas evolution measurements and long term cycling. The results show that combinations of electrolyte additives that act synergistically can be more effective than a single electrolyte additive (2%VC). These additive mixtures: reduce parasitic reactions at the positive electrode above 4.1 V compared to VC alone; improve coulombic efficiency, reduce charge end-point capacity slippage and also reduce impedance of the cells. A particularly useful additive combination is 2% VC + 1% DTD + 0.5% TTSP + 0.5% TTSPi.
Export citation and abstract BibTeX RIS

This is an open access article distributed under the terms of the Creative Commons Attribution 4.0 License (CC BY, http://creativecommons.org/licenses/by/4.0/), which permits unrestricted reuse of the work in any medium, provided the original work is properly cited.
Extending the life-time of Li-ion cells to 30–50 years for grid energy applications is one of the most challenging problems remaining for battery researchers. The use of electrolyte additives is one of the most effective and economical ways to improve the life-time of Li-ion cells.1,2 Commercial Li-ion cells often include several electrolyte additives that, apparently, work synergistically together. Burns et al. 3 recently showed the effects of up to five electrolyte additives in commercial Li-ion cells where cycle life was increased over five times compared to cells with only one additive and cell impedance was simultaneously reduced.
Our research group recently started to investigate the synergies between different additive combinations 4 using the Ultra High Precision Charger (UHPC) built at Dalhousie University. The use of additive combinations, consisting of vinylene carbonate (VC), one sulfur-containing additive (such as ethylene sulfate (DTD) or methylene methane disulfonate (MMDS)), as well as tris(trimethylsilyl) phosphate (TTSP) and/or tris(trimethylsilyl) phosphite (TTSPi) can lead to long-lived, safe Li[Ni1/3Mn1/3Co1/3]O2 (NMC111)/graphite cells with higher power capability, without having to trade off one for another.5 The structures of VC, DTD, TTSP and TTSPi are given in Figure 1. This report gives extensive details about the study of combinations of VC + DTD + TTSP + TTSPi in NMC111/graphite pouch cells.
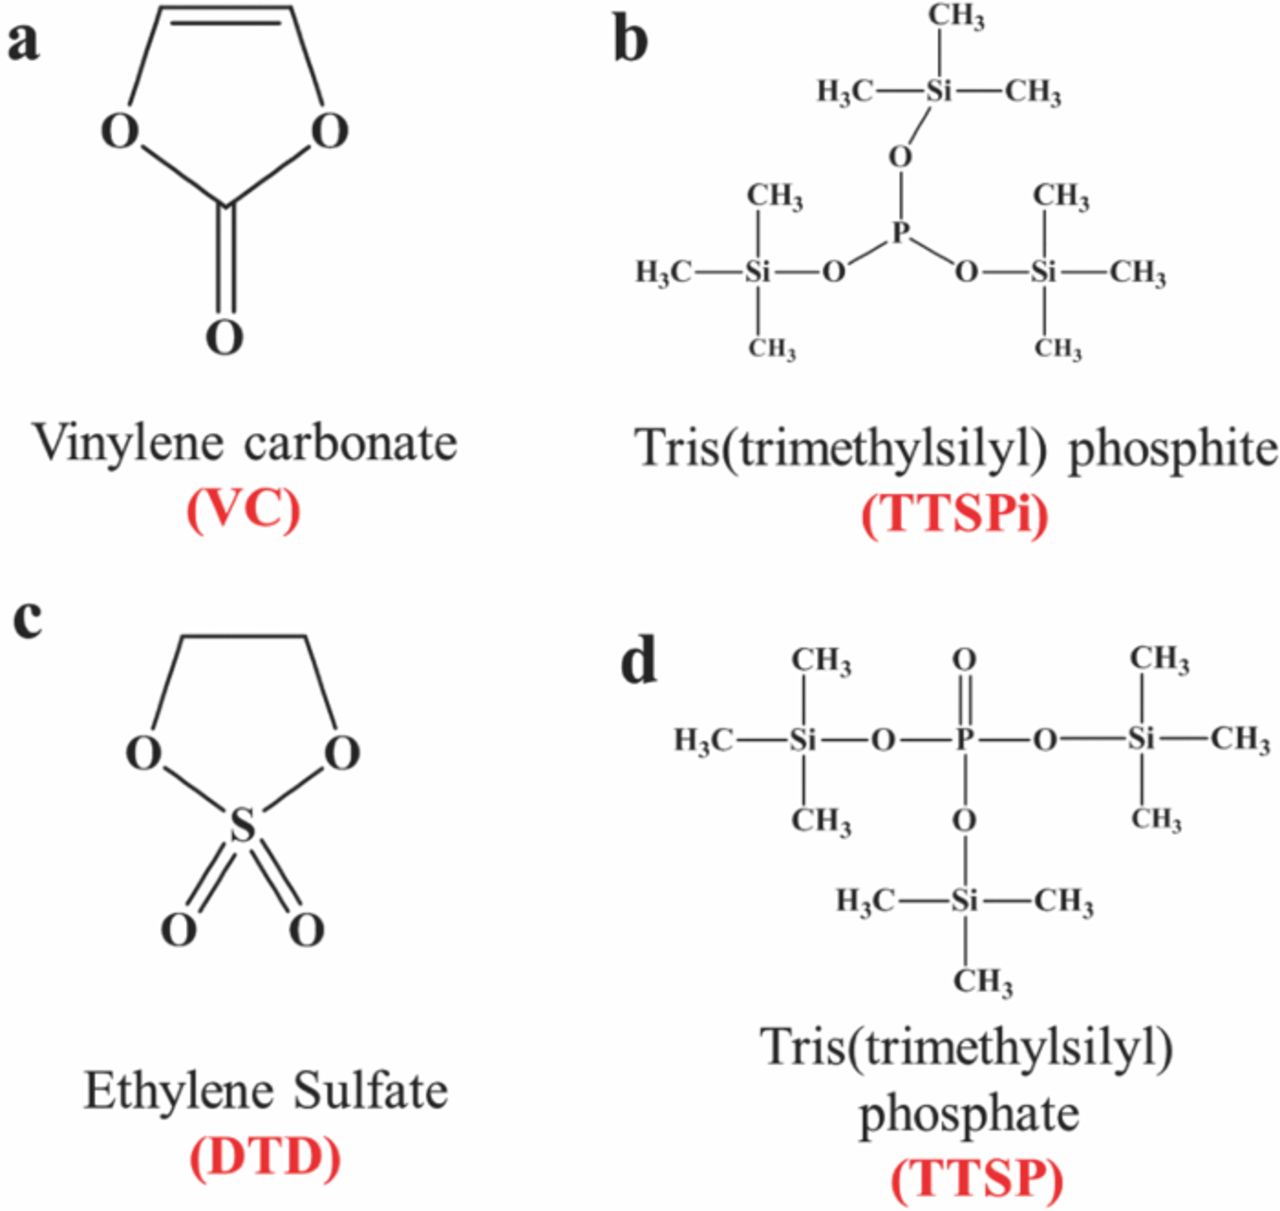
Figure 1. Chemical structures of (a) VC, (b) TTSPi, (c) DTD and (d) TTSP.
Experimental
Machine-made dry Li[Ni1/3Mn1/3Co1/3]O2 (NMC)/graphite pouch cells (402035 size, 220 mAh) were supplied by a reputable manufacturer (obtained from Whenergy, A-2, B zone, No. 50 Beijing Middle Road, Yantai, Shandong, PRC, 264006). The cells were vacuum sealed dry (no electrolyte) in China and shipped to Canada. Prior to electrolyte filling at Dalhousie University, cells were dried in a vacuum oven at 80°C for 14 h. Then the cells were transferred immediately to an argon-filled glove box for filling and vacuum sealing. The base electrolyte to which additives were added was 1 M LiPF6 in ethylene carbonate: ethyl methyl carbonate (EC:EMC, 3:7 wt.% ratio, BASF). According to our work in reference,4 2%VC alone in 1M LiPF6 EC:EMC (3:7 wt.% ratio) yielded good overall performance in CE, charge slippage and charge transfer resistance for Li-ion cells and was used as the "control" electrolyte here. Vinylene carbonate (VC, BASF, 99.97%), 1,3,2-dioxathiolane-2,2-dioxide (or ethylene sulfate, DTD, Sigma-Aldrich, 98%), tris(trimethlysilyl)phosphate (TTSP, TCI America, > 98%) and tris(trimethylsilyl)phosphite (TTSPi, TCI America, > 95%) were used as electrolyte additives. Duplicate cells were made for each concentration and additive to ensure repeatability of the measurements.
After filling with 0.9 g of electrolyte and vacuum sealing (MTI Corporation, MSK-115A) in an argon-filled glove box, a 24 h hold at 40.0 ± 0.1°C and 1.5 V were used to ensure complete wetting of the cell coil. The first charge (called the formation process here) was charging at 11 mA to 3.5 V. [Recent work by Aiken et al. 6 showed that all gas generated in formation for these electrolytes occurred before 3.5 V]. Following the formation process, cells were degassed in the glove box and vacuum sealed again. The total volume of gas generated in the cells during the formation and during cycling were measured using Archimedes' principle.6
Then cells were cycled using the UHPC between 2.8 and 4.2 V at 40 ± 0.1°C using currents corresponding to C/20 for 16 cycles where comparisons were made. After cycling on the UHPC, electrochemical impedance spectroscopy (EIS, Bio-Logic VMP3), with a 10 mV perturbation and a frequency range from 10 mHz to 100 kHz, was used to measure the combined charge transfer resistance (Rct) of both electrodes in each cell. Before the impedance tests, cells were charged to 3.8 V on a Maccor 4000 series charger and held at 3.8 V until the current dropped below the corresponding C/1000 current, so that all cells were measured under the same conditions. All impedance data were collected at 10. ± 0.1°C. After the EIS measurement, cells were put on a computer controlled charger (produced by Neware Technology Limited, Shenzhen, China) for another 500 cycles between 2.8 and 4.2 V at 40. ± 0.1°C using currents corresponding to C/2.2. Gas and EIS data was measured after these 500 cycles as well. Then the cells were put on a computer controlled charger (produced by E-One Moli Energy Canada Ltd.) for another 3 cycles between 2.8 and 4.2 V at 40. ± 0.1°C using currents corresponding to C/20 in order to perform the differential voltage (dV/dQ vs. Q) analysis. A homemade differential voltage (dV/dQ vs. Q) analysis software package 7 was used to investigate the causes of cell capacity loss with cycle number.
An automated storage system, built at Dalhousie University,8 was used to measure the self-discharge of cells stored under open circuit conditions. Cells were charged to 4.2 V on a Maccor 4000 series charger and held at 4.2 V until the current dropped below the corresponding C/1000 current, then cells were put on the automated storage system. The open circuit potential of each cell was monitored and automatically measured every 6 hours (for 500 hours) at a fixed temperature of 40. ± 0.1°C. After the storage test, EIS measurements were performed at 10. ± 0.1°C for all the cells at 3.8 V. After the EIS measurements, cells were aged at room temperature for about 1000 h at near 3.8 V. Then one cell from each pair (at 3.8 V) was cut open in the glove box, unrolled and each electrode was punched into 8 disc-shaped electrodes (double-sided, 1.54 cm2). Three positive symmetric coin cells, 3 negative symmetric coin cells and 2 full coin cells were assembled from the 8 punched positive and the 8 punched negative electrodes. For each symmetric coin cell, one polypropylene blown microfiber separator (BMF, 0.275 mm thickness, 3.2 mg/cm2, 3M Co.) was used. Coin cell hardware coated with Al by sputtering as well as Al spacer discs were used for the positive electrode symmetric coin cells in order to minimize hardware corrosion. After coin cell assembly, EIS measurements were performed at 10. ± 0.1°C for all coin cells within 3 hours.
Results and Discussion
Figures 2a, 2c and 2d show the Nyquist spectra of cells after storage, after UHPC cycling and after 500 cycles on the Neware cycler (same cells as the UHPC cells), respectively. The cells incorporated different additives or additive combinations as indicated in the legends. All these EIS spectra were collected when cells were at 3.8 V and 10 C. The charge transfer resistance (Rct), as marked in Figure 2a, was taken to be the diameter of the semicircles from the Nyquist plots. The width of the semi-circle is due to the sum of the positive and negative electrode charge transfer resistances. [Note: Different authors interpret impedance spectra of Li-ion cells in different ways. Our interpretation follows that of Atebamba et al.].9 It is important to minimize the width of this semi-circle to create cells with high rate capability. Some Li-ion battery researchers believe that adding more electrolyte additives to Li-ion cells causes a continual increase in cell impedance. However, Figures 2a, 2c and 2d show that this is not always the case, even after 500 cycles at 40°C (see Figure 2d). Some of the additive combinations have a total additive content of 5% and show lower Rct than cells with 2%VC alone. A comparison of Figures 2c and 2d shows that all EIS spectra except those of the cells with 2% VC appear to be a single flattened semicircle both before and after the 500 C/2.2 cycles. The cells with 2% VC have a change in their impedance spectra with the appearance of a lobe at lower frequency which we believe is caused by increased Rct of the positive electrode. However, the impedance spectra for all cells are very stable over the 500 cycles.
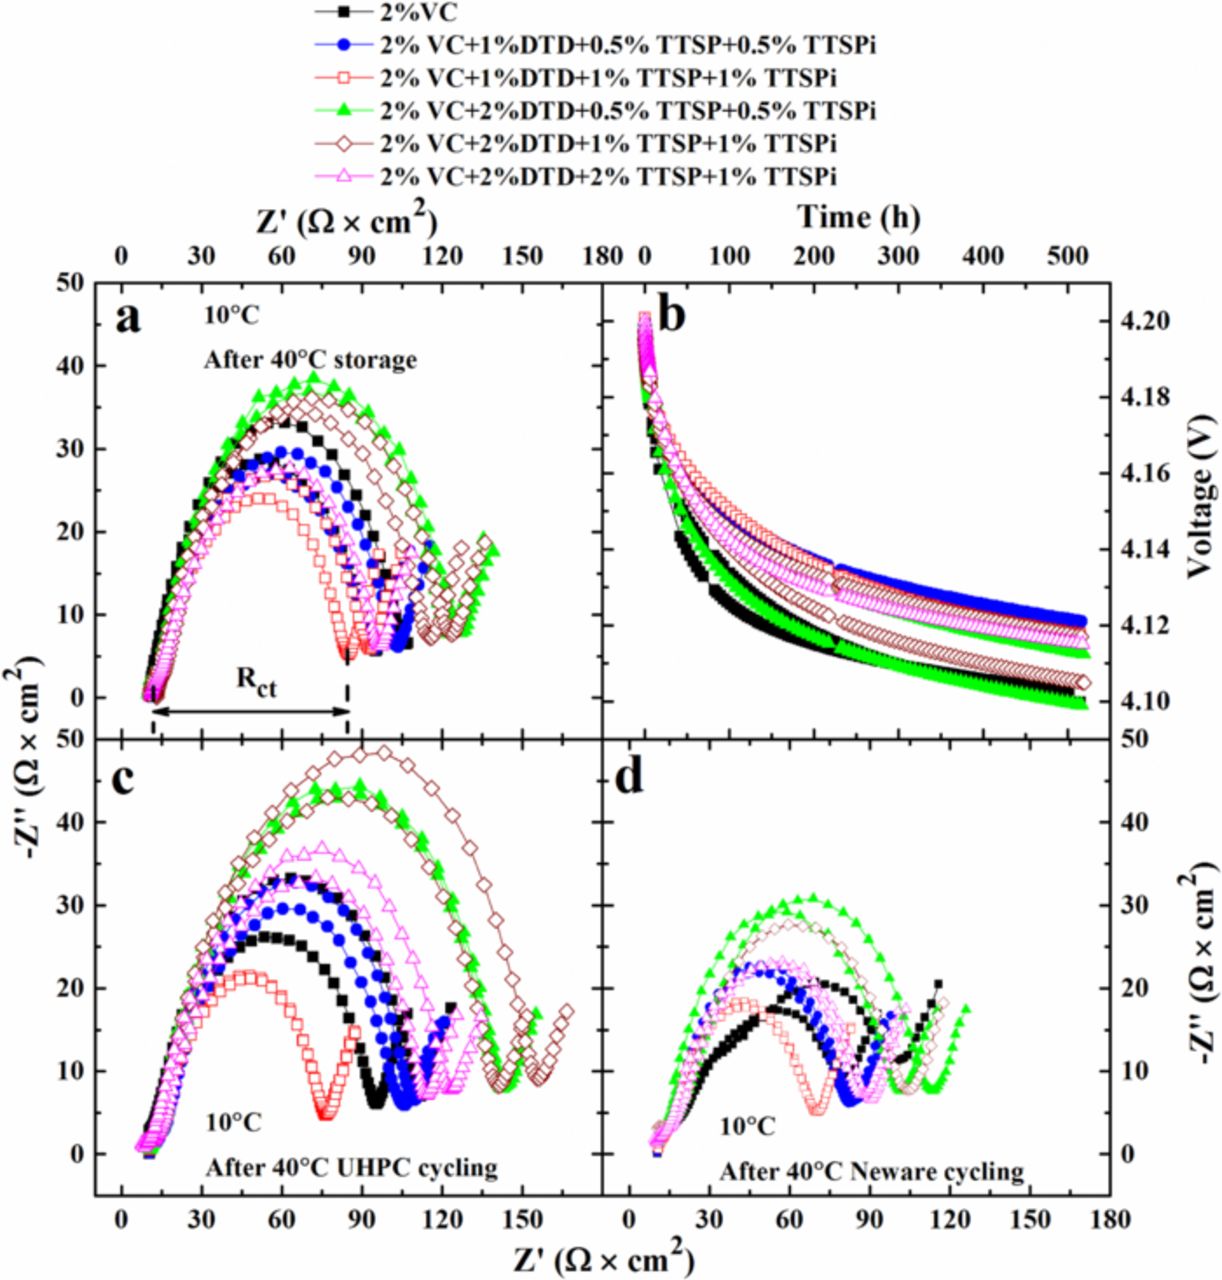
Figure 2. Nyquist plots for cells containing different additive as indicated in the legends (a) after storage, (c) after the UHPC cycling and (d) after Neware cycling at 40°C. The impedance spectra were measured at 10°C with the cells at 3.8 V. (b) Voltage as a function of storage time for cells containing different additives as indicated in the legends at 40°C.
Figure 2b shows the cell voltage as a function of time during storage at 40C. The cell voltage drops during storage as electrolyte oxidation at the positive electrode (or transition metal dissolution) causes simultaneous insertion of lithium ions into the positive electrode (which causes the cell voltage to decrease) to maintain charge neutrality in the electrolyte.10,11 Figure 2b shows that cells with the additive combinations have a lower voltage drop than cells with 2%VC alone.
Figure 3 shows a summary of Rct after storage, after HPC cycling, and after 500 cycles on the Neware charger based on the data in Figure 2. Figure 3 also shows a summary of the voltage drop during storage in Figure 2, as well as a summary of the gas volume generated during formation, during UHPC cycling and during long-term cycling. Figures 3a and 3c clearly show that cells with some of the additive combinations (e.g. 2% VC + 1% DTD + 0.5% TTSP + 0.5% TTSPi or 2% VC + 1% DTD + 1% TTSP + 1% TTSPi) have lower Rct than cells with 2% VC alone after storage, UHPC cycling and extended cycling. Cells that contain 2% DTD have higher Rct than those that contain 1% DTD. It is difficult to extract any other clear trends from Figures 3a and 3c. Figure 3b shows that the voltage drop during storage at 40°C is smallest for cells with 2% VC + 1% DTD + 0.5% TTSP + 0.5% TTSPi or 2% VC + 1% DTD + 1% TTSP + 1% TTSPi, the same blends that minimized Rct. It is important to minimize gas generation in pouch-type Li-ion cells. Figure 3d shows the volume of gas generated during formation, during the 600 hours (16 cycles) of UHPC cycling at 40°C and then during the extended cycling (500 cycles at C/2.2). The gas during formation was removed by degassing before UHPC cycling. The other reported gas volumes in Figure 3d are cumulative and are all so small that they cannot be detected "by eye" when examining the pouch cells themselves. The gas volume decreased slightly for all cells during the extended cycling which is fortunate for applications. Cells with 2% VC alone produce a gas volume of only about 0.07 mL during formation. Figure 3d shows that cells that contain DTD generate much more gas during formation. Experiments with many more additive combinations (not shown) show that DTD is the culprit, more so than TTSP and TTSPi.

Figure 3. Summary of Rct for cells containing different additives as indicated in the legends (a) after storage and (c) after the UHPC cycling and after the Neware cycling at 40°C. Summaries of (b) the voltage drop during storage and (d) gas volume generated during formation, the UHPC cycling and the Neware cycling for cells containing different additives as indicated in the legends. Average data were used and data extraction methods are indicated in the legends.
Burns et al. 3 showed that cells with larger coulombic efficiency (CE) usually have a longer life-time since maximizing CE normally corresponds to minimizing deleterious parasitic reactions in the cell. Figure 4 shows the raw results of the UHPC cycling for NMC111/graphite cells with electrolyte additives listed in the figure legend. All cycling was performed at C/20 and at 40C. Figure 4a shows the CE, Figure 4b shows charge end-point capacity intentionally shifted to the same starting point of 220 mAh at cycle two for critical comparison, Figure 4c shows the discharge capacity, and Figure 4d shows the difference between average charge and discharge voltages, ΔV, all plotted versus cycle number. Figure 4a shows that cells with the additive combinations have a higher CE than cells with 2% VC alone. The charge end-point capacity slippage (the slope of the charge end-point capacity versus cycle number graph), due to the oxidation of electrolyte, is another important parameter to evaluate cell performance.12–14 Figure 5 presents a summary of the results in Figure 4 so that small differences can be seen.
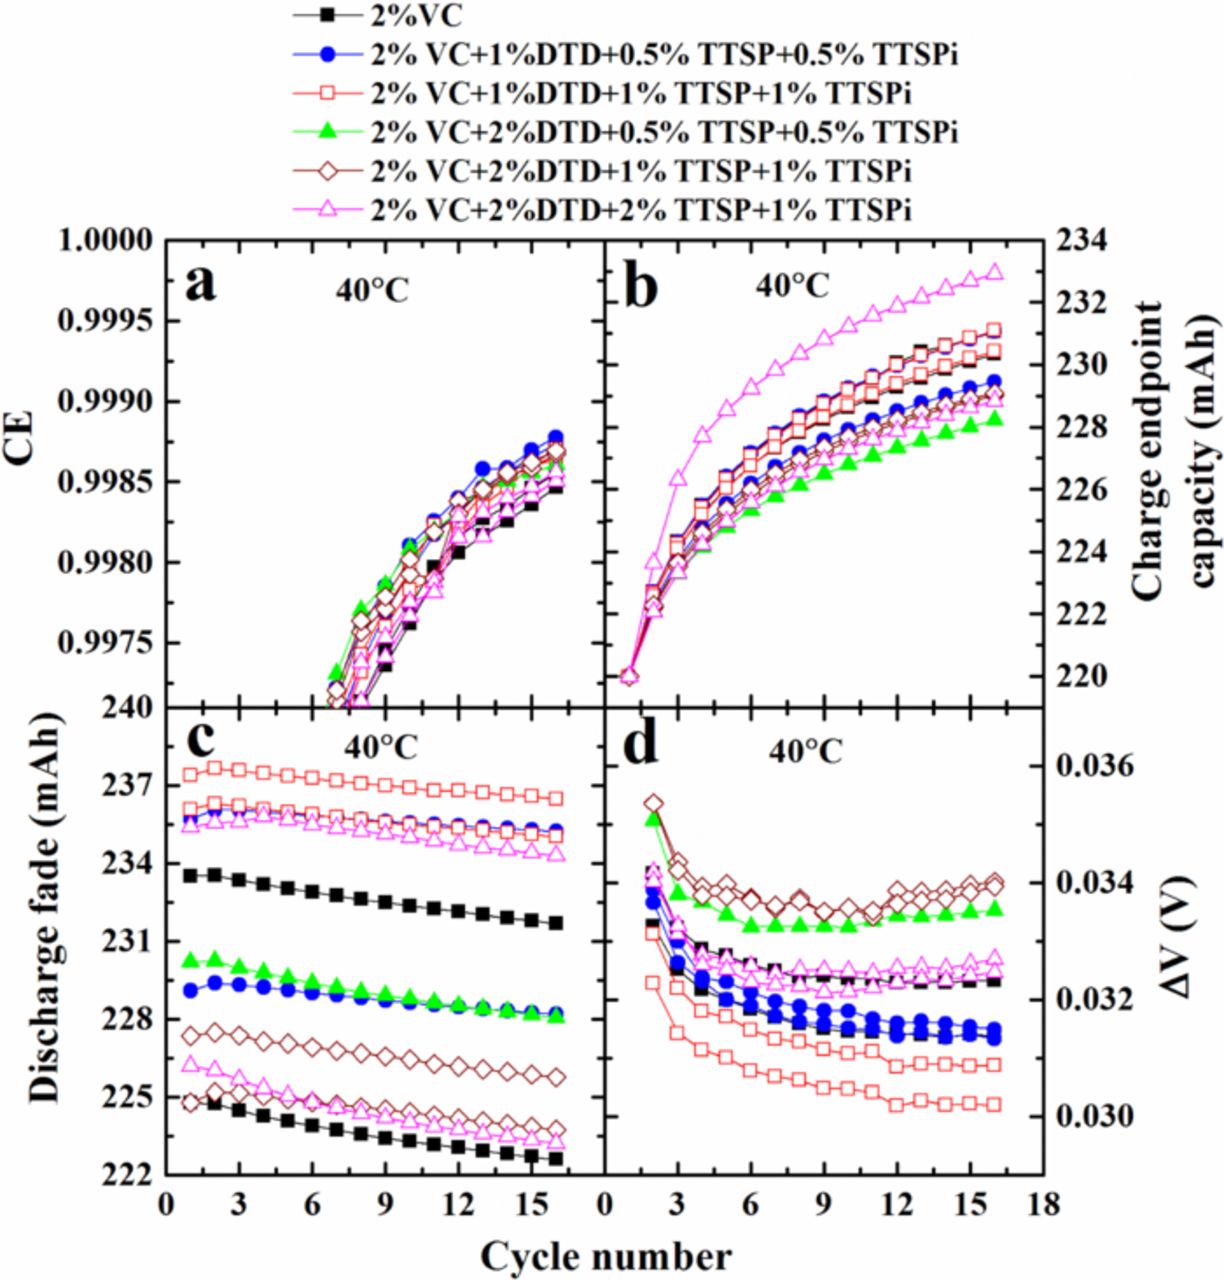
Figure 4. (a) CE, (b) charge end-point capacity, (c) discharge capacity and (d) difference between average charge and discharge voltage (∆V) as a function of cycle number for cells tested at 40°C, containing different additives, as indicated in the legends.
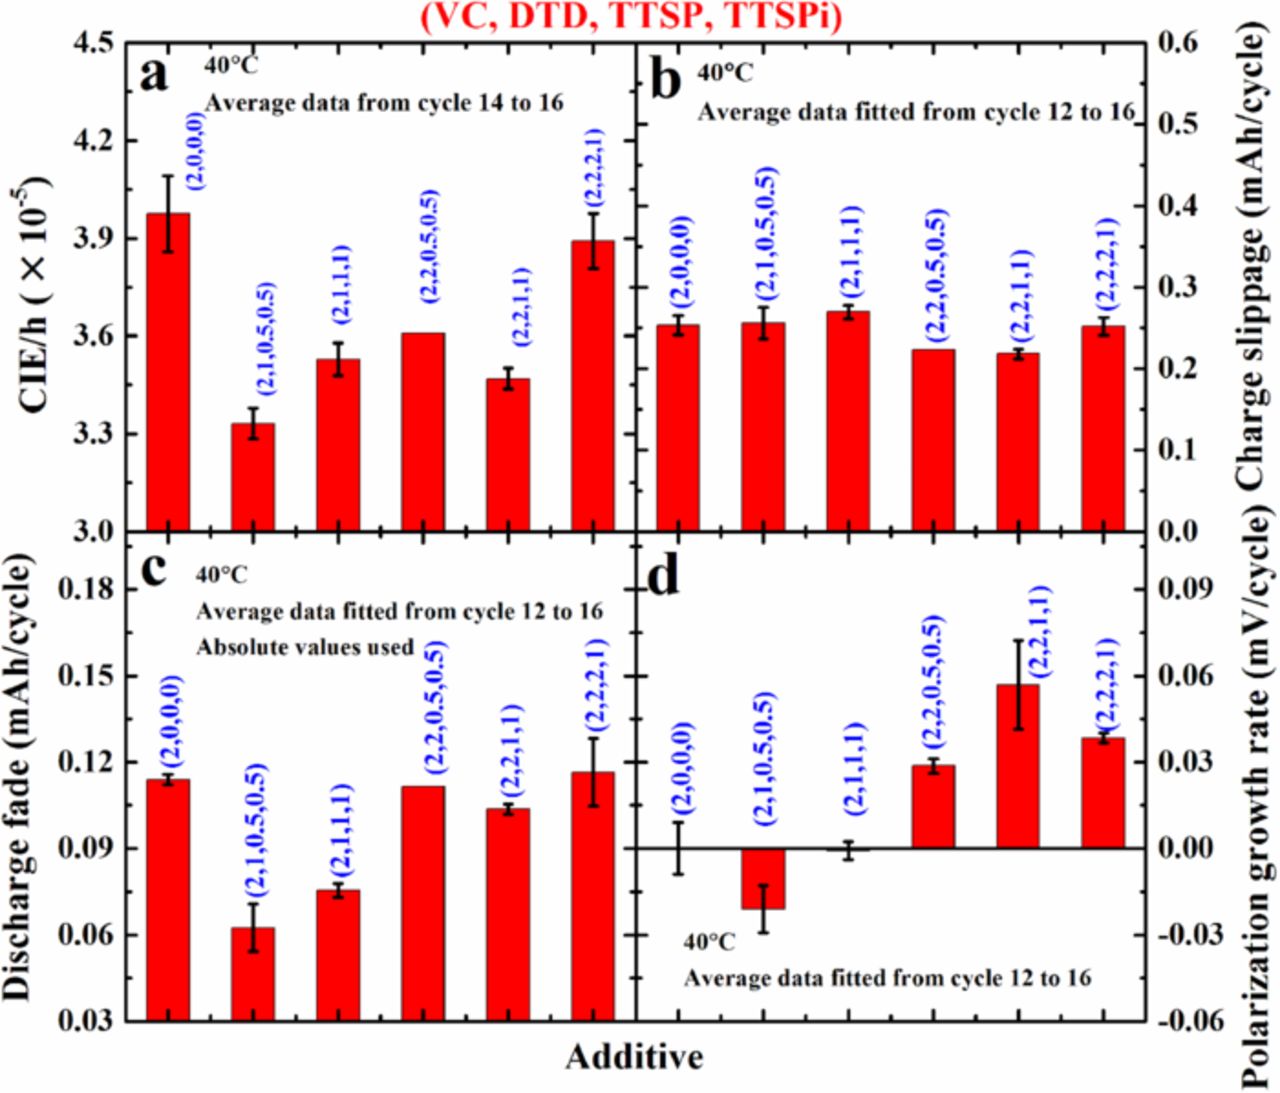
Figure 5. (a) CIE/h, (b) charge slippage, (c) discharge fade and (d) polarization growth rate for cells tested at 40°C, containing additives as indicated in the legends. Average data were used and data extraction methods are indicated in the legends.
Figure 5 shows a summary of the coulombic inefficiency per hour (CIE/h – calculated as (1-CE)/(time of one charge and discharge cycle)), charge end-point capacity slippage, discharge capacity fade rate and polarization growth rate for the same cells as described in Figure 4. The average of data for two cells is plotted in Figure 5 and the calculation methods are indicated in the legends in each panel of Figure 5. Lower CIE/h indicates higher coulombic efficiency which has been directly linked to longer cycle life.3 The cells with additive combinations show lower CIE/h than cells with 2% VC alone and cells with 2% VC + 1% DTD + 0.5% TTSP + 0.5% TTSPi show the smallest CIE/h. Lower charge end-point capacity slippage suggests less electrolyte oxidation. Figure 5b shows that cells with additive combinations show a comparable charge end-point capacity slippage to cells with 2% VC alone. Figure 5c clearly shows that cells with additive combinations have lower or comparable discharge fade rate than cells with 2% VC alone, and that cells with 2% VC + 1% DTD + 0.5% TTSP + 0.5% TTSPi have the smallest fade rate. Low polarization growth rate indicate a low impedance growth rate. Figure 5d shows that all cells have polarization growth rates that are very small (< 60 μV/ cycle) over the 16 UHPC cycles. Cells with 2% VC + 1% DTD + 0.5% TTSP + 0.5% TTSPi have the smallest polarization growth rate.
Figure 6 shows the discharge capacity as a function of cycle number for the cells with the different electrolyte additives during extended cycling on the Neware cycler at 40°C and C/2.2. The cells were restarted at about cycle 375 due to a power failure, so some small shifts in the data can be observed at about cycle 375. Cells with the additive combinations generally exhibit better or comparable capacity retention than cells with 2% VC alone as anticipated from higher coulombic efficiencies and similar charge end-point capacity slippage rates. Cells with 2% VC + 1% DTD + 0.5% TTSP + 0.5% TTSPi and 2% VC + 1% DTD + 1% TTSP + 1% TTSPi show less capacity fade than cells with 2% VC alone.
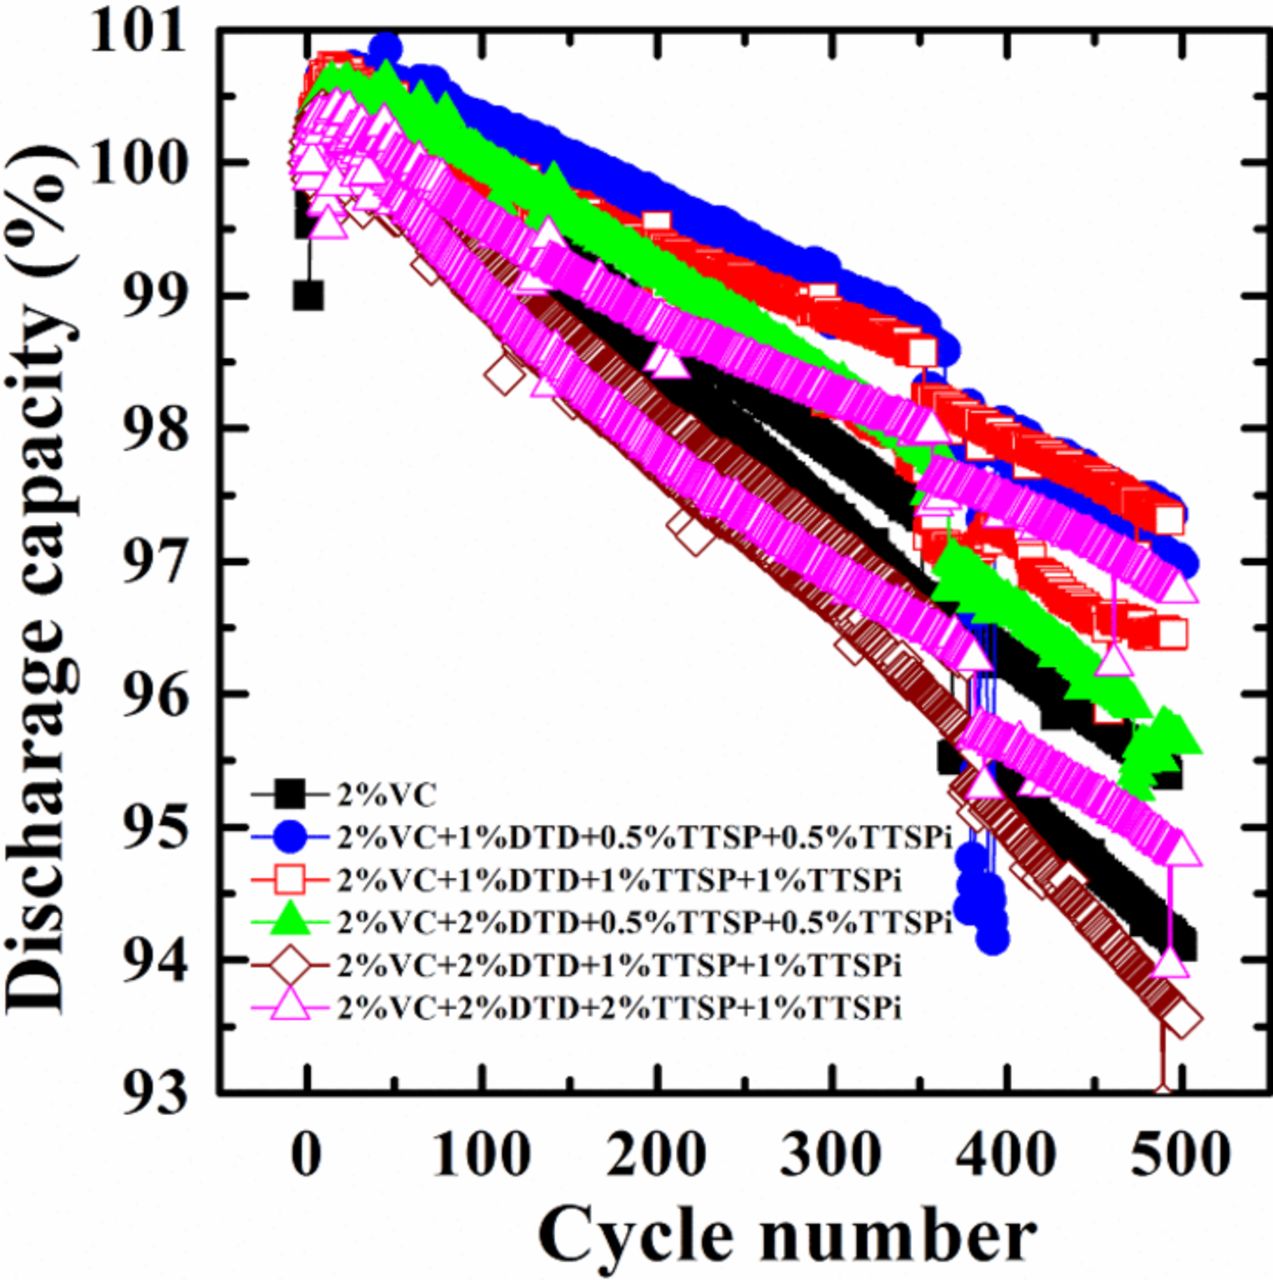
Figure 6. Discharge capacity as a function of cycle number for cells, containing different additives as indicated in the legends, tested using currents of C/2.2 at 40°C.
Smith et al. 15 demonstrated that the degradation of well-made LiCoO2/graphite cells tested at low rates is caused by parasitic reactions, which can be detected using the UHPC, instead of mechanical degradation of the electrodes or Li-plating at the negative electrode. Previous studies 7,15 showed that dV/dQ analysis can help discern/verify the degradation mechanisms. Possible causes of cell capacity loss are positive and the negative electrode active material loss and relative electrode slippage caused by parasitic reactions at each electrode. A homemade dV/dQ analysis software package 7 with four adjustable parameters (negative electrode active mass, positive electrode active mass, negative electrode slippage and positive electrode slippage) was used to study the cells before and after the 500 cycles displayed in Figure 6. The loss of the positive and the negative electrode active masses is primarily due to the electrical disconnect of electrode particles and should minimal in well-made NMC111/graphite cells tested with modest upper cut-off potentials, like 4.2 V. However, the positive and the negative electrode slippages, caused by the oxidation of electrolyte at the positive electrode and the formation of SEI layer at the negative electrode, respectively, are inevitable.
Figure 7 shows the measured dV/dQ versus capacity curves and fitted calculated curves for one cell containing each of the additives at cycle 3 and at cycle 519. The calculated dV/dQ curves were derived from the dV/dQ analysis software using NMC111/Li and the graphite/Li coin cell reference data obtained from electrodes taken from an uncycled pouch cell identical to those used to generate the data in Figures 2, 4 and 6.7 The dV/dQ analysis software adopts the convention suggested by Honkura et al. 16 that the capacity of the fully discharged cell is zero on every cycle. If this is the case, and if the graphite is empty when the Li-ion cell is discharged, then the negative electrode slippage will remain near zero throughout all cycles. The legends in Figure 7 show that this is the case. Figure 7 shows that the positive electrode slippage is negative and becomes more negative as the cells cycle. This means that the positive electrode is less full of lithium when the graphite is empty in the fully discharged state as cells cycle more and more. Figure 7 shows that cells at cycle 519 exhibit larger relative slippages (negative slippage minus positive slippage) than the corresponding cells at cycle 3, indicating consumption of active lithium in a thickening SEI on the negative electrode. Most important, both the positive and negative active masses are almost constant during the cycling, suggesting that the electrodes in these pouch cells are of good quality. This means the capacity fade observed in Figure 6 is not caused by problems related to loss of electrode active mass. The right most panels in Figure 7 show the full cell voltage-capacity curves from cycles 3 and 519 as well as the derived potential-capacity curves of the NMC111 and graphite electrodes. The relative slippage between the positive and negative electrode potential-capacity curves that has occurred during the 519 cycles is easily observed.

Figure 7. (Left and middle panels) Calculated and measured dV/dQ versus capacity for cells (a and b) containing different additives as indicated in the legends at 40°C. Cells were tested on the UHPC (a, c, e, g and i) at cycle 3 and on the E-One Moli cycler (b, d, f, h and j) at cycle 519. The values of the slippages and active masses are listed as insets. (Right panels) Full cell (black) as well as positive (black) and negative (red) electrode voltage versus capacity curves derived from the dV/dQ analysis in Figure 7. The different electrolyte additives are listed in the various panels. The solid lines correspond to cycle 3 and the dashed lines to cycle 519. The relative slippages developed during cycling are easily discerned from this figure.
Figure 8 shows the relative electrode slippage during the 500+ cycles extracted from Figure 7 plotted versus the observed capacity loss during those same cycles from Figure 6. A line of slope = 1 is also included in Figure 8 as a guide to the eye and helps illustrate the near perfect correlation between the relative slippage and the capacity loss. Therefore, the capacity loss can be completely explained by slippage of the negative electrode relative to the positive electrode due to thickening of the negative electrode SEI layer. Figure 9 shows the% change in negative electrode active mass during the 500 cycles of Figure 6 as extracted from dV/dQ analysis for the cells. Figure 9 shows that the active mass change of the negative electrode is less than 3% for all the cells. The error bars in Figure 9 represent the variation between the pair cells and not any systematic errors that the procedure may introduce. It is our opinion that the small active mass changes (< 3%) are consistent with no change in active mass at all, suggesting that these cells have excellent electrodes.
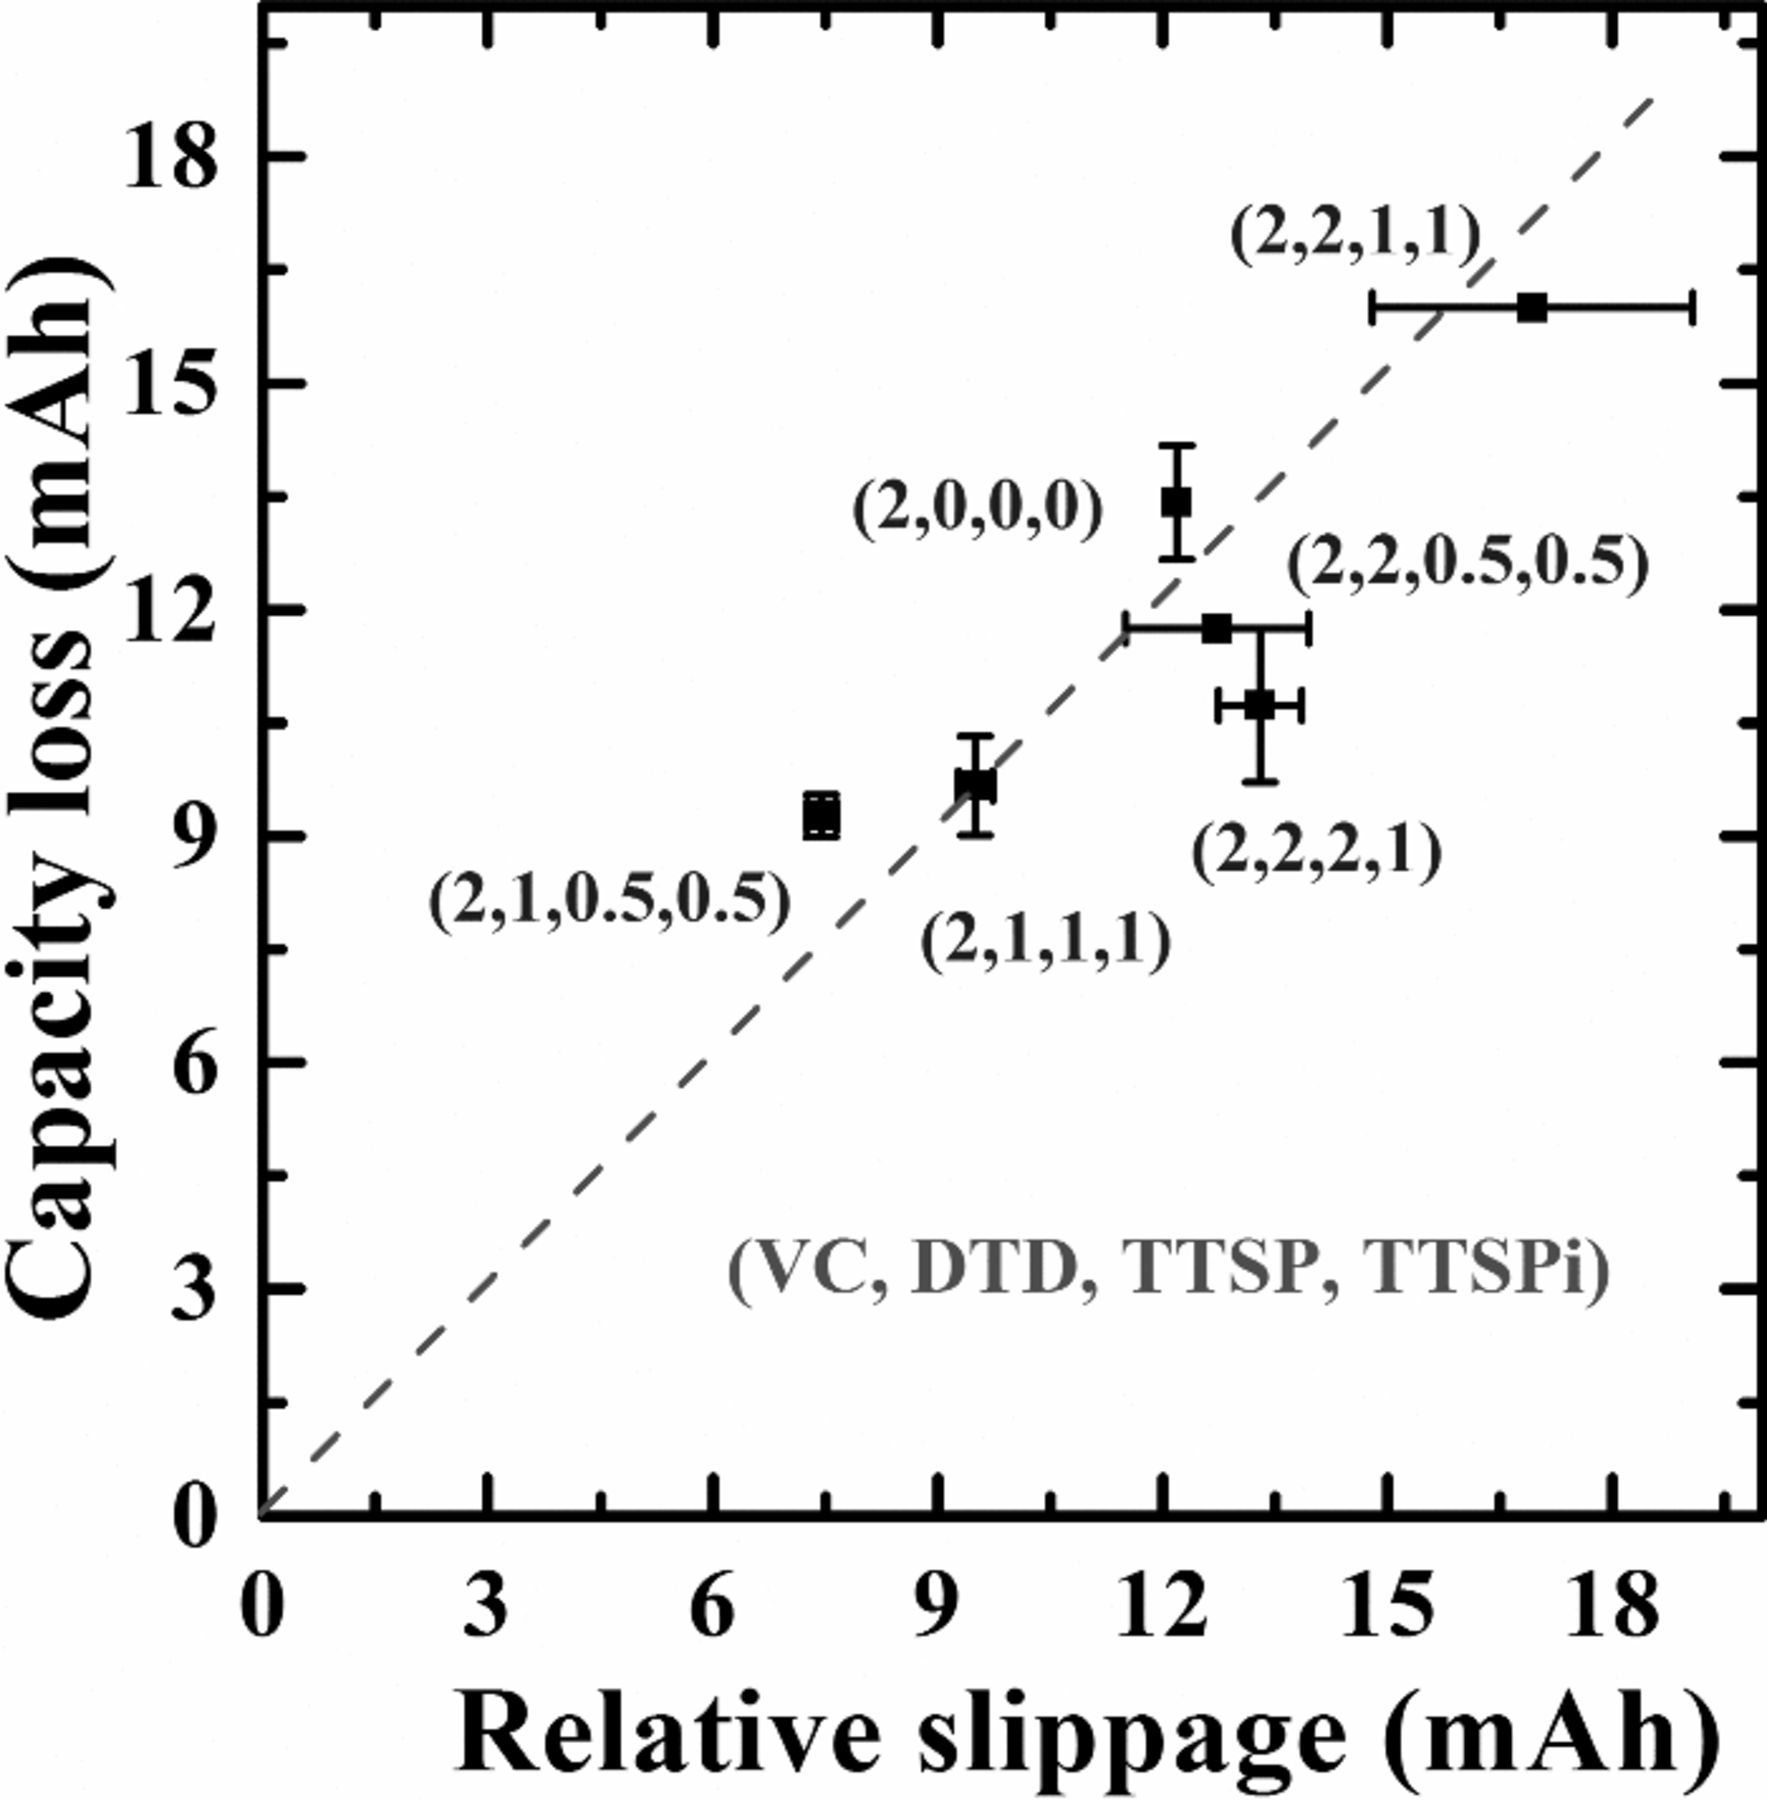
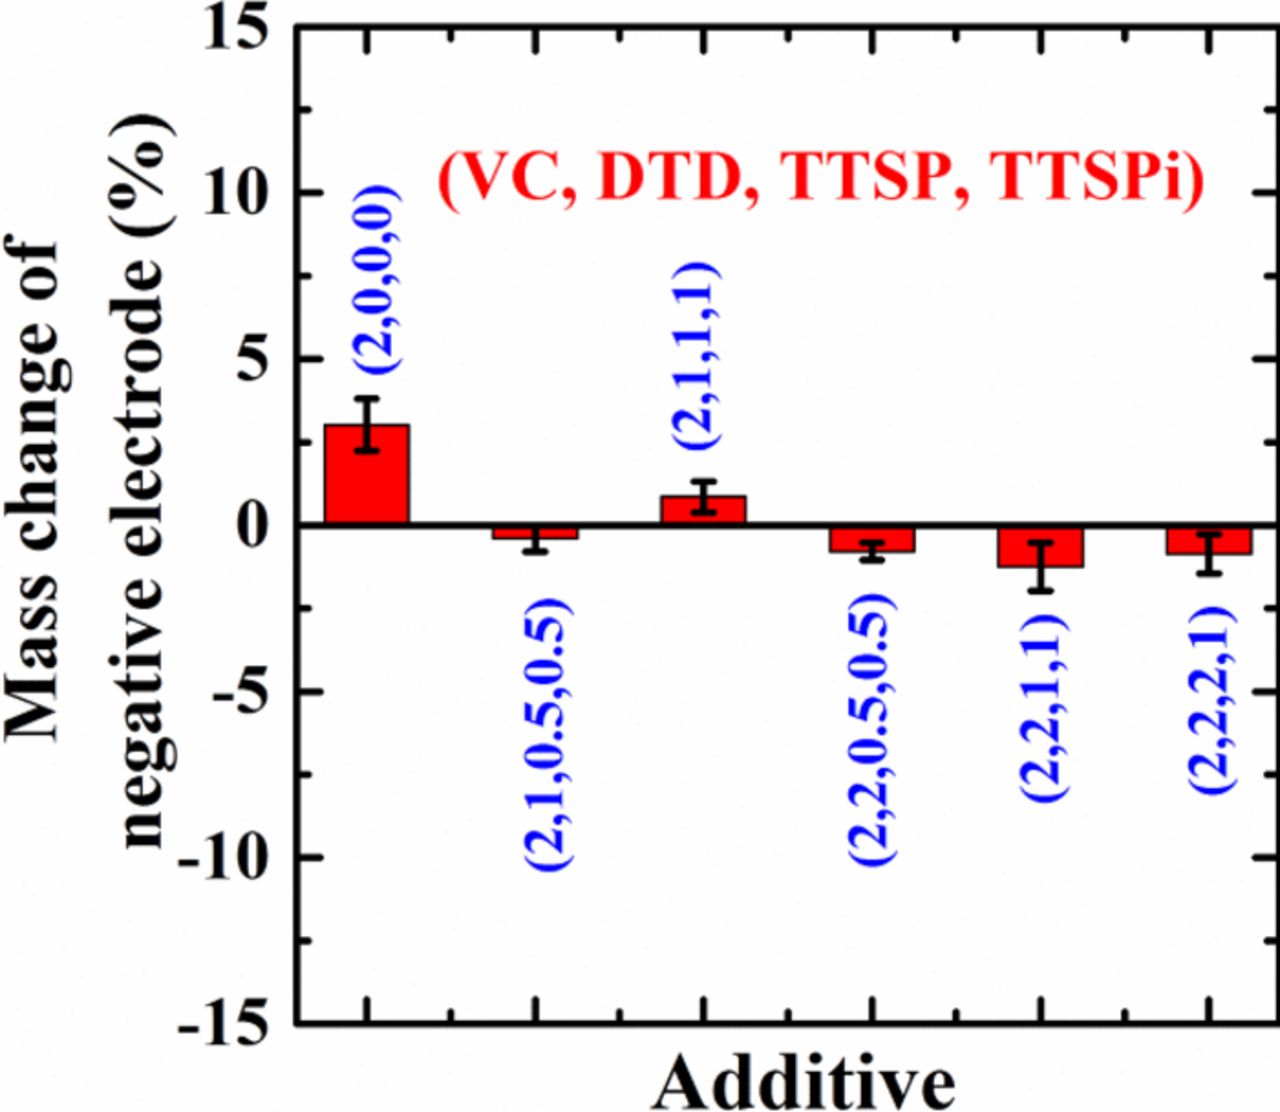
Figure 9. Change in the negative electrode active mass during the 500 cycles of Figure 6.
Figure 10 shows the voltage-capacity plots for one cell of each additive type measured at cycle 3 and cycle 500 during the C/2.2 cycling on the Neware charger. One can see a clear increase in charge-discharge polarization for the cell with 2% VC. By contrast, the cells with 2% VC + 1% DTD + 0.5% TTSP + 0.5% TTSPi or 2% VC + 1% DTD + 1% TTSP + 1% TTSPi show virtually no increase in polarization during these 500 cycles.
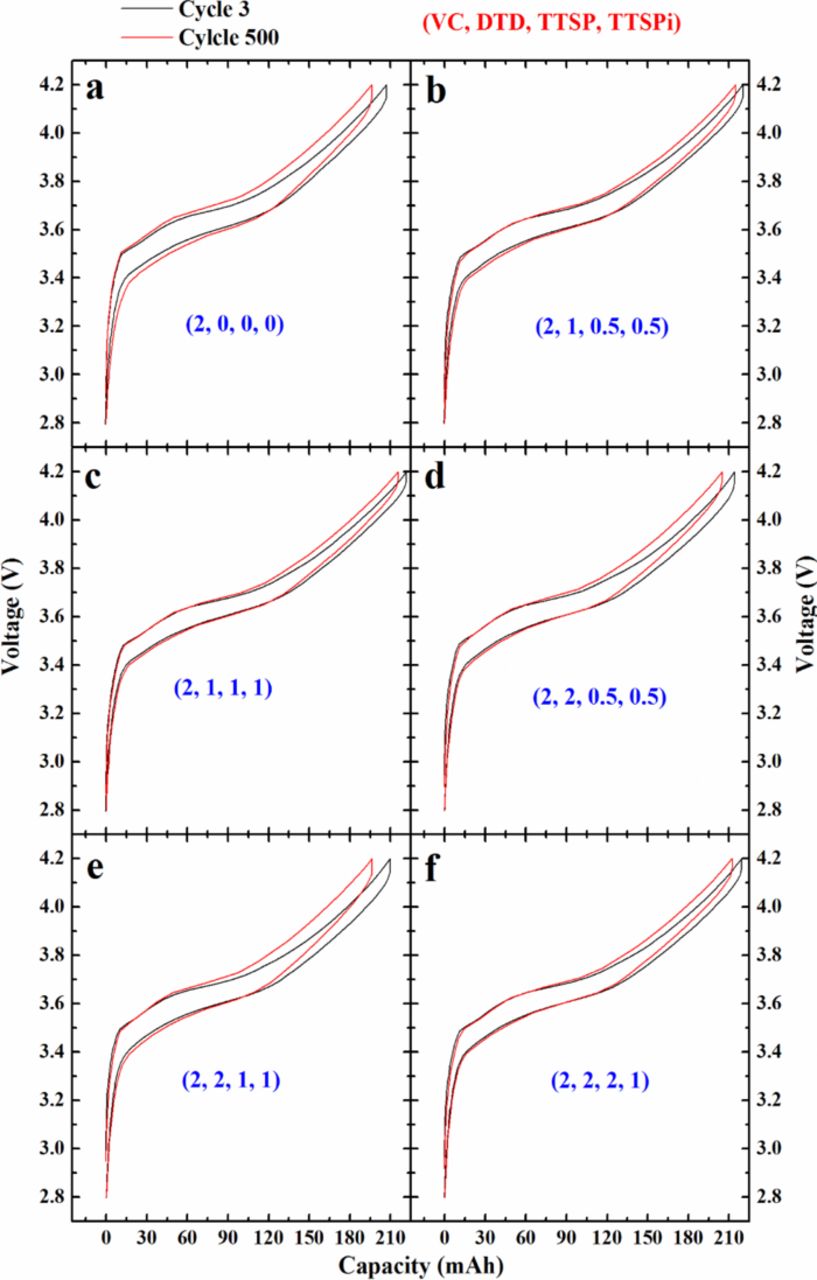
Figure 10. Voltage-capacity plots for cells containing additives as indicated in the legends at cycle 3 and cycle 500 during the C/2.2 cycling at 40°C on the Neware charger.
It is important to investigate impacts of additive or additive combinations at the positive and negative electrodes separately. Our research group 17 has developed a technique to study effects of additive at the positive and negative electrode separately using symmetric coin cells. The electrodes used in the symmetric coin cells were directly collected from pouch cells held at 3.8 V and then opened in the glove box (these pouch cells were aged for about 1000 h). Figure 11 shows Bode plots of the impedance spectra from positive and negative symmetric coin cells containing the different additives and additive combinations as indicated in the legends. The Bode plots for symmetric cells with additives contain mixtures of charge transfer resistance (Rct) and contact resistance (Rcontact),17 so the spectra need to be fitted to extract the contributions from each.
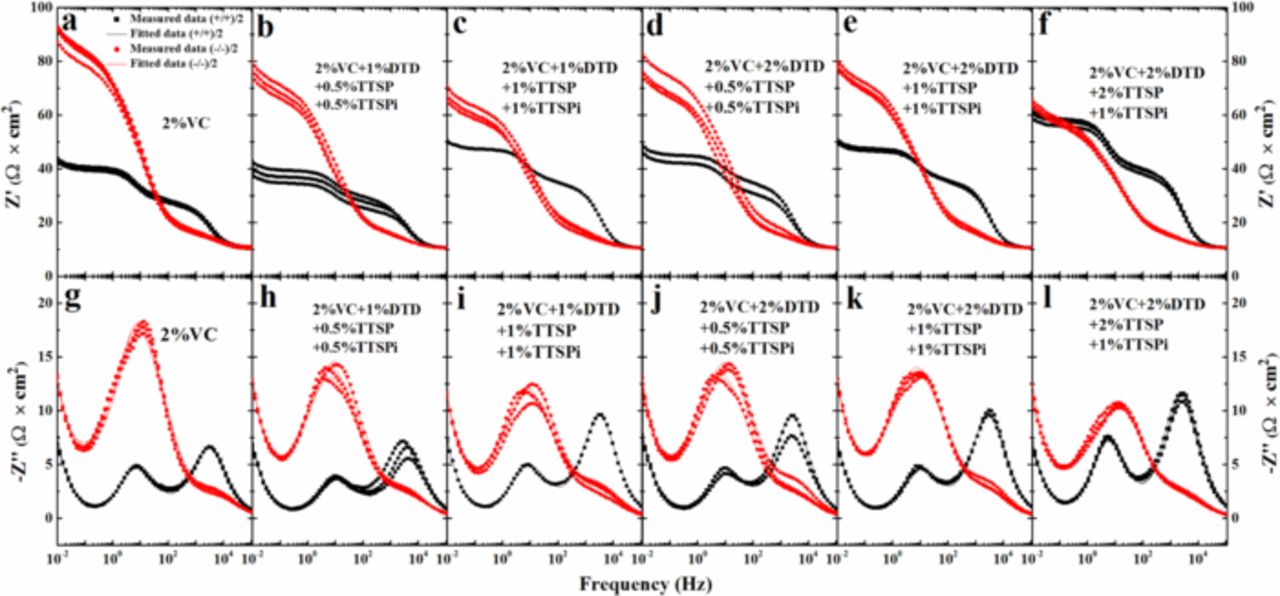
Figure 11. Bode plots for symmetric cells containing different additives as indicated in the legends. Both experimental and fitted data have been plotted.
An in-house AC impedance analysis software was developed to fit the experimental data using a circuit model in order to separate Rct and Rcontact. Atebamba's SCR circuit,9 shown in Figure 12a, was used for the fitting. Figure 12b shows that, for cells with 2% VC alone, and cells with additive combinations, negative symmetric coin cells have larger Rct than the corresponding positive symmetric coin cells, indicating a larger contribution of Rct from the negative electrode into the full cell impedance. This is not a surprise because 2% VC is known to increase negative electrode charge transfer impedance and decrease the positive electrode charge transfer impedance.17 Cells with 2% VC + 1% DTD + 0.5% TTSP + 0.5% TTSPi have the smallest Rct at the negative electrode. Cells with 2% VC + 1% DTD + 1% TTSP + 1% TTSPi have the smallest Rct at the positive electrode and the smallest full cell Rct. Figure 12c shows that Rcontact of positive electrode contributes more than that of negative electrode to the full cell Rcontact.

Figure 12. (a) The equivalent circuit used to fit the experimental EIS data; Summary of (b) Rct and (c) Rcontact for positive and negative electrodes of symmetric cells containing different additives as indicated in the legends.
Figure 13 shows a "radar" plot to summarize the properties of cells with some of the best additive combinations in terms of CIE/h, charge slippage, discharge fade, Rct after UHPC cycling, gas volume after the UHPC cycling, and voltage drop between 0–500 h during storage. Different scales were chosen for the different axes in order to easily distinguish the values. A "better" value is found closer to the origin for each parameter. The smaller the area enclosed by the values of six parameters, the better the overall performance of the Li-ion cells should be. Cells with additive combinations all show smaller values in CIE/h, discharge fade rates, Rct after the UHPC cycling and voltage drop during storage than cells with 2% VC alone. Among all the additive combinations presented in the paper, the combination of 2% VC + 1% DTD + 0.5% TTSP + 0.5% TTSPi shows a relatively smaller area in the radar plot of Figure 13, and hence might yield cells with better overall performance than other additive combinations presented in the work. A summary of many more electrolyte additives tested in the same pouch cells can be found in future publications.
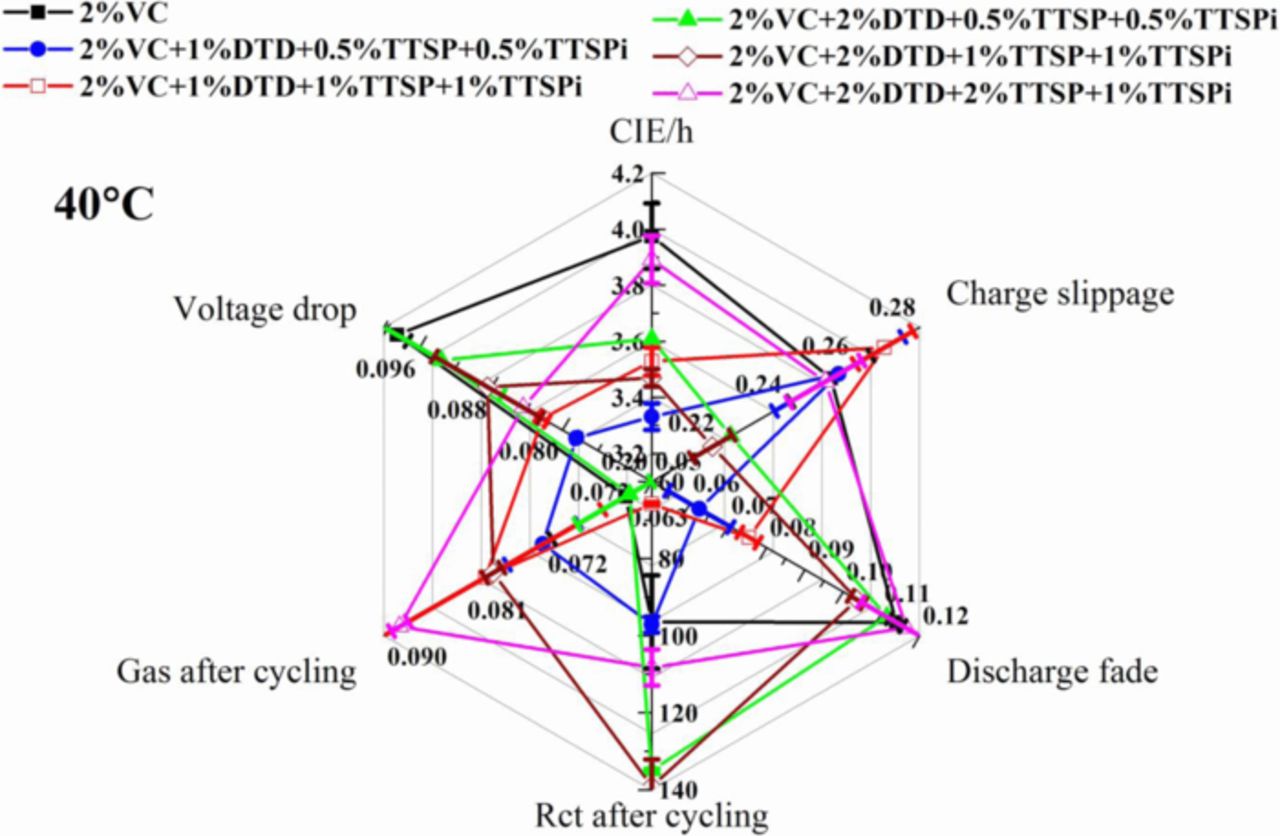
Figure 13. "Radar" plot to summarize results for cells with additives as indicated. The axes show coulombic inefficiency per hour (CIE/h = (1-CE)/(time of a full charge and discharge cycle), multiplied by 10−5, average data from cycle 13 to 15), charge end-point capacity slippage (charge slippage, in mAh/cycle, average data fitted from cycle 12 to 16), discharge fade (in mAh/cycle, average data fitted from cycle 12 to 16 and absolute values were used), Rct after the UHPC (in Ω × cm2, Rct measured at 3.8 V and 10°C after 600 hours UPHC cycling), gas volume generated during the UHPC cycling (in mL) and voltage drop during storage (in V, average data between 0–500 h). Data nearest to the center of the radar plot are "best".
Conclusions
Using a variety of experimental methods, the advantages of additive combinations have been demonstrated for NMC111/graphite Li-ion pouch cells. Compared to cells with 2% VC alone, the additive combinations have been shown to impart: 1) Higher coulombic efficiency indicating a reduction in parasitic reaction rates; 2) Lower voltage drop suggesting a decrease in the electrolyte oxidation rate at the positive electrode; 3) Lower charge transfer resistance (Rct) of full cells indicating the formation of better passivation layers on surfaces of both positive and negative electrodes; 4) Lower discharge fade rates suggesting longer cycle life; and 5) Less or equivalent amounts of gas generation during the UHPC cycling, compared to cells with 2% VC alone.
All these superior properties, to cells with 2% VC, imparted by the additive combinations presented in this paper should lead to cells with longer life-time with better power capability. We hope that Li-ion cell manufacturers will try these blends in prototype products and improve upon them through further experiments. It, of course, remains for fundamental experimental and theoretical work to explain why the quadruple and quintuple additive combinations are so attractive.
Acknowledgments
The authors thank NSERC, 3M Canada for the funding of this work under the auspices of the Industrial Research Chairs program. DYW thanks IRM (Institute for Research in Materials at Dalhousie University) and DREAMS (Dalhousie Research in Energy Advanced Materials and Sustainability) for funding. The authors thank Dr. Jing Li of BASF for providing many of the additives and solvents used in this work.