Abstract
An investigation was undertaken to study aqueous selenite as a possible corrosion inhibitor for magnesium alloys. Exposure experiments, anodic and cathodic polarization studies, electrochemical impedance spectroscopy (EIS) studies, morphological analysis, X-ray photoelectron spectroscopy (XPS) and Raman surface analysis were performed on alloy AZ31 during and after exposure in different concentrations of sodium selenite (0.5 mM to 50.0 mM) dissolved in 0.1 M NaCl. Formation of a Se0 film consisting of both amorphous and crystalline Se0 was observed after exposure to solutions independent of the selenite concentration. In the case of the highest concentration, precipitation of MgSeO3 was observed on the surface of the Mg alloy samples. Both anodic and cathodic inhibition was observed across the range of concentrations examined. Cathodic inhibition was observed independent of selenite concentration and appeared to arise from the presence of a surface film formed on both the matrix and on Al-Mn particles that inhibited water reduction. Anodic inhibition in electrochemical measurements was evident at lower selenite concentrations. Characterization of the film morphology suggested that film structure was detrimentally affected as concentration of the inhibitor increased.
Export citation and abstract BibTeX RIS

This is an open access article distributed under the terms of the Creative Commons Attribution 4.0 License (CC BY, http://creativecommons.org/licenses/by/4.0/), which permits unrestricted reuse of the work in any medium, provided the original work is properly cited.
The high strength to density ratio of magnesium alloys makes them an attractive option for automotive and other applications where structural weight is of concern. Unfortunately, the high reactivity of magnesium results in susceptibility to corrosion that can limit application of magnesium alloys.1,2 A number of approaches to corrosion protection have been examined including alloying,3,4 use of chemical conversion coatings and anodization,5–9 and use of inhibitors and inhibited organic coatings.10–16 Coating systems provide corrosion protection without affecting mechanical properties the way alloying approaches can.
Actively protecting organic coatings provide some degree of barrier protection, but also contain releasable inhibitors that can protect the underlying metallic substrate if moisture penetrates the coating. The classic example of such a coating is strontium chromate-pigmented epoxy primers that release a chromate inhibitor as the sparingly soluble strontium chromate dissolves in the presence of moisture in the coating.
Although chromate is a good corrosion inhibitor for magnesium, filiform corrosion in the presence of chloride electrolytes is still a risk.17 Additionally, the toxicity of chromate greatly lessens its desirability as an inhibitor.18–20 Various studies have indicated that vanadate, molybdate, arsenate and phosphate provide good corrosion inhibition of Mg and its alloys.5,12,21,22
A less studied, but intriguing inhibitor for magnesium is selenite, SeO32−. Bengough and Whitby patented an acidic selenite-based coating bath to treat Mg alloys in the 1930s, and this is believed to be the first published report of the inhibiting action of selenite on magnesium.23 The report noted that the reaction between aqueous selenite and a Mg surface resulted in a protective film on the Mg substrate and that this film afforded appreciable corrosion protection. A search of the literature indicates no other research on the use of selenium or selenite as a corrosion inhibitor for Mg except for the thesis work of Kaminski which showed that selenite is a promising inhibitor on several Mg alloys.24
In neutral and alkaline solution conditions, the equilibrium reaction and equilibrium reduction potential for selenite is:25
![Equation ([1])](https://content.cld.iop.org/journals/1945-7111/166/14/C520/revision1/d0001.gif)
![Equation ([2])](https://content.cld.iop.org/journals/1945-7111/166/14/C520/revision1/d0002.gif)
From pH 7 to 14 and for dissolved selenium activities ranging from 1.0 to 10−6, the equilibrium potential for this reaction varies from +0.25 to −0.70 VSHE. Over this same potential range, the equilibrium potential for Mg reduction ranges from −2.4 to −2.8 VSHE.26 As a result, there is a very strong driving force for the reduction of selenite from a selenite-bearing solution in contact with an activated magnesium alloy surface.
In addition to the potential for reduction of SeO32− to Se0, Mg2+ is reported to induce precipitation of SeO32− to form insoluble MgSeO3 or its hydrated variant by the following reaction:27–30
![Equation ([3])](https://content.cld.iop.org/journals/1945-7111/166/14/C520/revision1/d0003.gif)
As a consequence, there are two insoluble products that can form by contact of a Mg alloy surface with a selenite-bearing aqueous solution. If solids formation is localized to the solid-solution interface, a film-building process may occur spontaneously.
In terms of its chemical toxicity, selenium is an essential trace element in human nutrition, and many medicines use sodium selenite as a selenium supplement.31 However, large amounts of selenite can be toxic. The lethal dose of Na2SeO3 (LD50) for rats is 7 mg Se/kg body wt. On this basis, it is far more toxic than Se0 which has an LD50 of 6700 mg/kg for rats.32 Another report indicates that acute (but non-fatal) poisoning arises from Na2SeO3 exposure in humans at a dose of 10 mg Se/kg.33 The Occupational Safety and Health Administration (OSHA) sets the permissible exposure limit (PEL) for selenium and its inorganic compounds at 0.2 milligrams of selenium and its inorganic compounds (as selenium) per cubic meter of air (mg/m3) averaged over an eight-hour work shift."34 Although selenite poses some risk from a human health perspective, it appears to be practical for use in industrial applications if its concentration is kept at low levels.35
In this study, inhibition of Mg corrosion by aqueous selenite was investigated. Electrochemical measurements were used to characterize the extent of inhibition, X-ray photoelectron spectroscopy and electron microscopy were used to characterize the films and surfaces after exposure, and Raman spectroscopy was used to identify phases that were formed on the exposed magnesium surfaces.
Experimental
Commercial AZ31 Mg alloy (2.5 to 3.5 Al, 0.7 to 1.3 Zn, 0.2 Mn, balance Mg by wt%) was used in this study. Samples used for electrochemical experiments were abraded with lubricated SiC paper (600 to 1200 grit) and were then rinsed with ethanol. Samples used for characterization of surface morphology were polished through to a 1 μm diamond paste finish. After surface preparation, all samples were ultrasonically cleaned in ethanol (2 min) and then dried with compressed air. All experiments were conducted in lab air at ∼25°C and were replicated at least three times.
Electrochemical characterization was carried out using a Gamry Reference 600 potentiostat in 0.1M NaCl solutions with additions of Na2SeO3 yielding selenite concentrations ranging from 0.5 mM to 50.0 mM. The natural pH value of these solutions ranged from 8.1 to 9.1, and pH increased with increasing concentration of Na2SeO3. Control experiments were carried out in aerated 0.1 M NaCl adjusted to a pH of 9.0 with NaOH.
Immersion and electrochemical experiments were carried out using a traditional three electrode vertical cell. An area of 1 cm2 (face up) was exposed in the cell. The sample surface area to bath volume was 1 cm2 to 150 mL. Platinum mesh was used as the counter electrode and a saturated calomel electrode (SCE) served as the reference.
Anodic and cathodic potentiodynamic polarization measurements were performed separately. Anodic polarization curves were measured from −0.05 V to +0.45 V vs. the open circuit potential (OCP). Cathodic polarization curves were measured from +0.01 V to −0.40 V versus OCP. The scan rate for both anodic and cathodic measurements was 0.3 mV/s. In order to permit film formation in the presence of selenite inhibitors, an 8-hour OCP delay was used before the anodic potential scan. A 30-minute hold at OCP was used before the cathodic scan. The intersection of EOCP and the linear section of the short cathodic branch obtained in anodic polarization curves was used to estimate the corrosion rate. All experiments were replicated a minimum of three times.
Electrochemical impedance spectroscopy (EIS) measurements were carried out on AZ31 in contact with selenite-bearing solutions every 4 hours within a 24-hour time frame, with the cell resting at open circuit potential (OCP) between measurements. Measurements were made using a 5 mVRMS sinusoidal voltage signal, and spectra were sampled at a rate of seven points per decade over the frequency range of 100 kHz to 10 mHz.
Raman spectra were obtained on a Renishaw microprobe using a 633 nm laser excitation source with an integration time of 10 s. Laser power was less than 5 mW at the sample surface and was consistent for all samples. Before analysis, each sample was immersed for three days in a given concentration of Na2SeO3 - 0.1 M NaCl solution. Samples were then rinsed in deionized water and air dried for 24 hours before analysis.
Focused ion beam (FIB), scanning transmission electron microscopy (STEM) and energy dispersive x-ray spectroscopy (EDX) were employed to study cross sections of films formed in a one-day, OCP exposure in each of the selenite-chloride solutions. STEM specimens were prepared with a FEI Helios NanoLab DualBeam microscope. Thinning was continued until electron transparency was achieved. In order to minimize surface damage and contamination, throughout the thinning process, the accelerating voltage was gradually decreased. STEM images and EDX data were acquired using an FEI image corrected Titan3 G2 60-300 S/TEM at 300kV.
A Thermo Fisher Scientific Quattro environmental scanning electron microscopy (SEM) was used to characterize the corrosion morphology of samples after three days of immersion in each of the solutions (at OCP). The operating voltage ranged from 10 kV to 20 kV, and the working distance was 10.0 mm. The chemical composition of the film was studied by EDX, which was carried out at an operating voltage of 15 kV.
Samples for characterization by X-ray photoelectron spectroscopy (XPS) were transferred to the XPS analysis chamber upon rinsing and drying after 3-day immersion in solution containing 1.0 mM SeO32− and 0.1 M NaCl. XPS spectra of coated surfaces were acquired using a Thermo Fisher Scientific system with monochromated Al Kα x-rays at 1486 eV. Survey scans ranged from 5 eV to 1400 eV and were performed with a pass energy of 80 eV. Se3d and Mg2p spectra were acquired simultaneously (in the range of 45 eV to 65 eV) with a pass energy of 20 eV. All spectra were calibrated to the 284.6 eV adventitious C1s signal. Mixed Lorentzian-Gaussian fitting was performed on the Se3d and the Mg2p peaks. Fitting constraints were based on the NIST XPS database.36
Results
Immersion testing and surface observation
Figure 1 shows 24-hour OCP measurements of AZ31 in selenite-bearing chloride solutions with concentrations ranging from 0.5 to 50 mM Na2SO3. The black curve shows the variation of AZ31 OCP during exposure to pH 9, 0.1 M NaCl with no selenite addition. In this case, a sharp break is evident in the curve at 0.5 hours. This phenomenon has been associated with passive film breakdown.37 Thereafter, the OCP remained relatively steady until about 16 hours when an increase in potential and in signal noise indicated onset of new or renewed electrochemical reactivity. The noise episode was accompanied by the appearance of a dark corrosion product on the surface, which is attributed to localized corrosion.1
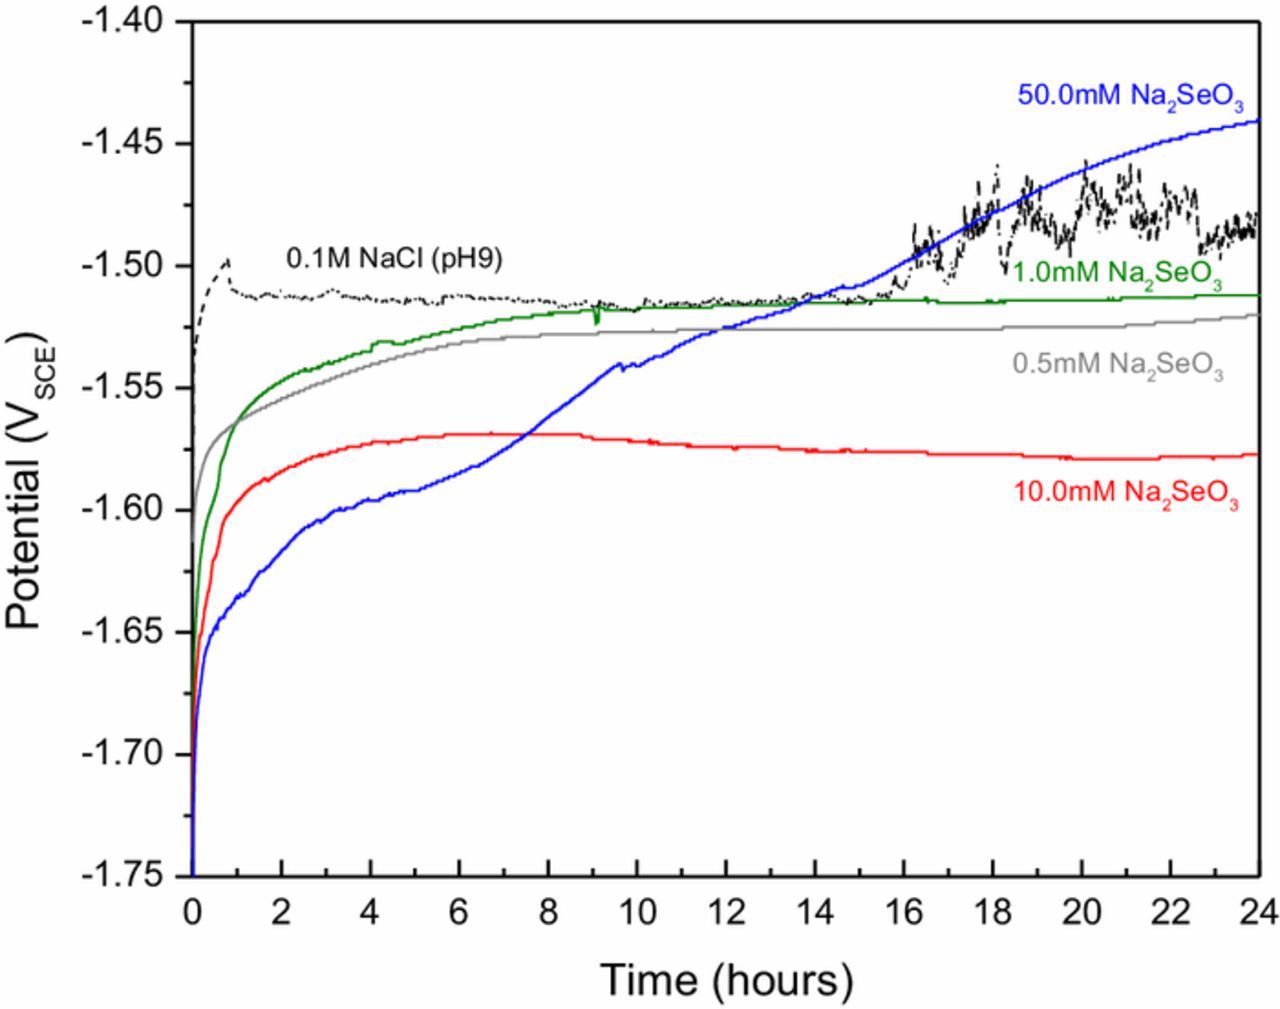
Figure 1. 24-hour OCP measurements in 0.1M NaCl and 0.1M NaCl plus concentrations of Na2SeO3 indicated in the plot.
In the presence of Na2SeO3, initial OCP values are shifted to more negative potentials at the outset of the exposure and were observed to rise quickly during the first two hours. The OCP variation in 0.5 mM and 1.0 mM Na2SeO3 solutions were similar increasing in the first 2 hours and then stabilizing at about −1.52 VSCE after eight hours. The OCP behavior in the 10.0 mM Na2SeO3 solution is substantially similar in its evolution over time, but the steady-state potential is about 60 mV more negative than the OCP values recorded for the more dilute selenite concentrations. The OCP variation for the 50.0 mM Na2SeO3 solution was distinct rising through the entire 24-hour exposure period with some variation in rate of increase. There were no sudden drops in OCP suggesting surface film breakdown in any of the measurements conducted in Na2SeO3-bearing solutions. The pH of each solution was measured before and after the 24-hour exposure period. In all cases, the final pH had increased no more than 0.3 pH units.
Images of sample surfaces exposed for 24 and 72 hours are shown in Figure 2. The control sample exposed in aerated 0.1M NaCl for 24 hours was heavily corroded and covered with dark gray and black corrosion product (Fig. 2a). Figures 2b, 2d, 2f, and 2h show surfaces from samples exposed to selenite-bearing solutions for 24 hours. Film formation is prominent on these samples, and there is little to no evidence of localized corrosion or significant general corrosion. The film formed in 0.5 and 1.0 mM selenite solutions was uniform across the surface and gray with a slight pink coloration. There was no localized corrosion evident under the coating when it was removed. The film formed during exposure to 10 mM selenite was also uniform across the surface, but had a brown-black coloration. No localized corrosion was found under this coating either. The film formed during exposure to 50 mM selenite was uniform, reddish-brown in coloration and marked with several transparent crystals that were firmly embedded in it. These crystals were not soluble in water.
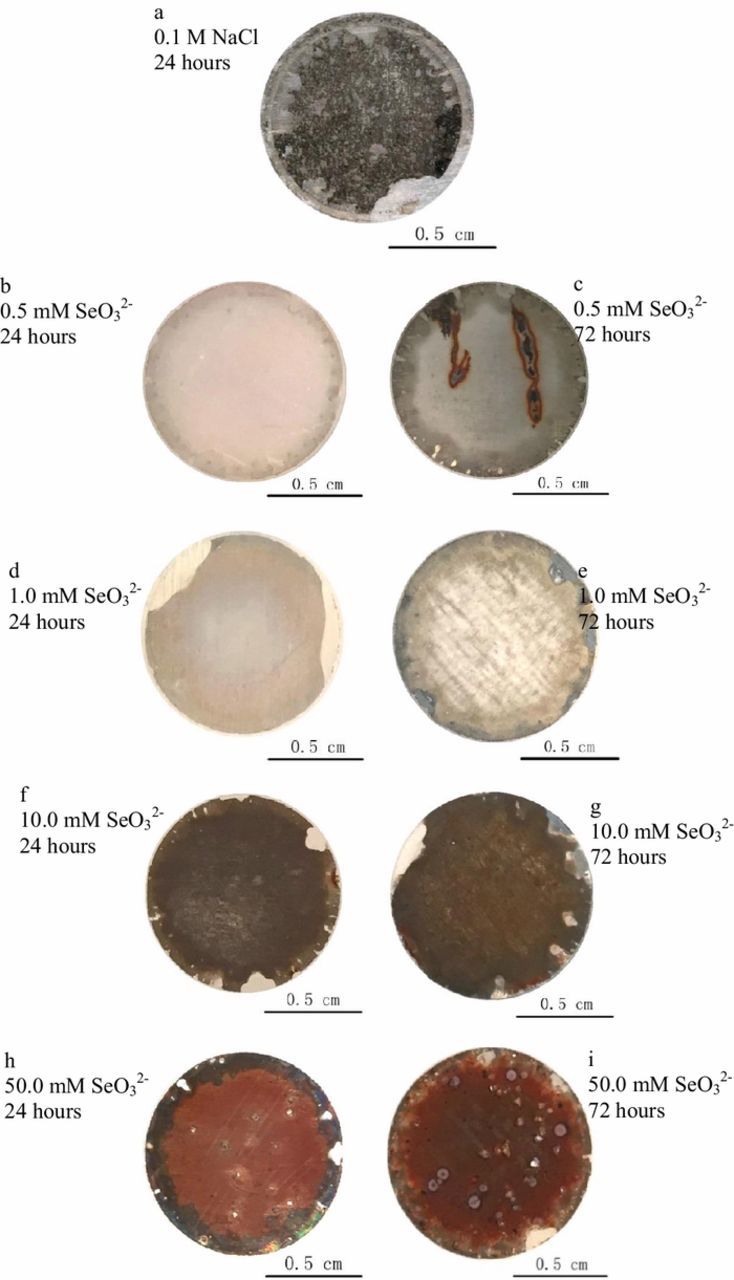
Figure 2. Optical macrographs of AZ31 after 24 and 72 hours of immersion in 0.1M NaCl solution (24 hours only) and various concentrations of SeO32− in 0.1 M NaCl.
Samples exposed for 72 hours in selenite-bearing solutions (Figs. 2c, 2e, 2g, 2i) exhibited film formation that mostly mirrored observations made for the 24-hour exposure. Notable differences included the emergence of black and reddish film formation on part of the surface exposed to the 0.5 mM Na2SeO3 solution (Fig. 2c), and some slight indications of localized corrosion on the samples exposed to the 1.0 and 50 mM Na2SeO3 solutions (Figs. 2e and 2i).
EIS
Figure 3 shows EIS spectra collected every 4 hours over a 24-hour period from AZ31 samples immersed in the Na2SeO3 – NaCl solutions. The spectra were fit to the equivalent circuit model for a defective coating shown in Figure 3f.38 In this model, Rs represents the bulk solution resistance. Rp is the pore resistance representing the ohmic resistance through the coating or corrosion product layer. Qc is the reactance associated with the coating or corrosion product layer. Rct is the faradaic resistance associated with electrochemical reaction below the coating or corrosion product layer, and Qdl is the interfacial reactance that develops due to charge separation at the interface between the metal and the coating, corrosion product layer and penetrating solution,39,40 respectively. The total resistance (Rtot) represents the sum of Rp and Rct.
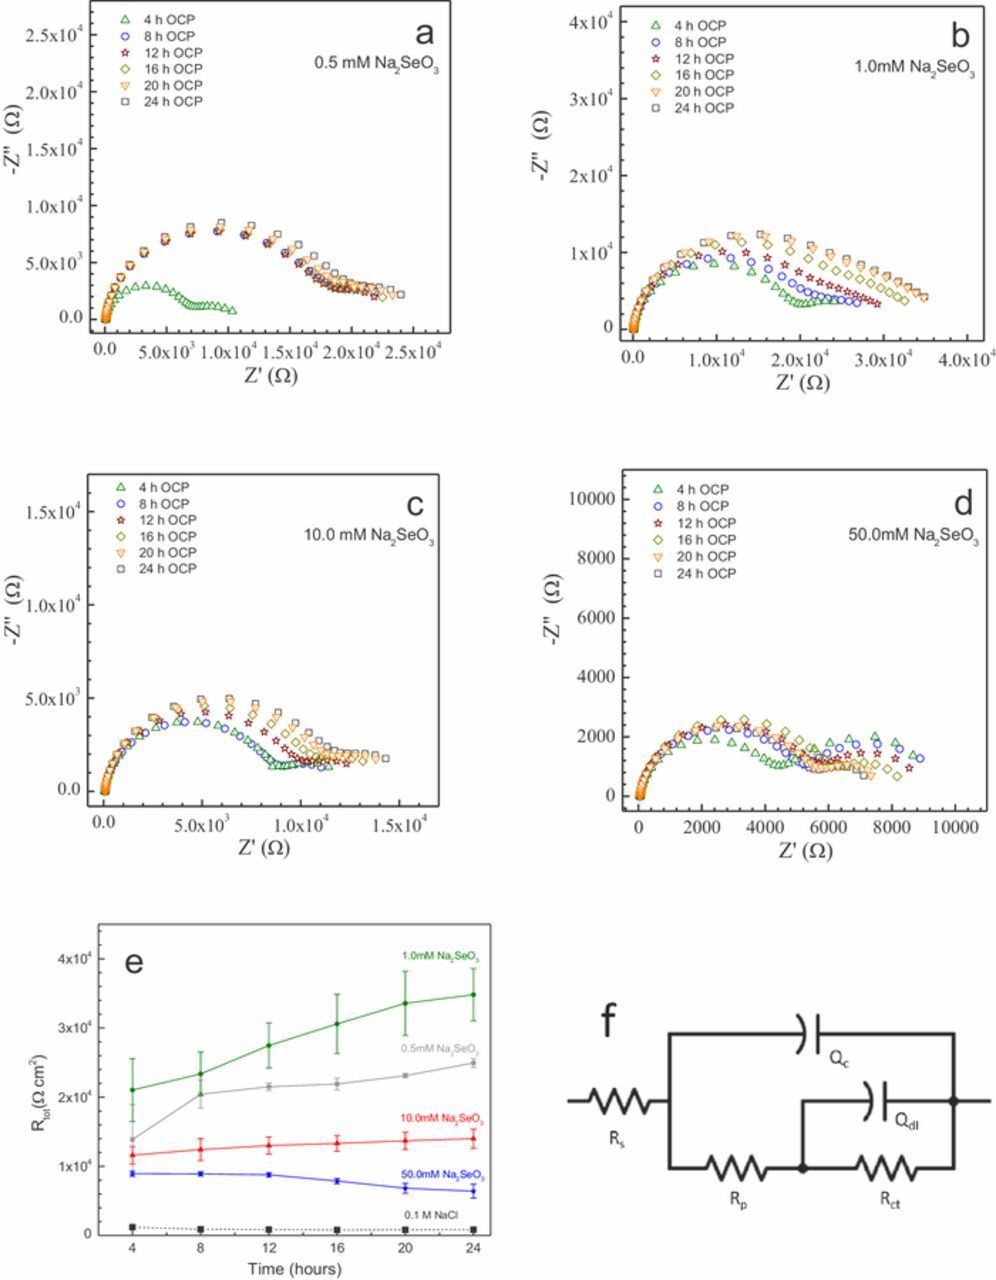
Figure 3. Results of 24-hour EIS testing in 0.1M NaCl solution and various concentrations of SeO32− in 0.1 M NaCl with exposure area of 1 cm2. Measurements were obtained in 4-hour intervals.
Figure 3a shows the Nyquist plots of the spectra collected from AZ31 exposed to the 0.5 mM Na2SeO3 solution. The plot shows a two-time constant response at all times and the total impedance increases significantly after 8 hours of exposure increasing from 12 to 24 kΩ. The impedance does not change significantly with further exposure beyond 8 hours.
In 1.0 mM Na2SeO3 (Figure 3b), the total measured impedance increases steadily over the course of about 20 hours with little change between 20 and 24 hours, suggesting an approach to steady state conditions. Also, of note in the spectra collected in the 1.0 mM selenite solution is the low frequency capacitive loop that is present in the 4-hour data, whose articulation diminishes as exposure time increases.
In the 10.0 mM Na2SeO3 solution (Figure 3c), the spectra show an increase of impedance with time, although the total impedances are clearly lower than those measured at lower selenite concentrations. Additionally, a low frequency capacitive loop is distinctly articulated even at 24 hours.
Data collected from the samples in the 50.0 mM Na2SeO3 (Figure 3d) show the lowest total impedances among all four selenite concentrations examined. The spectra are all fairly similar in the high frequency range and do not show a clear increase with time, with the exception of the spectrum collected after 4 hours of exposure, which is somewhat lower. These data do show the presence of a low frequency capacitive loop that decreases in size with increasing exposure time.
To facilitate comparison, Figure 3e shows the dependence of the total resistance measured by EIS on selenite concentrations. The data show that the highest Rtot values were obtained in the lowest concentrations of Na2SeO3 (0.5 and 1.0 mM). Additionally, Fig. 3e illustrates that an increase in Rtot with time was observed for the two lowest concentrations (0.5, 1.0 mM), a slight increase for the 10 mM selenite concentration and a slight decrease for the 50 mM selenite concentration.
Overall, these results show that while there is film formation at all selenite concentrations examined, the most protective films are forming in the single millimolar selenite concentration range.
Potentiodynamic polarization
Both anodic and cathodic polarization curves were collected on samples immersed in a control solution (0.1 M NaCl, adjusted to pH 9.0) and in 1.0, 10.0, and 50.0 mM Na2SeO3 in 0.1 M NaCl. Based on the immersion testing and EIS data, experiments in 0.5 mM Na2SeO3 were not performed. Representative results of those scans are shown in Figure 4, including the scans resulting from curves collected in the chloride-only solution.
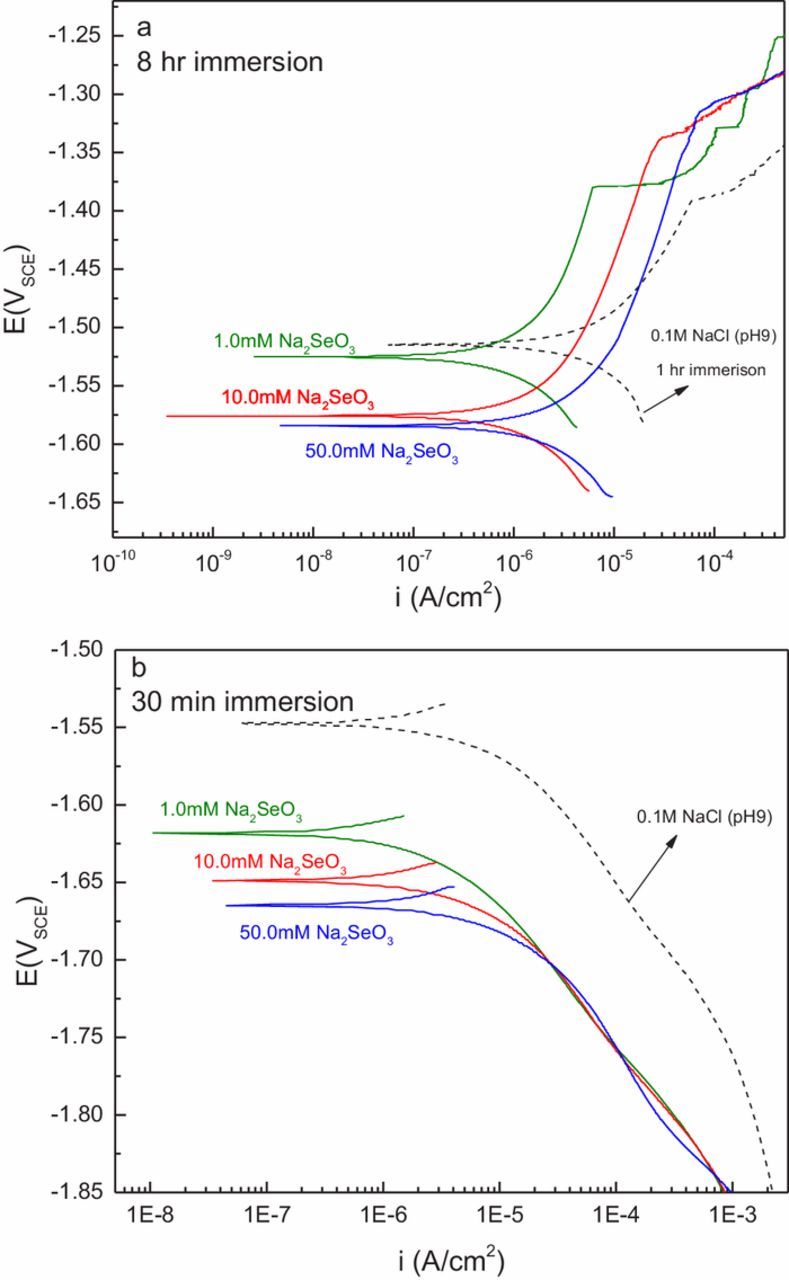
Figure 4. Polarization measurements obtained in 0.1M NaCl and various concentrations of SeO32− in 0.1 M NaCl.
With the exception of the measurement in the chloride-only solution, anodic polarization curves were collected after an 8-hour hold at the OCP. The scan in the chloride-only solution was collected after a 1-hour OCP hold. All of the anodic polarization curves obtained in Na2SeO3-bearing solutions exhibited a shift to lower current densities, and an increase in the breakdown potential indicating anodic inhibition. Suppression of anodic current increased with decreasing concentration—in accord with the trend observed in EIS measurements, with the 1.0 mM Na2SeO3 solution providing the greatest degree of inhibition (Figure 4a). The anodic current arising from the sample in 1.0 mM Na2SeO3 was approximately one order of magnitude less than that measured in the chloride-only solution. The breakdown potential shifted slightly to increasingly higher potentials as the concentration of selenite increased.
Representative cathodic polarization curves, performed after a 30-min hold at OCP, are shown in Figure 4b. A 30-min hold was employed, versus the 8-hr hold for anodic polarization experiments, to avoid the formation of a passive film before initiation of cathodic measurements. The presence of Na2SeO3 suppressed cathodic kinetics and the inhibiting effect appeared to be independent of concentration. The inhibiting effect was significant. Selenite additions inhibited the hydrogen evolution reaction and decreased the cathodic current density by an order of magnitude compared to the chloride-only case. The effect of anodic and cathodic inhibition conferred by selenite is a substantial decrease in the corrosion rate and the corrosion potential of AZ31.
Figure 5 illustrates the effect of low-level selenite additions to chloride solutions on the polarization characteristics of AZ31. Values for the control experiment (not plotted) were approximately 7 × 10⁻⁶ A/cm2 for corrosion current density and −1.51 VSCE for corrosion potential. These plots show some dependence on the concentration of Na2SeO3 on all three parameters. The breakdown potential, observed at approximately −1.32 VSCE at all three concentrations signifies a breakdown of a protective film.41 Although little difference was observed in the breakdown potential values for samples tested in 10.0 mM versus 50.0 mM solution, the lowest concentration of selenite, 1.0 mM, yields the lowest average breakdown potential. However, within the margins of error for these experiments neither breakdown potential nor corrosion potential show a strong dependence on selenite concentration. The slight downward trend in corrosion potential with increasing concentration, observable on this plot, is in agreement with the OCP measurements in Figure 1. In the presence of Na2SeO3, corrosion current density, however, clearly decreases as its concentration decreases. The lowest concentration of Na2SeO3 (0.1 mM) produced a corrosion current density of approximately 9 × 10⁻⁷ A/cm2, which was about one-half of the current observed in the 50.0 mM solution and almost an order of magnitude lower than the current observed in the control experiment.
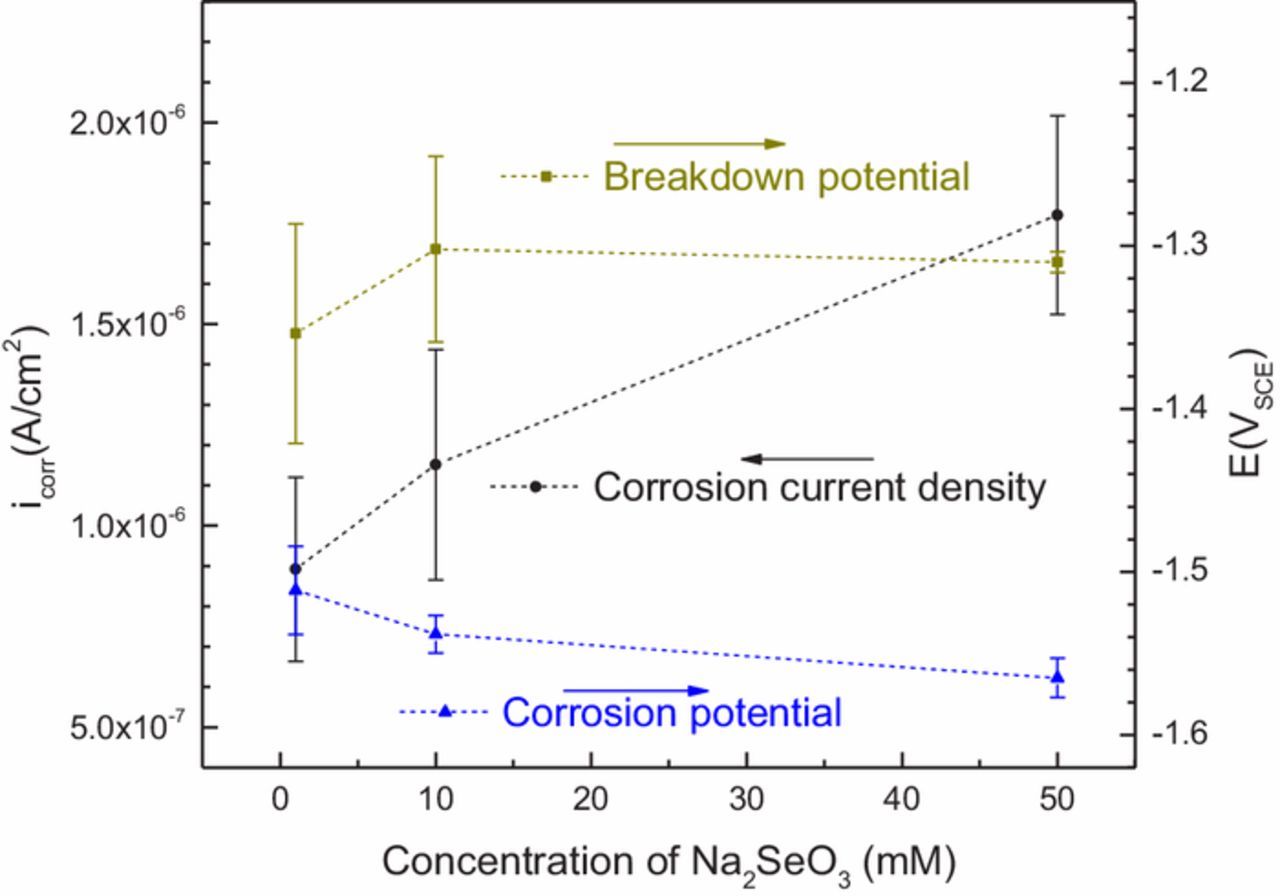
Figure 5. The concentration dependence of corrosion current density, pitting potential, and corrosion potential values obtained from potentiodynamic polarization.
In order to determine if surface films formed during exposure to selenite-bearing solutions possess latent corrosion protection, an AZ31 sample was immersed in 1.0 mM Na2SeO3/0.1 M NaCl solution for 30 minutes, removed, and rinsed in DI water. This treated sample was then subjected to a cathodic scan in 0.1 M NaCl (without added Na2SeO3). As can be seen in Figure 6, the resulting cathodic kinetics were lower than kinetics measured on a control sample scanned in 0.1 M NaCl, but they were not as low as the sample scanned in the 1.0 mM Na2SeO3/0.1 M NaCl solution.
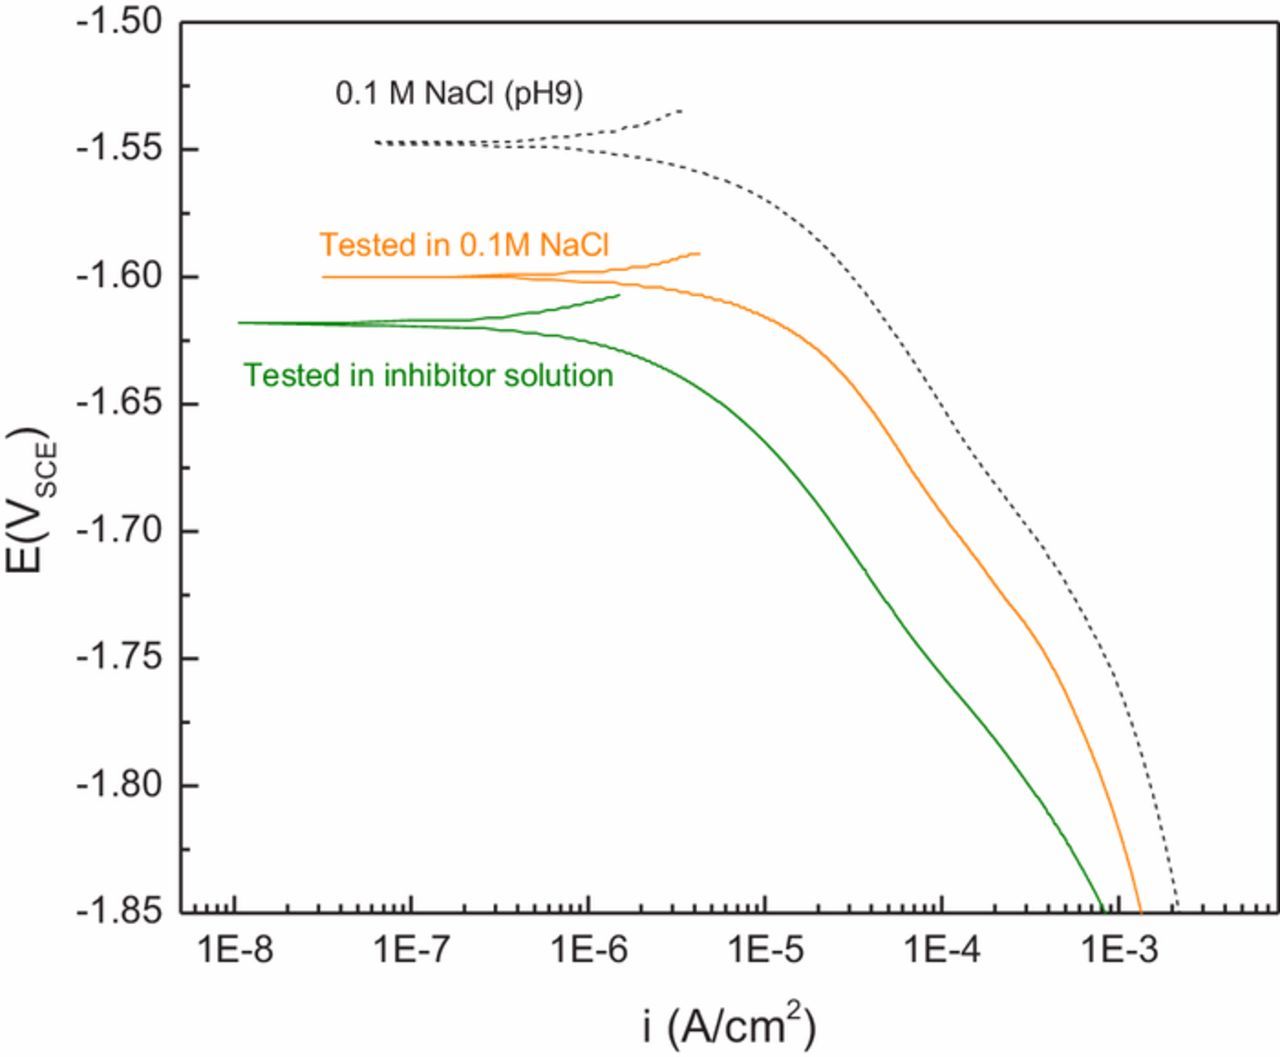
Figure 6. Cathodic polarization measurements obtained on AZ31 immersed for 30 min in 1.0 mM SeO32− and then tested with and without the presence of aqueous SeO32−. The 1.0 mM SeO32− solution was prepared in 0.1 M NaCl.
Surface characterization
Figure 7 shows Raman spectra of AZ31surfaces that were immersed in the selenite-chloride solutions for 3 days. After exposure, the surfaces were rinsed with DI water and air dried. Three spectra, representing exposure to 1.0, 10 and 50 mM selenite concentrations, each display a scattering band at 251 cm−1, which indicates the presence of amorphous Se0 (a-Se).42,43 The spectra from surfaces exposed to 10 and 50 mM selenite also contain a distinct band at 234 cm−1, which indicates the presence of crystallized trigonal Se0 (t-Se).42,43 Based on the approximate relative intensity of those two bands (reproducible in a minimum of three sets of spectra) the ratio of t-Se to a-Se increased in films formed in the 50 mM Na2SeO3 solution. No evidence of the presence of t-Se was present in the spectrum of a sample exposed in the lowest concentration (1.0 mM), however, due to the weakness of the spectrum arising from the film formed in that concentration, the presence of t-Se is not completely ruled out.
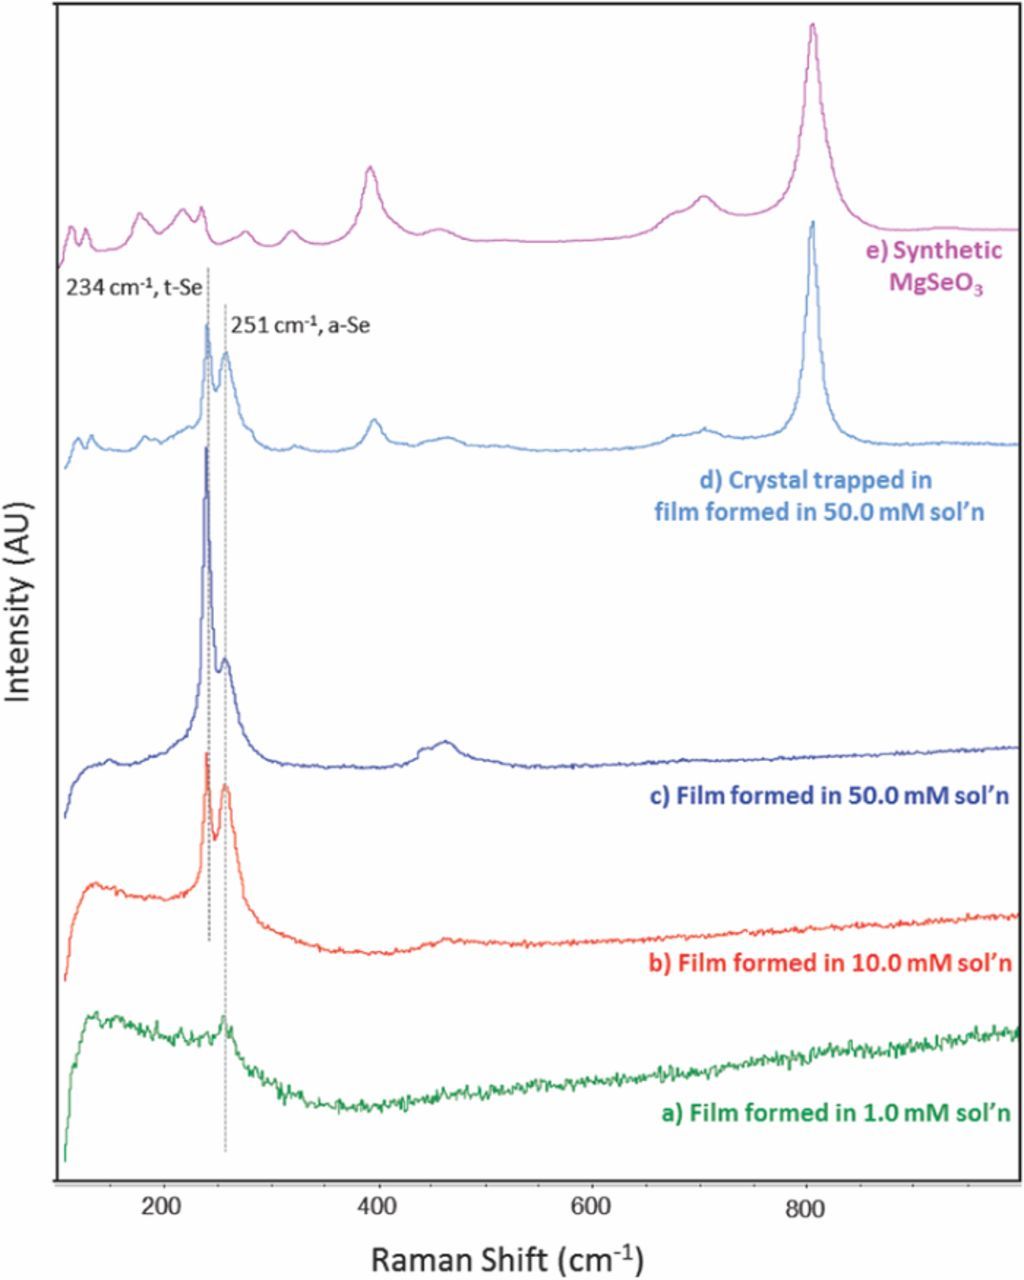
Figure 7. Raman spectra of surface films formed on AZ31 after immersion in various concentrations of SeO32− in 0.1 M NaCl (a-c), a crystal trapped in the film formed after immersion in 50.0 mM SeO32− in 0.1 M NaCl (d), and synthetic MgSeO3 (e).
Micro-Raman analysis of one of the crystals trapped in the film formed in the 50.0 mM solution produced a distinctive spectrum, which is also shown in Figure 7. Here, sharp bands were observed at 795 and 400 cm−1, as well as a number of smaller sharp bands below 225cm−1. Diffuse bands were observed at 650 and 400 cm−1. These features were not observed in the spectra collected from the uniform film that covered the surface. These bands match well with scattering bands arising from lab-synthesized bulk MgSeO3 hydrate (Fig. 7e), which was formed by titration of a MgCl2 solution with Na2SeO3 to induce precipitation of the compound. The spectrum of the trapped crystal also contains weak scattering associated with a-Se, and t-Se, which were picked up due to scattering arising from the film entrapping and surrounding the crystal.
Surface film cross sections were also examined by SEM imaging of sections prepared by focused ion beam (FIB) milling. Figures 8a through 8c show plan views of surfaces after FIB removal of the cross sections and Figures 8d through 8f show the cross section of films on AZ31 formed during 24-hour immersion in 0.1M NaCl solution with 1.0, 10, and 50 mM Na2SeO3 additions respectively. Estimated coating thicknesses are 150 nm for the film formed in 1.0 Na2SeO3, 250 nm for the 10 mM solution, and 1000 nm for the 50 mM solution. There are variations in contrast in the cross section of the film formed in the 1.0 mM solution that are consistent with coating porosity. These variations increase in number for the film formed in the 10 mM solution, but are not visually apparent in the film formed in the 50 mM solution. The film formed in the 50 mM solution is cracked significantly due to dehydration in the microscope column. Whether the observed porosity evolves into shrinkage cracks or is obscured by different imaging physics associated with cracked film is not clear.
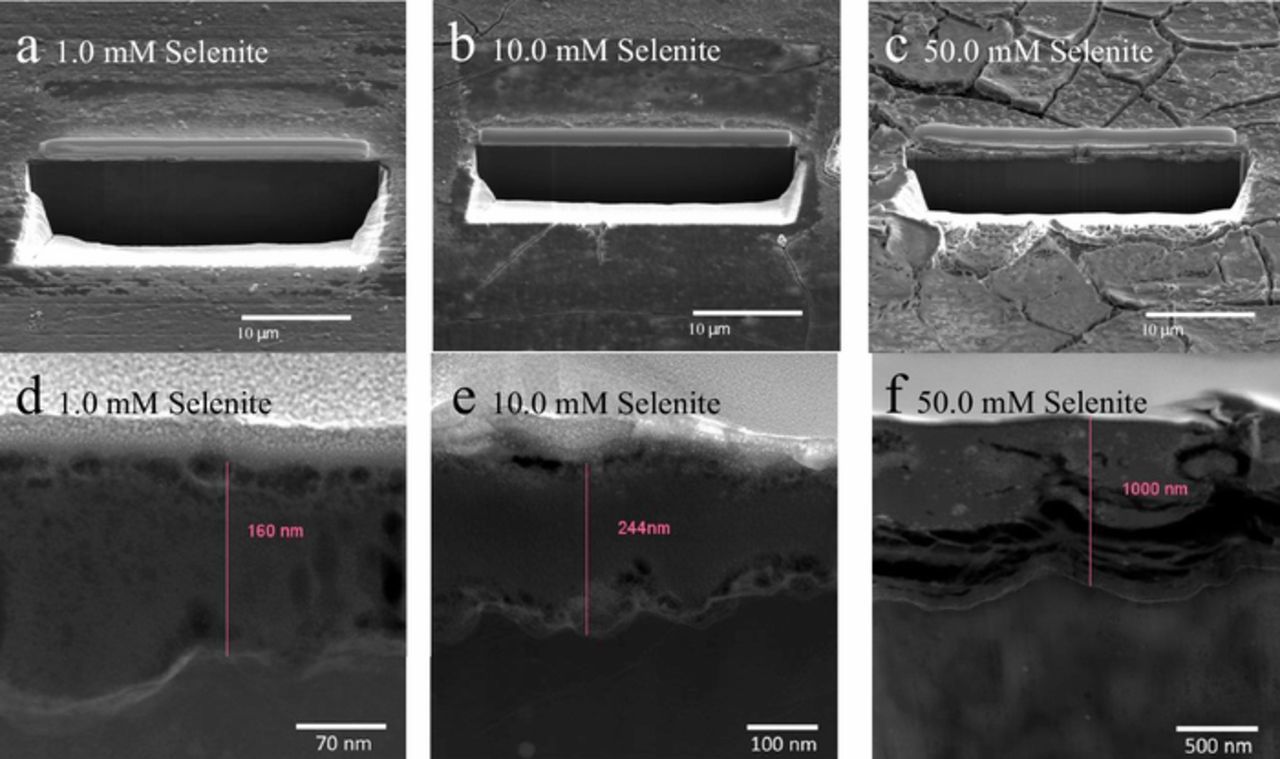
Figure 8. FIB-TEM images of AZ31 after a 1-day immersion in various concentrations of SeO32− in 0.1 M NaCl.
These samples exposed for 24 hours were subjected to STEM-EDX mapping, providing elemental analysis of the cross sections (Figure 9). These data show that immersion in each of the three selenite concentrations resulted in films that contained Mg, O, and Se. Immersion in the 1.0 mM solution appears to have resulted in a film with less, but more evenly dispersed Se. The film formed on the sample immersed in 10.0 mM solution had more but less evenly dispersed Se than the sample immersed in the 50.0 mM solution. The thicker film formed in the 50.0 mM solution contained both voids or cracks and areas of highly concentrated Se (Figure 9c). These results indicate an intermixing of the Mg and Se through the thickness of the coating.
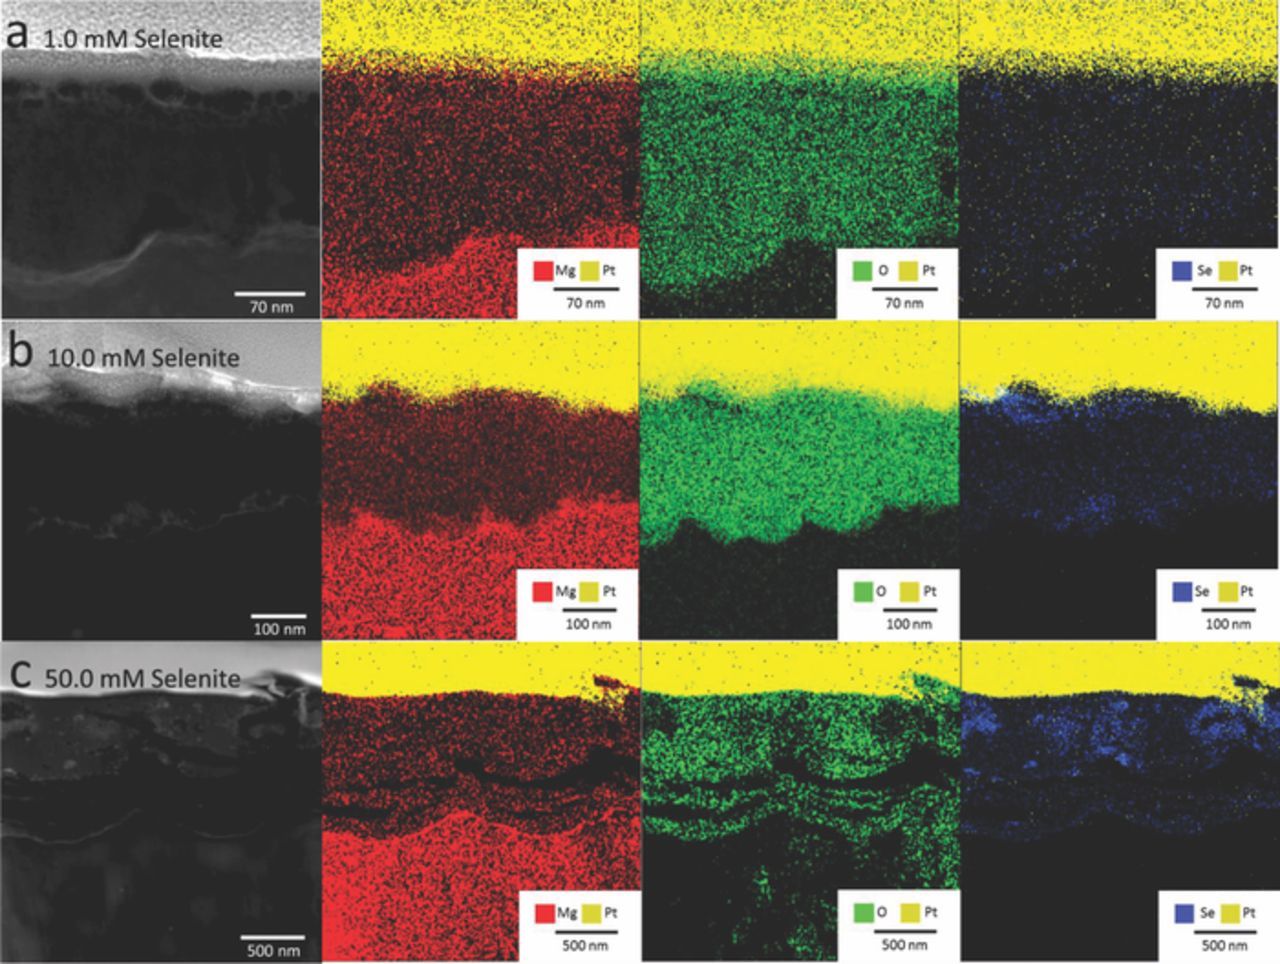
Figure 9. STEM-EDX images of AZ31 Mg after a 1-day immersion in various concentrations of SeO32− in 0.1 M NaCl.
The shrinkage cracking phenomenon, discussed above, is revealed more clearly in plan view imaging in Figure 10, which shows coatings formed at each concentration during a 72-hour immersion period. Shrinkage cracking is an artifact of surface film dehydration in the microscope column, porosity is likely not. The EIS spectra shown in Figure 3 indicate that the surface films that form possess defects that lead to the two-time constant response. It should also be noted that shrinkage cracking increases as coating thickness increases. The observation of shrinkage cracking in the microscope column is likely associated with dehydration of the surface film. This in turn suggests that the surface films that are forming are predominantly hydrated gels.
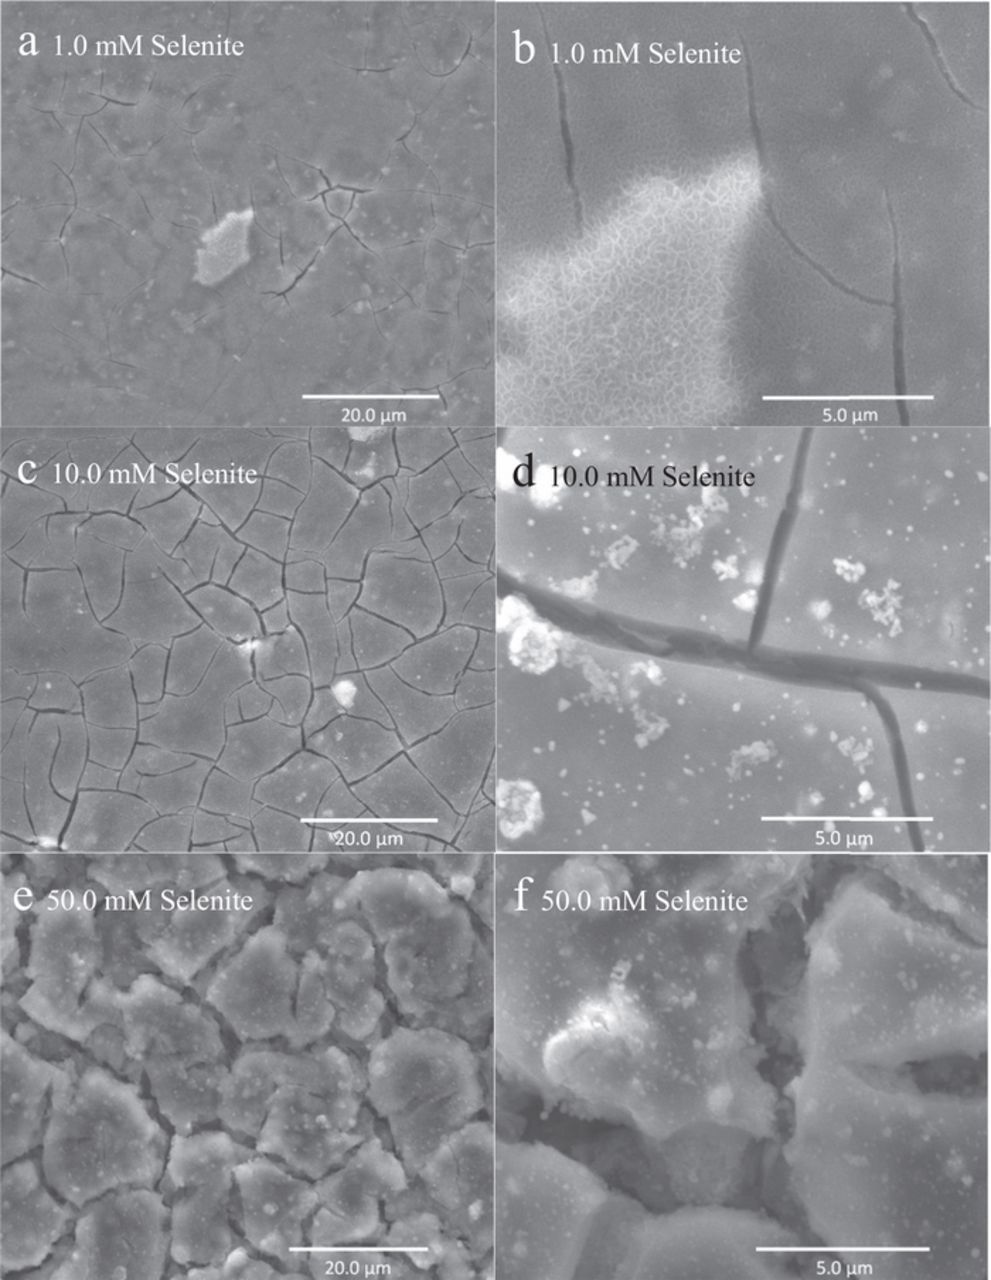
Figure 10. Corrosion morphology of AZ31 after a 3-day immersion in various concentrations of SeO32− in 0.1 M NaCl.
Plan view EDS mapping of the samples from the 72-hour exposure indicate some lateral chemical heterogeneity in the surface films (Figure 11). This is mainly associated with the presence of Al-rich intermetallic particles. There is an enhanced Al EDS signal after exposure to the 1.0 mM selenite solution, while this may in part be due to X-ray signals from the intermetallic particle under the coating, Figure 10b shows the distinctive morphology of the double layered Mg-Al hydroxcarbonate compound indicating that some aluminum has dissolved from the intermetallic to participate in film formation. Otherwise, the dispersions of Mg, Se and O are uniform across the surface within the detection limits of the EDS technique.
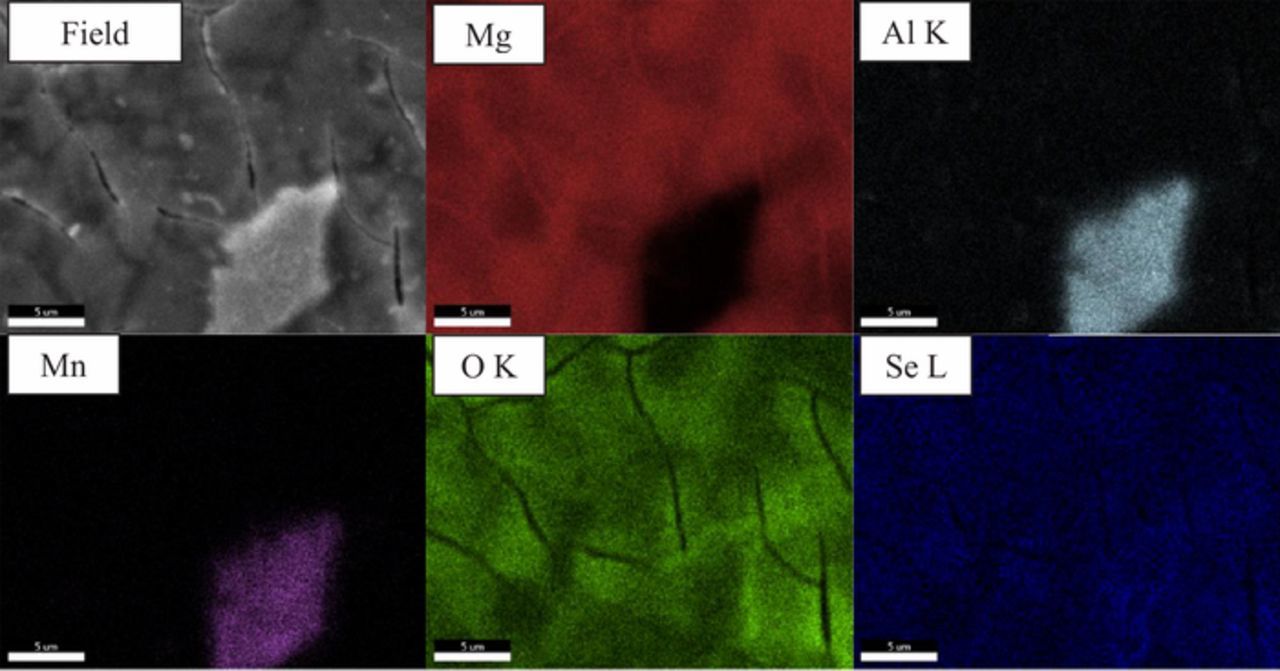
Figure 11. EDS maps of AZ31 after a 3-day immersion in 1.0 mM SeO32− in 0.1 M NaCl.
XPS
Figure 12 shows the XPS spectra of samples immersed at OCP for 3 days in a 1.0 mM selenite and 0.1 M chloride solution. Surface films formed under these conditions were compact with very little shrinkage cracking under an applied vacuum.
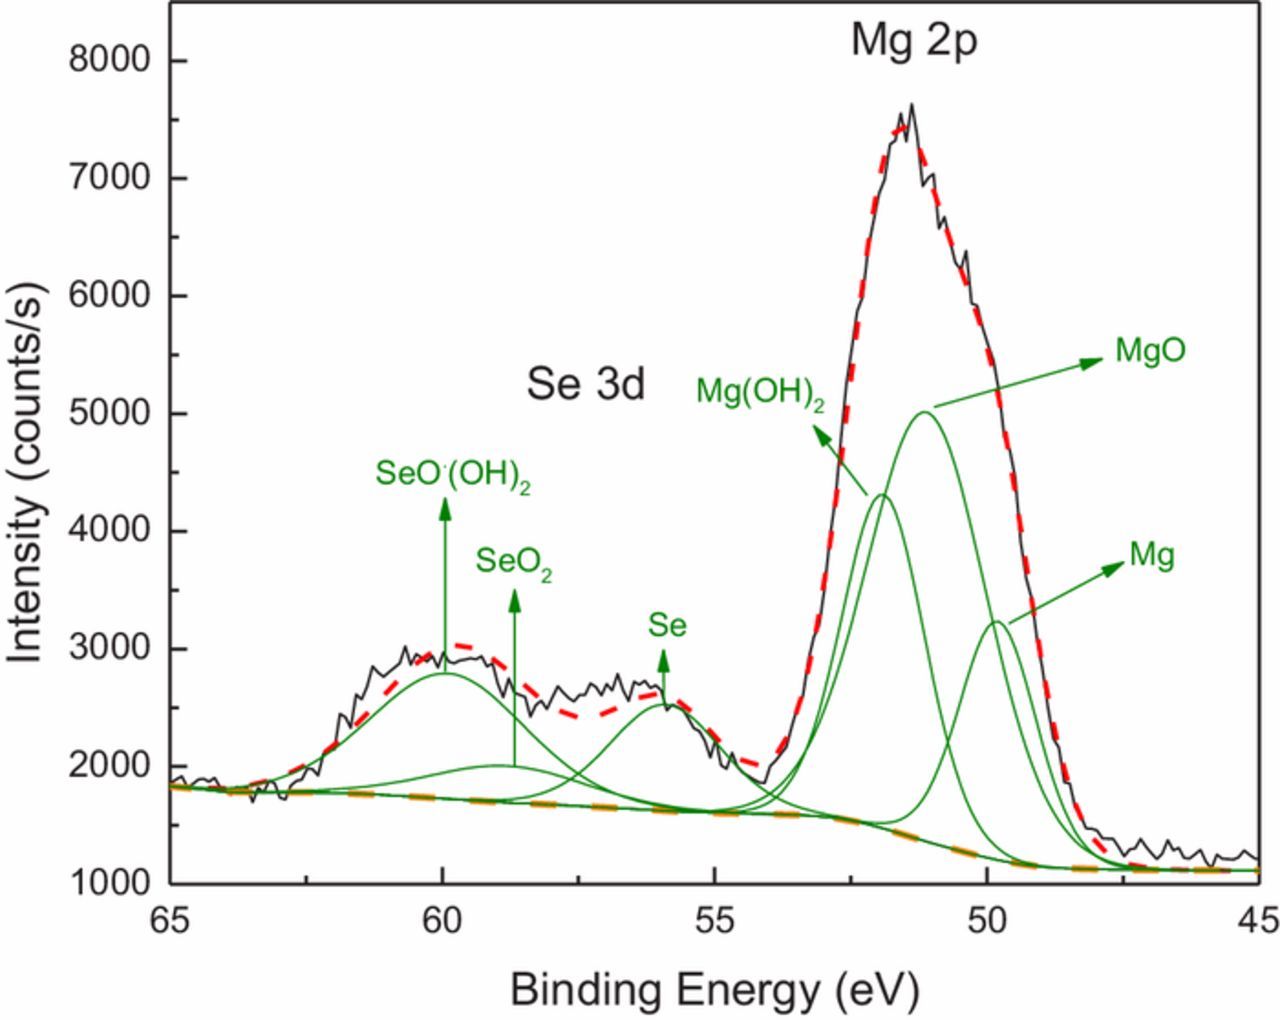
Figure 12. XPS of the Se 3d and Mg 2p spectral region from an AZ31 surface after a 72-hour immersion in a solution of 1.0 mM Na2SeO3 and 0.1 M NaCl.
As indicated by the Mg2p spectrum, the corrosion of Mg results in the formation of MgO and Mg(OH)2 on surface. Mg0 arises from the underlying metallic substrate. Selenium is present as reduced Se0 and unreduced Se4+. Substantial fractions of SeO2 and SeO(OH)2 (or possibly SeO2.H2O) are detected in the surface film. The ratio of Se to Mg is 1:2.64 on an area fraction basis, indicating that Mg and Mg corrosion products make up a much greater fraction of the surface film than Se and its associated reaction products, consistent with the EDS maps shown in Figure 9.
Discussion
The effect of selenite concentration on inhibition
The results of this study show that selenite is both an anodic and a cathodic inhibitor of the magnesium corrosion process, and that the extent of inhibition in dilute chloride solutions is strongly dependent and inversely related to concentration between 1 and 50 mM.
Both EIS and anodic polarization measurements indicated the use of lower versus higher concentrations of selenite to promote corrosion resistance. Specifically, in EIS experiments, exposure to 0.5 mM and 1.0 mM Na2SeO3 yielded similar values of Rtot, which were significantly greater than those obtained at higher concentrations (Figure 3). Likewise, in anodic polarization experiments a 1.0 mM selenite solution produced the lowest corrosion current density, albeit with breakdown potentials that were similar to those observed in both lower and higher concentrations (Figure 5).
Anodic inhibition
Anodic inhibition was concentration-dependent and appeared to depend also on the characteristics of the film, which were themselves concentration-dependent. Exposure of AZ31 at higher concentrations (or for longer periods) resulted in a thicker, but less protective film. Plan view observations of surfaces exposed to 50 mM selenite solution showed defects in the form of MgSeO3 crystals and small pits that might work antagonistically against the protectiveness of a thicker film. STEM cross sections of coated surfaces showed that films formed in the highest concentration (50.0 mM) were not as compact and may have contained subsurface voids and shrinkage cracks that might have been detrimental to corrosion protection; an idea elaborated on below.
Cathodic inhibition
Strong cathodic inhibition was observed in these experiments, with the remarkable feature that the extent of inhibition was independent of selenite concentration in solution (Figure 4); at least at short exposure times. The fact that the pre-exposure period prior to measurement was only 30 minutes is an important condition attached to this result.
The formation of a protective film, presumably the Mg-Al double layered hydroxide on noble Al-Mn particles, (Figure 11) is notable in longer-term exposures. Its presence would suppress hydrogen reduction at these particles, but its existence in the 30-minute exposures was not ascertained.
The cathodic inhibition noted in this work bears similarities to the work of Eaves et al., who studied corrosion inhibition of Mg by arsenate.22 Arsenate and selenite have some similarities in that they both form precipitates in the presence of aqueous Mg2+ (Mg3(AsO4)2 and MgSeO3, respectively) and they both can be reduced in the presence of Mg to form As0 and Se0. The work of Eaves et al. demonstrated that at low pH, the reduction of arsenate to solid arsenic, rather than precipitated Mg3(AsO4)2, acts to poison hydrogen reduction on iron particles contained in a Mg matrix. Although, in the case of arsenate, the reduction reaction was limited to low pH conditions. In this study, Raman analysis indicated that in the case of selenite, low pH was not required for the reduction of Se4+ to Se0 to proceed.
The effect of film structure and chemistry on protection
The XPS results pointed to a mixed Mg-Se oxyhydroxide that is probably a gel-like substance upon initial formation. Raman analyses point to additional complexity and the possibility of structural transformation that may affect corrosion protection over time. The Raman work confirms the presence of Se0 in all the films regardless of SeO32− concentration in solution. The formation of Se0 is expected when SeO32− is exposed to a strongly reducing Mg alloy surface. Se has several allotropes and, similar to sulfur, these allotropes are all polyatomic units, making them Raman active. The Raman analysis also confirms that differences in the color of the films, observable in Figure 2, can be attributed to the ratio of a-Se (amorphous) to t-Se (crystallized).
With time or with increased temperatures, thermodynamically unstable brick-red a-Se will naturally convert to the more thermodynamically stable dark gray or black t-Se.44 These properties agree with the visual results in Figure 2 and the Raman spectral results shown in Figure 7. Furthermore, the visual data agree with the Raman results which indicate that samples immersed in higher concentrations formed films that contained a higher percentage of t-Se (231 cm−1 peak) versus a-Se (251 cm−1 peak). Both visual inspection and Raman analysis indicate that the films formed at higher concentrations contained more of both allotropes of Se. However, they were darker due to a higher percentage of the dark gray t-Se.
Lindberg et al. studied the transformation process of t-Se (deposited on an Si substrate) to t-Se using Raman mapping and atomic force microscopy.45 It was found that the transformation to t-Se will distort the surrounding a-Se, leaving gaps and cracks in the film. This effect, if it occurs in the mixed Mg-Se film that are indicated by XPS, may explain the decrease in corrosion protection observed for films formed in the 50 mM selenite solutions.
The effect of solution pH
Although pH might have an effect on the ability of selenite to inhibit corrosion, in this work the bulk pH remained relatively stable between and 8 and 9 throughout all the experiments. This stability might be attributed to either the small surface to volume ratio in these experiments or suppression of water reduction, though the results of control experiments of AZ31 immersed in 0.1 M NaCl (without selenite inhibitor) seem to favor suppression of water reduction. In the control experiments, the pH of the solution climbed from 5.8 to 6.5 after one hour and it rose to 7.9 after 24 hours. Therefore, the apparent lack of pH increase observed in the SeO32− plus 0.1 M NaCl solutions seems to point to suppression of hydrogen reduction.
MgSeO3
When visually comparing the films formed under the two highest concentrations, the somewhat lighter appearance of the film formed in 50.0 mM solution versus 10.0 mM solution (Figure 2) can be attributed to the presence of precipitated colorless crystalline MgSeO3 that became trapped in the film. Raman indicated the presence of MgSeO3 in the film formed in the 50.0 mM solution only, which did not protect as well as the films formed at lower concentrations, however, the presence of MgSeO3 should not be ruled out as a corrosion inhibitor. It merits further study as it may have properties similar to the protective Mg3(AsO4)2 films reported by Eaves et al.22
Conclusions
- (1)Millimolar additions of selenite as Na2SeO3 significantly reduce the corrosion rate of AZ31 exposed to 0.1 M NaCl solutions. Corrosion inhibition is due to a mixed Mg-Se oxyhydroxide surface film whose character is strongly influenced by the presence of Se0 and Se4+.
- (2)The protective film formed on AZ31 upon exposure to selenite-bearing solutions provides both anodic and cathodic inhibition and the extent of inhibition is inversely related to selenite concentration in the range of 1 to 50 mM.
- (3)Cathodic protection due to the suppression of hydrogen reduction occurs independent of selenite concentration in solution in short-term pre-exposure experiments.
- (4)Anodic protection is dependent on the concentration of the bath. Exposure in a lower concentration (1.0 mM) versus higher concentrations (10.0 and 50.0 mM) resulted in higher total impedances in EIS and lower corrosion current densities in polarization measurements. Within the margins of error, breakdown potential values were not concentration-dependent.
- (5)The morphologies of films formed on AZ31 upon exposure to aqueous selenite were concentration-dependent. Films formed at a low concentration (1.0 mM) were uniform and continuous, whereas the film formed in higher concentrations (10.0 and 50.0 mM) were less uniform and contained cracks and gaps, which increased as bath concentration increased. These observations are attributed to the transformation process of a-Se to t-Se, which may distort the film structure.
Acknowledgment
This research was sponsored by the Army Research Laboratory and was accomplished under Cooperative Agreement Number W911NF-14-2-0004. The views and conclusions contained in this document are those of the authors and should not be interpreted as representing the official policies, either expressed or implied, of the Army Research Laboratory or the U.S. Government. The U.S. Government is authorized to reproduce and distribute reprints for Government purposes notwithstanding any copyright notation herein. Purchase of the Raman microprobe was supported by the National Science Foundation under grant No. 0639163.
ORCID
Zhiyuan Feng 0000-0002-3783-9155
Belinda Hurley 0000-0002-3831-4545