
Abstract
Rubidium doped cathode materials RbxLi1.27-xCr0.2Mn0.53O2 (x = 0, 0.01, 0.03 and 0.05) were prepared via a solid state reaction method. The influences of the amount of Rb+ incorporated in the cathodes on the electrochemical performance were investigated in detail. It was found that the initial specific capacity, coulombic efficiency and rate performance were improved by Rb doping. Among the prepared cathode samples, the Rb0.03Li1.24Cr0.2Mn0.53O2 material presented the best results. The material showed an initial discharging capacity of 224.9 mAh·g−1, a capacity retention of 98.8% after 50 cycles and excellent high-rate performance of 92.0 mAh·g−1 at 5C rate. The improved diffusion coefficient of Li ions in the Rb+ incorporated cathodes was confirmed by electrochemical impedance measurement. The changes in diffusion coefficient are in good accordance with the changes in lattice parameter of c axis obtained from XRD Rietveld refinement. With the increase in Rb concentration, the interlayer spacing increases, then the diffusion of Li ions is enhanced and finally the electrochemical properties is improved. However, when x reaches 0.05, the lattice distorsion happened, c axis begins to shrink, the Li ion diffusion is restricted, and therefore the electrochemical performance is reduced with further increase in Rb concentration.
Export citation and abstract BibTeX RIS
Due to high power density, high working voltage and excellent cyclic performance,1,2 lithium ion batteries (LIBs) have become one of the main power supply sources for mobile phones, digital cameras, laptop computers and so on.3 With the application extended to electric vehicles (EVs), hybrid electric vehicles (HEVs), plug-in hybrid electric vehicles (PHEVs), communication technology and mobile storage devices field,4 new LIBs systems with high energy densities are badly required. Performance of those lithium-ion batteries, such as working voltage and power density, is mainly determined by the property of the cathode materials.5 Therefore, the development of high voltage cathode materials with improved duration is one important research direction for lithium ion battery with high energy density.
Recently, the solid solutions of layered Li2MnO3 and LiMO2 (M = Ni, Co, Mn, etc.) have received much attention due to their high capacity over 200 mAh·g−1 when electrochemically activated above 4.4 V by the removal of Li+ and oxygen from their structure on charge.6 Such layered materials are potential materials for using as high-voltage cathodes in lithium-ion batteries due to their high energy density and low cost.7 Among the materials investigated, the layered structure LiCrO2-Li2MnO3 has been studied by some research groups. Park et al.8 reported the synthesis method of Li[CrxLi(1-x)/3Mn2(1-x)/3]O2 (0.1 ≤ x ≤ 0.4) with a nanocomposite structure by a solution method and subsequent quenching. The materials showed a high capacity of 195 mAh·g−1 between 2.4 and 4.7 V at a current density of 11.98mA·g−1. K. Y. Chung9 synthesized Li[CrxLi(1/3-x/3) Mn(2/3-2x/3)]O2 (0 < x< 1) by the sol-gel method. Li[CrxLi(1-x)/3Mn2(1-x)/3]O2 with x = 1/6 showed a reversible capacity of 230 mAh g−1 between 2.0 and 4.8 V at a current density of 5mA·g−1. In addition, layered Li-Cr-Mn-O cathode materials related to the LiCrO2-LiMnO2 -Li2MnO3 solid solution have been synthesized by the mixed hydroxide method.10,11 The cathode material in terms of high capacity and stable cycling performance exhibits an average discharge capacity of 204 mAh·g−1 between 2.5 and 4.5 V versus Li/Li+. On the other hand, Ko et al.12 reported the 0.55Li2TiO3-0.45LiCrO2 composite with the initial discharge capacity of 203 mAh·g−1. An unique three-electron oxidation of Cr(III) into Cr(VI) was observed in layered Li(Li, Mn, Cr)O2. As reported by Ammundsen et al.13 Li1.2Cr0.4Mn0.4O2 shows a discharge capacity of 170 mAh·g−1, 142.5 mAh·g−1, 130.1 mAh·g−1, 118.7 mAh·g−1 and 102.5 mAh·g−1 at 0.1C, 0.2C, 0.5C, 1C and 2C. Compared to other materials, the rate performance of Li1.2Cr0.4Mn0.4O2 are not good enough. In addition, the first cycle charge and discharge specific capacity were 258 mAh·g−1 and 172 mAh·g−1, therefore the initial coulomb efficiency is only 68.9% for the prepared cathode material. However, despite these promising attributes, these materials electrodes suffer from several disadvantages, such as voltage fade and structure change. Therefore, some other effective modification strategies are needed to overcome the shortcoming.
The large irreversible capacity loss during the initial cycle, voltage fade and poor rate capability are still three of the main unsolved issues, which obstructed the commercial application of these materials. Studies showed that in order to overcome irreversible capacity loss during the initial cycle and poor rate capability, surface modification of coating particle surface with conductive agent and partial element doping are used to realize electrochemical performance improvement.14–21 Amounts of works have been accomplished to improve the electrical conductivity, reduce contraction between surface of materials particle and electrolyte to suppress the materials dissolution by coating the material with Al2O3,14 ZrO2,15 TiO216 and carbon.17 Doped with other elements such as Na,18,19 Al,19 Mo20 and F.21 For the problem of voltage fade, Jason R. Croy provided that the practical importance of limiting the amount of Li2MnO3 and/or the extent of activation in these composite structures, thereby providing electrode stability to counteract voltage fade and hysteresis.22 The examined cathode materials exhibited some measurable improvements in cyclic stability and rate capacity. Very recently, Rb incorporated23 Li1.2Mn0.54Co0.13Ni0.13O2 layered oxide cathodes were reported by our group, in which the electrochemical performance of the cathode material was greatly enhanced due to the reduced energy barrier for the intercalation/deintercalation process of Li+ in the cathode caused by Rb incorporation.
In view of this, it is expected that Rb+ incorporation would be beneficial to the electrochemical performance by enlarging the interslab space and thus enhancing the diffusion kinetics in the bulk electrode, meanwhile stabilizing the layered structure of cathode material during galvanic cycling. Therefore, Rb+ incorporated Li1.27Cr0.2Mn0.53O2 powders based on Cr3+/Cr6+ redox pairs were prepared and the related electrochemical properties were examined in this study. It was found by the results that the interslab space was slightly enlarged, together with the increased specific capacity and rate performance. The promoted Li+ diffusion coefficient, caused by the increased crystalline parameters, could be ascribed to the key factor for the enhanced electrochemical performance.
Experimental
Synthesis of RbxLi1.27-xCr0.2Mn0.53O2 using the solid state reaction method
The RbxLi1.27-xCr0.2Mn0.53O2 (x = 0, 0.01, 0.03 and 0.05) cathode materials were prepared by solid reaction method. In a typical process, according to the chemical composition, a certain amount of lithium hydroxide, kept in excess of 5 wt% in the stoichiometric ratio, was dissolved in distilled water. Cr2O3 (99%), Rb2CO3 (99%) and MnO2 (99%) powders were added to form a suspension with continuous stirring. The resulting suspension was poured into a ball mill and treated for 2 hours to achieve a particle size of 100∼300 nm using Zirconia beads as the grinding media. Then the ball-milled slurry was spray dried and the precursor powders were obtained. Finally the powders were calcined at 500°C for 3 hours and then fired at 900°C for 12 hours in nitrogen to form the target RbxLi1.27-xCr0.2Mn0.53O2 (x = 0, 0.01, 0.03 and 0.05) cathode materials.
Instrumentation
The phase purity and crystal structure determination of the prepared powders were identified by TD3200 X-ray diffraction method with Cu Kα radiation (λ = 1.54056Ǻ) carried out at 40 KV and 30 mA. The data were collected in the 2θ range of 10°–80°. The XRD data with Rietveld refinement were carried out using Jade 9 software. The morphologies of the samples were examined by scanning electron microscopy (SEM, Hitachi, SU8200).
The electrochemical performances of the samples were investigated using electrodes CR2016 coin-type cells, which were assembled inside a glove box filled with Ar. For electrochemical characterization, the working electrodes were prepared by mixing 80 wt% cathode material, 10 wt% conductive carbon, and 10 wt% polyvinylidene difluoride (PVDF) in N-methyl- 2pyrrolidone (NMP) solvent. After thorough mixing, the homogenous slurry was cast onto an aluminum foil current collector and then dried under vacuum at 120°C for 12 h. The electrochemical performance of the prepared electrodes were determined on a Land CT2001 battery tester at the voltage of 2.0–4.8 V. Electrochemical Impedance Spectroscopy (EIS) was conducted by an electrochemical workstation (Autolab Pgstat302n) and the data were collected in the frequency range 0.05–500 KHz.
Results and Discussion
Phase purity and structural refinement of synthesized cathode powders
Phase identification was carried out with XRD measurements. Fig. 1 showed the XRD patterns of the cathode RbxLi1.27-xCr0.2Mn0.53O2(x = 0, 0.01, 0.03 and 0.05) materials prepared at 900°C. It is clear from the patterns that all the peaks are sharp and well-defined. All the peaks can be indexed into a hexagonal α-NaFeO2 structure, except several ordering peaks between 20° and 30° which was regarded as the superlattice of Li2MnO3 type structure by several groups.24–26 As presented in Fig. 1, the Rb modified materials exhibit no new peaks or impurities compared to the pristine Li1.27Cr0.2Mn0.53O2, implying that Rb ions were incorporated into the mother lattice and did not form new compounds in the prepared powder. The slightly shifted peaks shown in the inset imply that the crystal parameters were slightly increased by Rb doping since the ionic radius of Rb ions is much bigger than that of Li ions. Furthermore, it can be observed from the patterns the splitting of the (006)/(012) and (018)/(110) doublets, which indicated a highly ordered layered structure for the prepared cathode materials. The above XRD results strongly indicated the successful synthesis of a pure phase for the layered hexagonal product in the experiment, and the obtained Li1.27-xRbxCr0.2Mn0.53O2 compound can be regarded as a normal layered Li[Li0.27-xRbxCr0.2 Mn0.53]O2 compound. For samples with x less than 0.03, no Rb-related peak is observed, implying that Rb ions have been successfully introduced into the host layered structure. When the content of Rb ion increased to x = 0.05, some other diffraction peaks were observed between 12° and 30°, showing the formation of impurity phases and therefore a suitable doping concentration of 3% was determined.
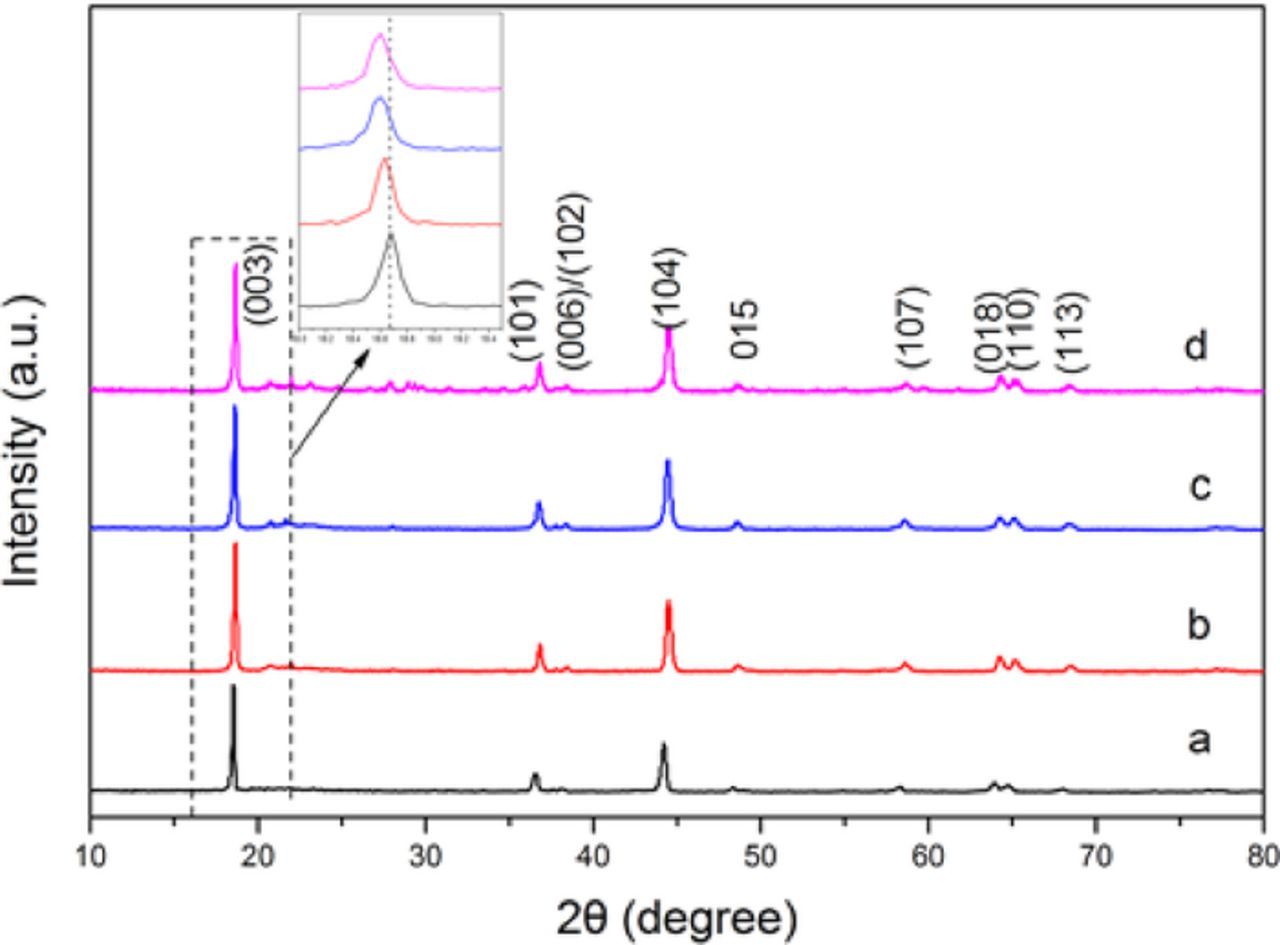
Figure 1. XRD patterns of RbxLi1.27-xCr0.2Mn0.53O2: (a) x = 0, (b) x = 0.01, (c) x = 0.03 and (d) x = 0.05.
The experimental XRD patterns were further analyzed by Rietveld refinement to study the structure in detail. Fig. 2 shows the Rietveld refinements of the XRD patterns for RbxLi1.27-xCr0.2Mn0.53O2 (x = 0, 0.01, 0.03 and 0.05). A structural model with R-3m space group was employed during the Rietveld refinement. To better understand the effect of Rb doping on structure of the prepared samples, lattice parameters and atomic occupancies of all samples were provided on the basis of high symmetry R-3m space group, as listed in Table I and Table II. Generally the weight profiled factor Rwp and expected R factor (Rexp) in Table I are two important factors to evaluate the refinement results, and it is reliable and acceptable when the Rexp is below 10%.27 Therefore, in our case, as can be seen in Table I, the small weight profiled factor Rwp and expected R factor (Rexp) demonstrated the proposed structural model R-3m is correct, and the refinement results are acceptable. It is also found by the refinement that Rb ions were placed in the original Li sites (3b site) and the related site occupancies are very close to the doping concentration. Therefore, Rb ions were introduced into the layered structure in our case. Furthermore, it can be seen from Table I that the unit volumes of Rb replaced samples were enlarged in comparison with the sample without Rb (x = 0). The variations of cell volumes explicitly suggest that Rb ions, with larger ionic radius have been successfully introduced into the bulk crystalline structure of Li layers by replacing the original Li ions which caused the expansion of the lattice. The same tendency was observed for cell parameter of a axis value. However, difference was observed for c axis value. When Rb doping concentration reaches x = 0.03, sample Li1.24Rb0.03Cr0.2Mn0.53O2 (x = 0.03) demonstrates the largest value of parameter c which stands for the interspacing of transition metal layers. The increased c value can reduce the energetic barrier impending Li-ions migration and facilitate the Li insertion and extraction upon electrochemical cycling. Further increase in x value (x = 0.05) did not keep the tendency, but decreased c axis value. Therefore, we can judge from the above results that with small amount of Rb replacing, the crystal lattice was uniformly expanded, but large distortion in crystal parameters will be formed when large amount of Rb ions were introduced. The reason for such distortion in crystal lattice is not clear yet and will be studied elsewhere.

Figure 2. Rietveld refinements of RbxLi1.27-xCr0.2Mn0.53O2: (a) x = 0, (b) x = 0.01, (c) x = 0.03 and (d) x = 0.05.
Table I. Rietveld Refinement Results for the XRD Patterns.
| Samples | Atom | Wyckoff position | x | y | z | Occupies | Rexp (%) | Rwp (%) |
|---|---|---|---|---|---|---|---|---|
| Li (1) | 3b | 0 | 0 | 0.5 | 0.9998 | |||
| Li (2) | 3a | 0 | 0 | 0 | 0.2686 | |||
| Rb = 0 | Mn(1) | 3a | 0 | 0 | 0 | 0.5274 | 9.49 | 10.44 |
| Cr(1) | 3a | 0 | 0 | 0 | 0.1984 | |||
| O(1) | 6c | 0 | 0 | 0.2416 | 1 | |||
| Li (1) | 3b | 0 | 0 | 0.5 | 0.9901 | |||
| Rb(1) | 3b | 0 | 0 | 0.5 | 0.0094 | |||
| Rb = 0.01 | Li (2) | 3a | 0 | 0 | 0 | 0.2611 | 9.33 | 10.26 |
| Mn(1) | 3a | 0 | 0 | 0 | 0.5289 | |||
| Cr(1) | 3a | 0 | 0 | 0 | 0.1987 | |||
| O(1) | 6c | 0 | 0 | 0.2412 | 1 | |||
| Li (1) | 3b | 0 | 0 | 0.5 | 0.9703 | |||
| Rb(1) | 3b | 0 | 0 | 0.5 | 0.0286 | |||
| Rb = 0.03 | Li (2) | 3a | 0 | 0 | 0 | 0.2643 | 9.21 | 10.13 |
| Mn(1) | 3a | 0 | 0 | 0 | 0.5254 | |||
| Cr(1) | 3a | 0 | 0 | 0 | 0.1969 | |||
| O(1) | 6c | 0 | 0 | 0.2406 | 1 | |||
| Li (1) | 3b | 0 | 0 | 0.5 | 0.9926 | |||
| Rb(1) | 3b | 0 | 0 | 0.5 | 0.0463 | |||
| Rb = 0.05 | Li (2) | 3a | 0 | 0 | 0 | 0.2679 | 11.42 | 12.56 |
| Mn(1) | 3a | 0 | 0 | 0 | 0.5282 | |||
| Cr(1) | 3a | 0 | 0 | 0 | 0.1985 | |||
| O(1) | 6c | 0 | 0 | 0.2412 | 1 |
Table II. Rietveld refinement results of lattice parameters for RbxLi1.27-xCr0.2Mn0.53O2 (x = 0, 0.01, 0.03 and 0.05) cathode materials.
| Samples | a(Å) | c(Å) | V(Å3) |
|---|---|---|---|
| x = 0 | 2.8643 | 14.2645 | 101.35 |
| x = 0.01 | 2.8779 | 14.2861 | 102.47 |
| x = 0.03 | 2.8853 | 14.3094 | 103.16 |
| x = 0.05 | 2.8896 | 14.2737 | 103.21 |
SEM observation of the prepared powder.—Surface morphologies, as well as particle sizes, were investigated by SEM. Fig. 3 shows the SEM images of the pure and Rb-incorporated Li1.27Cr0.2Mn0.53O2 materials prepared at 900°C under the N2 atmosphere. It can be seen from the micrographs that the four samples display very similar morphology of round primary grains with smooth surface and the average grain size for the primary particles was determined as 100–300 nm. It can also be observed from the micrographs that with the increase of doping concentration, the particle size is slightly reduced, indicating that the doping of Rb ions is beneficial in achieving smaller crystalline size, although the reason is not clear yet. Microspores among the nano sized grains were also observed for all sample powders. Such nano-micro structures of the spherical powders provide enough spaces for electrolyte and thus good electrochemical performance was expected.
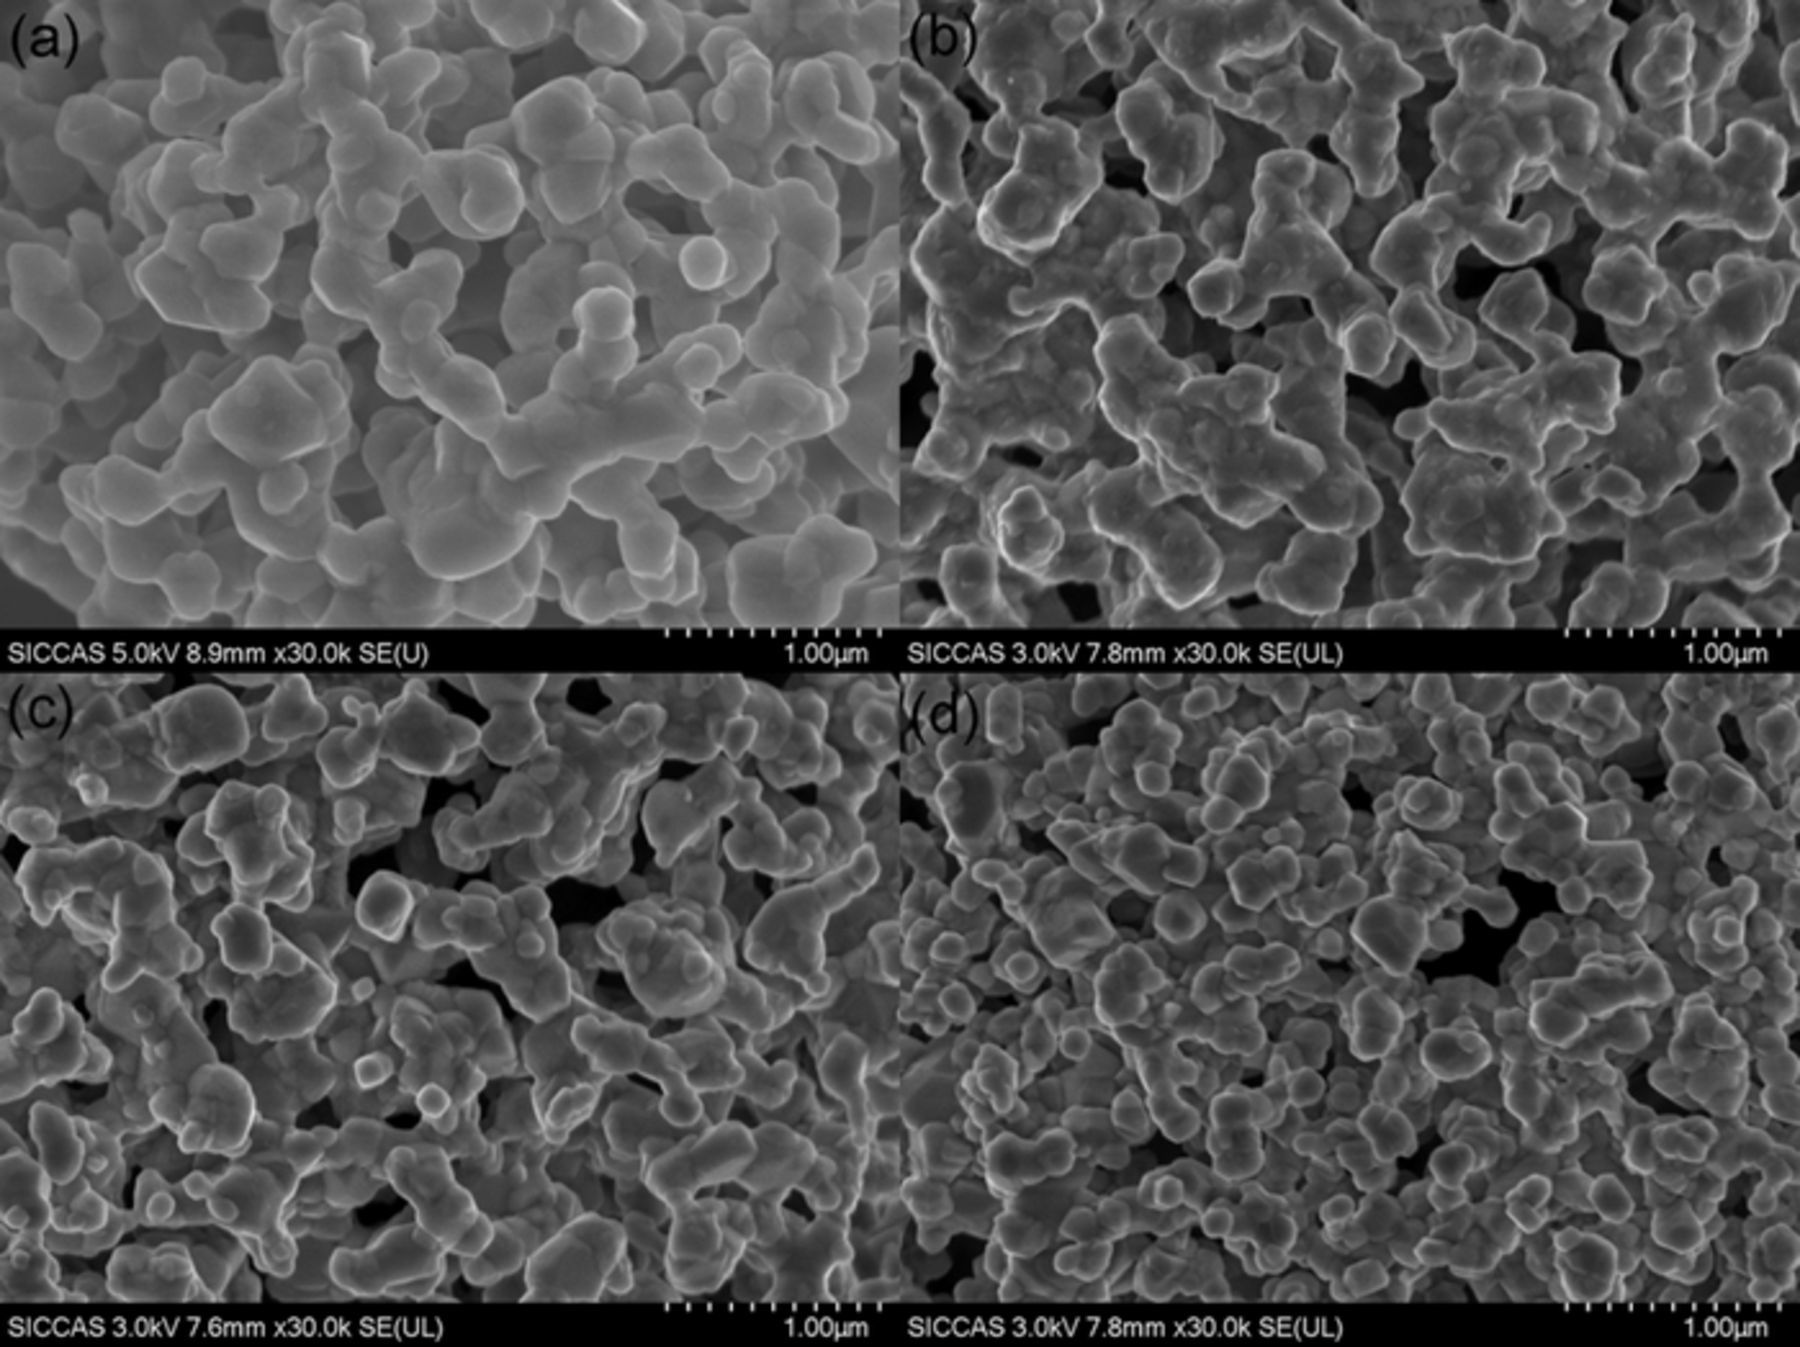
Figure 3. SEM images of Li1.27-xRbxCr0.2Mn0.53O2: (a) x = 0, (b) x = 0.01, (c) x = 0.03 and (d) x = 0.05.
Enhanced specific capacity with Rb incorporation
The initial charge/discharge curves of RbxLi1.27-xCr0.2Mn0.53O2 (x = 0, 0.01, 0.03 and 0.05) electrodes at a constant current density of 20 mA·g−1 (0.1C) between 2.0 and 4.8 V at room temperature were compared in Fig. 4. It is clear from Fig. 4a that, Rb substituted samples exhibit super electrochemical performance over the pristine one. The undoped Li1.27Cr0.2Mn0.53O2 cathode delivered a discharge capacity of 182.7 mAh·g−1 at first run, while the Rb substituted electrodes show higher capacity, with 213.5 mAh·g−1 for x = 0.01, 229.1 mAh·g−1 for x = 0.03 and 195.6 mAh·g−1 for x = 0.05. Meanwhile, the Li1.27-xRbxCr0.2Mn0.53O2 electrodes offered an initial coulombic efficiency of 73.8%, 77.3%, 78.4% and 77.2% for x = 0, x = 0.01, x = 0.03 and x = 0.05. Compared with the undoped Li1.27Cr0.2Mn0.53O2 material, sample Li1.24Rb0.03Cr0.2Mn0.53O2 shows a much higher discharge capacity, which can be ascribed the fact that slight lattice doping expands the interplanar spacing and thereafter reduces the activation barrier for lithium migration and thus allows more Li+ intercalation and deintercalation inside the layered structure. As reported by Wu et al., Li1.27Cr0.2Mn0.53O2 shows the first round of coulomb efficiency of 70.7%8. Therefore, it can be concluded that, our approach, rubidium doping is effective in improving the coulombic efficiency at first run.
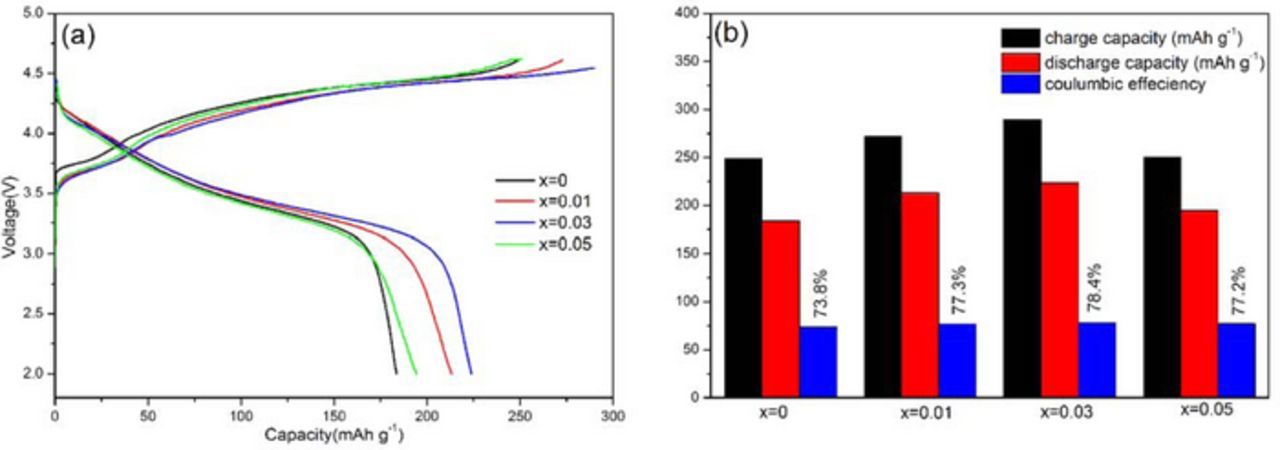
Figure 4. (a) Charge/discharge curves of RbxLi1.27-xCr0.2Mn0.53O2 (x = 0, 0.01, 0.03 and 0.05) electrodes and (b) specific capacities and coulombic efficiency.
The typical charge and discharge profiles for the different cathode are plotted in Fig. 5. The cells are cycled between 2.0 and 4.8 V at a current density of 20 mA·g−1 (0.1C) at room temperature. For comparison, the pure Li1.27Cr0.2Mn0.53O2 shows a discharge capacity of 189.3 mAh·g−1, 202.3 mAh·g−1, 196.2 mAh·g−1, 188.1 mAh·g−1, 186.7 mAh·g−1 and 178.6 mAh·g−1 on 1st, 10th, 20th, 30th, 40th and 50th cycle, respectively, whereas the discharge capacity of Li1.24Rb0.03Cr0.2Mn0.53O2 under the same testing condition is 224.9 mAh·g−1, 247.6 mAh·g−1, 234.7 mAh·g−1, 226.4 mAh·g−1, 225.3 mAh·g−1 and 222.1 mAh·g−1. By comparison, an obvious increase of 18–25% was achieved by Rb replacing. Furthermore, it is recently reported that the Al-doped cathode delivered an initial discharge capacity of 198 mAh·g−1 with a current density of 12 mA·g−1.28 In our case, the initial discharge capacity for sample x = 0.03 is 224.9 mAh·g−1. It can be seen that the Rb-doped electrodes is also an effective way to improve the initial discharge capacity, and the sample Li1.24Rb0.03Cr0.2Mn0.53O2 (x = 0.03) electrode displays the best specific capacity among the tested four electrodes.
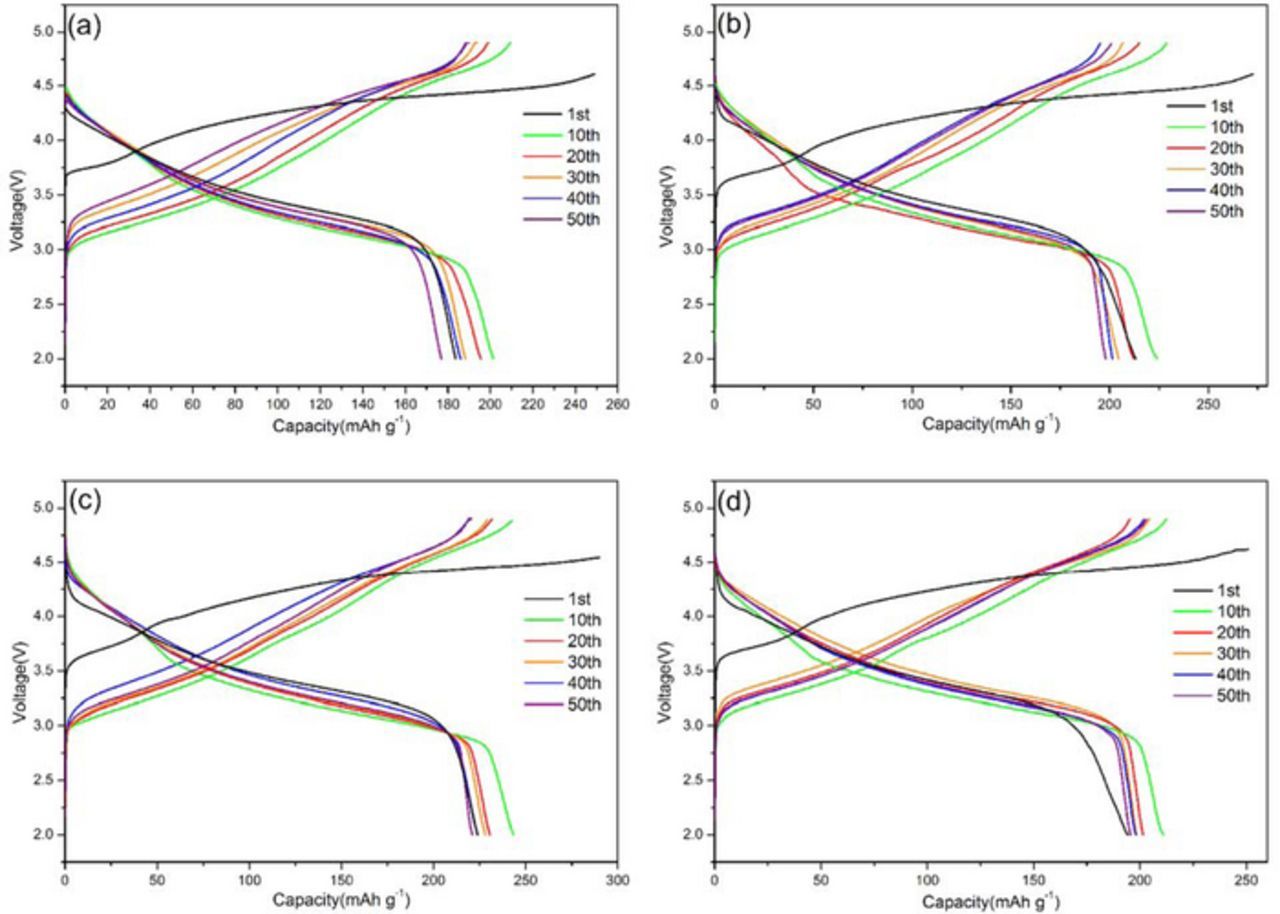
Figure 5. Charge/discharge profile of RbxLi1.27-xCr0.2Mn0.53O2 cathode at a current density of 20 mA·g−1 between 2.0 and 4.8V at various cycles: (a) x = 0, (b) x = 0.01, (c) x = 0.03 and (d) x = 0.05.
The rate performance was investigated from 0.1C to 5C as presented in Fig. 6a. Although all the electrodes showed a decrease in capacity with the increased discharge rates, the Rb-doped electrodes showed higher capacity than the Li1.27Cr0.2Mn0.53O2 electrode at each rate, and among them the Li1.24Rb0.03Cr0.2Mn0.53O2 electrode displays the best rate performance. For comparison, the pure Li1.27Cr0.2Mn0.53O2 shows an average discharge capacity of 182.7 mAh·g−1, 172.8 mAh·g−1, 167.9 mAh·g−1, 157.1 mAh·g−1, 146.6 mAh·g−1 and 65.5 mAh·g−1 at 0.1C, 0.2C, 0.5C, 1C, 2C and 5C, respectively, whereas the discharge capacity of Li1.24Rb0.03Cr0.2Mn0.53O2 under the same testing condition is 229.1 mAh·g−1, 215.6 mAh·g−1, 190.7 mAh·g−1, 173.1 mAh·g−1, 157.7 mAh·g−1 and 86.1 mAh·g−1, giving nearly 20∼30% increase at each rate. It is also found from the figure that the capacity can be easierly recovered after 5C charge/discharge, showing the potential of the cathode material in practical application. It also can be seen from the figure that sample Li1.26Rb0.01Cr0.2Mn0.53O2 (x = 0.01) and Li1.24Rb0.03Cr0.2Mn0.53O2 (x = 0.03) both have higher discharge capacity than sample Li1.27Cr0.2Mn0.53O2(x = 0) at each rate, especially at high rate of 5C. The average discharge capacities for samples with x = 0.01, x = 0.03 and x = 0.05 at 5C are 81.0 mAh·g−1, 92.0 mAh·g−1 and 71.1 mAh·g−1, respectively, while that for samples with x = 0 only maintains a value of 65.3 mAh·g−1. Fig. 6b illustrates the cycling performance at room temperature. It is clear that the cycling stability of the samples improve significantly when the Rb is incorporated into the lattice. After 50 cycles at 0.1C, the sample with x = 0.03 can still deliver a capacity of 222.1 mAh·g−1 with capacity retention of 98.8%, while the sample with x = 0 only presented a specific capacity of 178.6 mAh·g−1 with capacity retention of 94.3%. We also noticed the earlier work to improve the rate performance of such materials by the Al-doping method, where capacity of 198 mAh·g−1 below 0.05C rate28 for Li1.27Cr0.2Mn0.53O2 was reported. What's more, there is an increase of capacities during the first 10 cycles. It was demonstrated by the other researchers29 that the capacity increase at the first several cycles was caused by the continuous activation of the initial Li-rich layered phase. Therefore, it seems that our approach, the Rb replacing method, is also an effective way to improve the rate capability and therefore improves the electrochemical performance.

Figure 6. (a) Rate capabilities and (b) the cycling performances of RbxLi1.27-xCr0.2Mn0.53O2 (x = 0, 0.01, 0.03 and 0.05) samples.
The whole pattern survey for Li1.24Rb0.03Cr0.2Mn0.53O2 powder was presented in Fig. 7a, where peaks representing Rb, Cr, Mn, O, C ions were observed and denoted on the figure. Figs. 7b, 7c showed the XPS spectra of manganese ions (Mn 2P3/2 and Mn 2P1/2) after the charging and discharging process respectively. The Mn XPS results for the charging state showed two main peaks in the Mn 2p spectra, which can be assigned to the manganese 2p3/2 at 641.56 eV and 2p1/2 at 653.0 eV. The binding energy is well consistent with the data on MnO2, indicating the existence of Mn4+ in the Li1.27Cr0.2Mn0.53O2. The binding energies for Mn 2P3/2 and Mn 2P1/2 at the end of discharge were 642.35 and 653.85 eV, respectively, which are very consistent with the binding energies for Mn4+ (641.8 eV) and (654.0 eV). Such results greatly implied that Mn4+ cations were not involved in the electrochemical process and remained inactive with the crystalline lattice.
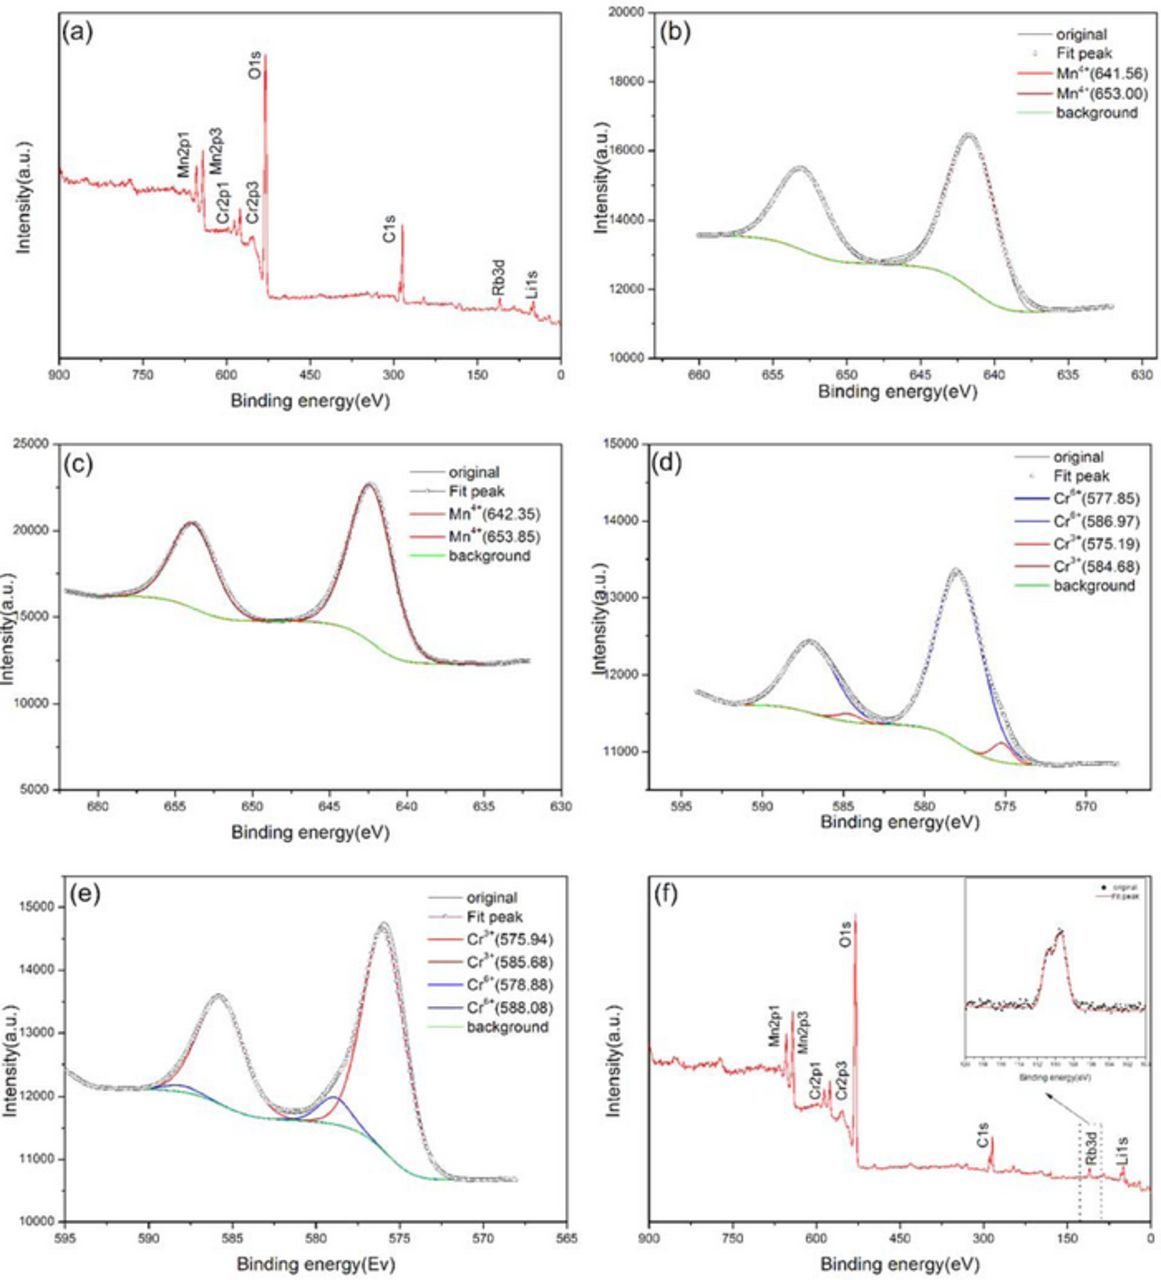
Figure 7. XPS spectra of (a) whole pattern survey for the powder, (b) Mn2p at charging state, (c) Mn2p at discharging state, (d) Cr2p at charging state, (e) Cr2p at discharging state and (f) whole pattern survey at discharging state.
Figs. 7d, 7e showed the XPS spectra of chromium ions (Cr 2P3/2 and Cr 2P1/2) for the sample after charging and discharging process respectively. The XPS spectrum for sample after charging was dominated by the major peaks with binding energies of 577.85 and 586.97 eV, very close to those of the hexavalent chromium ions in the transition metal layer. Whereas the spectra for sample after discharging were composed of major peaks with binding energies 575.94 and 585.68 eV, showing the existence of chromium in the trivalent state. So, by comparison, it is clear that Cr3+/Cr6+ redox pair, not the Mn redox pair, dominate the electrochemical process in our approach.
XPS investigation on the electrode after discharging was shown in Fig. 7f. Besides the denoted peaks for the compound, the whole survey of the XPS spectra revealed another peak at binding energy around 110 eV. And the detailed information for such a peak was shown as the inset, showing two peaks centering at 110.94 eV and 109.41 eV. Such two binding energies are actually the binding energy for Rb ions, showing the existence of Rb ions in the de-intercalation sample. This means the Rb ions will not be de-intercalated during the electrochemical process, but stay quietly in its lattice sites and d0 not participate in the rocking movement.
In total, these XPS results suggest that, during the charging process, lithium ions were extracted from the lattice, followed by an oxidation of Cr3+ to Cr6+, while Mn ions were not oxidized beyond 4+. However, when the electrodes were discharged, the lithium ions were inserted back into the lithium layer, followed by a reduction of Cr6+ to Cr3+. Only Li cations and the Cr3+/Cr6+ redox pair were involved, Rb and Mn cations remained quietly during the rocking process.
In order to further explore the mechanism for the improved electrochemical performance by Rb+ incorporation, electrochemical impedance spectroscopy (EIS) measurements were carried out for the RbxLi1.27-xCr0.2Mn0.53O2 and Li1.27Cr0.2Mn0.53O2 electrodes as seen in Figs. 8a, 8b. Basically, all Nyquist plots consist of a semicircle in the high-to-medium frequency range and a sloping line in the low frequency region which respectively denotes the charge transfer resistance (Rct) between solid electrode/electrolyte interface and Warburg impedance (Wo) referring to solid-state Li+ diffusion in layered oxide.30 Additionally, a very short intercept between semicircle and real axis in the high frequency region represents the solution resistance (Rs). In general, the semicircle can be mainly ascribed to the Li+ ion diffusion through the bulk electrode and the charge transfer reaction at the interface of the cathode-electrolyte, while the inclined line in the low frequency region can be assigned to Li+ diffusion (Warburg impedance) in the bulk electrode.31,32 On the basis of equivalent circuit depicted in Fig. 8b; Among them, Rs represents the resistance of the solution, and Rct corresponds to the charge transfer resistance. CPE is related to the double-layer capacitance and passivation film capacitance, while W refers to Warburg impedance .The fitting results are listed in Table III. It is observed that all samples show small Rs values less than 7Ω for the sample cells before and after 50 cycles, indicating good stability of electrolyte composition during the lithiation/delithiation process. By contrast, large changes occurred for Rct values. It can be seen that after 50 cycles, the Rct of Rb0.03Li1.24Cr0.2Mn0.53O2 cathode display only a two-fold increase from 84.7Ω to 192.1Ω, whereas the Rct increased dramatically from 102.3Ω to 680.6Ω for the pristine Li1.27Cr0.2Mn0.53O2 which suggests that the much easier Li+ diffusion can be obtained in an expanded lattice cell owing to Rb substitution, which are responsible for its best rate performance presented in Fig. 6.
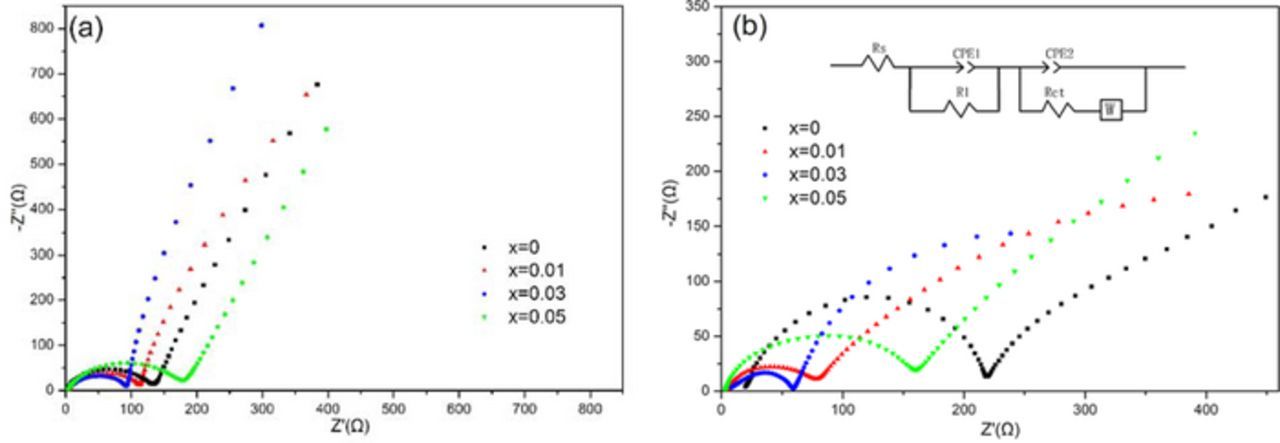
Figure 8. Nyquist plots of RbxLi1.27-xCr0.2Mn0.53O2 (x = 0, 0.01, 0.03 and 0.05) electrodes (a) before cycling and (b) after 50 cycles.
Table III. Electrochemical impedance spectroscopy (EIS): initial resistance (Rs) and charge transfer resistance (Rct) before and after cycling.
| x = 0 | 4.42 | 6.28 | 102.3 | 680.6 |
| x = 0.01 | 2.47 | 7.03 | 90.6 | 543.2 |
| x = 0.03 | 2.34 | 4.2 | 84.7 | 192.1 |
| x = 0.05 | 2.29 | 4.54 | 105.4 | 231.2 |
In addition, the diffusion coefficient of lithium ions (DLi+) can be evaluated in terms of the following equation:33,34
![Equation ([1])](https://content.cld.iop.org/journals/1945-7111/164/13/A3310/revision1/d0001.gif)
Where R is the gas constant, T the absolute temperature, c the concentration of Li+ in the material, F the Faraday constant, A the surface area of the electrode, and σ is the Warburg factor obeying the following relationship:35,36
![Equation ([2])](https://content.cld.iop.org/journals/1945-7111/164/13/A3310/revision1/d0002.gif)
Where ZRe is the real part of impedance, thus ω is the angular frequency at low frequency. The linear relationship of ZRe and ω−0.5 is shown in Fig. 9, the slope of the fitted straight line indicating the value of σ. The calculated values of σ and DLi+ are recorded in Table IV. It is clearly seen that sample Rb0.03Li1.24Cr0.2Mn0.53O2 exhibits the largest value of DLi+, which is about one order of magnitude higher than that of sample Li1.27Cr0.2Mn0.53O2. This result is in good agreement with the variation trend of rate capability and cyclic performance, essentially accounting for the performance improvement of Li1.27Cr0.2Mn0.53O2 cathode material.
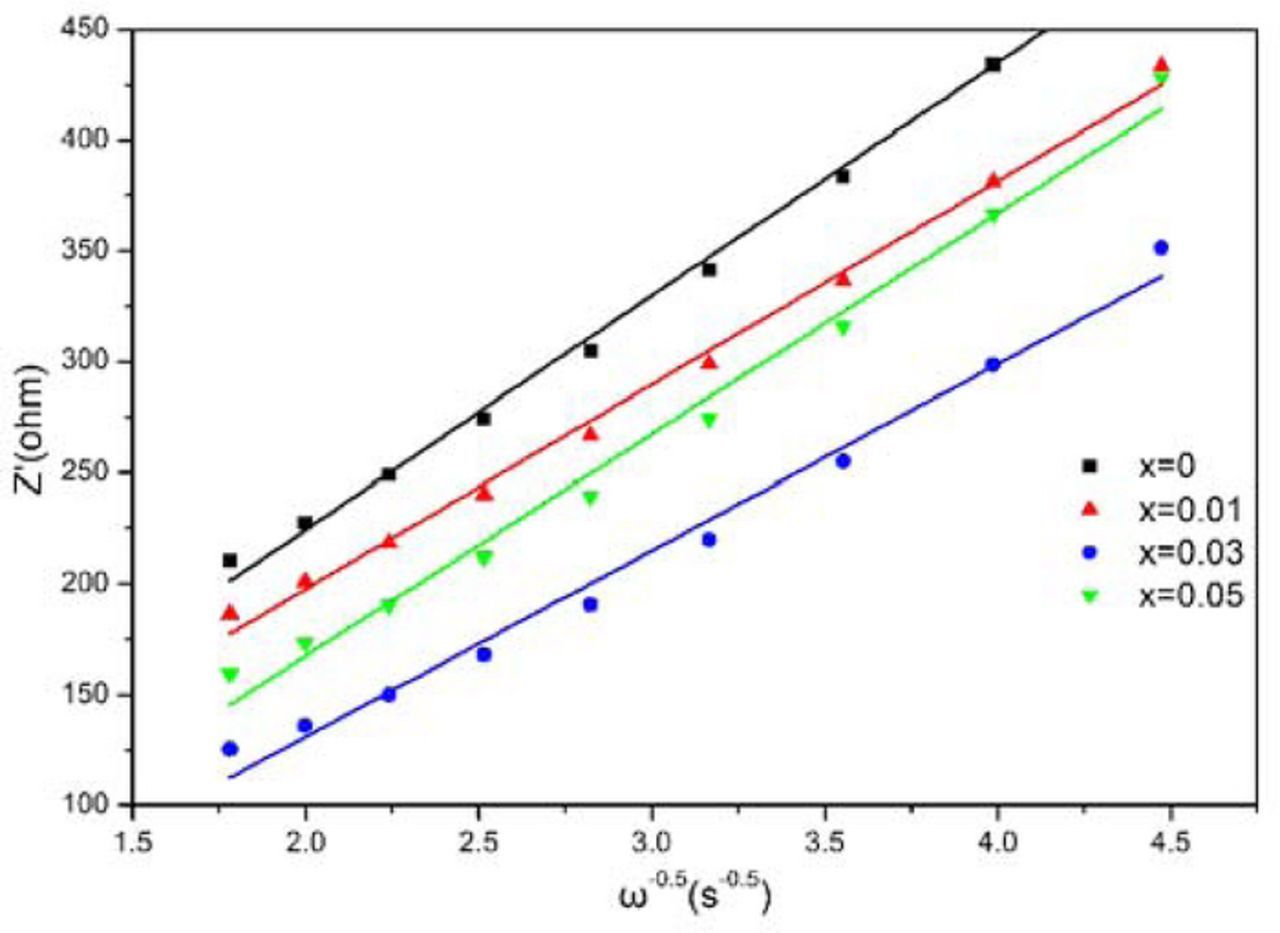
Figure 9. The typical plots of Z' vs. ω−0.5 for RbxLi1.27-xCr0.2Mn0.53O2 (x = 0, 0.01, 0.03 and 0.05).
Table IV. Warburg factor (σ) and diffusion coefficient (DLi+) of sample Li1.27-xRbxCr0.2Mn0.53O2.
| Samples | σ(Ω·s−0.5) | D(cm2s−1) |
|---|---|---|
| x = 0 | 105.34 | 3.437 × 10⁻¹¹ |
| x = 0.01 | 99.73 | 7.740 × 10⁻¹¹ |
| x = 0.03 | 61.27 | 1.432 × 10⁻¹⁰ |
| x = 0.05 | 83.89 | 4.836 × 10⁻¹¹ |
From the above results, it can be found that the sample Rb0.03Li1.24Cr0.2Mn0.53O2 presented the best electrochemical performance among the four samples. The sample showed advantage over the others on the initial capacity, columbic efficiency and rate performance and so on. All the results can be explained by the fact that a fast Li ion transportation was achieved since the largest Li ion diffusion coefficient was observed for the sample, as presented in Table IV. By careful comparison, the trend of the changes in diffusion coefficient is in good accordance with the changes in lattice parameter of c axis. The c values increase with the doping concentration but decrease when x reaches 0.05. Therefore, it seems in our case, the amount of Rb doped in the lattice determined the electrochemical performance: with the increase in Rb concentration, the c axis increases, the interlayer spacing increases, then the diffusion of Li+ is enhanced and finally the electrochemical properties is improved. However, when x reaches 0.05, the lattice distortion happened, c axis begins to shrink, the Li+ diffusion is restricted, and therefore the electrochemical performance is reduced.
Conclusions
In summary, Rb-doped cathode materials RbxLi1.27-xCr0.2Mn0.53O2 (x = 0, 0.01, 0.03 and 0.05) have been synthesized with stoichiometric compositions by means of high temperature (900°C) solid-state reaction. It was found that Li1.24Rb0.03Cr0.2Mn0.53O2 sample present superior electrochemical properties with the discharge capacity of 223.3 mAh·g−1 after 50 cycles and excellent high-rate performance (92.0 mAh·g−1 at 5C rate) between 2 and 4.8 V. In addition, the initial coulombic efficiency increased by 5%. By comparison, doping of 3% amount of Rb ions offered 15–30% increase in the electrochemical performance. It is demonstrated that a small mount of Rb substitution in Li1.27Cr0.2Mn0.53O2 has favorable effects on their rate capability, cyclic performance as well as initial coulombic efficiency. The performance improvement for doped cathode can be attributed to the introduction of Rb ions into the Li layer, which effectively enhanced the structural stability of the layered materials, changed the lattice parameters of the material and enlarged the Li slab space, so as to benefit the lithium ion diffusion process in the electrode. EIS investigation revealed a high diffusion coefficient of 1.432 × 10⁻¹⁰ cm2s−1, which can be regarded as the reason for the good electrochemical performance of the prepared cathode material. As a whole, this work demonstrates the potential importance of Rb+ incorporation into the Li layer for upgrading the electrochemical performance of this material, which may provide a facile and effective way to improve the structural stability of other types of layered metal oxides for secondary Li-ion battery applications.
Acknowledgment
The research was supported by Science and Technology Commission of Shanghai Municipality (14520503100, 13PJ1407400 and 201310-JD-B2-009) and National Natural Science Foundation of China (21306113) and Shanghai Municipal Education Commission (15ZZ095).
ORCID
Li Guan 0000-0003-0316-2518