Separation of Cr(III) from by functionalized Graphene oxide with Covalently Linked Porphyrin (GO–H2NP) Adsorbed on Surfactant Coated C18
Kamelia karimnezhad1 and Ali Moghimi2*
1Faculty of science, UniversitiTeknologi Malaysia, Skudai, Johor, 81310, Malaysia 2Department of Chemistry, Varamin(Pishva) branch, Islamic Azad University, Varamin Iran
DOI : http://dx.doi.org/10.13005/ojc/300122
Article Received on :
Article Accepted on :
Article Published : 27 Jan 2014
A novel, simple, sensitive and effective method has been developed for preconcentration of Cr (III) on functionalized Graphene oxide with covalently linked porphyrin (GO–H2NP) solid-phase extraction adsorbent. The stability of a chemical (GO–H2NP), especially in concentrated hydrochloric acid, was then used as a recycling and pre-concentration reagent. The method is based on selective chelation of Cr(III) on surfactant coated C18, modified with functionalized GO with covalently linked porphyrin (GO–H2NP). The retained ions were then eluted with 4 ml of 3 M nitric acid and determined by flame atomic absorption spectrometry (FAAS) at 283.3nm for Cr. The influence of flow rates of sample and eluent solutions, pH, breakthrough volume, effect of foreign ions on chelation and recovery were investigated. 1.5 g of surfactant coated C18 adsorbs 40 mg of the functionalized Graphene oxide with covalently linked porphyrin (GO–H2NP) base which in turn can retain 20.0± 0.9 mg of each of the two ions. The limit of detection (3σ) for Cr (III) was found to be 6.00 ng l -1. The enrichment factor for both ions is 100. The mentioned method was successfully applied on the determination of Cr in different water samples. The ions were also speciated by means of a three columns system.
KEYWORDS:Determination of Cr(III); Pre-concentration; functionalized Graphene oxide; covalently linked porphyrin (GO–H2NP); FAAS.
Download this article as:| Copy the following to cite this article: Karimnezhad K, Moghimi A. Separation of Cr(III) from by functionalized Graphene oxide with Covalently Linked Porphyrin (GO–H2NP) Adsorbed on Surfactant Coated C18. Orient J Chem 2014;30(1) |
| Copy the following to cite this URL: Karimnezhad K, Moghimi A. Separation of Cr(III) from by functionalized Graphene oxide with Covalently Linked Porphyrin (GO–H2NP) Adsorbed on Surfactant Coated C18. Orient J Chem 2014;30(1). Available from: http://www.orientjchem.org/?p=1982 |
Introduction
Toxicological studies have proved that the degree of toxicity of an element directly depends on the species in which it is present. Cr(III) is considered as an essential micronutrient for humans and mammals in order to maintain glucose metabolism, where as Cr(VI) is a potentially carcinogenic agent.1 The significant drawbacks of Cr(VI) are breathing disturbances, liver and digestion malfunctions, dermal corrosion and skin allergies.2 Therefore, It is necessary to control the level of chromium in industrial effluent, natural and drinking waters. Speciation of chromium in environmental samples is of prime importance.
Therefore there are numerous methods and techniques concerning chromium speciation and determination including liquid-liquid extraction after complex formation3-4,solid-liquid extraction5-8, LC-AAS 9-11 ,FIA-AAS 38,39, spectrophotometric12,39, ICP-AES 13, and NAA14. However, some of these techniques are currently, time consuming and have elaborate sample preparation steps and low enrichment factors.
Solid phase extraction (SPE) methods are the best alternatives for traditional classic methods due to selective removal of trace amounts of metal ions from their matrices. SPE determinations can be carried out on different efficient ways. One of the most appropriative performation features of SPE is achieved by using octadecyl silica membrane disks. SPE reduce the use of toxic solvent, disposal costs, and extraction time15-16.The octadecyl silica membrane disks involves shorter sample processing time and decreased plugging due to the large cross-sectional area of the disk and small pressure drop which allows higher flow-rates; reduced channeling resulting from the use of sorbent with smaller particle size and a greater mechanical stability of the sorbent bed17. In our previous attempts, we modified SPE membrane disks with suitable compounds for selective determination of chromium 18-19,35 and lead20.Meanwhile, other investigators have successfully utilized these sorbents for quantitative extraction and monitoring trace amounts of lead21-23, copper24-26, silver27-28, mercury29-30 , cadmium31 , palladium32, Ce33 and UO234.
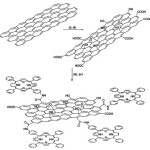
The main goal of the present work is the development of a fast, sensitive and efficient way for enrichment and extraction of trace amounts of Cr(III) from aqueous media by means of a surfactant coated C18 modified with GO with covalently linked porphyrin(I, shown in Fig. 1).
Such a determination has not been reported in the literature. The structure of functionalized Graphene oxide with covalently linked porphyrin (GO–H2NP) is shown in Fig. 1. The chelated ions were desorbed and determined by FAAS. The modified solid phase could be used at least 50 times with acceptable reproducibility without any change in the composition of the sorbent, GO–H2NPor SDS. This work investigated the applications of nanoGraphene oxide with covalently linked porphyrin (GO–H2NP) like the C18 SPE mini-column for selective extraction and solid phase pre-concentration of Cr (III) from aqueous and natural water samples.
Experimental
Reagents and Apparatus
All solutions were prepared with doubly distilled deionized water. C18 powder for chromatography with a diameter of about 50 µm was obtained from Katayama Chemicals. It was conditioned before use by being suspended in 3 M nitric acid for 20 min, and then washed two times with water. Sodium dodecyl solfate (SDS) was obtained from Merck and used without any further purification. 1-(3-Dimethylaminopropyl)-3-ethylcarbodiimide hydrochloride (EDC) and N-hydroxysuccinimide (NHS) were purchased from Aldrich. Graphene oxide (Guangfu Fine Chemical Research Institute, Tianjin, China) was used to prepare GO–H2NP.
Preparation of GO
Graphite (5 g) was added to a vigorously stirring, ice-cooled mixture of sulfuric acid (88 mL) and nitric acid (44 mL). After the graphite was well dispersed, potassium chlorate (55 g) was added slowly, in portions, over 15 min, with simultaneous purging with nitrogen gas, to avoid a rapid increase of the temperature and to reduce the concentration of the generated chlorine dioxide gas. Then, the reaction mixture was allowed to stir for 96 h at room temperature. On completion of the reaction, the mixture was poured into 4 L of ice water and filtered through a
0.45 mm PTFE membrane filter. The graphite oxide was redispersed and washed with 5 L of a 5% HCl solution and then washed repeatedly with deionized water until the pH of the filtrate was neutral. The filter cake was then redispersed in methanol and after filtration was dried in a vacuum oven at 60 °C overnight and then under atmospheric pressure at 120 °C for 8 h to give GO as a browngray powder (3.9 g).
Synthesis of GO–H2NP
GO[36] (15 mg) was stirred in 20 mL of oxalyl chloride at 80 °C for 24 h to activate the carboxylic units by forming the corresponding acyl chlorides. Then, the reaction mixture was evaporated to remove the excess oxalyl chloride and the brownish remaining solid (GO–COCl) was washed with anhydrous tetrahydrofuran (THF). After centrifugation, the resulting solid material was dried at room temperature under vacuum. For the covalent coupling between the free amino function of H2NP and the acyl chloride of GO, 15 mg of GO–COCl was treated under anaerobic, dry conditions with 7 mg of porphyrin dissolved in 6 ml of dry THF at room temperature for 72 h. The hybrid material, namely GO–H2NP, was obtained as a brown-gray solidby filtration of the reaction mixture through 0.2 mm PTFE filter and the filtrate was sufficiently washed with methylene chloride (4× 20 ml) to remove non-reacted free H2NP and then with diethyl ether (2 × 20 mL) before being dried under vacuum.[20]
 |
Schematic 1.A schematic illustration for the preparation of GO with covalently linked H2NP. (i) H2SO4/HNO3 (2 : 1 v/v), (ii) KClO3, 96 h, (iii) (COCl)2,80 °C, 24 h, (iv) 5-(4-aminophenyl)-10,15,20-triphenyl-21,23H-porphyrin, THF, r.t., 72 h. Click here to View figure |
Schematic 1.A schematic illustration for the preparation of GO with covalently linked H2NP. (i) H2SO4/HNO3 (2 : 1 v/v), (ii) KClO3, 96 h, (iii) (COCl)2,80 °C, 24 h, (iv) 5-(4-aminophenyl)-10,15,20-triphenyl-21,23H-porphyrin, THF, r.t., 72 h.
Column preparation
GO–H2NP (40 mg) was packed into an SPE mini-column (6.0 cm ×9 mm i.d., polypropylene). A polypropylene frit was placed at each end of the column to prevent loss of the adsorbent. Before use, 0.5 mol L−1 HNO3 and DDW were passed through the column to clean it.
Apparatus
The pH measurements were conducted with an ATC pH meter (EDT instruments, GP 353)
calibrated against two standard buffer solutions of pH 4.0 and 9.2. Infrared spectra of GO–H2NP were carried out from the KBr pellet by a Perkin-Elmer 1430 ratio recording spectrophotometer. Atomic absorption analysis of all the metal ions except Zn(II) was performed with a Perkin-Elmer 2380 flame atomic absorption spectrometer. Zn(II) determinations were performed by a Varian Spect AA-10. Raman spectrophotometer analysis was performed with a Perkin-Elmer.
Preparation of admicell column: Solution was added to 40 ml of water containing 1.5 g of C18, and 150 mg of the above Graphene oxide with covalently linked porphyrinwas loaded after washing acetone, 1mol l-1 HNO3 solution and water, respectively. The pH of the suspension was adjusted to 2.0 with the addition of 3mol L-1 HNO3and stirred by a mechanical stirrer for 20 min. Then the top liquid was decanted (and discarded) and the remaining C18 was washed three times with water, then with 5 ml of 3mol L-1 HNO3 and again three times with water. The prepared sorbent was transferred to a polypropylene tube (i.d 5 mm, length 10mm).
Determination of Cr2+ contents in working samples were carried out by a Varian spectra A.200 model atomic absorption spectrometerequipped with a high intensity hallow cathode lamp(HI-HCl) according to the recommendations of the manufacturers. These characteristics are tabulated in (Table 1). A metrohm 691 pH meter equipped with a combined glass calomel electrode was used for pH measurements.
Procedure
The pH of a solution containing 100 ng of each Cr(III) was adjusted to 2.0. This solution was passed through the admicell column with a flow rate of 5 ml min-1. The column was washed with 10 ml of water and the retained ions were desorbed with 1 ml of 3 M HNO3 with a flow rate of 2 ml min-1. The desorption procedure was repeated 3 more times. All the acid solutions (4 ml all together) were collected in a 10 ml volumetric flask and diluted to the mark with water. The concentrations of Cr in the solution were determined by FAAS at 283.3.
Determination of Cr in water samples
Polyethylene bottles were soaked in 1mol L-1 HNO3 overnight, and washed two times with water and used for sampling. The water sample was filtered through a 0.45 µm porous filter. The pH of a 1000 ml portion of each sample was adjusted to 2.0(3 M HNO3) and passed through the column under a flow rate of 5 ml min-1. The column was washed with water and the ions were desorbed and determined as the above mentioned procedure.
Speciation of Cr in water samples
This procedure is reported in several articles. The method has been evaluated and optimized for speciation and its application on complex mixtures [17]. The chelating cation exchanger (Chelex-100) and anion exchanger, (Dowex 1X-8) resins were washed with 1 M HCl, water, 1 M NaOH and water, respectively. 1.2 g of each resin was transferred to separate polyethylene columns. Each column was washed with 10 ml of 2 M HNO3 and then 30 ml of water. The C18 bounded silica adsorber was conditioned with 5 ml of methanol in a separate column, then with 5 ml of 2 M HNO3 and at the end with 20 ml of water. 5 ml of methanol was added on top of the adsorber, and passed through it until the level of methanol reached just the surface of the adsorber. Then water was added to it and connected to the other two columns. A certain volume of water sample was filtered through a 0.45 µm filter and then passed through the three column system, Dowex 1X-8, RP-C18 silica adsorber and Chelex-100, respectively. The columns were then separated. The anion and cation exchanger columns were washed with 10 ml of 2 M HNO3 and the C18 column with 10 ml of 1 M HCl. The flow rate of eluents was 1 ml
min-1. The Cr content of each eluted solution was determined by FAAS.
Results and Discussion
The treatment of Graphene oxide with covalently linked porphyrin (GO–H2NP) can lead to the derivatization of both the edge carboxyl and surface hydroxyl functional groups via formation of amides [20] or carbamateesters[21], respectively.
The formation of GO–H2NP was followed by ATR-IR spectroscopy.Initially, in the spectrum of GO, the carbonyl vibration appears at 1716 cm-1, while there are fingerprints at 3616 cm-1 and 3490 cm-1 due to the presence of hydroxyl species at the basal plane of graphene. The covalent linkage of H2NP with the acyl chloride activated GO is evident from the presence of a band at 1630 cm-1, which is characteristic for the carbonyl groups of the amide units[23].
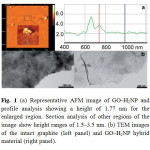 |
Fig. 1 (a) Representative AFM image of GO–H2NP and profile analysis showing a height of 1.77 nm for the enlarged region. Section analysis of other regions of the image show height ranges of 1.5–3.5 nm. (b) TEM images of the intact graphite (left panel) and GO–H2NP hybrid material (right panel). Click here to View figure |
The amount of porphyrin attached onto the graphene sheet was evaluated by thermogravimetric analysis. As compared with the TGA results of pure graphite, which is thermally stable up to 900 °C under nitrogen, and GO which decomposes above 600 °C,
after having lost the oxygenated species at 240 °C (i.e. 14.7% weight loss), the 6% weight loss occurred in the temperature range 250–550 °C for the GO–H2NP material, is attributed to the decomposition of H2NP (Fig. 2).
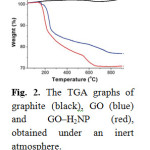 |
Fig. 2. The TGA graphs of graphite (black), GO (blue) and GO–H2NP (red), obtained under an inert atmosphere. Click here to View figure |
Fig. 2. The TGA graphs of graphite (black), GO (blue) and GO–H2NP (red), obtained under an inert atmosphere.
The GO–H2NP material forms a stable dispersion in DMF at a concentration not exceeding 1 mg mL-1. The electronic absorption spectrum of GO–H2NP in DMF (Fig. 3), shows ( i )a broad signal monotonically decreasing from the UV to the visible region, which is attributed to GO and (ii) a characteristic band at 420 nm (Soret-band) corresponding to the covalently grafted H2NP units (the Q-bands at 516, 557, 589 and 648 nm were flattened to the base line in the GO–H2NP material). Interestingly, the absorption of porphyrin in the GO–H2NP material is broadened, shortened and bathochromically shifted (ca. 2 nm) as compared to that of the free H2NP, a result that corroborates not only the linkage of porphyrin with the GO sheets but also electronic interactions between the two species (i.e. GO and H2NP) in the ground state. These results are in agreement with studies based on other hybrid systems consisting of porphyrins covalently grafted to carbon nanotubes and nanohorns[20].
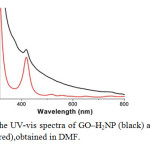 |
Fig. 3The UV-vis spectra of GO–H2NP (black) and free H2NP (red),obtained in DMF. Click here to View figure |
Fig. 3The UV-vis spectra of GO–H2NP (black) and free H2NP (red),obtained in DMF.
Stability studies
The stability of the newly synthesized GO–H2NP phases was performed in different buffer solutions (pH 1, 2, 3, 4, 5, 6 and 0.1M sodium acetate) in order to assess the possible leaching or hydrolysis processes. Because the metal capacity values determined in Section 3.2 revealed that the highest one corresponds to Cr(III), this ion was used to evaluate the stability measurements for the GO–H2NP phase [18]. The results of this study proved that the GO–H2NP is more resistant than the chemically adsorbed analog, especially in 1.0, 5.0 and 10.0 M hydrochloric acid with a hydrolysis percentage of 2.20, 6.10 and 10.50 for each phase, respectively.
Thus, these stability studies indicated the suitability of each phase for application in various acid solutions especially concentrated hydrochloric acid and extension of the experimental range to very strong acidic media which is not suitable for other normal and selective chelating ion exchangers based on a nano polymeric matrix [17]. Finally, the GO–H2NP phases were also found to be stable over a range of 1 year during the course of this work.
GO–H2NP is insoluble in water. Primary investigations revealed that surfactant coated C18 could not retain Cr(III) cations, but when modified with the GO–H2NP, it retains these cations selectively. It was then decided to investigate the capability of the GO–H2NP as a ligand for simultaneous preconcentration and determination of Cr on admicell. The C18 surface in acidic media (1<pH<6) attracts protons and becomes positively charged. The hydrophilic part of SDS (-SO3–), is attached strongly to these protons. On the other hand, the GO–H2NP is attached to the hydrophobe part of SDS and retain small quantities of metallic actions[17].
Effect of pH
The effect of pH of the aqueous solution on the extraction of 100 ng of each of the cationsCr(III) was studied in the pH range of 1-10. The pH of the solution was adjusted by means of either 0.01 mol L-1 HNO3or 0.01mol L-1NaOH. The results indicate that complete chelation and recovery of Cr(III) occurs in a pH range of 2-4 shown in Fig. 2. It
is probable that at higher pH values, the cations might be hydrolyzed and complete desorption does not occur. Hence, in order to prevent hydrolysis of the cations and also keeping SDS on the C18, pH=2.0 was chosen for further studies.
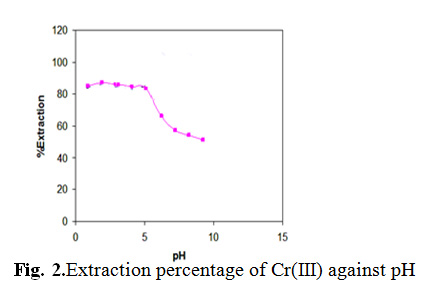 |
Fig. 2.Extraction percentage of Cr(III) against pH Click here to View figure |
Effect of flow rates of solutions
The effect of the solution’s flow rate of the cations on their chelation on the substrate was also studied. It was indicated that flow rates of 1-5 ml min-1would not affect the retention efficiency of the substrate. Higher flow rates cause incomplete chelation of the cations on the sorbent. The similar range of flow rate for chelation of cations on modified C18 with SDS and a GO–H2NP has been reported in the literature [17]. A flow rate of 1-2 ml min-1for desorption of the cations with 4 ml of 4 M HNO3has been found suitable. Higher flow rates need a larger volume of acid.
Hence, flow rates of 5 ml min-1and 2 ml min-1were used for sample solution and eluting solvents throughout, respectively.
Effect of the GO–H2NP quantity
To study an optimum quantity of the GO–H2NP on quantitative extraction of Cr, 50 ml portions of solutions containing 100 ng of each cation were passed through different columns, the sorbent of which were modified with various amounts, between 10-50 mg of the GO–H2NP. The best result was obtained on the sorbent which was modified with 40 mg of the GO–H2NP.
Figures of merit
The breakthrough volume is of prime importance for solid phase extractions. Hence, the effect of sample volume on the recovery of the cations was studied. 100 ng of each cation was dissolved in 50, 100, 500 and 1000 ml of water. It was indicated that in all the cases, chelation and desorption of the cations were quantitative. It was then concluded that the breakthrough volume could be even more than 1000 ml. Because the sample volume was 1000 ml and the cations were eluted into 10 ml solution, the enrichment factor for both cations is 100, which is easily achievable. The maximum capacity of 1.5 g of the substrate was determined as follows; 500 ml of a solution containing 50 mg of each cation was passed through the column. The chelated ions were eluted and determined by FAAS. The maximum capacity of the sorbent for three individual replicates was found to be 20.0 ±0.9 µg of each cation. The limit of detection (3σ) for the cations[17]was found to be 5.40 ngL-1 for Cr ions. Reproducibility of the method for extraction and determination of 100 ng of each cation in a 50 ml solution was examined. As the results of seven individual replicate measurements indicated, they were 2.85% and 2.98% for Cr(III).
Effect of foreign ions
The effect of foreign ions was also investigated on the measurements of Cr. Here a certain amount of foreign ion was added to 50 ml of the sample solution containing 100 ng of each Cr(III) with a pH of 2.5. The amounts of the foreign ions and the percentages of the recovery of Cr are listed in Table 2. As it is observed, it is possible to determine Cr
without being affected by the mentioned ions.
Analysis of the water samples
The prepared sorbent was used for analysis of real samples. To do this, the amounts of Cr were determined in different water samples namely: distilled water, tap water of Tehran ( taken after 10 min operation of the tap), rain water (Tehran, 20 January, 2013), snow water (Tehran, 7 February, 2013), and two synthetic samples containing different cations. The results are tabulated in Table 3. As it is seen, the amounts of Cr added to the water samples are extracted and determined quantitatively which indicates accuracy and precision of the present method.
Separation and speciation of cationswere completed by three columns system. It is possible to pre-concentrate and at the same time separate the neutral metal complexes of GO–H2NP, anionic complexes and free ions from each other by this method[17]. Water samples were passed through the three connected columns: anion exchanger, C18-silica adsorber and chelating cation exchanger. Each species of Cr is retained in one of the columns; anionic complexes in the first column, neutral complexes of GO–H2NP in the second, and free ions in the third. The results of passing certain volumes of different water samples through the columns are listed in Table 4. According to the results, it is indicated that Cr is present only as cations. On the other hand, the t-test comparing the obtained mean values of the present work with those published indicate no significant difference between them. We have proposed a method for the determination and preconcentration of Cr in water samples using surfactant coated C18 impregnated with a GO with covalently linked porphyrinbase. The proposed method offers a simple, highly sensitive, accurate and selective method for the determination of trace amounts of Cr(III) in water samples. The method developed was simple, reliable, and precise for determining Cr in water. Also, the proposed method was free of interference compared to conventional procedures to determine Cr[17-20,37,38] The methode can be successfully applied to the separation and determination of Cr in binary mixtures.
Acknowledgments
The authors wish to thank the Chemistry Department of Islamic Azad University, Varamin Branch, for their financial support.
References
- Nriagu, J. O.; Nicboer, E. Chromium in the Natural and Human Environment , New York 1988.
- Camel, V. Spectrochim. ActaPart B, 2003, 58, 1177.
- Gonzalez, E. B.; Garcia, J. B.; Barrera, P .B.; Barrera, A.B. Fresenius J .Anal.Chem..1992, 344, 301.
- Subramanian, K.S. Anal.chem . 1988, 60,11.
- Romero, R. M. C.; Biurrun, M. C. Y; Barrera, M. P. B. Anal.Chim.Acta, 1996, 327, 37.
- Pannain, M. C.; Santelli, R. E. Talanta, 1995,42,1609.
- B.Pasullean ,C.M.Davidson ,.D.Little john , J.Anal.Atom.Spectrom. 1995,10, 241.
- Jimenez, M. S.; Martin, I.; Mir, J. M.; Castillo, J. R. Atom .Spectroscopy,1996,17, 201.
- Gaspar, A.; Posta, J.; Toth, R. J.Anal .Atom Spectrom., 1996, 11,1067.
- Posta, J.; Gaspar, A.; Toth, R.; Ombodi, L. FreseniusJ. Anal .Chem., 1996, 355, 719.
- Revanasiddappa, H. D.; Kiran Kumar, T. N. Talanta, 2003, 60, 1.
- Hirata, S.; Umezaki, Y.; Ikeda, M. Anal. Chem., 1986, 58, 2602.
- Greenberg, R. R.; Ziesler, R.; Kingston, H. M.; Sullivan, T. M. Fresenius’ J. Anal. Chem., 1988,332, 562.
- Majors,R.E.LC-GC., 1989,4,972.
- Hangen ,D.F.;Markell,C.G.;Scmitt,G.A.;Blevins,D.D.Anal.Chim. Acta., 1990,236,157.
- A,Moghimi, M. Abdouss (2012) Preconcentration of Ni(II) from sample water by modified poly (ethylene terephthalate)-grafted-acrylic acid/acryl amide fiber), Afr. J. Pure Appl. Chem. 6(8):110-118.
- H.Wang, H.S.Zhang, J.K. Cheng (1999)( Studies on 2-(2-thiazolylazo)-5-diethylaminophenol as a precolumnderivatizing reagent in the separation of platinum group metals by high performance liquid chromatography), Talanta 48:1-8.
- M.Zargaran, A. M.Shoushtari, M.Abdouss( 2008) (Ion adsorption studies of micro and nano acrylic fibers modified by ethanolamine. Ionen Adsorption von mitEthanolaminmodifiziertenMikro- und Nano-Acylfasern), J. Appl. Polym.Sci, 110:3843-3849.
- M.Tabarzadi, M. Abdouss, S. A.Hasani, A.M.Shoushtary, U.Mat.-wiss. (2010)( Ion adsorption studies of micro and nano acrylic fibers modified by ethanolamine. Ionen Adsorption von mitEthanolaminmodifiziertenMikro- und Nano-Acylfasern)Werkstofftech. 41(4):221-228.
- D. H.Shin, Y. G.Ko, U. S. Choi, W. N. Kim (2004) (Fluorescence Enhancement of CoumarinThiourea Derivatives by Hg2+, Ag+, and Silver Nanoparticles), Ind. Eng. Res. 43: 2060-2065.
- P.Nayebi, ,A.Moghimi , (2006) (Perconcentration and Determination of copper(II) by 1-(2- PyridylAzo)2-Naphtol(PAN) modified Octadecyl Silica),Oriental Journal of Chemistry,22(3):507-512.
- O. R .Hashemi, K M.argar-Razi, F.Raoufi, A.Moghimi, H.Aghabozorg, M. R.Ganjali, (Ultra-trace monitoring of copper in environmental and biological samples by inductively coupled plasma atomic emission spectrometry after separation and preconcentration by using octadecyl silica membrane disks modified by a new schiff’s base) (2001)Microchem. J.69:1-8.
- Shamsipur, M.; Avanes, A.; Raoufi, M. K.; Sharghi, H.; Aghapour, G. Talanta, 2001,54, 863.
- Shamsipur, M.; Ghiasvand, A. R.; Sharghi, H.; Naeimi, H. Anal. Chim.Acta, 2000,408, 271.
- Ganjali, M. R.; Pourjavid, M.R.; HajiaghaBabaei, L.; Niasari, M. S. Quim. Nova, 2004,27, 213.
- Shamsipur, M.; Javanbakht, M.; Ghasemi, Z.; Ganjali, M. R., Lippolis, V.; Garau, A. Sep. Purif. Technol., 2002 ,28, 141.
- HajiaghaBabaei, L.; Ghasemi, Z.; Darciche, F.; Shamsipur, M.; Raoufi, F.; Ganjali, M. R. Anal.Sci., 2001, 17, 1305.
- Shamsipur, M.; Shokrollahi, A.; Sharghi, H.; Eskandari, M. M. J.Hazard. Mater,2005.,117, 129.
- Chen, Z.; Yang, G.; Hu, Q.; Yin, J.; Su, Q. J. Chin. Chem. Soc., 51, 297(2004).
- Cesur, H.; Bati, B. Turk. J. Chem., 26, 29(2002).
- Farhadi, K.; Teimouri, G. Talanta, 65, 925(2005).
- Shamsipur, M.; Yousefi, M.; Ghasemi, Z.; HajiaghaBabaei, L.; Ganjali, M. R. Separ. Sci. Technol., 37, 3525(2002).
- Shamsipur, M.; Ghiasvand, A. R.; Yamini, Y. Anal. Chem., 71, 4892(1999).
- Wolf, S.F. ; Unger, D.L. ; Friedrich, J.M. Anal.Chim.Acta 2005,528 ,121.
- W. S. Hummers, Jr., R. E. Offeman, J. Am. Chem. Soc. 1958, 80, 1339.
- A.MOGHIMI,“Chinese Journal of Chemistry ”2007,25,10, 1536.
- A. Moghimi; S.Ghammamy “Environmental chemistry an Indian journal”2007,Vol.2, Issues 3.

This work is licensed under a Creative Commons Attribution 4.0 International License.
![]()
A New Edition of Web of Science
Journal Impact Factor
2022: 0.5
Five Year: 0.8
Journal is Indexed in

Cabells Whitelist
![]()


