
Safety in Industry 4.0: The Multi-Purpose Applications of Augmented Reality in Digital Factories
Volume 5, Issue 2, Page No 248-253, 2020
Author’s Name: Lorenzo Damiania), Roberto Revetria, Emanuele Morra
View Affiliations
Genoa University, DIME (Department of Mechanical Engineering), 16145, Genoa, Italy
a)Author to whom correspondence should be addressed. E-mail: lorenzo.damiani@unige.it
Adv. Sci. Technol. Eng. Syst. J. 5(2), 248-253 (2020); ![]() DOI: 10.25046/aj050232
DOI: 10.25046/aj050232
Keywords: Augmented Reality, Health and Safety, Industry 4.0, Digital Twin, Emergency Management

Export Citations
The digital factory is a concept signing a new era for industry, the so-called Industry 4.0, in which ordinary production systems like manufacturing plants, machineries and utilities are being equipped with diagnostic and sensitive instrumentation to be connected to digital shared networks. This data-sharing, trough the big data management techniques, is a fully integrated base on which digital tools can be installed and exchange information. Data stored from physical world of machines can be redirected to simulation environments like Digital Twins and can be inspected, for several purposes like predictive analysis, by humans too. On top of these scopes, within the realization of an Internet of Things, there is safety, especially in industrial sites where injury risk for operators and workers is a key factor for production sustainability. This paper, starting from a tested case study in mechanical stressed monitoring, focuses on the application of upgraded augmented reality systems for safety practices, expanding the area of interest to electric and overheating risk mitigation in electrical equipment and to emergency management.
Received: 10 January 2020, Accepted: 01 March 2020, Published Online: 20 March 2020
1. Introduction
This paper is an extension of a work originally presented 2019 Spring Simulation Conference (SpringSim), Tucson, Arizona, USA [1]; the extended paper, starting from the prevention of mechanical risk for shelving structures, underlines the evolution of augmented reality applications for safety, expanding its area of interest to overheating risk mitigation in electrical equipment and to emergency management. Opportunities for safety improvements are also given by the availability on the market of tools and devices to be connected to the AR main equipment, for example like thermo-camera or gas detection sensors to be mounted on smart glasses. In the current competitive scenario manufacturing companies are facing the challenge of digital transformation, as demonstrated by the arrival of Industry 4.0 [2]. This new paradigm is known as “the fourth industrial revolution” and it refers to new production patterns, including new technologies, productive factors and labor organizations, which are completely changing the production processes and the relationship between customer and company with relevant effects on the supply and value chains [3].
In the next chapters, the technology under study is described in terms of both hardware/software set-up kit and safety practical applications in industrial sites. In particular, AR devices are related to the main following topics:
– Mechanical risk prevention for steel shelving breakdown due to overloaded storing situations;
– Overheating risk prevention for electrical equipment and devices in case of power overload or short circuit;
– Fire risk and emergency management due to overcrowding or critical emergency situation (big fires, explosion, pollution, evacuation in hospitals, airports, schools).
2. Application Development
2.1. Augmented Reality Equipment
Several augmented reality equipment and platforms are available on the market for professional purposes: an important assessment on the best SDK and devices to be used has been done by this research group, basing on a market research specific for AR Application in industrial working environment. Basing on the work of Mladenov et al. [4], a specific process for finding the most efficient support has led to the result that smart glasses are the best way to overlay AR objects on the real world or to get information from specific symbols placed on real objects of interest. One of the best features of smart glasses, suitable for safety for workers, is the opportunity to allow hands-free AR experiences. The diffusion of these devices has increased the opportunity of developing new AR mobile apps compatible with these gadgets, in order to increase easiness in connection.
The wearable device selected for the development of the AR applications in object are F4 smart glasses, produced by Glass Up an Italian start-up company. These are equipped with a screen on the right lens. The optical system allows a field of view with an angle of 22°, the effect obtained is the same as a 70” screen positioned at a distance of 5 m. The 3D view is possible even if the glasses are not binocular. The glasses are equipped with a video-camera which allows video sharing in real time and the data can be visualized through the software “Dashboard”. Therefore, the F4 glasses allow both remote assistance and “on the job training” through explicit videos or images. F4 glasses presented in Figure 1.
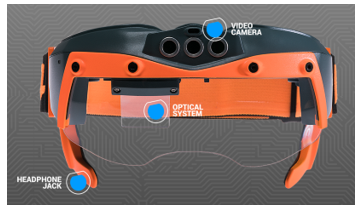 Figure 1: Glass-Up F4 VR glasses.
Because of AR technology recent diffusion, long term effects on workers’ health have not already been isolated. From a recent study [5], AR technology might represent a benefit for health of users, due to operator’s mental workload reduction. But in other studies [6], Head-Mounted Devices like smart glasses, are said to utilize a field of view that is smaller than human’s, which could cause headaches, dizziness nausea after a prolonged period of use. Additionally, the HMD is associated with discomfort caused by the weight and a limitation of usage for users that need to use regular goggles. A parallel can be done with Virtual Reality technology, characterized by a longer experience. The key concern from the literature is VR-induced sickness, experienced by a large proportion of VR participants, even if it is not completely clear the exact reason for that disease [7]. A maximum consecutive utilization time period can be safely regarded within 1 hour, before relax. A further study on these aspects should be done.
The software can capture an image and re-send it to the user enriched with additional explicit data, text or drawings to improve the information acquisition, or can highlight in real time [8 – 10] elements in the field of view to focus the user’s attention. Several different sensors are optionally available for the F4 glasses: an accelerometer, a compass, a gyroscope, a barometer, a hygrometer, a led torch, plug-in sensors and voice control, all with connections to Wi-Fi, LTE and Bluetooth. It is possible to install a 32X32 thermo-camera too or a gas detection sensor on the glasses support. Electric feeding and interaction with the user are ensured by a USB port.
In general, data can be collected by an electronic card, like the Arduino one, receiving electric signals from dedicated sensors. The card can be programmed trough a software based on C++ language and then data are sent to a platform to be analyzed and elaborated: a specific Wi-Fi module can be used and connected to Arduino card. Data received by the server from sensors on site can be compared to historical data, threshold or safety alarm values and then being sent back to operators equipped with AR visors to be visualized in real time through the glasses lens. Operator is enabled to receive only desired data in many ways: one of these is the QR codes detection, which are applied on surfaces or specific points in order to recognize for examples specific components or safety zones of interests. QR codes identity unique destinations for inquiring or inspection and enable the server to release only the desired data. This level of interconnection is a significant part of the digital factory concept, representing the Internet of Thing in which humans are in the center of information exchange. In Figure 2 below, the main logic concept is depicted.
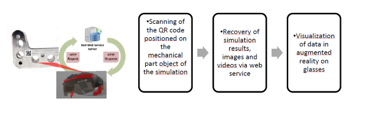 Figure 2: Logics of the application with QR code.
A specific case of application is described in chapter 3.1 regarding strain gauges connection. The same connection path can be used with other tools, for example for sending information to server with a thermo-camera. A similar application under study is described in chapter 3.2. In general, images processing techniques can be inherited by other specific application or case-study [11-15].
2.2. Software Development
For safety application using the Arduino system, it is possible and worthy to program the card in a dedicated environment, which is free of charge. The Arduino program is an IDE (Integrated Development Environment). The source code of the programs, called sketch, is a simple text file with .ino extension. The main elements are:
1) Text editor;
2) Message area;
3) Text console;
4) Tool bar;
5) Menu bar;
6) Status bar.
The basic sketch structure is subdivided in two parts:
– The first part, composed by the setup() function, used to configure the card;
– The second part, composed by the loop() function which contains the program executable in a loop.
Data transmission occurs thanks to the ESP8266 router connection, which occurs through AT commands allowing the chip to dialogue with the modem and send data to a server. The data is received by ThingSpeak, the IoT development platform, which analyzes the data coming from the two sensors. The ThingSpeak basic entity is the channel, each of the variables composing a channel are called fields, a maximum number of 8 fields are allowed per each channel.
2.3. Thermography Tools
In industrial environments, thermography is used to identify hot spots that lead to failures in mechanical and electrical systems. Early detection of anomalies allows you to avoid production stoppages and save money. In the mechanical field, thermographic control identifies overheating caused by friction between bearings, joints, transmissions and couplings. Thermographic applications in the mechanical field are characterized by high operating and investigation temperatures. The study of temperatures requires careful precautions by the operator. Since the thermographic operator must carry out shooting in an environment where high temperature sources are present, it is necessary to provide shielding systems to reduce as much as possible the reflection effects on the component to be analyzed. On the analysis of mechanical components, in addition to the analysis on bearings and transmission belts, there are frequent analysis of pipes temperature distribution, of boilers, of alternators and production systems of electricity, control-checks of tank levels.
In power transmissions it is necessary to check that there are no abnormal frictions caused by a malfunction. The mechanical faults typically detected are:
– Overheating of the engines;
– Rollers at suspect temperature;
– Overload of the pumps;
– Hot pads;
– Axial overheating of the pumps.
With these controls it is possible to detect the “weak ring” of the system, so that production activity can be guaranteed thanks to immediate interventions. The plants that are subjected to thermographic analysis have the advantage of a production continuity, this would not be possible if they were not monitored continuously, because the damage would be detectable only after the damage happens, forcing the plant to stop. Thermographic applications in the mechanical field are generally characterized by very high operating and investigation temperatures. The investigation of temperatures requires special precautions by the operator; mechanical applications are usually distinguished by an accumulation of temperature following friction phenomena in correspondence with the movement of certain components.
Thermal imaging cameras are commonly used to inspect electrical systems and components of all sizes and shapes. The most commonly detectable faults with thermal imaging cameras can be found in high voltage installations:
– Oxidation of high voltage circuit breakers;
– Overheating of the connections;
– Imperfect fixing of the connections;
– Insulator failure.
When checking electrical systems, it is very important to know the load, the maximum allowed temperatures of the components analyzed. It is necessary to know the external conditions of the component; if a standard survey is carried out externally, it is necessary to know the wind speed and other climatic factors that can affect the temperature of the element. For internal surveys it is necessary to know if there are room cooling systems or convective effects caused by the cooling system of the component itself. Before making measurements of the element to be analyzed, it is necessary to prepare high emissivity points so that the most precise temperature can be read in the case of analysis of conductive metals. In a situation in which the inspection takes place in closed cabinets that cannot be opened without risk for safety of the operator himself, it is recommended to prepare special windows with germanium monocrystalline lenses. In addition, the electrical are different between low voltage and high voltage devices. Thermal imaging cameras are used for low voltage installations such as electrical panels and engine control panels. These checks are carried out to avoid breakdowns or fires. Problems caused by load imbalances; corrosion phenomena can occur.
Examples of failures that are detectable with thermal imaging cameras in low voltage devices include:
– High resistance connections;
– Corrosion of connections;
– Damage to the internal fuse;
– Internal circuit breaker faults;
– Inefficient connections and internal damage.
Instead, for high voltage installation, heat is a relevant factor. When the electric current passes through an element that offers resistance, it generates heat. A high resistance corresponds to an increase in heat. Over time, the resistance of the electrical connections increases. This can be caused by corrosion which causes an increase in temperature which can bring to component failure, possible accidents, unnecessary consumption due to the energy used to generate heat. If not controlled, the heat can reach a level that melts the connections.
Examples of failures that are detectable with thermal imaging cameras in high voltage devices include:
– Oxidation of high voltage circuit breakers;
– Insulator failure;
– Imperfect fixing of the connections;
– Overheating of the connections.
The thermal imaging camera is a particular camera, which detects the intensity of the infrared radiation of a body, it is therefore not an instrument that sees or detects the temperature. Starting from the detected radiation, through an electronic processing of the machine, a digital radiometric type image is obtained in which it is possible to view the temperature of the object.
The essential components of a thermo-camera are (Figure 3):
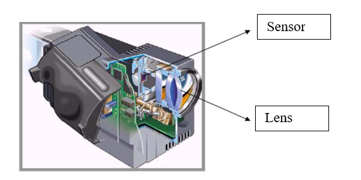 Figure 3: Glass-Up F4 VR glasses.
This image can be viewed as a digital photo or as a video depending on the use of the machine and the software that elaborates the electronics result. The thermal imaging camera is a device similar to a digital camera, which stores the image or frame by converting the infrared, invisible to the human eye, into a visible image represented in false colors. The thermal imaging camera must have adequate optics in relation to the fields of intervention to be analyzed. The optics are made up of germanium lenses, a material that prevents entry to the spectrum of visible radiation, while it is transparent to the passage of the infrared band (with a wavelength between 2 and 14 microns). The focus is electronically controlled by the processing unit or carried out manually by the operator by means of a ring on the lens. Thermal imaging cameras on the market today are divided into two types, cooled and uncooled. The highest accuracies are obtained with cooled thermal imaging cameras, which however present problems that do not exist in the other group and often have higher costs; these are the reasons why, especially in the construction field (where less precision is required for many parameters), uncooled thermal imaging cameras have a greater diffusion.
3. Safety Applications
3.1. Mechanical risk for metallic shelving breakdown
This application is provided by strain gauges, which are measuring sensors glued to critical metallic components of the whole shelving structure: physical working behavior for this system is based on the direct proportionality between deformation and the consequent variation of electric resistance of the gauges. The resistance is electrically connected to a Wheatstone bridge which is able to provide a voltage signal, proportional to deformation, to the Arduino card [9].
In the former paper [1], from which the present extension is derived, a test with calibration is done on a piece of metallic structure and results are exposed.
The hardware components employed for directing data to storing system are listed below (figure 4):
– Strain gauges, to keep information about the deformation and the level of mechanical stress (see figure 2 for installation details);
– A Wheatstone bridge with electric resistors as a transducer for the resistance variation detection;
– HX711 amplifier, to make the signals compliant with Arduino card input voltage levels;
– Rapid prototyping card Arduino Mega2560;
– Wi-Fi module ESP82666 to send the data to the ThingSpeak server.
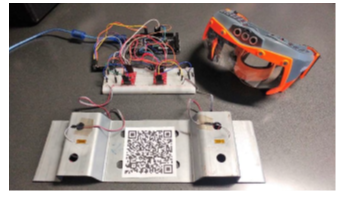 Figure 4: Set-up kit for strain gauges.
In addition to this configuration, a model of the metallic components under analysis has been realized in MATLAB Finite Element Analysis Toolbox (FEA) to simulate the stress state of the metal shelving. The FEA analysis is carried out online. Since the finite elements model of the shelf is very simple, the computational time required for the parameters calculation does not require more than 5 seconds per each run.
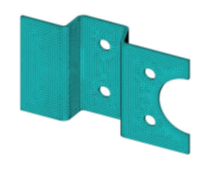 Figure 5: Mesh of the geometry.
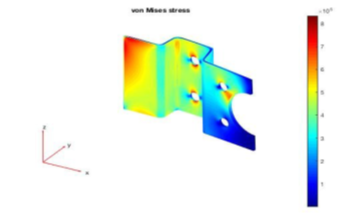 Figure 6: FEM simulation results.
3.2. Overheating risk for electrical equipment
The use of AR visor can be coupled with a very powerful tool for thermographic analysis of electrical equipment like switchgears, cables and busbars, circuit breakers, transformers. The use of a thermo-camera mounted on the smart glasses allows the operator to isolate specific components, identified by a QR code glued onto, simply watching at those and then to compare images got by the thermo-camera with historical images of the same components. Procedure to be established and tested for a case study is:
- Operator looks at the electrical component of interest with smart glasses equipped with thermo-camera;
- QR code of the component is detected and information is sent to the server;
- An image is captured by the thermo-camera and sent to the server by the Wi-Fi glasses connection;
- A comparison between the actual infrared image and an image of the ordinary status, or of a previous one derived with the QR code activation, can be done by an application programmed on the server,
- Alarm signal or alert indication can be sent to glasses and received by the operator if the temperature parameters are in danger zone or next to fire ignition;
- Overlaying of historical infrared images with the real equipment can be done with AR programming apps and sent to operators for direct comparison on site in real time.
3.3. Safety management in emergency situations
AR application for safety management of building can be achieved with QR code technique. QR codes reading by smart glasses can support rescue teams with quick information about, for example, particular areas in which fire prevention and overcrowding can create difficulties during the evacuation phase in a general emergency situation. Information can be regarded as the total amount of people counted by specific devices placed at the entrance doors, images captured by video-cameras placed in the rooms, known hazards beyond closed doors or fire alarm status derived from fire detection systems. Information can be obtained through an Internet of Thing interconnection of the devices used for monitoring [10].
4. Results
In Figure 7 stress monitoring activity on the metallic shelving is represented on a time base of 8 minutes for both the sensors installed. In the diagram, the Stress Yield Limit [%] (i.e. the ratio between the measured stress and the yield stress of the material) as a function of time is drawn. A comparison between loaded and unloaded structure is clearly visible after time 22:28 when stress goes flat.
The same situation can be calculated with a model programmed in MATLAB language, showing stress mechanical components and the size/location of the maximum stress points as parameters change. As stated above, the example test discussed in this paper is a simplification, since the stresses measured are only in the axial direction and calibration has been effected by a traction machine. FEA allows an in-depth analysis of the stress status for a correct positioning of the sensors, and might ensure a precise description of the shelving stress status; starting from a local stress measurement there would be the possibility to create a visual representation of the stress status with a chromatic scale.
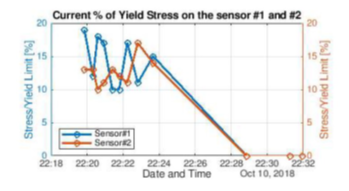 Figure 7: Stress monitoring on the shelving equipped with two strain gauges
First results obtained from the thermography application are encouraging because of the ease of use and the quick inspection from far away from the equipment. Finer adjustments on the images elaboration are under study.
5. Conclusions
Excellent results obtained with AR application applied to mechanical risk assessment for shelving structures underline the opportunity of extending this technology concept to other safety applications in industrial environments. Actually two main applications are under study and will be tested for safety improvements of workers and operators expecting the same results. This paper has presented in the previous chapters two experimental applications in which AR visors are the key factor for putting humans in the center of a digital revolution for safety best practices in industrial sites. Important benefits for AR application of smart glasses can be received with the implementation of the voice command feature, in order to further increase “hands-free” operations; system is actually under test. AR technology become a practical safety prevention tool that can be used in hazard management and reduction.
Advantages of this technology, confirmed with the new applications exposed are:
– Data intuitiveness;
– Easiness of use, updating and upgrading;
– High speed for data exchanging;
– Quick support for sudden decision making by safety operators;
– Multi-purpose hazard application with the same device and SDK.
Future developments of this work will provide the assessment of the platform in action, and the evaluation of the data collected during operation.
Conflict of Interest
The authors declare no conflict of interest.
Acknowledgment
Authors would like to acknowledge Genoa University.
- Revetria R. , Tonelli F., Damiani L., Demartini M., Bisio F., Peruzzo N., A real-time mechanical structures monitoring system based on digital twin, IoT and augmented reality, SpringSim-MSM 2019, April 29-May 2, Tucson, AZ, USA. DOI: 10.22360/springsim.2019.msm.001.
- Kolberg D., Zühlk D., 2015, Lean Automation enabled by Industry 4.0 Technologies, IFAC-PapersOnLine 48-3 (2015), pp. 1870–1875.Damiani, L., Giribone P., Mzoughi K., Revetria R., A Hybrid Simulation Model for Hospital Complex Plants Risk Evaluation, 2017, Engineering Letters, 25.2.
- Demartini, M., Tonelli, F., Damiani, L., Revetria, R., Cassettari, L. Digitalization of manufacturing execution systems: The core technology for realizing future smart factories (2017) Proceedings of the Summer School Francesco Turco, 2017-September, pp. 326-333.
- Mladenov B., Damiani L., Giribone P., Revetria R., A Short Review of the SDKs and Wearable Devices to be Used for AR Application for Industrial Working Environment. Proceedings of the World Congress on Engineering and Computer Science 2018 Vol I, WCECS 2018, October 23-25, 2018, San Francisco, USA, pp. 137-142.
- De Souza Cardoso L.F., Martins Queiroz Mariano F.C., Zorzalac E.R., A survey of industrial augmented reality, Computers & Industrial Engineering, 139, January 2020, 106159.
- Fiorentino, M., Uva, A. E., Gattullo, M., Debernardis, S., & Monno, G. (2014). Augmented reality on large screen for interactive maintenance instructions. Computers in Industry, 65, 270–278.
- Nichols S., Patel H., Health and safety implications of virtual reality: a review of empirical evidence, Applied Ergonomics 33 (3), May 2002, pp. 251-271.
- Wang, L. Zhang, L. Duan, R. Gao, A new paradigm of cloud-based predictive maintenance for intelligent manufacturing, March 2015, Journal of Intelligent Manufacturing, DOI: 10.1007/s10845-015-1066-0.
- Hoffmann K., 1989, An introduction to measurements using strain gages, Hottinger Baldwin Messtechnik GmbH, Darmstadt.
- Revetria, R., Catania, A., Cassettari, L., Guizzi, G., Romano, E., Murino, T., Improta, G., Fujita, H. Improving healthcare using cognitive computing based software: An application in emergency situation (2012) Lecture Notes in Computer Science (including subseries Lecture Notes in Artificial Intelligence and Lecture Notes in Bioinformatics), 7345 LNAI, pp. 477-490.
- Cheikhrouhu E., Imed Jabri, M.N Lakhoua, Yosra Mlouhi, Tahar Battikh, Lotfi Maalej, Application of Image Processing Techniques for TV Broadcasting of Sporting Events, International Journal of Advanced Computer Science and Applications, Vol.6, N°6, 2015, pp. 138-148.
- Wang H., Zhang X., Damiani L., Giribone P., Revetria R., Ronchetti G., Transportation Safety Improvements Through Video Analysis: An Application of Obstacles and Collision Detection Applied to Railways and Roads, Transactions on Engineering Technologies 2018, DOI: 10.1007/978-981-10-7488-2_1.
- Damiani, L., Demartini, M., Guizzi, G., Revetria, R., Tonelli, F., Augmented and virtual reality applications in industrial systems: A qualitative review towards the industry 4.0 era (2018) IFAC-PapersOnLine, 51 (11), pp. 624-630.
- Damiani, L., Revetria, R., Volpe, A. Augmented reality and simulation over distributed platforms to support workers (2016) Proceedings – Winter Simulation Conference, 2016-February, art. no. 7408476, pp. 3214-3215.
- Demartini, M., Tonelli, F. Quality management in the industry 4.0 era (2018) Proceedings of the Summer School Francesco Turco, 2018-September, pp. 8-14.