


Introduction
The meltwater derived from snow and ice plays a crucial role in the annual stream-flow of arid regions in western China (Reference Yao, Wang, Liu, Pu, Shen and LuYao and others, 2004), significantly affecting catchment hydrology by temporarily storing and releasing water on various timescales (Reference Jansson, Hock and SchneiderJansson and others, 2003). Although the melt process depends on different processes of the heat budget, snow- and ice-melt modeling using the energy-balance model is relatively complex and many climatic data are needed as input. Hence, simplifying assumptions are widely used in practical computations of snow and ice melt. The degree-day model is generally considered to be one of the simplest, yet sufficiently accurate, schemes to estimate snow and ice melt. Despite its simplicity, it has proven to be a powerful tool for melt modelling, often on a catchment scale outperforming the energy-balance model, especially in the remote high-mountain regions (US Army Corps of Engineers, 1971; Reference AndersonAnderson, 1973; WMO, 1986; Reference HockHock, 2003, Reference Hock2005).
The degree-day model depends on a relationship between ablation and air temperature that is usually expressed in the form of positive temperature. The factor of proportionality is called the degree-day factor (DDF), involving a simplification of complex processes that are more properly described by the energy balance of the glacier surface and the overlying atmospheric boundary layer. This means that the factor itself depends on the energy balance (Reference Krenke and KhodakovKrenke and Khodakov, 1966; Reference Ambach, Thomsen, Søgaard and BraithwaiteAmbach, 1988; Reference BraithwaiteBraithwaite, 1995). Therefore, there is a variation in DDFs resulting from the energy partitioning that varies with different climate, seasons and surfaces. Some studies suggest that spatial and temporal variations of DDFs greatly affect the accuracy of snow- and ice-melt modelling (Reference Quick and PipesQuick and Pipes, 1977; Reference Braun, Grabs and RanaBraun and others, 1993; Reference Rigaudiere, Ribstein, Francou, Pouyaud and SaraviaRigaudière and others, 1995; Reference Schreider, Whetton, Jakeman and PittockSchreider and others, 1997; Reference Arendt and SharpArendt and Sharp, 1999; Reference HockHock, 2003).
In western China, however, there is little research focusing on the variability of DDFs, especially in high-mountain regions. This study provides a synthesis of the variation in DDFs essential for accurately estimating snow- or ice-melt processes, especially in the non-monitored mountain regions in western China.
Data and Method
Data collection
The 15 glaciers used in our study are located in western China (Fig. 1) and were investigated or monitored during different periods in the past (Reference Zhang and BaiZhang and Bai, 1980; Reference SuSu and others, 1985; LIGG, 1986–93; Reference Zhang and ZhouZhang and Zhou, 1991; Reference Liu, Xie and YangLiu and others, 1992; Reference Yao and AgetaYao and Ageta, 1993; Reference Li and SuLi and Su, 1996; Reference Su, Wang and XieSu and others, 1998). The terminus elevations of these glaciers range from 2640 to 5450 m a.s.l.

Fig. 1. Map of the study area, with locations of the 15 monitored glaciers in western China: 1. Urumqi No. 1; 2. Qiongtailan; 3. Keqicar Baqi; 4. Qirbulake; 5. Yangbulake; 6. Teram Kangri; 7. Meikuang; 8. Qiyi; 9. Halong; 10. Xiaodongkemadi; 11. Kangwure; 12. Hailuogou; 13. Dagongba; 14. Xiaogongba; 15. Baishuihe No. 1.
In this study, the ablation data were measured using ablation stakes. Most of the ablation records span >1month (Table 1), and fortunately, on most glaciers, the meteorological data were recorded over the entire period. The longest combined ablation–climate dataset is for Ürümqi glacier No. 1 (UG1; 8years, 1986–93).
Table 1. DDFs on different monitored glaciers in western China

However, on four glaciers, namely Meikuang, Halong, Qirbulake and Yangbulake glaciers, there are no meteorological data. Hence, daily temperature on these glaciers was extrapolated from the closest national meteorological station using the vertical lapse rate (VLR). The distance between the glacier and the national meteorological station varied considerably, from several kilometers to a few hundred kilometers. The VLR of the different latitude and altitude zones over the Tibetan Plateau and surrounding regions can be taken from Reference Li, Cheng and LuLi and others (2003) and ranges from –0.0054 to–0.0068C m−1. The equilibrium-line altitude (ELA) for each of the 15 glaciers was taken from the China Glacier Inventory (CGI) and ranges from 4000 to 7000 m a.s.l. (Reference Shi, Liu, Wang, Liu and YeShi and others, 2005).
Method
The DDF is an important parameter for the degree-day model, which is based on a linear correlation between snow or ice melt and the sum of daily mean temperatures above the melting point during a period. Commonly, the DDF is computed either from direct measurements, using ablation stakes (e.g. Reference Liu, Ding, Ye and ChengLiu and others, 1996; Reference Braithwaite, Konzelmann, Marty and OlesenBraithwaite and others, 1998) or snow lysimeter outflow (e.g. Reference Kustas, Rango and UijlenhoetKustas and others, 1994), or from melt obtained by energy-balance computations (e.g. Reference BraithwaiteBraithwaite, 1995; Reference Arendt and SharpArendt and Sharp, 1999; Reference ZhangZhang, 2005).
In our study, DDFs are computed from direct measurements using ablation stakes distributed on different monitored glaciers. In general, the DDF is given by
where DDF is the degree-day factor, different for snow and ice, M is the depth of meltwater in an Nday period, and PDD is the sum of daily mean air temperatures above the melting point in the same Nday period. Commonly, PDD is given by (Reference Braithwaite and OlesenBraithwaite and Olesen, 1993)
where Tt is the daily mean air temperature on day t, and Ht is a logical variable, which can be defined such that Ht = 1:0 for Tt > 0°C and Ht = 0:0 for Tt < 0°C Strictly speaking, it might be better to define Tt as a function of a daily degree-day total, because daily mean temperatures can sometime be negative while temperatures are actually above freezing for part of the day. However, the familiar daily mean air temperature is used here for convenience in using conventional climatological data.
Based on the monitoring data of the 15 glaciers in different periods (Reference Zhang and BaiZhang and Bai, 1980; Reference SuSu and others, 1985, Reference Su, Wang and Xie1998; LIGG, 1986–93; Reference Zhang and ZhouZhang and Zhou, 1991; Reference Liu, Xie and YangLiu and others, 1992; Reference Yao and AgetaYao and Ageta, 1993; Reference Li and SuLi and Su, 1996), the DDFs for ice and snow in western China can be obtained by Equations (1) and (2) (Table 1). The results reveal a large variability from site to site. The values of the factors are derived from different integration periods ranging from a few days (e.g. Dagongba glacier) to several years (e.g. UG1), which limits their direct comparison. In addition, the computed processes of DDFs involve two main sources of error:
possible errors in measuring snow or ice melt using ablation stakes distributed on different monitored glaciers; and
uncertainty in the VLR used to extrapolate air temperature from the nearest national meteorological station to the four glaciers where no meteorological data exist.
Results
Degree-day factors
Table 1 shows that there is a large variation in DDFs, which can be attributed to the difference in relative importance of individual energy components providing energy for melt. It is generally accepted that DDFs for snow are considerably lower than those for ice, due to the higher albedo of snow compared to ice. In western China, the mean value of DDFs for ice on the monitored glaciers is 7.1 mmd−1 ˚C−1, whereas for snow it is 4.1 mmd−1 ˚C−1. So the DDF for snow reaches about 58% of that for ice in western China, while the corresponding percentage is about 40% and 70% on two Greenland glaciers and four Scandinavian glaciers (Reference HockHock, 2003).
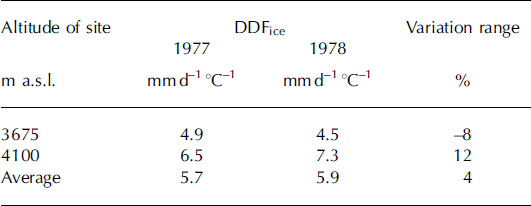
Since the energy balance of the glacier surface varies considerably in space and time, the DDF can be expected to vary seasonally and spatially. Some studies suggest that seasonal variations in DDFs for ice tend to be less pronounced because of low seasonal variations in surface albedo (Reference Braithwaite and OlesenBraithwaite and Olesen, 1993). In western China, monthly variations of DDFs on Keqicar Baqi glacier, southwestern Tien Shan, given by Table 2, clearly show that monthly variations of the factor are less distinct. Similarly, seasonal variations during two summers are less pronounced over the ice on Qiongtailan glacier, which only varies from –8% to 12% (Table 3). This finding is in agreement with that of Reference Braithwaite and OlesenBraithwaite and Olesen (1993), who detected no evidence of distinct seasonal variation in DDFs in their analysis of 6 years of summer data over ice on Qamanârssûp sermia, Greenland. Over snow, the seasonal variation in surface albedo is more pronounced due to metamorphic evolution, so DDFs also tend to be more pronounced (Reference KuusistoKuusisto, 1980). In this study, however, we cannot discuss the variation in DDFs for snow due to lack of the long-term monitoring data for snow in western China.
Table 2. Monthly variation of DDFs on Keqicar Baqi glacier (2003)
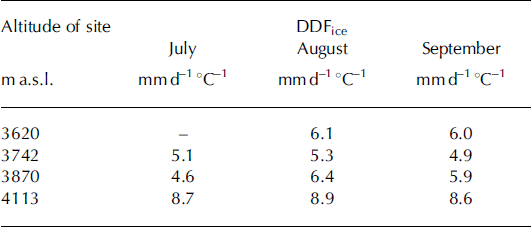
Table 3. Seasonal variation ofDDFson Qiongtailan glacier, 1977–78
Spatial variation of degree-day factors
With different elevations, solar radiation and surfaces (albedo), DDFs will vary considerably in space. In addition, the DDF is considerably affected by the topographic effects, such as slope, aspect and shape in mountain regions. Since temporal variations of DDFs on the observed glaciers of western China tend to be less pronounced, the spatial variation of the factors is discussed below.
For a single glacier, spatial variation is reflected by the relationship between the DDF and the distance between the observed site of the factor and the ELA (Figs 2 and 3). Figure 2 clearly shows that the DDFs for ice increase with decreasing distance to the ELA. It is concluded that on these monitored glaciers (Fig. 2) the larger DDFs converge at a range of 500m which is the distance below the ELA. It is evident from Figure 2 that the DDF at higher altitude is larger than at lower altitude on these monitored glaciers where the ELA is very high (>4000 m). This characteristic can be attributed primarily to ablation due to absorbed global radiation near the ELA where the positive degree-day (PDD) is low due to low air temperature (Reference Kayastha, Ageta, Nakawo, Fujita, Sakai and MatsudaKayastha and others, 2003). This means that glacier melt near the ELA (with small PDD) is mainly attributed to the absorbed global radiation, which results in a larger DDF at higher altitudes than at lower altitudes, called ‘the low-temperature effect’ (Reference BraithwaiteBraithwaite, 1995). Nevertheless, an opposite trend of the DDF is given by Figure 3, which clearly indicates that the DDFs for ice decrease with distance to the ELA on the glaciers in the central Tibetan Plateau and the Himalaya. On these glaciers, evaporation from ice, especially sublimation, plays a major role in the heat budget. Due to the high energy consumption involved, evaporation from ice reduces considerably the energy available for melt, and thus reduces DDFs. In brief, the DDFs for a single glacier are subject to significant small-scale variations.

Fig. 2. Increasing variations of the DDFs with decreasing distance to the ELA in western China.

Fig. 3. Decreasing variations of DDFs with decreasing distance to the ELA in western China.
In western China the glaciers can be split into three types: extremely continental, subcontinental and maritime (Reference Shi and LiuShi and Liu, 1999). For different glacier types, maritime glaciers are likely to have higher DDFs than subcontinental and extremely continental glaciers. The average values of DDFs for maritime, subcontinental and extremely continental glaciers are 10.9, 7.2 and 4.3 mm d −1 ˚C−1, respectively. This finding is not in agreement with Reference HockHock (2003), who suggested that glaciers in maritime environments are likely to have lower DDFs than those in more continental climate regions due to relatively large turbulent fluxes, including condensation. Although the turbulent fluxes on maritime glaciers in western China account for >50% of the heat budget in the melt season (Reference Xie, Xie and KotlyakovXie, 1994), DDFs of maritime glaciers are higher than those of subcontinental and extremely continental glaciers. Besides the influence of different regional climate conditions, the fact that the ablation area of maritime glaciers in western China is generally covered with a thin debris layer that accelerates glacier melt (Reference ØstremØstrem, 1959; Reference Rana, Nakawo, Fukushima and AgetaRana and others, 1997; Reference Zhang, Liu, Shangguan, Han, Xie and WangZhang and others, 2005) should be emphasized among the most important reasons for this phenomenon. This debris layer has a strong influence on the surface energy balance and melting of the underlying ice, and the thermal conductivity and albedo are the main physical characteristics of a debris layer that control heat conduction to the ice-debris interface.
For the total glacier system of western China, regional patterns of DDFs are clearly detectable (Fig. 4). Figure 4 is a map of isolines for the DDFs for ice, which clearly shows that the factors increase gradually from northwest to southeast in western China. According to the DDF values, we can split the observed glaciers in western China into three categories: a high-value region (>9.0mmd−1 °C−1), a mid-value region (6.0−9.0 mm d−1 °C−1) and a low-value region (<6.0mmd−1 °C−1) (Fig. 4). It is evident that the high-value region is located in the southeast of western China, whereas the low-value region lies in the northwest of western China. This distinct spatial variation of DDFs can mainly be attributed to the unique climatic environment and heat budget of the Tibetan Plateau and the surrounding regions.

Fig. 4. Map of DDF isolines for ice in western China.
Like the variation of DDFs, from northwest to southeast in western China, the climatic environment varies gradually from cold-dry to warm-wet, while the type of heat budget varies from evaporation type to condensation-evaporation type (Reference Shi, Huang, Yao and DengShi and others, 2000). This shows that regional climate conditions greatly affect the spatial variation of DDFs in western China. Generally speaking, low DDFs can be expected for cold-dry areas where available ablation energy may be mainly consumed by evaporation, especially sublimation; whereas high DDFs can be expected for warm-wet areas where the available ablation energy is mainly consumed by melting.
Conclusions
This study analyzes the spatial variation features of DDFs obtained from the investigated or monitored glaciers of western China over different periods. The mean value of DDFs for ice and snow is 7.1 and 4.1 mm d−1 °C−1, respectively. Although temporal variations of DDFs are less pronounced, their spatial variations are significant. On a single glacier, DDFs are subject to significant small-scale variation. Considering different types of glaciers, maritime glaciers are likely to have higher DDFs than subcontinental and extremely continental glaciers. For the total glacier system, the regional patterns are detectable and significantly linked to the unique climatic environment and heat budget of the Tibetan Plateau and surrounding regions. In western China the high-value DDF region (>9.0mmd−1 °C−1) is located in the southeast, whereas the low-value DDF region (<6.0mmd−1 °C−1) lies in the northwest; that is, the DDFs increase gradually from northwest to southeast in western China. Generally speaking, low DDFs can be expected for cold-dry areas where sublimation plays a major role in the available ablation energy, whereas high DDFs can be expected for warm-wet areas.
This paper describes the characteristics of the spatial variation of DDFs for degree-day models, used to estimate glacier melt on observed glaciers in western China. According to the CGI, there are 46 342 glaciers with a total area and volume of 59 415 km2 and 5601 km3, respectively, in western China. Due to the lack of money and time to monitor every glacier, only 15 glaciers have been investigated or monitored during different periods in the past. The monitoring data of the 15 investigated or monitored glaciers are of vital importance for studying the change of non-monitored glaciers in China. Hence, based on the spatial variations of DDFs and the meteorological data of different observed glaciers in different periods, we can provide gridded degree-day models of the non-monitored glaciers for reconstructing gridded historical mass-balance series in the different regions, which can then be used to predict the influence of glacier change on the water resources in western China.
Acknowledgements
Thanks to R.J. Braithwaite, P. Jansson and C. Kull for helpful comments and suggestions that greatly improved this paper. We are grateful to the Scientific Editor, M. Vuille. This work was financially supported by Chinese National Fundamental Research Program (grant No. 90202013 and 40371026), the Knowledge Innovation Project of the Chinese Academy of Sciences (CAS; grant No. KZCX3-SW-345 and KZCX3-SW-339) and that of the Cold and Arid Regions Environmental and Engineering Research Institute, CAS (grant No. 2004102). Finally, we are also grateful to the China Meteorological Administration for supplying the meteorological data for this study.


