Introduction
While 10 years ago the ice-sheet modelling community employed computer models at a higher spatial resolution compared to the data availability, at present the reverse is true. Satellite altimetry data and dense airborne and overland radio-echo sounding missions filled up many of the ˚white spaces", especially on the Antarctic continent. Improved datasets on Antarctic surface elevation, ice thickness and ice velocity now allow for detailed modelling of the ice-sheet dynamics. However, an increase in spatial model resolution puts higher demands on computation time and also requires an analysis of the internal ice dynamics, especially with regard to the shallow-ice approximation (SIA) that forms the basis of most present-day Antarctic ice-sheet models.
Moreover, when the ice-sheet margin terminates in the sea in the form of a floating ice shelf, a transition zone can be defined where the ice-sheet dynamics gradually evolves towards ice-shelf dynamics. Studies on this grounding zone have revealed that for small basal motion the width of the transition zone is of the same order of magnitude as the ice thickness, and a full derivation of the Stokes balance equations is not necessary (Reference Herterich, Van der Veen and OerlemansHertench, 1987; Reference Van der Veen, Van der Veen and OerlemansVan der Veen, 1987). However, when basal motion dominates the internal ice dynamics, not only shearing but also longitudinal stretching is involved. Most numerical time-dependent ice-sheet models do not solve the full stress field. Amongst those that incorporate these stresses and handle grounding-zone dynamics are (Reference Van der Veen, Van der Veen and OerlemansVan der Veen, 1987, Reference Van der Veen1989) (two-dimensional), Reference MayerMayer, 1996 (three-dimensional) and Reference PattynPattyn (1996) (two-dimensional with full thermomechanical coupling). The major drawback of these models is computation time and numerical stability, which we tried to overcome in this study.
The present paper investigates the steady-state behaviour of the Antarctic ice sheet in Dronning Maud Land at different spatial resolutions, i.e. at grid spacings ranging from 40 km down to 5 km, and compares the results of the newly developed ice-sheet model (ICE2D), taking into account all relevant stresses and full thermomechanical coupling, with a similar model based on the SIA. Special attention is paid to the ice-dynamical processes in the transition zone between the ice sheet and the ice shelf, and the effect of basal drag vs driving stress on the sliding velocity.
ICE2D Model Description
Field equations
The developed numerical ice-sheet model (ICE2D) is a dynamic flowline model that predicts the ice-thickness distribution along a fixed flowline in space in response to environmental conditions. This response is obtained by calculating at a given moment the two-dimensional flow regime and the temperature distribution, determined by the ice-sheet geometry and its boundary conditions. The ICE2D model is similar to the model described in (Reference PattynPattyn, 1996), which is based on the model of Reference Van der VeenVan der Veen (1989). The major difference between this model and the ICE2D model lies in the numerical solution of the field equations and the proper inclusion of transverse strain rates and stresses in the ICE2D model. A detailed description of the ICE2D model will be given in a forthcoming paper by F. Pattyn. Only a brief overview of the major components of the model will be presented here.
A Cartesian coordinate system (x, z) with the × axis along the flowline, parallel to the geoid, and the z axis pointing vertically upward (z = 0 at sea level) is defined. This implies that the only non-zero velocity components are u, w (horizontal and vertical velocity, respectively), while the horizontal transverse velocity v = 0. Considering convergence-divergence of the ice flow leads to ∂v/∂y = (u/b) ∂b/∂x, where b is the width along the flowline. Mass conservation and the stress equilibrium thus become

where p is the ice density (910 kg m–3), g is the gravitational acceleration (9.81 m s"2) and [a] is the stress tensor. For an isotropic ice mass that deforms under steady-state creep, the constitutive equation, relating the deviatoric stresses to the strain rates, is expressed as (Reference PatersonPaterson, 1994)
for i, j = x, y, z, where
![]() is the second strain-rate tensor invariant defined by
is the second strain-rate tensor invariant defined by
![]() and 77 is the effective viscosity, n = 3 is the power-law exponent. Deviatoric stresses are related to the stress components by
and 77 is the effective viscosity, n = 3 is the power-law exponent. Deviatoric stresses are related to the stress components by
![]() and 4= for i≠j, 6 so that the stress equilibrium (Equation (2)) can be written as
and 4= for i≠j, 6 so that the stress equilibrium (Equation (2)) can be written as

where s is the surface of the ice mass. The third term of the lefthand side of Equation (4) can be written as ∂Rzz/∂x, where Rzz represents the vertical resistive stress (Reference Van der Veen and WhillansVan der Veen and Whillans, 1989). The flow-law rate factor A{T*) is a function of temperature, where T* is the ice temperature (K) corrected for pressure melting. Following Reference HookeHooke (1981), A(T*) is set to

where Q is the activation energy for creep (7.88 × 10⁴J mol–1), R is the universal gas constant (8.31 J mol–1 KT1), B0 = 1.928 Pa aȡ1/n, C = 0.16612 Kk, K = 1.17, Tτ = 273.39 K and mis an enhancement factor (or tuning parameter).
The thermodynamic equation for the ice flow along a flowline is written as

where ki (6.62 × 10⁻⁷ J m–1K–1a–1 ) and cp (2009 J kg"1 K–1) are the thermal conductivity and the specific heat capacity, respectively. The heat transfer is thus a result of horizontal and vertical diffusion, horizontal and vertical advection, and internal friction due to deformational heating.
Starting from the known bedrock topography and surface mass-balance distribution, and assuming a constant ice density, the change of ice thickness along the flowline is predicted as
where
![]() is the depth-averaged horizontal velocity (m a–1), H is the ice thickness (m), Ms
is the surface mass balance (m a"1 ice equivalent) and Mb is the melting rate at the base of the ice sheet (ma–1).
is the depth-averaged horizontal velocity (m a–1), H is the ice thickness (m), Ms
is the surface mass balance (m a"1 ice equivalent) and Mb is the melting rate at the base of the ice sheet (ma–1).
Boundary conditions
Boundary conditions to the ice sheet are a symmetric ice divide (∂s/∂x = ∂H/∂x = 0); an ice shelf at the seaward side; a stress-free surface; and a Weertman-type basal sliding function at the bottom of the ice sheet, expressed as (Reference Van der Veen, Van der Veen and OerlemansVan der Veen, 1987)
where Ah
is the sliding constant (2 × lOȡ7 m5 Nȡ2 aȡ1), τb is the shear stress at the base and N is the effective normal pressure proportional to the height of the glacier’s surface above buoyancy, i.e. N = pgH + ρsg(hh ― hsl), where ρs
is the sea-water density (1028 kg mȡ3) and hsl
is the sea-level height compared to the present sea level. Sliding occurs over the whole flowline domain (irrespective of basal temperature conditions), in order to avoid singularities at the base of the ice sheet. Since our interest lies in the transition zone upstream of the grounding line, the ice tongue as a whole is considered as a boundary condition. In principle, the conditions for an ice tongue imply that τb = 0 and
![]() . However, to make possible a comparison with the SI A model, both the SIA and ICE 2D models were given the same ice-shelf condition for an ice tongue obtained from the simplified flow law, i.e.
. However, to make possible a comparison with the SI A model, both the SIA and ICE 2D models were given the same ice-shelf condition for an ice tongue obtained from the simplified flow law, i.e.
![]() where
where
![]() at the downstream edge of the the ice tongue is determined from hydrostatic equilibrium (Reference ThomasThomas, 1973). This introduces a second tuning parameter m> to adjust the thickness of the ice shelf, and which takes implicitly into account the effect of side drag and back pressure exerted by the ice shelf on the inland ice in a similar way for both models.
at the downstream edge of the the ice tongue is determined from hydrostatic equilibrium (Reference ThomasThomas, 1973). This introduces a second tuning parameter m> to adjust the thickness of the ice shelf, and which takes implicitly into account the effect of side drag and back pressure exerted by the ice shelf on the inland ice in a similar way for both models.
Boundary conditions to the thermodynamic equation (Equation (6)) are the mean annual air temperature at the surface, and at the base
holds, where G = 42 mW nT2 is the geothermal heat flux. The basal temperature in the ice sheet is kept at the pressure-melting point whenever it is reached. In the ice shelf, the mean temperature of the sea water is taken as lower boundary condition (Tb =-2°C).
Numerical solution
For numerical convenience a dimensionless vertical coordinate is introduced to account for ice-thickness variations along the flowline, which is defined as ζ = 0» ― z)/H, so that C― 0 at the upper surface and ζ= 1 at the base of the ice sheet. After this transformation, all equations are solved on a grid that is regularly spaced in × but irregularly spaced in ζ The vertical domain is subdivided into 30 layers with varying thickness, i.e. a lowermost grid spacing of 0.015, gradually increasing towards the top of the ice column. Central differences are used to compute first- and second-order gradients. At the boundaries, upstream and downstream differences are employed (e.g. Reference Payne and DongelmansPayne and Dongelmans, 1997).
An expression for the velocity field is found by relating the strain rates to velocity gradients and inserting Equation (3) into Equation (4). After introducing the dimensionless vertical coordinate, the finite-difference form of this equation is written as a set of linear equations with u(x, ζ) as unknowns. This set is solved by the conjugate gradient method on sparse matrices (Reference Press, Flannery, Teukolsky and VetterlingPress and others, 1992). However, due to the non-linear nature of the flow law (Equation (3)) and the dependence of η, on u, a proper solution to the velocity field is found in an iterative fashion using a Picard iteration. In order to optimize the convergence, a relaxation formula was added using the subspace iteration scheme described by Reference Hindmarsh and PayneHindmarsh and Payne (1996).
SIA
For the purpose of this paper, experiments carried out with the ICE2D model were compared to a similar model that solves the velocity field according to the SIA. The horizontal velocity in the grounded ice sheet according to the SIA is determined as (e.g. Reference Huybrechts and OerlemansHuybrechts and Oerlemans, 1988)

For the ice-shelf flow the same condition is applied as for the ICE2D model. Note that for the SIA model, the basal shear stress (τb) equals the driving stress τd=–pgH(∂s/∂x).
Model Set-Up and Input Data
Both the SIA and the ICE2D models were tested against the European Ice Sheet Modelling Initiative (EISMINT) benchmark for ice-sheet models (Reference Huybrechts and PayneHuybrechts and others, 1996), and the benchmark was confirmed. The ICE2D model was furthermore compared with the model of Reference PattynPattyn (1996) for an ice sheet under a simplified geometry. These experiments also demonstrated that the ICE2D model is only 3–5 times slower in computing time than the SIA model, while this difference was at least a factor 50 with the model of Reference PattynPattyn (1996). More details on the benchmark testing and validation will be given in a forthcoming paper by F. Pattyn.
The primary input for the model is the present bedrock and ice-surface profile sampled along the central flowline of Shirase drainage basin from the ice divide (Dome Fuji) to the edge of the continental shelf (Fig. 1). Data were sampled from different oversnow traverses (Reference Kamiyama, Furukawa, Maeno, Kishi and KanaoKamiyama and others, 1994). Ice thickness in the stream region was compiled after Reference Mae and YoshidaMae and Yoshida (1987). Data were originally sampled at a 2 km resolution. In order to obtain reference datasets at different (higher) resolutions, these data were filtered using a Savitzky-Golay smoothing filter (Reference Press, Flannery, Teukolsky and VetterlingPress and others, 1992) and resampled at the appropriate resolutions (5,10, 20 and 40 km grid size), b is determined from the size of the drainage area (shaded region in Fig. 1). Present surface accumulation and temperature data along the flowline were taken from Reference Takahashi and WatanabeTakahashi and Watanabe (1997) and Reference Satow and HigashiSatow and Kikuchi (1995), respectively.
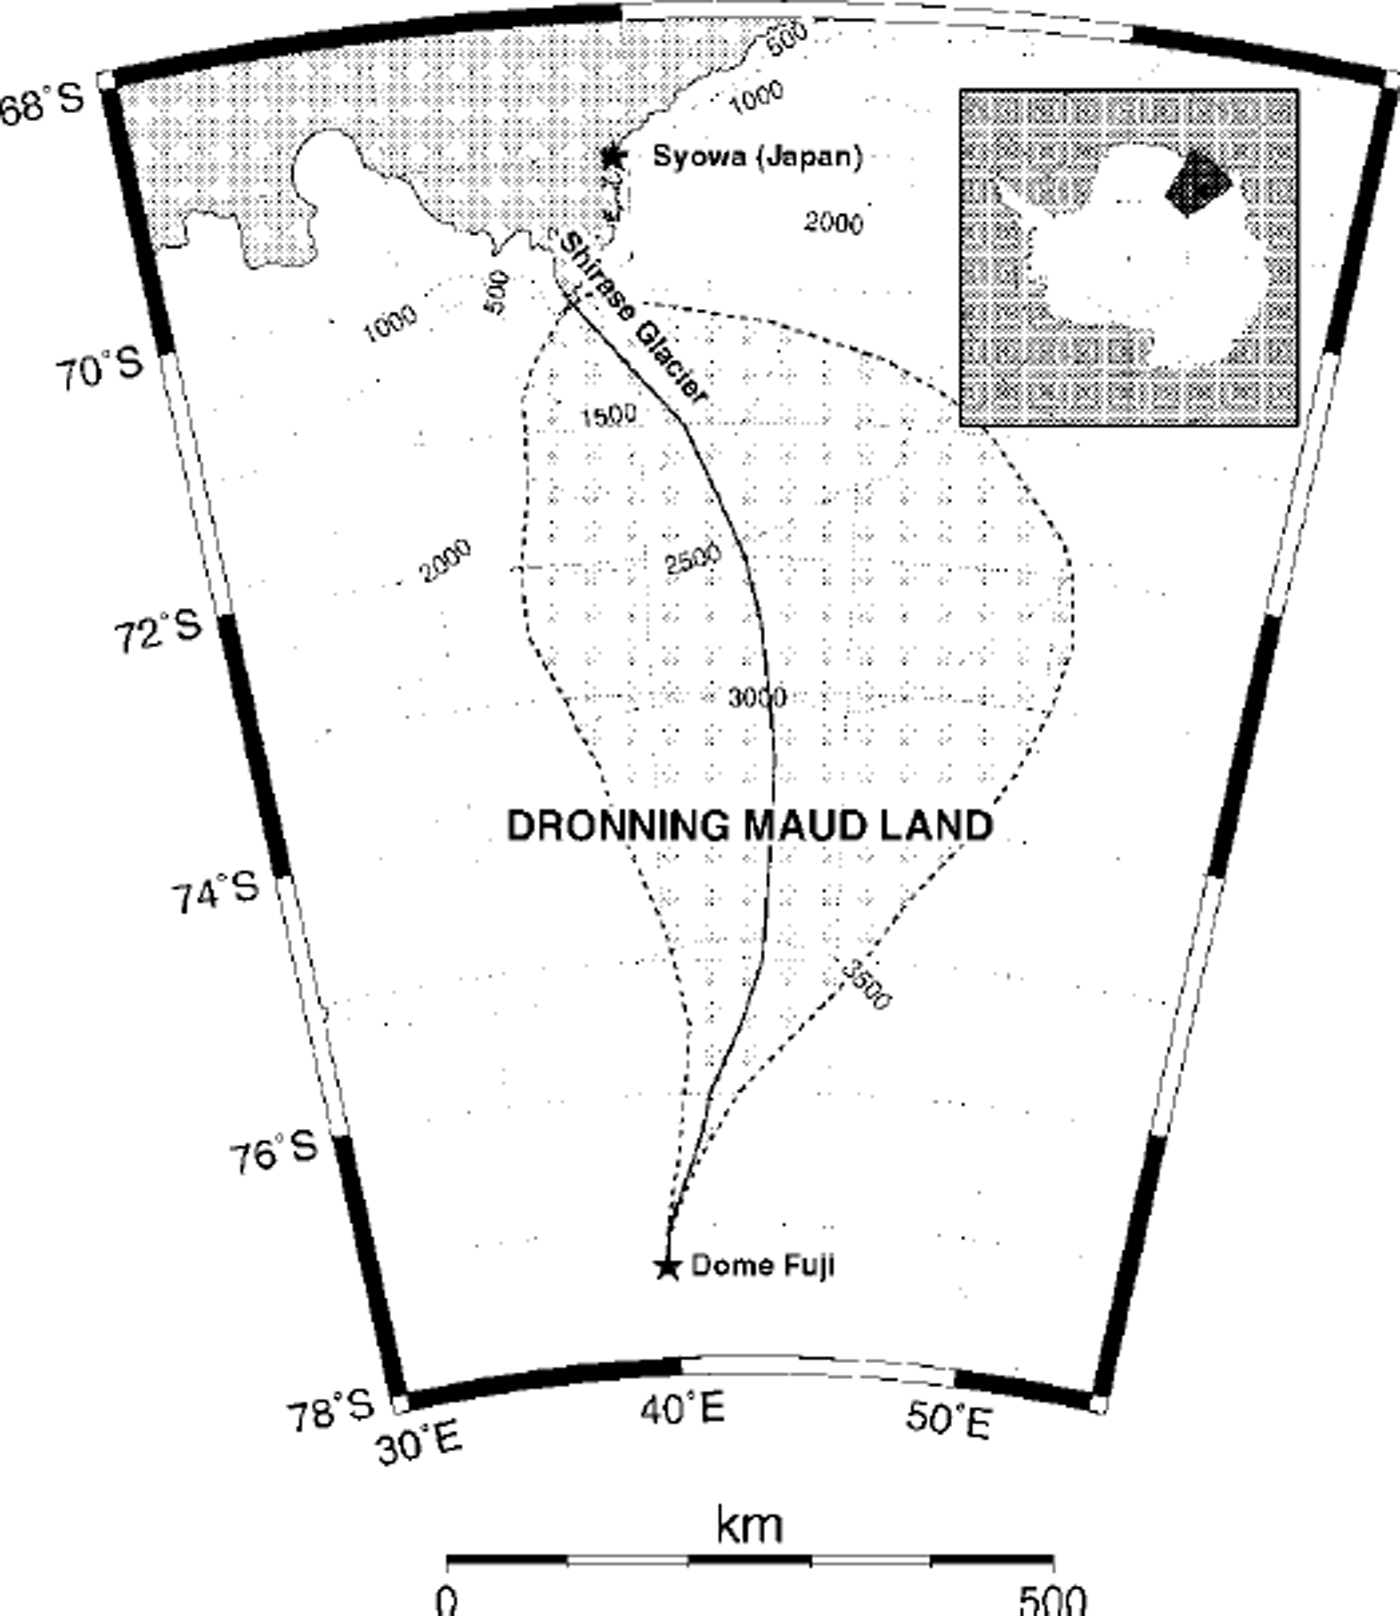
Fig. 1. Location map of Shirase drainage basin, Dronning Maud Land, Antarctica. The thick line represents the central flowline within the drainage basin area (shaded).
Results
The ICE2D and SIA models were run forward in time until a steady state was achieved after about 200 000 years, with m = 0.5 and m’ = 0.5 in order to adjust the height-to-width ratio of the ice sheet and the ice tongue. Both models use the same tuning parameters. By applying these tuning parameters it was possible to obtain ice-sheet surface profiles that are in general agreement with the present observed surface profile of Shirase drainage basin (Fig. 2). However, both model profiles show a higher elevation in the divide region, probably due to the presence of a subglacial mountain situated about 150 km from Dome Fuji, which is probably a nunatak, so the main ice flow is most likely at the sides of this topographic feature. The difference in ice thickness between the two models is 2–5%, with a maximum near the grounding line. At first glance, there is no indication that the increase in horizontal resolution has much influence on the ice-sheet surface profile. A closer look at the grounding line reveals the major differences between the employed resolutions (Fig. 3). Surface gradients at the grounding line increase with increasing resolution, but decrease at 5 km grid size. The reverse is true for mass fluxes
![]() at the grounding line (Fig. 3). Two factors play a role in this: (i) at a low resolution, surface gradients are calculated over larger areas, hence overseeing the inflection point at the interface between the ice sheet and the ice shelf; (ii) the increase in mass fluxes with resolution implies a flattening of the surface, as can be observed in the field on ice streams, and which is apparent at a 5 km grid size. On can observe a maximum mass-flux difference of about 10% between the two models.
at the grounding line (Fig. 3). Two factors play a role in this: (i) at a low resolution, surface gradients are calculated over larger areas, hence overseeing the inflection point at the interface between the ice sheet and the ice shelf; (ii) the increase in mass fluxes with resolution implies a flattening of the surface, as can be observed in the field on ice streams, and which is apparent at a 5 km grid size. On can observe a maximum mass-flux difference of about 10% between the two models.
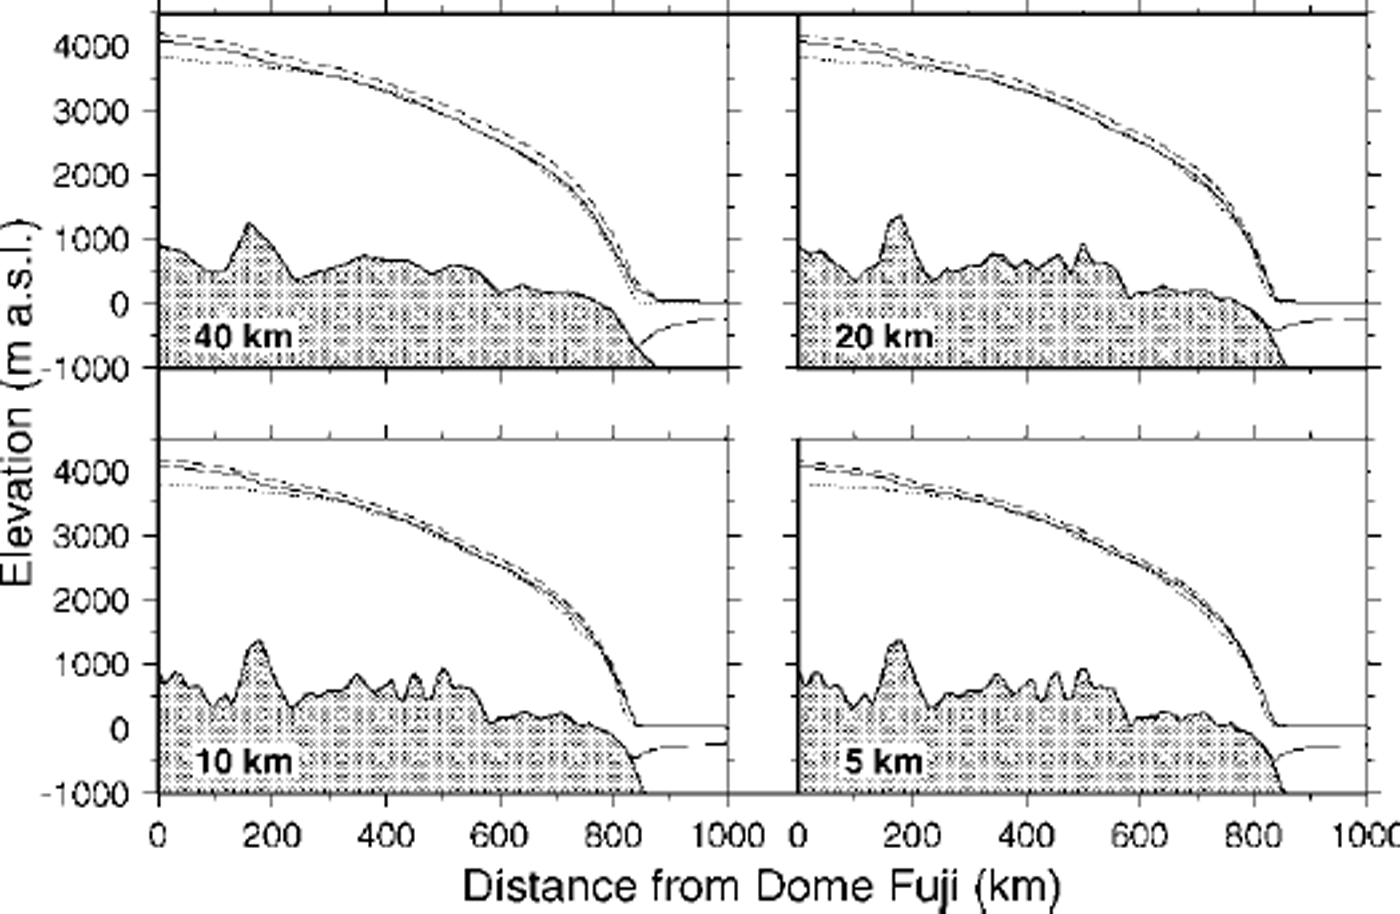
Fig. 2. Steady-state solutions of the Shirase flowline for different horizontal grid spacings (40, 20, 10 and 5km). Dotted line: present observed surface profile; solid line: ICE2D model result; dashed line: SIA model result.

Fig. 3. Mass flux (a) and the absolute value of the surface gradients (b) at the grounding line for different resolutions according to the ICE2D model (o) and the SIA model (•).
Figures 4 and 5 display the major velocity and stress components at the grounding line as a function of resolution for the ICE2D and the SIA model, respectively. Both basal and surface velocity at the grounding line increase with increasing resolution (Fig. 4). Moreover, the sliding velocity takes a larger part in the total ice velocity with increasing resolution, although the sliding parameter Ah
remains the same for all experiments. Basal shear and driving stress attain a maximum at a grid size of 20 km and then decrease at higher resolutions. Basal shear stress is higher than the driving stress, except at a grid size of 5 km where τb is 40 kPa lower than τd. The longitudinal stress deviator
![]() increases with increasing resolution (except for the highest-resolution experiment). More or less the same picture appears in Figure 5 for the SIA experiments, although both basal and surface velocities are somewhat lower than for the ICE2D experiments. An explanation needs to be sought in the difference in the basal boundary conditions applied to the two models, which is confirmed by the fact that the basal shear stress in the SIA model equals the driving stress for different resolutions.
increases with increasing resolution (except for the highest-resolution experiment). More or less the same picture appears in Figure 5 for the SIA experiments, although both basal and surface velocities are somewhat lower than for the ICE2D experiments. An explanation needs to be sought in the difference in the basal boundary conditions applied to the two models, which is confirmed by the fact that the basal shear stress in the SIA model equals the driving stress for different resolutions.

Fig. 4. Velocity and stress field at the grounding line for different resolutions according to the ICE2D model, (a) Basal (o) and surface (•) horizontal velocities; (b) driving stress τd (o) basal shear stress τb (•), basal
![]() (Δ) and surface
(Δ) and surface
![]() (□).
(□).
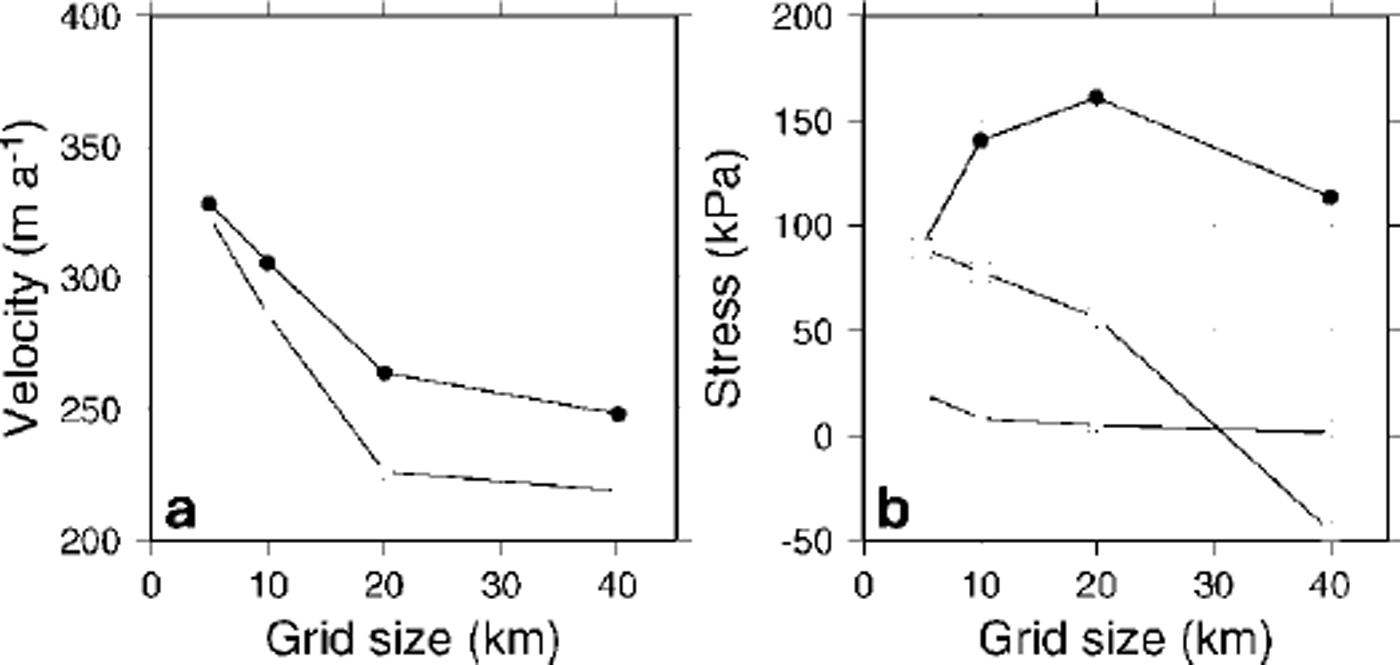
Fig. 5. Velocity and stress field at the grounding line for different resolutions according to the SIA model, (a) Basal (o) and surface (•) horizontal velocities; (b) basal shear stress τb (•), basal
![]() (A) and surface
(A) and surface
![]() Note overlapping τd and τb curves.
Note overlapping τd and τb curves.
Enhanced-sliding experiment
For the 10 km grid dataset an enhanced-sliding experiment is carried out by setting the parameter Ah in Equation (8) three times higher than in the reference experiment in order to examine the transition zone under more realistic circumstances. Besides the fact that basal sliding takes up a larger part in the total velocity near the grounding line, which leads to a significant increase in horizontal velocity, the basal shear stress is reduced over the whole flowline and significantly reduced in the area between 700 km and the grounding line (Fig. 6). The basal shear stress reaches a maximum approximately 80 km upstream of the grounding line and is as low as 120 kPa, compared to 200 kPa in the moderate-sliding case. Surface longitudinal stresses are hardly altered compared to the standard experiment.
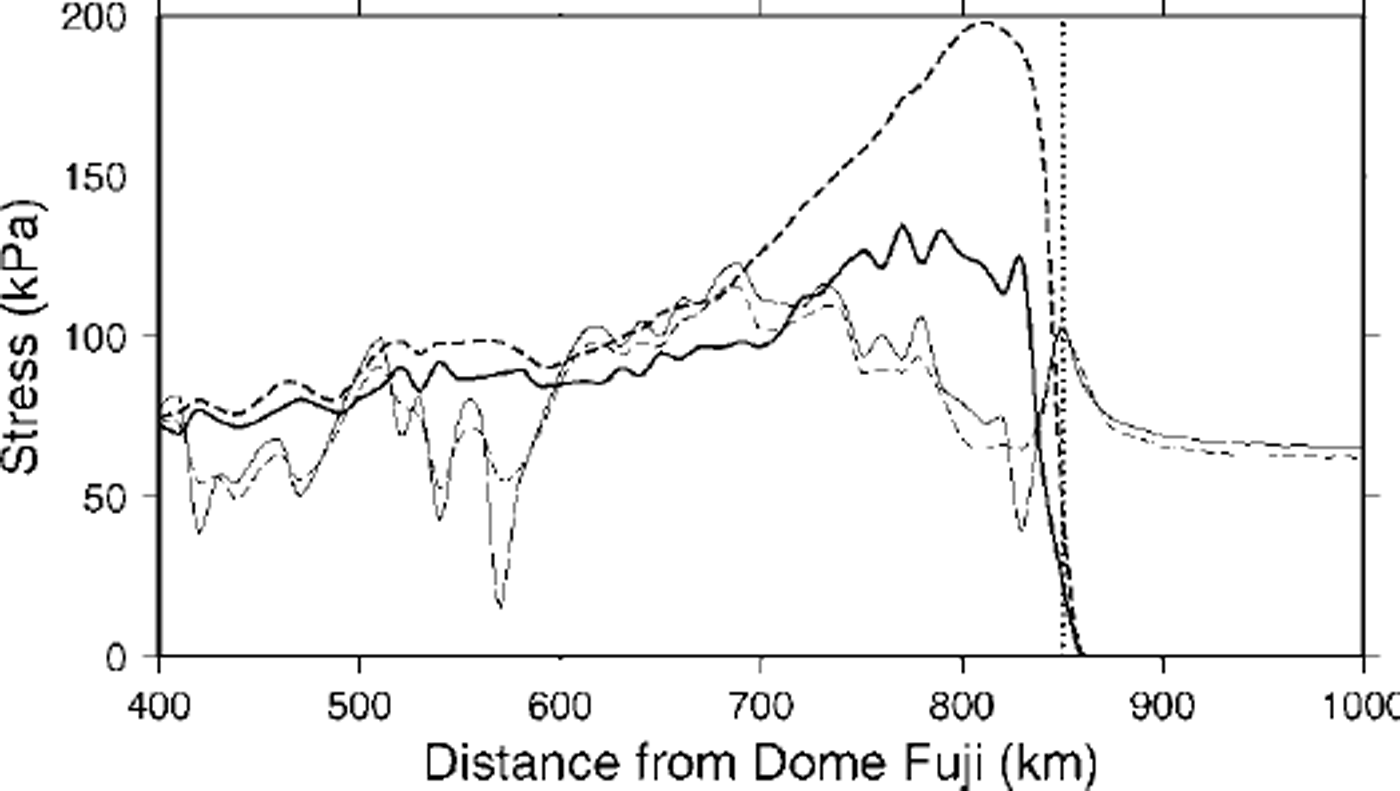
Fig. 6. Basal shear stress (thick lines) and surface longitudinal stress deviator (thin lines) for the enhanced-sliding experiment (solid line) and the standard experiment (dashed line). The vertical dotted line shows the position of the grounding line.
A complete overview of the stress fields in the downstream area of Shirase drainage basin is given in Figure 7 according to the enhanced-sliding experiment. The grounding line is situated 850 km from Dome Fuji. The maximum surface gradient occurs 50 km upstream of this point, from where the surface becomes concave in the downstream direction. The maximum basal shear stress does not coincide with the maximum surface slope, but is attained upstream of this point. The maximum value of the longitudinal stress deviator
![]() is reached at the grounding line. The longitudinal stress deviator is higher than the shear stress everywhere in this downstream region. High values of
is reached at the grounding line. The longitudinal stress deviator is higher than the shear stress everywhere in this downstream region. High values of
![]() do not occur at the surface but halfway up the ice sheet, due to the thermomechanical coupling of the velocity field to the temperature field: since most shear deformation is situated near the base of the ice sheet, one can assume that in the upper 80% of an ice column
do not occur at the surface but halfway up the ice sheet, due to the thermomechanical coupling of the velocity field to the temperature field: since most shear deformation is situated near the base of the ice sheet, one can assume that in the upper 80% of an ice column
![]() so that the flow law in this area reduces to
so that the flow law in this area reduces to
![]() . Due to the temperature dependence, A(T*) varies a few orders of magnitude with depth in the downstream area of an ice mass and is lowest there where the ice is coldest, i.e. where advection of cold ice occurs. Hence,
. Due to the temperature dependence, A(T*) varies a few orders of magnitude with depth in the downstream area of an ice mass and is lowest there where the ice is coldest, i.e. where advection of cold ice occurs. Hence,
![]() reaches a maximum value where A(T*) reaches a minimum. The variation of the longitudinal stress deviator
reaches a maximum value where A(T*) reaches a minimum. The variation of the longitudinal stress deviator
![]() with depth is much larger than previous studies show. Some authors have assumed that
with depth is much larger than previous studies show. Some authors have assumed that
![]() could be replaced by its vertical mean (e.g. Reference Alley and WhillansAlley and Whillans, 1984; Reference Van der Veen, Van der Veen and OerlemansVan der Veen, 1987). The main reason for the significant variation in
could be replaced by its vertical mean (e.g. Reference Alley and WhillansAlley and Whillans, 1984; Reference Van der Veen, Van der Veen and OerlemansVan der Veen, 1987). The main reason for the significant variation in
![]() is the thermomechanical coupling. Experiments with a constant value for A(T*) show that
is the thermomechanical coupling. Experiments with a constant value for A(T*) show that
![]() is more or less constant in the vertical but increases near the surface where it reaches a maximum.
is more or less constant in the vertical but increases near the surface where it reaches a maximum.

Fig. 7. Basal shear shear stress, longitudinal stress deviator, vertical resistive stress and horizontal velocity in the downstream area of Shirase drainage basin according to the enhanced-sliding experiment. The vertical dotted line shows the position of the grounding line.
Vertical resistive stresses become important upstream of the grounding line, though they are still two orders of magnitude smaller than both the longitudinal stress deviator and the shear stress.
Compared to the SIA model, ice thicknesses computed with the ICE2D model are approximately 7% smaller in the downstream area, and horizontal velocities are 7% higher. However, differences in driving stress are of the order of 20%.
Discussion and Conclusions
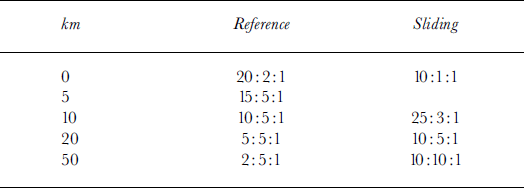
Can we capture grounding-line ice dynamics with the model, and if so at what resolution does the calculation of the total stress field become important? An estimate of the relative importance of all stresses near the grounding line can be obtained by integrating Equation (4) over the vertical so that it takes the form σxz(b) = τd + D, where D includes the effect of the longitudinal stress gradient and the vertical resistive stress (Reference Van der VeenVan der Veen, 1985). The relative magnitude of the stress components
![]() : τd: D is listed in Table 1 for both the standard and the enhanced sliding experiment and emphasizes the importance of all stress components over a horizontal distance of several times the ice thickness upstream from the grounding line. This distance is at least 20 km for the standard experiment and >50km for the enhanced-shding experiment (see also Figs 6 and 7). So, at least at a grid size of 5 km for moderate sliding and at a grid size of 10 km for pronounced sliding, the total stress field should be taken into account. The transition zone can be defined as the area where the flow deviates from the ice-sheet and the ice-shelf flow. Upstream, this zone extends to the point where the velocity and its gradient start to increase. Downstream, this zone ends where the gradients decrease (Reference Herterich, Van der Veen and OerlemansHertench, 1987). This zone extends approximately 50 km upstream from the grounding line in the standard experiment, and is smoothed out to a larger extent in the enhanced-sliding experiment (Fig. 8).
: τd: D is listed in Table 1 for both the standard and the enhanced sliding experiment and emphasizes the importance of all stress components over a horizontal distance of several times the ice thickness upstream from the grounding line. This distance is at least 20 km for the standard experiment and >50km for the enhanced-shding experiment (see also Figs 6 and 7). So, at least at a grid size of 5 km for moderate sliding and at a grid size of 10 km for pronounced sliding, the total stress field should be taken into account. The transition zone can be defined as the area where the flow deviates from the ice-sheet and the ice-shelf flow. Upstream, this zone extends to the point where the velocity and its gradient start to increase. Downstream, this zone ends where the gradients decrease (Reference Herterich, Van der Veen and OerlemansHertench, 1987). This zone extends approximately 50 km upstream from the grounding line in the standard experiment, and is smoothed out to a larger extent in the enhanced-sliding experiment (Fig. 8).
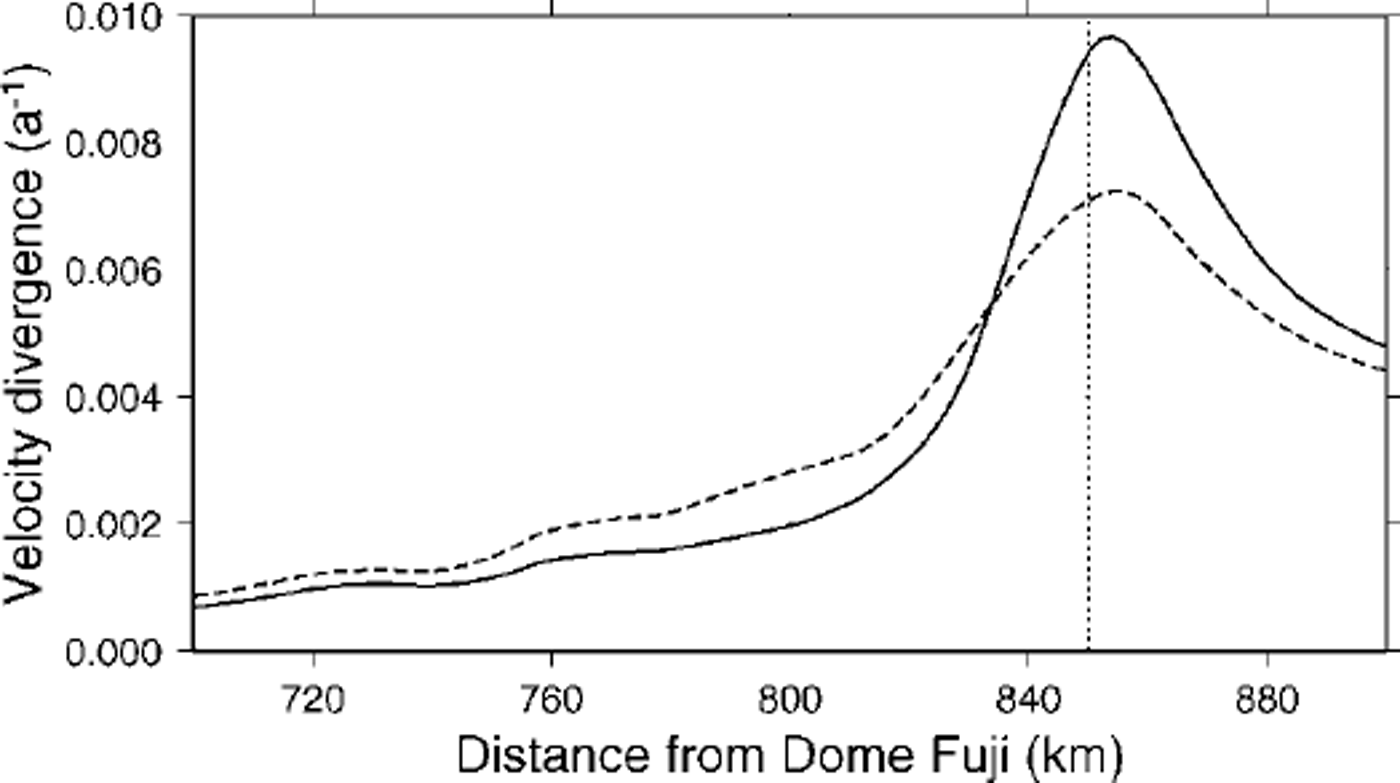
Fig. 8. Divergence of the vertical mean horizontal velocity
![]() /∂x in the downstream area according to the standard experiment (solid line) and the enhanced-sliding experiment (dashed line). The vertical dotted line shows the position of the grounding line.
/∂x in the downstream area according to the standard experiment (solid line) and the enhanced-sliding experiment (dashed line). The vertical dotted line shows the position of the grounding line.
Table 1. Relative magnitude
![]() : τd: D at several distances upstream from the grounding line for the reference and the enhanced-sliding experiment. See text for more details
: τd: D at several distances upstream from the grounding line for the reference and the enhanced-sliding experiment. See text for more details
Compared to satellite observations on Shirase Glacier the velocities obtained with the model in the ice-stream area, even for the enhanced-sliding case, are much lower than those observed at present, which are of the order of 1500–2000 ma–1. Using the above-described model parameters, it is possible to simulate the present surface profile and observed velocities of most of the ice sheet in the Shirase drainage area, except for the downstream area. Furthermore, the tuning parameter m is considered low compared to other modelling studies of the Antarctic ice sheet (e.g. Reference HuybrechtsHuybrechts, 1992), and is supposed to be of the order of 5.0–10.0. Applying those values to Shirase drainage basin results in a steady-state ice sheet which is not in accordance with the present observations, even in the stream area. This may imply that (i) the ice properties in this area differ from those in other areas of the East Antarctic ice sheet, (ii) the model is not capable of simulating the complex flow pattern in this area, even though the divergence-convergence of the ice flow is taken into account, or (hi) the present ice sheet in Shirase drainage basin is not in steady state. The last explanation is plausible, as field observations in the downstream area of Shirase drainage basin report considerable thinning rates of the ice-sheet surface, up to lma–1 (e.g. Reference NaruseNaruse, 1979). A mechanism suggested by Reference PattynPattyn (1996) explains a large thinning rate and gives rise to high velocities in the stream area. The relatively low value of m’ is explained by the fact that Shirase Glacier experiences a considerable lateral drag in the stream area.
Nevertheless, the purpose of these experiments is to evaluate the impact of model resolution on ice dynamics near the grounding line and to validate the importance of all stress components at higher model resolutions, for which a detailed topographic dataset is necessary. The analysis demonstrates that at a low resolution (i.e. grid size of 20–40 km) the grounding zone is smaller than the grid size. At higher resolutions, the force balance demonstrates that the size of the grounding zone is larger than the grid size, and hence all stress components should be considered. From the geometry of the ice sheet it is apparent that at higher resolutions (5 km grid size) the surface profile near the grounding line flattens (concavity), which demonstrates the transition between the ice-sheet and the ice-shelf flow.
The major difference between the ICE2D and the SIA model-upstream of the grounding zonε―can be ascribed to the use of the basal shear stress in the basal sliding law. In the ICE2D model the basal shear stress deviates up to 20% from the driving stress in the upstream area, which influences the basal sliding considerably.
Finally, the experiments demonstrate that *>xx varies considerably with depth in the downstream area due to the thermomechanical coupling of the ice flow. Future experiments will focus on the transient state of ice sheets and ice streams with the ICE2D model, as the response of the grounding-line dynamics to changing environmental conditions might be different at high resolutions compared to the SIA model.
Acknowledgements
This paper forms a contribution to the Belgian Research Programme on the Antarctic (Federal Office for Scientific, Technical and Cultural Affairs), contract A4/DD/E03. During part of this research the author was supported by the Japan Society for the Promotion of Science.


