


Introduction
Assessing the danger of skier- or, in general, human-triggered avalanches is the key factor in modern avalanche forecasting. Statistics for 10 years (1987/88 to 1996/97) from the Swiss Alps show that 85% of avalanche victims are recreationists who triggered the fatal dry-snow slab avalanche themselves (Schweizer and Lutschg, in press). Conditions are similar in many other countries (e.g. in Canada the percentage of recreational accidents is slightly higher; Reference Jamieson and GeldsetzerJamieson and Geldsetzer, 1996).
Reference FohnFohn (1987b) introduced the skier’s load into the stability index. The skier was modelled as a line load on a semi-infinite elastic half-space. Reference JamiesonJamieson (1995) further improved the skier stability index and confirmed its usefulness in operational stability evaluation. To verify the simple concept of the skier stability index, Reference Schweizer, Camponovo, Fierz, Fohn and SivardiereSchweizer and others (1995a, Reference Schweizer, Schneebeli, Fierz and Fohnb) started to measure the skier’s effect on the snow cover with load cells. These measurements confirmed the strong decrease of the skier stress in the snow cover, revealed the dynamics of the impact and showed the importance of the snow-cover layering (Reference Camponovo and SchweizerCamponovo and Schweizer, 1997). The latter result had been predicted by finite-element (FE) modelling (Reference SchweizerSchweizer, 1993).
The above results suggest that a skier can induce a local failure in the weak layer or at the interface below the potential slab, provided the weak layer or interface is not too far below the surface and is really weak, i.e. shear strength typically < lkPa (Reference Fohn and ArmstrongFohn, 1993; Reference JamiesonJamieson, 1995). In fact, the well-known “whumpf” sound is the result of a local failure in a weak layer induced by a skier, followed by fracture propagation. However, whether widespread fracture occurs, so that the slab is released, depends among other things on the size of the area that failed, and the slab properties. There is a minimal area necessary for the fracture to propagate. Model calculations based on the principles of fracture mechanics (Reference McClungMcClung, 1987; Reference Bader and SalmBader and Salm, 1990) suggest that the area that has failed, the so-called deficit zone, should be of the order of 0.1–10 m, with the shorter lengths being critical during rapid loading by a skier (Reference McClung and SchweizerMcClung and Schweizer, 1999). However, the area of local failure induced by a skier is not known. Obviously, the area of influence in the snow cover due to a skier must be small and depends on depth. Reference SchweizerSchweizer (1999) supposed the area might be typically <1 m2. The spatial extent of the skier’s impact on the snow cover is crucial to understanding snow slab release and the size effect associated with it.
Determining the zone of influence of a skier in the snow cover requires knowledge of the distribution of stress in snow under a loaded area. Reference AbeleAbele (1990) summarized the results relevant for vehicle mobility on snow. He considered the problem difficult to solve experimentally, and theoretical approaches to it to be unsatisfactory. Nevertheless, in the following it is shown how the measurement technique of Reference Schweizer, Camponovo, Fierz, Fohn and SivardiereSchweizer and others (1995a, Reference Schweizer, Schneebeli, Fierz and Fohnb) can be used to derive an estimate of the stress distribution below a skier.
Methods
Experimental Set-Up
Load cells with an area of 0.5 m × 0.5 m, 0.05 m thick, equipped with four cantilever beam force sensors (three for the normal, one for the shear force), were put on the level surface of the snow cover before a snowfall in the SLF study plot at Weissfluhjoch, Switzerland (2540 m a.s.L). After snowfall the load cells were loaded by a skier with increasing loads. The loading procedure follows the loading steps applied for the rutschblock stability test (Reference FohnFohn, 1987a): standing atop, weighting and jumping. Data were acquired in the field at a rate of 1–2 kHz with a data-acquisition unit connected to a laptop computer. During the different loading steps ski penetration was documented. For each series of experiments a snow-cover profile was taken. Since we were mainly interested in the response of the snow cover to skier loading, the measurements were performed on flat terrain, and not on slopes which would be more realistic in view of the slab-release problem but experimentally more difficult.
The experiments on skier stress in general started in 1992/93. We usually loaded the snow cover right above the buried load cells in order to study the dependence of the skier stress on depth, snow layering, etc. Most of these results can be found in Reference Schweizer, Camponovo, Fierz, Fohn and SivardiereSchweizer and others (1995a, Reference Schweizer, Schneebeli, Fierz and Fohnb; Gamponovo and Schweizer, 1997). In winter 1994/95 we first measured the spatial distribution of the skier stress. This was done by loading the snow cover, not right above the load cell, but shifted a certain distance to the side. In order to obtain a more detailed pattern of the stress distribution at a certain depth in an area parallel to the snow surface, the data acquisition was improved so that data from two load cells could be acquired simultaneously. Accordingly, we started to set two load cells 10 cm apart (Fig. 1), loaded them alternately and acquired the forces measured on both cells simultaneously The cells were loaded in the direction parallel (x axis) and perpendicular (y axis) to the axis connecting the two load cells. Consequently a longitudinal (a;) and a transversal (y) profile of the stress distribution were obtained. In addition, we occasionally performed experiments in which we loaded an isolated snow block to limit the stress transfer in the snow cover. In another set of experiments, we measured the effect of two persons walking one behind the other over the load cell. Both types of experiment gave additional insight into how far the stress below a skier is distributed to the sides. Table 1 lists the experiments performed to study the spatial effect, the results of which are presented below. The details of all experiments in winters 1995/96 to 1997/98 are compiled in four SLF internal reports (Camponovo and Schweizer, unpublished a, b; Schweizer and Camponovo, unpublished a, b).

Fig. 1. Experimental set-up showing two load cells 10 cm apart. Photo taken during recovery from the snowPack, 5 days after loading experiments.
Table 1. Experiments performed and characteristics of overlaying snow layer (slab)

To determine the area of influence, for a given depth, it is assumed that there is a certain stress limit. In the case of avalanche release, that stress value would be the locally averaged strength of the weak layer or interface. Accordingly the area of influence would be the area within which the stress is larger than the strength, and would consequently depend on the difference between the temporarily varying peak stress and the strength. This stress value is also called significant stress (stress associated with structural damage) and represents the average stress over a small area including the point where the stress peak is found (Reference Boresi, Schmidt and SidebottomBoresi and others, 1993). However, Reference Boresi, Schmidt and SidebottomBoresi and others (1993) do not specify how to determine either the significant stress or the small area. In vibration analysis the half-power bandwidth is used to characterize a peak (Reference Mahrenholtz, Bachmann and BachmannMahrenholtz and Bachmann, 1995). In pulse analysis the pulse width, or duration (time domain), is determined in the same way (Reference WalkerWalker, 1988). This width is the distance between the two points where the stress is 1/^2 (= 0.707) of the peak value. A stress peak due to an impact can be approximated by a Gaussian distribution curve (Reference KneubuhlKneubühl, 1975). In that case, using the above definition to determine the peak width, the average (or significant) stress over this width is about 90% of the peak stress.
Accordingly, we determined the peak width by fitting a Gaussian peak function to our experimental data. The fit had to be symmetric around x = 0 and y = 0, respectively. The transversal width w (y direction) and longitudinal width L (x direction), in the following called length, were determined as the distance between the two points where the stress drops below 70.7% of the peak stress.
In our analysis the effective depth zeff, i.e. the distance between the skis and the load cell, is always used. It is determined as the difference between two measured values: the initial depth z0 and the depth of ski penetration PS, the latter increasing with increasing loading step. Reference Jamieson and JohnstonJamieson and Johnston (1995) successfully introduced the effective depth into the evaluation of the skier stability index.
The load cell used is 0.5 m × 0.5 m in area and there is a peak stress distribution in the snow cover at a given depth just below the skier. Hence, the force we measure underestimates the peak stress, since the average force on the load-cell area of 0.25 m2 is measured. The closer the load cell is to the surface, the larger is this error. On the other hand, the snow cover is not infinitely deep. There is a rigid base as lower boundary condition: the soil surface. The load cell, which is suffer than the surrounding snow, has a similar effect, so the forces we measure are generally slightly larger than for an undisturbed snow cover. Again, this error is larger closer to the surface. The two type of errors may well cancel one another out.
Theoretical approach
The load distribution just below the skis of a skier is the top boundary condition of our problem and is of a complex nature. The so-called bottom-load distribution for skis is measured in biomechanical and industrial applications in order to study the forces acting on the skier’s joints, etc., and to improve ski design (Reference Lind and SandersLind and Sanders, 1997; Reference Nigg, van den Bogert, Read, Reinschmidt, Muller, Kornexl and RaschnerNigg and others, 1997). The most practical approximation of the skier load is to simply consider a uniform rectangular load of length L0 and width w» Based on the approximately known bottom load distribution (Reference Lind and SandersLind and Sanders, 1997), numerical values chosen are L0 = lm, w0 = 0.2 m, yielding an area A0 = 0.2 m2. Using a skier’s weight of Go = 700 N, the uniform stress at the surface is q = 3.5 kPa.
The stress distribution in the snow cover for a viscoelastic continuum such as snow is difficult to determine (Reference AbeleAbele, 1990). It is therefore necessary to focus on the dominant rheological characteristics of the material for the problem under consideration. In the case of vehicle mobility, Reference Shapiro, Johnson, Sturm and BlaisdellShapiro and others (1997) report that the pressure bulb (sharply defined zone of influence under the running gear) would have virtually constant properties and would maintain essentially vertical side walls that are aligned exactly with the lateral boundaries of the running gear. However, there is no reliable mathematical description of this postulate. One problem is the initial, irreversible snow compaction. For skiing we observe that the snow compaction is limited to the area below the skis, in accordance with the above results for vehicle mobility However, what we are interested in is not the pressure bulb described as above, but the more general stress distribution. Previous results (Reference Schweizer, Camponovo, Fierz, Fohn and SivardiereSchweizer and others, 1995a, Reference Schweizer, Schneebeli, Fierz and Fohnb) suggested that the amount of initial compaction should have a rather limited effect on the stress distribution except that the effective depth (depth between ski and load cell, or the weak layer/interface) is reduced. The skier’s impact while skiing is essentially a dynamic, continuous impulse, comparable to a short stress pulse (duration typically 0.03–0.3 s) (Reference Camponovo and SchweizerCamponovo and Schweizer, 1997). Accordingly, as a first approximation, the use of an elastic model is justified. In fact, previous measurements have shown, for example, that the answer for the weighting loading step is mainly elastic (Reference Camponovo and SchweizerCamponovo and Schweizer, 1997). Since detailed numerical FE modeling is beyond the scope of the present paper, we will compare our experimental results with the well-known solutions for an elastic infinite half-space based on the work by Boussinesq. In the following, we do not reproduce the equations for the load cases present. The reader is referred to Reference DasDas (1983) who gives a variety of solutions for various loads acting on the surface of a semi-infinite homogeneous elastic medium.
Results
Figure 2 summarizes the decrease of the normal stress below the centre of a surface load for different loading conditions. Numerical values as defined above have been used (A0 = 0.2 m2, q= 3.5 kPa). The stress decreases with increasing depth. In most cases the normal stress az is inversely proportional to the depth z. Figure 3 shows the width w of the area of influence for some of the loading cases shown in Figure 2. The width increases linearly with increasing depth. Accordingly, the area of influence A(z) increases roughly with the square of the depth z. Figures 4 and 5 illustrate the typical stress pattern in a homogeneous elastic medium, showing the strongly decreasing peak stress and the increasing area of influence with increasing depth.

Fig. 2. Normal stress az (normalized to surface stress q) vs depth z for various load models: vertical line load and strip load on the surface of a semi-infinite mass (two-dimensional, plane strain); and vertical point load, circular load and rectangular load (three-dimensional).

Fig. 3. Width of skier impact w (y direction) vs depth zfor the load models of Figure 2.

Fig. 4. Contour plot of normal stress (normalized to surface stress q) below a skier vs depth z in transversal section (y-z plane), perpendicular to axis of skis (x). Skier load modelled as strip load (w0 =0.2 m).

Fig. 5. Normal stress σz (normalized to surface value q) for different depth z (numbers indicate depth z in meters) in transversal section (y-z plane), perpendicular to axis of skis (x). Same load case as in Figure 4.
For reference, measurements have always been made directly above the centre of the load cell, and the decrease of the skier stress with depth in the snow cover can be shown for the three loading steps (Fig. 6). Power laws with negative exponents are fitted to the data. Exponents are –1.3, –1.3 and –1.1 for the loading steps standing, weighting and jumping, respectively. The skier stress approximately doubles from one loading step to the other for a given effective depth. Since the effective depth in reality decreases from loading step to loading step, the increase in skier stress is even more pronounced.

Fig. 6. Normal force FN (normalized to skier’s weight G0) measured in the snow cover vs depth z for the three loading steps. Solid lines are functions (∼ l/za) fitted to data. Dashed line is rectangular load model for reference.
Figure 7 shows the normal force for different loading positions measured simultaneously on two load cells 0.1m apart. The differences between the forces come from the differing loading positions: first on one load cell, then in between the two and finally on the other load cell.

Fig. 7. Normal forces due to jumping measured in the snow cover on two load cells 0.1m apart (zeff = 0.92 m). Lower curve for load cell 1, upper curve for load cell 2 The first four jumps are on load cell 1. Jump No. 5 is in between load cells J and 2 The last three jumps (6–8) are on load cell 2
Based on measurements of this kind the following results are derived for the stress distribution.
Loading positions aligned with the axis of the load cells (x direction) yield a longitudinal profile, i.e. the stress distribution in line with the skis (Fig. 8). The stress distribution is typically asymmetric, in line with known bottom-load distributions for skis. The transversal stress distribution (Fig. 9) is usually nearly symmetric but narrower than the longitudinal one. For the case considered in Figures 8 and 9, the width of the zone of skier influence is w = 0.80 m, and the length L = 0.93 m. As would be expected, the length is usually larger than the width, but the difference decreases with increasing depth.

Fig. 8. Normal force FN/FN(x = 0) (normalized to peak value) vs distance x for the weighting loading step in a longitudinal section below the skis. Solid curve is a Gaussian fit to data.

Fig. 9. Normal force FN/FN(y = 0) (normalized to peak value) vs distance y for the weighting loading step in a transversal section below the skis. Solid curve is a Gaussian fit to data.
Figure 10 shows the measurements for the width of the induced skier stress, for all three loading steps. The width of the zone of influence increases linearly with increasing depth. The increase is about the same for the three loading steps. The slope of the resulting regression is roughly in accordance with the simple analytical models. Only a few data points are available for the longitudinal width (length) of the skier’s stress peak (Fig. 11), and the results are not conclusive. The data for standing show a clear increase with increasing depth, whereas for weighting and jumping there is no increase. Accordingly, overall the increase of the zone-of-influence length with depth is statistically insignificant (p = 0.39). Determining an area of influence, based on the calculation of the area of an ellipse with half-width and length as axes of the ellipse, provides only partly conclusive results (Fig. 12). However, since the width of the zone of influence clearly increases with increasing depth, the area should increase as well (p = 0.03).

Fig. 10. Transversal width w of stress peak below skier vs effective depth zeff determined from all experiments (standing, weighting and jumping). Solid line shows linear fit to data. Dashed line is point load model (three-dimensional) for reference.
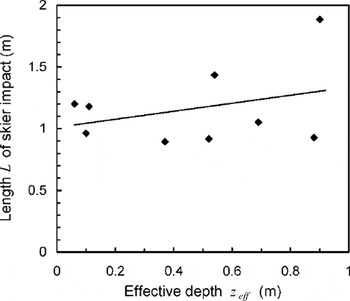
Fig. 11. Longitudinal width (length) L of stress peak below skier vs effective depth zeff determined from all experiments (standing, weighting and jumping). Solid line shows linear fit to data.

Fig. 12. Area of skier influence A (where σz(x,y) > σz (x=0,y = 0)/y/2) vs effective depth zeff determined from all experiments for which w and L are known. Solid line is quadratic fit to data. Dashed line shows point load model (three-dimensional) for reference.
The case of two skiers walking one right behind the other over a load cell is shown in Figure 13. The stress peaks of the two skiers are not cumulative and do not add up.

Fig. 13. Normal forces measured in the snow cover for the case when two skiers walk one behind the other over a load cell (forth and back) (zeff =0.26m).
Discussion
Despite the principal experimental difficulty of determining the stress distribution below a skier in the snow cover, the analysis of the data obtained is in accordance with theoretical predictions.
The measured skier stress strongly decreases with increasing depth, roughly proportional to 1/z. However, compared to the simple analytical model (e.g. the rectangular load model for static load), the skier stress measured for the standing loading step is too small by a factor of 2–5. This deviation increases with increasing depth, possibly because of viscoelastic effects, energy dissipation, or a larger zone of influence resulting in a stronger decrease of the stress with depth.
The weighting loading step, which causes stress peaks 2–3 times larger than the skier stress due to standing, comes closest to the model of the rectangular load. Typical forces during skiing are of the order of the loading steps weighting and sometimes evenjumping, depending on snow conditions. This might explain why the skier stability index, generally calculated with the line load model, which does not deviate very much from the rectangular load model except close to the surface (zeS < 0.2 m), usually yields reasonable results.
Longitudinal and transversal stress profiles below a skier are in accordance with what would be expected from the known bottom-load distributions for skis (Reference Lind and SandersLind and Sanders, 1997). The assumption of modelling the skier load at the snow surface as a rectangular loaded area proved to be reasonable. The stress distribution found in the snow cover suggests that the difference between length and width of the rectangle could even be smaller than our assumption of 1 and 0.2 m, respectively. It seems to be rather a factor of 2–3 between width and length, which would mean that even with skis the dynamic stress would mainly be concentrated below the ski boots.
The simple models suggest that the width of the area of influence should increase linearly with depth. The data clearly show the same behaviour. However, the width determined from the experimental data is about a factor of 1.5 larger than suggested by the simple models (e.g. the strip load model). Accordingly, the experimental results also suggest a larger area of influence (about a factor of 2–2.5) than the models.
Although there are only a few data on the area of influence, it is certain that the area of influence of a skier increases with increasing depth and is < lm2, except for large depth (z > 1 m), in which case the skier stress is very small, at the most about 10% of its value at the surface. For example, if the average slab thickness is 0.45 m (Schweizer and Lütschg, in press) and effective depth is zeff = 0.35, then the area of influence of a skier is about 0.3–0.5 m2. This is in accordance with the measurements showing that the stress peaks of two individual skiers walking right behind each other (Fig. 13) do not add up, i.e. the area of influence in the snow cover is not much larger than the area covered by the skier at the surface. Since the stress peaks of two individual skiers walking right behind each other (Fig. 13) are not cumulative, it is suggested that group triggering is due to the overall larger size of the area that failed, implying higher probability for coalescence and fracture propagation, rather than to locally higher stresses.
Our experiments were done in the flat and we measured the normal force. However, considering a skier on a slope, the additional shear stress is likely decisive in most cases for avalanche release. Assuming a simple line load model, the slope effect can be calculated. Whereas the shear stress on the slope is smaller than the normal stress in the flat, the area of influence of the shear stress due to a skier on a slope is of similar size, in fact slightly larger by a factor of 1.1–1.2 for a typical slope angle (30–45°) and weak layer depth (h = 0.5 m).
Conclusions
Whereas the stress concentration in the snow pack decreases with increasing depth, the area of influence of a skier increases. It was found to be relatively small (0.3–0.5 m2) for depths relevant for skier triggering. Experiments were performed with a soft surface layer present. For hard slabs the zone of influence should be larger.
Stresses in the snow cover below skiers who walk one behind the other are not cumulative.
Independently of the above data, Reference McClung and SchweizerMcClung and Schweizer (1999) estimated the critical size for self-propagating fractures to be 0.1–1 m for the case of rapid loading by a skier. The experimental data presented here suggest the same order of magnitude for the stress distribution below a skier. Based on that, and supported by the fact that the analysis of 10 years of Swiss avalanche accident data (Schweizer and Lutschg, in press) has shown that about 90% of skier-triggered avalanches are triggered by the first skier entering the slope, we conclude that the critical area for self-propagating fractures is of the order of a few 0.1 m2, and therefore skiers frequently induce the local failure within the weak layer or at the weak interface that is large enough to drive a self-propagating fracture (provided the slab properties favour fracture propagation) which eventually might under certain conditions lead to slab release. The study supports the hypothesis that in most cases (provided a really weak layer exists, not too deep in the snowpack) skiers do not have to hit a pre-existing deficit zone, but simply damage or fail a large enough area that has the potential to drive brittle fracture propagation, eventually followed by slab release. However, whether conditions for fracture propagation are really present depends on other parameters, such as the slab properties, in particular the difference in stiffness between the two layers adjacent to the fracture. The larger the difference in stiffness, the smaller is the interface fracture energy, i.e. propagation becomes more likely (Reference Wei, Adamson and DempseyWei and others, 1996). Hence, due to insufficient fracture propagation, and sometimes due to sufficient peripheral strength, a local failure induced by a skier is quite often, fortunately, not followed by slab release.


