


Introduction
The first aim of this paper is to introduce a new glacier inventory of the Indian part of Kashmir, which was undertaken to fill the final gap in the inventory of the Himalaya and Karakoram (Fig. 1; H-K hereafter). Yet knowledge of the present state of H-K glaciers remains sparse, and their future evolution cannot be projected with real confidence. With a single exception (Reference Gergan, Dobhal and KaushikGergan and others, 1999), there are, for example, no measurements of ice thickness on H-K glaciers that are suitable for estimating mean glacier thickness, and there have been few detailed studies of glacier response to expected changes in climatic forcing. These subjects are of some urgency and importance, especially in the light of recent controversy. The second aim, therefore, is to explore what can be said objectively about the evolving state of H-K glaciers, relying on information available now.
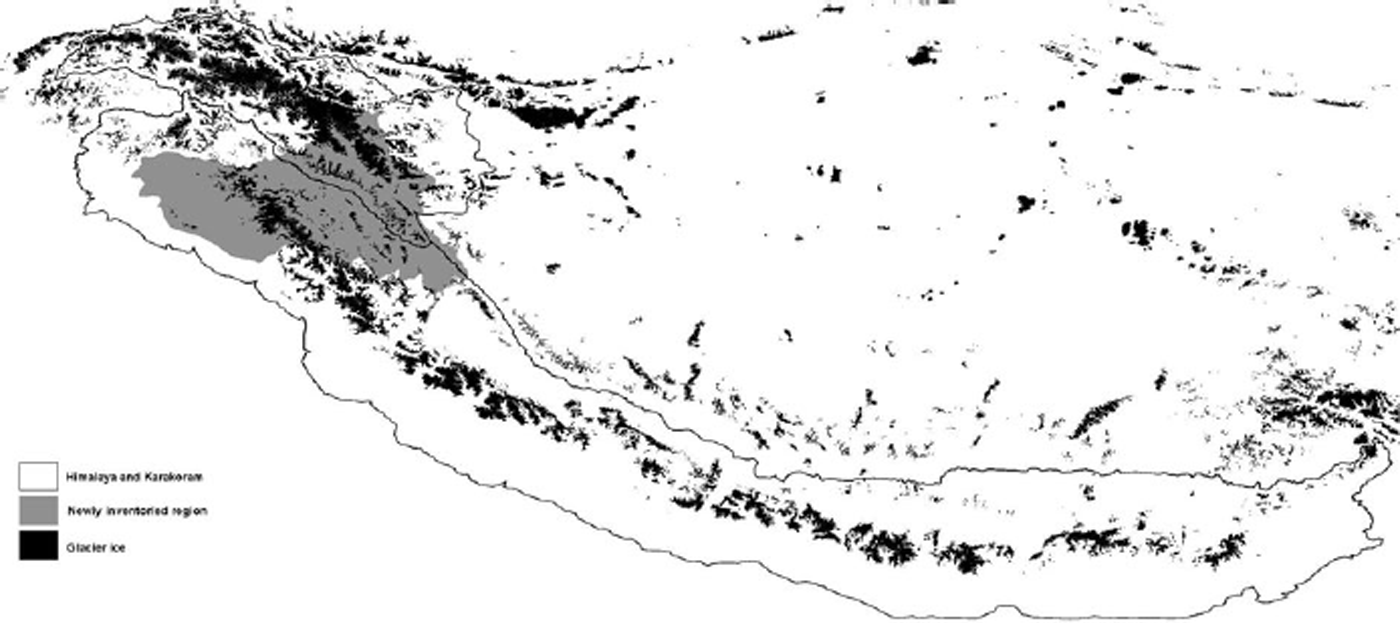
Fig. 1. The Himalaya and Karakoram regions, with glaciers in black and the newly inventoried Indian part of Kashmir shaded grey. The Himalaya and (in the northwest) the Karakoram are separated along the main trunk of the Indus River.
Reference Cogley, Kargel, Kaser and van der VeenCogley and others (2010) pointed out the incorrectness of a widely publicized statement (Reference Cruz, Parry, Canziani, Palutikof, van der Linden and HansonCruz and others, 2007) that Himalayan glaciers are very likely to disappear by 2035. This correction was based on a crude assessment of recent mass balance and on generalized understanding of climatic forcing. Reference Cogley, Singh, Singh and HaritashyaCogley (in press) presented a more detailed compilation of measurements of H-K mass balance, and extrapolated to 2035 on two naive assumptions (Fig. 2): that the recent average mass-balance rate (–364 kgm–2 a–1 over 1975–2008) would be sustained, and that the recent trend of accelerating mass loss (–24.0 kgm–2 a–2 over 1985–2008) would be sustained. He estimated that water-equivalent thinning of H-K glaciers between 2010 and 2035 would be ~9m or ~28m respectively under the two assumptions. Mean glacier thickness was estimated at 86 m for the Himalaya and 172 m for the Karakoram, but both the estimated thinning and the mean thicknesses were unsatisfactory because of the incompleteness of the glacier inventory.
Given the logistical, financial, political and even military obstacles to data collection, large increases in the quantity of information on H-K mass balance are unlikely. To improve understanding, the first priority appeared to be completion of the regional glacier inventory, and the second priority appeared to be a simple analytical tool for making the best use of the inventory. These are the subjects of the next two sections, following which the results of analysis are presented. The limitations of the analysis are discussed in the concluding section.
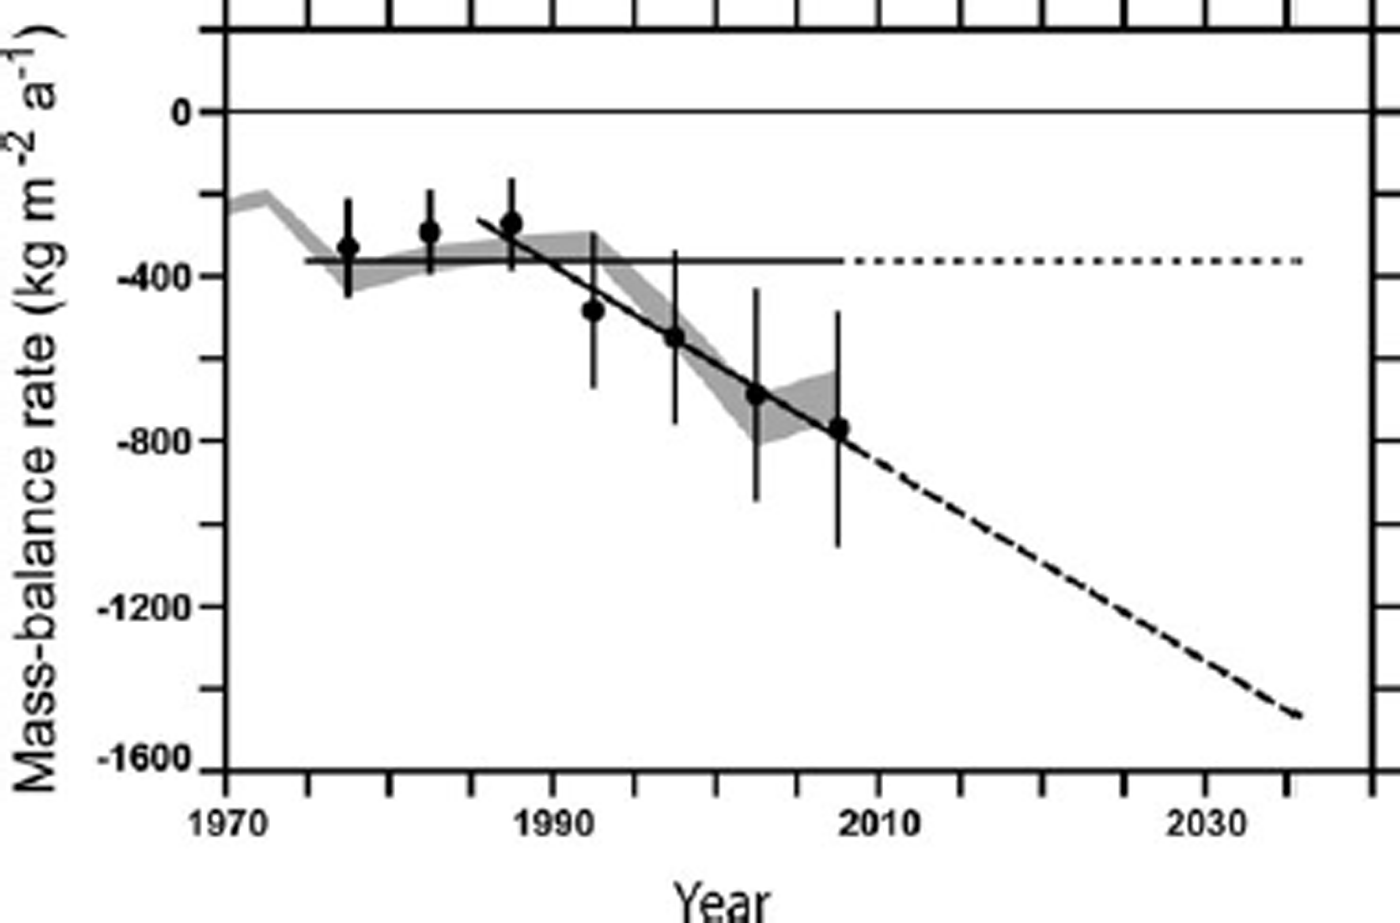
Fig. 2. A summary of the evolution of H-K mass balance (Reference Cogley, Singh, Singh and HaritashyaCogley, in press). Grey confidence envelope: worldwide average mass-balance rate (Reference CogleyCogley, 2009a). Dots with error bars: pentadal H-K averages extracted from the data of Reference CogleyCogley (2009a). Horizontal straight line: average H-K mass-balance rate over 1975–2008, dotted where extrapolated to the future. Sloping straight line: trend of H-K mass-balance rate over 1985–2008, dashed in the future. Reprinted by permission.
Glacier Inventory
An early summary of knowledge of H-K glaciers was provided by von Wissmann (1959). The first inventories, covering single basins or mountain massifs, included those of Reference MüllerMüller (1980) and Reference VohraVohra (1980). Work on the Chinese Glacier Inventory (Reference Shi, Liu and KangShi and others, 2009) began at about the same time and was completed in 2002. A partial inventory by the Geological Survey of India (GSI; Reference KaulKaul, 1999) was augmented by Reference Raina and SrivastavaRaina and Srivastava (2008), although the number of glaciers documented, 1769, is still only a small proportion of the Indian total (found to be 8481 in the present work). In recent years, the International Centre for Integrated Mountain Development (ICIMOD), Kathmandu, Nepal, has produced several regional inventories covering all of Pakistan, Nepal and Bhutan and most of India; these inventories, a bibliography of which is given by Reference CogleyCogley (2008), were obtained on CD-ROM (infomenris@icimod.org).
The quantity of information in these inventories is variable, and in some cases so is the quality. The partial GSI inventory of India is not accompanied by digital glacier outlines. The Chinese and ICIMOD glacier outlines are sometimes poorly geolocated. Positional errors of ~1 km are not uncommon, and in the worst case, Himachal Pradesh, the glaciers are 3–10km (sic) away from their true locations.
As part of an expansion of the World Glacier Inventory, Reference CogleyCogley (2009b) merged and collated the inventory information described above, organizing all of the data into a uniform format, eliminating duplicates and correcting errors where possible. In nearly all cases, the ICIMOD data were preferred to the GSI data because of their accompanying glacier outlines. Drainage basin codes were reorganized to eliminate cross-border inconsistencies, and glacier outlines were assigned the same codes as their corresponding inventory records. There remained, however, a significant gap in coverage in the Indian-administered part of Kashmir, where only the GSI inventory of the Jhelum Basin was available. In addition, several ICIMOD glacier outlines had been truncated at state or national borders.
These truncated glaciers have been re-digitized, and the gap in Indian Kashmir has been filled entirely, as part of the work reported here. The new inventory of Indian Kashmir, which describes 3526 glaciers covering 9584 km2, will be documented in detail elsewhere.
Methods for Analysis of Glacier Evolution
The two assumptions of Figure 2, constant-rate and constant-trend, are used here as mass-balance projections. To track the total mass, we will couple the mass balance, estimated from observations and projected, to measurements of the area and estimates of the mean thickness of each of the glaciers in the new inventory.
Many authors (e.g. Reference Chen and OhmuraChen and Ohmura, 1990; Reference Bahr, Meier and PeckhamBahr and others, 1997; Reference MacheretMacheret, 2006) have noted that collections of measured mean thicknesses are described well by a power-law dependence of mean thickness H on glacier area S:
from which it follows, setting γ = 1+β, that glacier volume is
Equation (1) can be reversed. Suppose, for example, that a known mean thickness H changes by a known amount ΔH:
We can write
for the new area S * implied by the thickness change and the parameter set (c, β).
If ΔH < – H, the glacier disappears. The new thickness would be negative, so we set it to zero and reduce the number of glaciers.
We obtain ΔH from the cumulative mass balance as
where ρ = 900 kgm–3 is the assumed glacier density and ΔM is obtained by summing the annual balance rates of Figure 2. There is not enough information to make regional distinctions, so all glaciers are assumed to have the same balance.
The first computational step is to use Equations (1–5) to synchronize the glacier inventory records to a convenient reference epoch, 1985, which lies roughly at the centre of the 1968–2003 span of the inventory. The raw, unsynchronized inventory contains 20 812 glaciers with a total extent of 43 178km2. At the reference epoch, the estimated total extent was between 44 677 and 47 644 km2 depending on the set of scaling parameters.
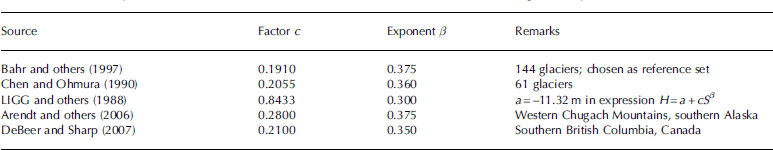
We do not have accurate estimates of either the scaling parameters or the mass balance. Reference Bahr, Meier and PeckhamBahr and others (1997) showed that mean thickness ought to be proportional to the 3/8 power of area, that is, that β ~0.375. The measurements are in good agreement with this estimate, although the exponent is sometimes slightly less than 0.375. The factor c in Equation (1) is more uncertain and is responsible for much of the variation in estimated thickness. For example, Reference ArendtArendt and others (2006) obtain c = 0.280 while Reference Bahr, Meier and PeckhamBahr and others (1997) give c = 0.191 (for S in m2), so Arendt thicknesses are half as large again as Bahr thicknesses.
Because the samples from which they are derived are small, it is not realistic simply to adopt the standard errors of the estimated parameters for estimating uncertainty. Instead, we use several different published parameter sets (Table 1), adopting the Bahr set as a reference set for convenience. It is not suggested that glaciers in, for example, western North America have any particular merit as estimators of H-K thicknesses. The different parameter sets simply illustrate a range of outcomes which probably cannot be ruled out.
Table 1. Published sets of thickness–area scaling parameters, yielding mean thickness in m given area in m2. The parameter set of LIGG and others (1988), cited by all ICIMOD inventories, derives from measurements on 15 Tien Shan glaciers by Reference Su, Ding and LiuSu and others (1984)
The glaciological and geodetic measurements of mass balance are sparse and are themselves uncertain. The pentadal averages in Figure 2 (Reference CogleyCogley, 2009a) are taken from a calculation intended to estimate the worldwide average mass balance by interpolating to the centres of glacierized 1˚ ×1˚ cells. It relies on measurements on distant glaciers, discounted by a distance decay function, to fill gaps in the local record. The averages are based on area-weighted sums of those interpolated estimates that lie within the boundary of the H-K region.
The assumed projections of mass balance are conjectural. However, it does not seem possible to advance beyond them without incorporating detailed projections of the climatic forcing, which is outside the present scope.
Results
Figure 3 shows glacier numbers. The two panels represent the two naive assumptions, constant-rate and constant-trend. Each panel contains five projections, the range of which illustrates the uncertainty due to the thickness–area scaling parameters. Each projection consists of three points: at the reference epoch, 1985; at the present year, 2010; and at 2035.
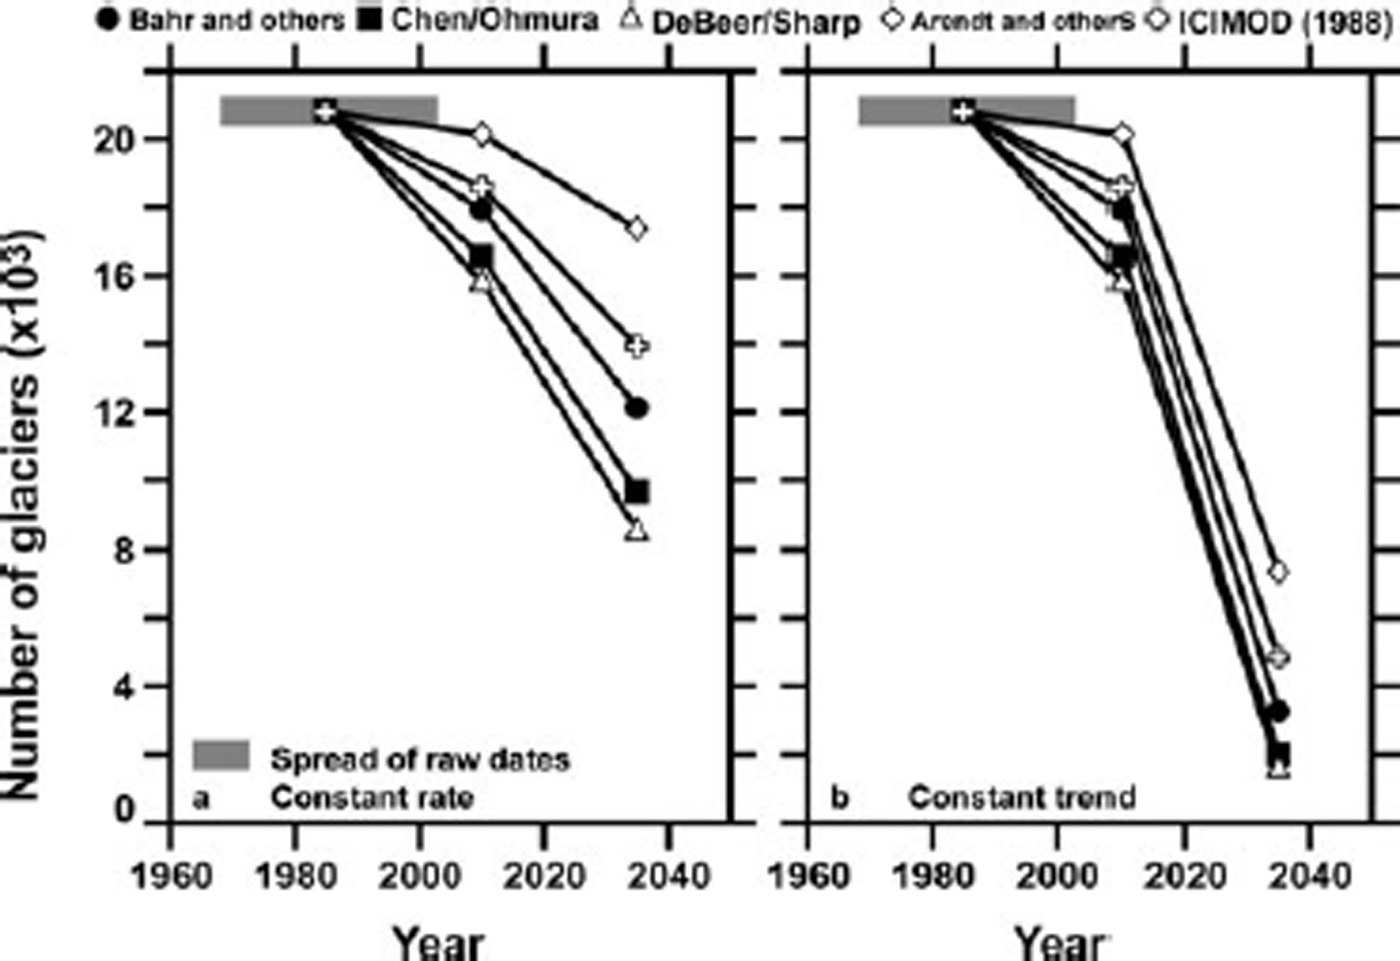
Fig. 3. Evolution of the number of glaciers in the H-K region for several choices of thickness–area scaling parameters: (a) under the constant-rate assumption of Figure 2; (b) under the constant-trend assumption of Figure 2. The evolution for 1985–2010, based on interpolated mass-balance measurements, is the same in both panels. Horizontal grey bar: spread of glacier inventory dates.
Between 1985 and 2010, depending on the chosen parameter set, a few hundred to a few thousand of the original collection of ~21 000 glaciers may have disappeared. Under the constant-rate assumption, glaciers continue to disappear between 2010 and 2035, but more rapidly. The number of disappearances is quite sensitive to the parameters, varying from about one-sixth to more than one-half of the 2010 number. Under the constant-trend assumption, the number of glaciers diminishes to 1500–7500, or between one-third and one-tenth of the 2010 number.
Changes in glacierized area (not shown) exhibit a growing relative dominance of larger glaciers, although glacier fragmentation, which will tend to offset this growth, is not modelled in the present simple analysis. In 1985, 44% of total extent was accounted for by glaciers smaller than 8km2. In 2010 this becomes 36% and by 2035 it becomes 30% (constant-rate) or 19% (constant-trend). The range-wide shrinkage rate becomes less negative as the relative importance of smaller glaciers, which shrink more rapidly, decreases. With the reference scaling parameters and the assumption of constant mass-balance rate, the shrinkage rate of –1.7% a–1 for 1985–2010 becomes only –1.2% a–1 for 2010–35. Under the constant-trend assumption for mass balance, the faster removal of mass more than compensates for the changing distribution of glacier sizes, and the 2010–35 shrinkage rate is –2.5% a–1.
Figure 4 shows the changing total mass of H-K glaciers. Different sets of scaling parameters lead to very different estimates of total mass, varying by a factor of two. Even the two most often cited parameter sets, those of Reference Bahr, Meier and PeckhamBahr and others (1997) and Reference Chen and OhmuraChen and Ohmura (1990), differ by about 20%. Clearly, uncertainty in the parameters is a significant impediment.
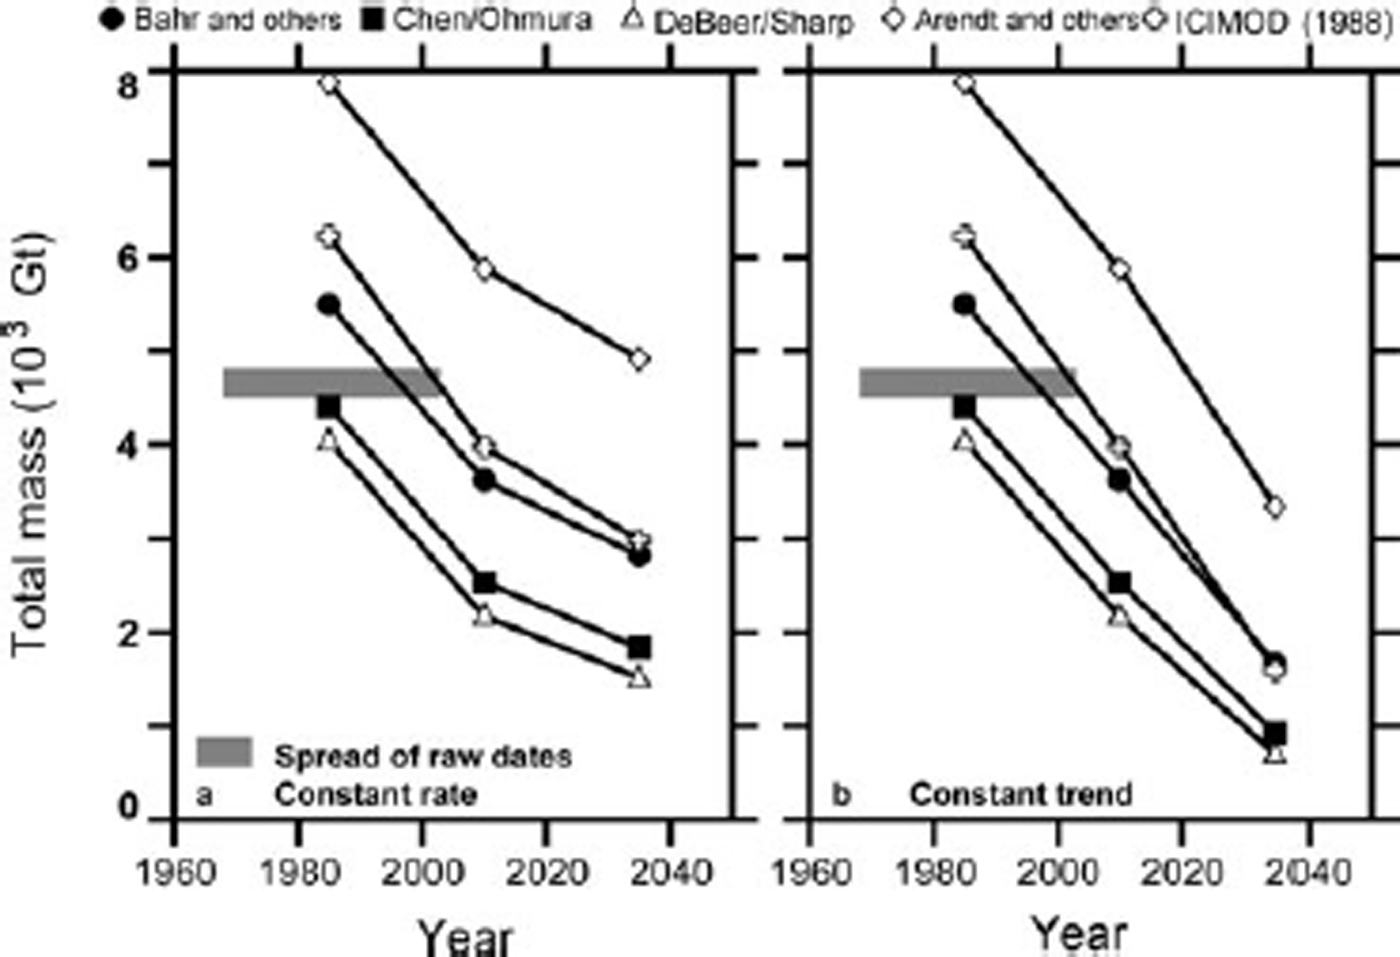
Fig. 4. Evolution of total H-K glacier mass for several choices of thickness–area scaling parameters: (a) constant-rate mass-balance assumption for 2010–35; (b) constant-trend assumption for 2010–35. Horizontal grey bar: mass obtained by scaling from the unsynchronized glacier inventory.
A reasonable work-around for the present purpose, however, is to divide each mass estimate by the corresponding estimate at the reference epoch (Fig. 5). At the rate of mass loss estimated from observations for 1985–2010, the proportion of 1985 mass that may have disappeared already lies between one-quarter and nearly one-half. If that rate is sustained (Fig. 5a), the mass remaining in 2035 will be between one- and two-thirds of the 1985 mass. The deceleration of total mass loss is explained by the reduced rate of shrinkage and disappearance of glaciers. If mass loss accelerates (Fig. 5b), the total mass remaining in 2035 is likely to be between one- and two-fifths of the 1985 mass. Again, faster mass loss compensates for change in the glacier size distribution, and the total mass decreases almost linearly over the 50 years.
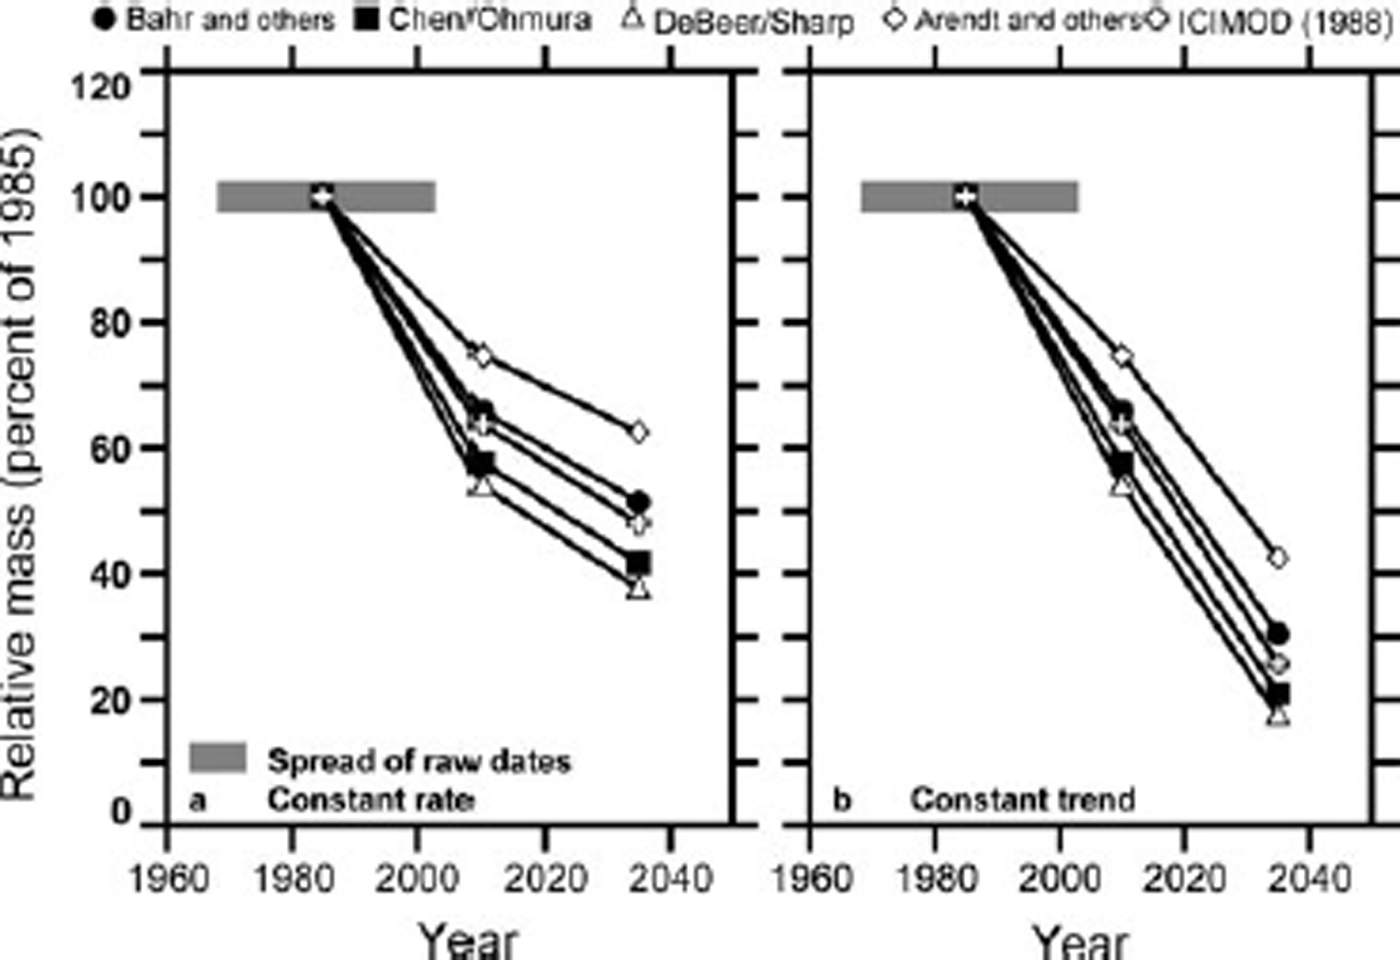
Fig. 5. As Figure 4, but each time series is divided by its estimated mass in 1985.
Discussion and Conclusion
Several little-known factors limit confidence in the projections of the previous section. First, thick debris cover is common in the region and is believed to retard melting by shielding and insulating glacier surfaces (e.g. Reference Kayastha, Takeuchi, Nakawo and AgetaKayastha and others, 2000). However, some field evidence suggests that melting may be substantial beneath ponds (Reference Sakai, Takeuchi, Fujita and NakawoSakai and others, 2000) and on exposed ice cliffs on debris-covered glacier tongues, and, as noted by Reference HewittHewitt (2005), thin, melt-enhancing debris covers are also often extensive. In the present analysis, Figure 2 is based on measurements from one glacierized region (Lahaul-Spiti; Reference Berthier, Arnaud, Kumar, Ahmad, Wagnon and ChevallierBerthier and others, 2007) and 17 single H-K glaciers. Lahaul-Spiti contains a substantial number of debris-covered glaciers, and at least three of the measured single glaciers, Siachen, Bara Shigri and Chhota Shigri, are also debris-covered. It is therefore not obvious that the present analysis overestimates mass loss by under-representing debris-covered glaciers.
The ‘Karakoram anomaly’ of Reference HewittHewitt (2005) remains controversial. It was recognized by diverse and persuasive circumstantial evidence, including glacier thickening and terminus advance, an unusual incidence of glacier surges, reduced glacier meltwater runoff, and records from low-altitude weather stations showing greater winter precipitation and lower summer temperature. The anomaly appears to be confined to the highest and largest glaciers, and to have set in abruptly during the 1990s. In contrast to indirect evidence for a positive mass-balance anomaly, the only measurements in the Karakoram were made on Siachen glacier in 1987–91 (Reference BhutiyaniBhutiyani, 1999). This short record was obtained by the hydrological method, which is less accurate than the glaciological and geodetic methods, and may predate the emergence of the anomaly. Nevertheless the average mass-balance rate over 5 years, –500 kgm–2 a–1, is a fact to be taken into account. An additional item of evidence is a shrinkage rate of –0.13% a–1 for 1968–99 measured in the Yarkand basin, draining the north slope of the Karakoram (Reference LiuLiu and others, 2006). This loss of area is less rapid than in most Himalayan basins, but the glaciers are unquestionably shrinking. Thus, the Karakoram anomaly deserves urgent attention. Further evidence is needed to solidify its status and to resolve uncertainties surrounding its extent and magnitude.
The feedback on total mass due to shrinkage and disappearance of glaciers is allowed for explicitly in this analysis, but some other feedbacks are not treated. As the glaciers become thinner their surfaces become lower and warmer, while over periods of decades, as here, they also become shorter, migrating to higher and colder elevations. Neither of these opposing feedbacks is accounted for. Another important part of the problem is that the glaciers are too big for the present climate. Even if the climatic forcing were to be frozen at present-day values, we should expect several decades or more of continuing mass loss (Reference Dyurgerov, Meier and BahrDyurgerov and others, 2009).
Thickness–area scaling is a valid exercise only in the large-sample limit. A sample of >20 000 glaciers probably passes this test, but most of the ice is in the largest glaciers and the scaling parameters may not represent them well. They tend to be dendritic, with many tributaries close to separation from the main trunk, while there are many basins in which moderate advances would cause smaller glaciers to coalesce into a larger dendritic complex. The nonlinear Equation (1) does not accommodate this additive behaviour.
Further reason for caution is provided by a comparison of measured shrinkage rates with rates from thickness–area scaling projections. The shrinkage rate given in the previous section, –1.7% a–1 between 1985 and 2010, is more than three times the area-weighted averages of observed rates for 1980–2000 reported by Reference Cogley, Singh, Singh and HaritashyaCogley (in press). Although the measured rates are few in number, a principal conclusion of this study is that the observational basis of thickness–area scaling needs to be revisited and extended with the aim of reducing uncertainty and identifying possible biases.
On balance, this list of caveats seems to suggest that the results obtained here are too pessimistic. That is, disappearance of glaciers and loss of ice may be less rapid than shown in Figures 3-5. On the other hand, there can be no assurance that the constant-trend assumption represents a worst case (or the constant-rate assumption a best case). Further, a notable conclusion of this analysis is that total H-K glacier mass during the 1980s appears to have been 4000–8000 Gt (Fig. 4), well below the undocumented 12 000 Gt suggested by Reference Cruz, Parry, Canziani, Palutikof, van der Linden and HansonCruz and others (2007).
A more ambitious attempt to incorporate realistic expected climate forcing is essential, but although the projections offered here are not reliable enough to inform detailed policy-making, they are more realistic than those of Reference Cogley, Singh, Singh and HaritashyaCogley (in press) or of Reference Cruz, Parry, Canziani, Palutikof, van der Linden and HansonCruz and others (2007).


