An Efficient Method for Approximately Simulating Drainage Capability for Urban Flood
 Donglai Li1,2
  Jingming Hou
- 1State Key Laboratory of Water Resources and Hydropower Engineering Science, Wuhan University, Wuhan, China
- 2State Key Laboratory of Eco-Hydraulics in Northwest Arid Region of China, Xi'an University of Technology, Xi'an, China
- 3Research Center on Flood & Drought Disaster Reduction of the Ministry of Water Resources, China Institute of Water Resources and Hydropower Research, Beijing, China
- 4Northwest Engineering Corporation Limited of the Power Construction Corporation of China, Xi'an, China
Assessing the performance and capability of drainage pipes is of significance for computing urban flooding. However, drainage-pipe data is not available for most urban areas, therefore raising the problem for computing the drainage capability in an approximate way. To resolve this problem, a new type of approach that improves on the existing approach, termed the inlet-drainage approach, is proposed by assuming the drainage effects as a mass subtracted in particular parts, e.g., the area with gullies or inlets. The proposed approach is incorporated into a 2D hydrodynamic model for surface flow to simulate the coupled rainfall-runoff-drainage-inundation processes. Through validation against the measured and modeled results in two test cases involving ideal and realistic urban catchments, it is demonstrated that the proposed new approach could provide fairly good modeled results for computing drainage effects. More importantly, the new approach is simple and easy to implement.
Introduction
Rainfall frequency and intensity have increased due to the acceleration of urbanization, change in climate, and increase in extreme weather, which has directly led to an increase in the runoff coefficient and frequent urban flooding. Urban flooding, causing heavy losses, has been among the worst disasters in many cities in recent years (Ali et al., 2011; Hou et al., 2018a; Khaing et al., 2019; Lashford et al., 2019). It is difficult for the drainage-pipe capacity to cope with extreme rainfall of growing frequency and intensity (Jang et al., 2018). Then, with rapid runoff over impermeable surfaces covering large areas, a greater amount of urban flooding and inundation, impacting human society, will frequently arise under these conditions. It is essential to gain a better understanding of flooding and inundation processes so as to develop effective countermeasures against urban water disaster risk. In urban areas with high densities of buildings and underground pipes, the topography and the drainage-pipe system affect surface runoff propagation significantly (Hou et al., 2018b; Chao et al., 2019). Therefore, a modeling approach reflecting the impacts of these factors is required to assess the flooding and inundation dynamics in urban areas.
With the increasing accessibility of fine-scale terrain data, enhancement in computing performance, improvement of numerical methods, and demand of detailed simulation results in some important areas, two-dimensional (2D) overland flow models have become a commonly used tool in recent years (Hou et al., 2015; Liang et al., 2016). Under storm conditions, the runoff should be conveyed by the essential infrastructure of drainage-pipe systems, which is put in place to alleviate flooding and inundation for modern urban areas. Hence, it is very significant to assess the performance and capability of drainage pipe with numerical models for emulating the processing of flooding events, especially to gain predictions of inundation depths and areas (Jang et al., 2018). However, drainage-pipe data is unavailable for many urban areas. The main reasons for this are either that the data was never well-documented in the beginning or that the data been lost over time because most drainage pipes were installed decades ago (Kratt et al., 2020). Sometimes, even though there is a drawing of the drainage network layout, it is inconsistent with the actual situation due to the impact of construction. Moreover, it is costly and difficult to measure the drainage network layout on site. Meanwhile, it is difficult to set up the model, especially when the area of research is large. More importantly, the data for such a complex layout are typically not made available to the public due to security concerns for key areas. In contrast, high-resolution image data and satellite data with a spatial resolution of <1 m, e.g., GF-2, WorldView-3, and Google Earth satellite imagery, can now be obtained (Malarvizhi et al., 2016; Zhang et al., 2019; Huang et al., 2020), and this can be used to discern the distribution of gullies and inlets of the drainage pipe network. To make use of this information, a new approach to clarify the drainage effects is required. Several models and methods have proposed a discounted rainfall or a fixed infiltration to consider the impact of drainage pipes in urban flood modeling. In the discounted rainfall approach, a corresponding discount is applied to the rainfall before input to the model to reflect drainage capacity in urban areas. As for the fixed infiltration approach, the drainage capacity is represented as additional infiltration rates in addition to the infiltration of the soil. The Environment Agency (2013) represented infiltration by reducing the rate of design rainfall in the beginning and then applying a further reduction in all areas to account for the effect of the drainage pipe. In addition, Yu and Coulthard (2015) assumed that the drainage system conveys water away at the maximum design capacity, and then the mass loss in the whole area is considered in the model to reflect the drainage system capability. Hou et al. (2018b) used constant infiltration over the whole study area to represent urban drainage network capacity when simulating flood inundation, and results similar to the measured effect were attained. Wang et al. (2018) used the constant infiltration method and the rainfall reduction method to represent urban drainage-pipe capacity. The results show that the constant infiltration method is better than the rainfall reduction method because the former can better describe the flood recession process. All of the abovementioned approaches assumed that the drainage process happens across the whole area, which differs from the drainage process in reality (here, the existing approach of reducing water over the whole area is called the all area-drainage approach; hereinafter, the existing approach). However, drainage pipe is commonly laid only on roads, and the water exchange processes take place at the inlets and manholes of the drainage pipe, so the above assumption may lead to misestimation. Aiming at solving these existing problems, a new approach of reducing the water in the inlets of roads, named the inlet-drainage approach (hereinafter, the new approach), is proposed for reflecting the urban drainage-pipe capacity when such information is unavailable.
Both the new approach and the existing approach are based on mass conservation, which reduces the mass mainly from the surface runoff. The complete urban rainfall-runoff process can be divided into the generation and confluence processes of surface runoff and drainage-pipe flow, which involve hydrological and hydrodynamic processes (Chang et al., 2015). The existing approach reduces water over the whole area, which happens in the process of runoff generation. However, during the hydrodynamic processes of the real rainfall-runoff process, the water is reduced through inlets after water flow to the inlets on the road (Chang et al., 2015; Jang et al., 2018; Wang et al., 2018). Therefore, the new approach reducing the water at the inlets of the road is proposed. Both of the approaches will be described in detail later. Although these approaches are different from one to another, they are both based on the same theory of reducing the mass. It is worth noting that the new approach is similar to the hydrodynamics of the real rainfall-runoff process (Jang et al., 2018; Martínez et al., 2018).
As the rainfall-runoff process in an urban catchment is a very complicated process, it is very important to choose a model that can completely simulate the generation and confluence processes of surface runoff and drainage-pipe flow to evaluate the existing approach and the new approach. In recent years, many hydrological models that couple the 2D surface runoff process and the one-dimensional (1D) drainage-pipe process have been developed to emulate the complete urban rainfall-runoff process (Russo et al., 2015; Fan et al., 2017; Jang et al., 2018; Li et al., 2020). These models can be divided into two main types based on different considerations of the rainfall-runoff process (Chang et al., 2015). One type allows the rainfall to flow directly into a drainage pipe system after deducting infiltration, evaporation, and interception at the surface. The flooding will overflow to the surface through manholes or inlets when the capacity of the sewer network is exceeded. Then, the flooding flow on the 2D surface (Leandro et al., 2009) is collected. For example, the Storm Water Management Model (SWMM), where the flooding is collected in nodes, is commonly used to simulate the rainfall-runoff process (Rossman, 2010). This method is inconsistent with the actual rainfall-runoff process because it does not first consider surface runoff dynamics, and it overestimates the drainage capacity of drainage pipes. In another type, rainfall is first simulated on the surface to generate surface runoff. Then, the rainfall discharges into the drainage pipe network through manholes and inlets and is simulated by the 1D sewer flow model (Chang et al., 2015; Chen et al., 2017). This method is closer to the actual physical process, and it is gradually becoming widely used with the development of computing power. For example, Fan et al. (2017) presented a coupled model based on the implicit method and tested it in real urban scenarios. Li et al. (2020) proposed a novel 1D-2D coupled model that can even simulate transient flows in drainage networks.
To simulate the drainage-pipe capacity, this study develops a coupled model that couples a 1D sewer flow model with a 2D overland flow model based on the latter method (hereinafter, the coupled model). The sewer flow model was developed on the basis of diffusion wave equations, and the overland flow model is based on dynamic wave equations. The interactions between surface runoff and drainage-pipe flow are also coupled by the inlets and manholes, and the water exchange between the pipe and the surface is calculated by the weir formula. Therefore, three approaches to calculating the drainage-pipe capacity are simulated in this work: the existing approach, the new approach, and the coupled model approach. The details of the three approaches will be described in the next section. The performance of the new approach is validated against two test cases, an idealized urban catchment and a realistic urban catchment, in the following section. Finally, conclusions are briefly drawn.
Method for Computing the Capacity of Pipe Network Drainage
The hydrodynamic-based rainfall-runoff and inundation model solves the 2-D shallow water equations (SWEs). The SWEs are derived by depth-integrating the Navier-Stokes equations and assuming a hydrostatic pressure distribution (Hou et al., 2018a). The conservation law of the two-dimensional no-linear shallow water equations can be written in the vector form as follows (Liang and Marche, 2009; Xia et al., 2017) when the kinetic and wind stresses, turbulent viscous terms, and Coriolis effects are neglected.
where t represents the time; x and y represent the Cartesian coordinates; t denotes the vector of conserved flow variables consisting of h, qx, and qy, i.e., the water depth, unit-width discharges in the x- and y-directions, respectively; qx = uh, qy = vh, u, and v are depth-averaged velocities in the x- and y- directions; f and g are the flux vectors in the x- and y- directions; S is the source vector, which may be further subdivided into the slope source term Sb and friction source term Sf; Zb represents the bed elevation; Cf is the bed roughness coefficient, which is generally computed by gn2/h1/3, with n being the Manning coefficient.
The R denotes the rainfall source term including rainfall, evaporation, infiltration, and the water exchange between the surface and the drainage pipe in the actual rainfall-runoff process, where the exchange accounts for most of the total loss in urban areas. The interception and evaporation are neglected in the hydrodynamic-based rainfall-runoff and inundation model. R can then be written as follows.
where i denotes the rainfall rate (mm/h) and f denotes the infiltration rate (mm/h).
The Coupled Model
The governing equations of the sewer flow model are 1D SWEs. When the inertia term is assumed to be negligible in the equation, the 1D SWEs can be simplified as the diffusion wave equation, which is written as in Equations (5) and (6).
where Qp represents the discharge in the pipe; Ap are the discharge section area of the pipe; t denotes the time and is synchronized with the two-dimensional model; sp represents the length of the pipe; Zp is the water level of the sewer; g is the gravitational acceleration; Sfp is the friction slope of the pipe.
As for the water depth calculations at inlets, the continuity equation for an inlet or manhole is shown as Equation (7), which includes the flow interaction with the 2-D surface flow model.
where hI is the water depth at the inlet; t denotes the time; qpj is the discharge of the jth pipe connecting to the inlet, which is positive for entering flow and negative for exiting flow; qin represents the discharge that flows into the inlet from the overland surface; qout is the surcharge discharge leaving the drainage pipe to the overland surface; AI is the area of the inlet.
When the water flows through an inlet, the water will enter the drainage-pipe system at the inlet. In contrast, when the water depth in an inlet reaches the surface elevation, overflow occurs so that the flow will move from the drainage-pipe system to the surface system. In this paper, the water exchange between the 2D surface flow model and the 1D sewer flow model is coupled through the inlet. When considering the surface water flow to the inlet, the model uses the weir formula to calculate the inflow from the ground surface, i.e.,
where φ is the discharge coefficient, lI is the perimeter of the inlet, and hs represents the surface water depth at the inlet.
Overflow or backward flow occurs when the water depth in an inlet exceeds the surface water elevation, and then the water depth above the surface water elevation will be spread on the surface grid. The backward flow and overflow discharge in the coupled model are calculated by the maximum pressure of the inlets. As for the water depth updates on the 2D surface, water exchange only happens on the grid connecting with the inlet, and the rainfall source term in these grids can be rewritten as Equation (9).
where i and f are in mm/s, qin and qout are in m3/s, and As is the area of the surface grid (m2);
The Existing Approach
The rainfall-runoff process can be divided into four main parts: soil infiltration, drainage-pipe discharge, surface runoff, and evaporation/transpiration (Zhang and Pan, 2014). According to the water conservation law, the amount of water discharged from the drainage pipe can be approximated by using the methods of subtracting mass and thus achieving a similar effect. In this work, the new approach based on the existing approach is proposed to compute the drainage-pipe discharge.
In the existing approach, as well as considering the basic soil infiltration, all areas additionally need to subtract a mass that corresponds to the drainage-pipe capacity (Figure 1). Equation (10) can then be obtained and applied to the existing approach.
where α1 denotes the subtracted mass rate of the existing approach (mm/h).
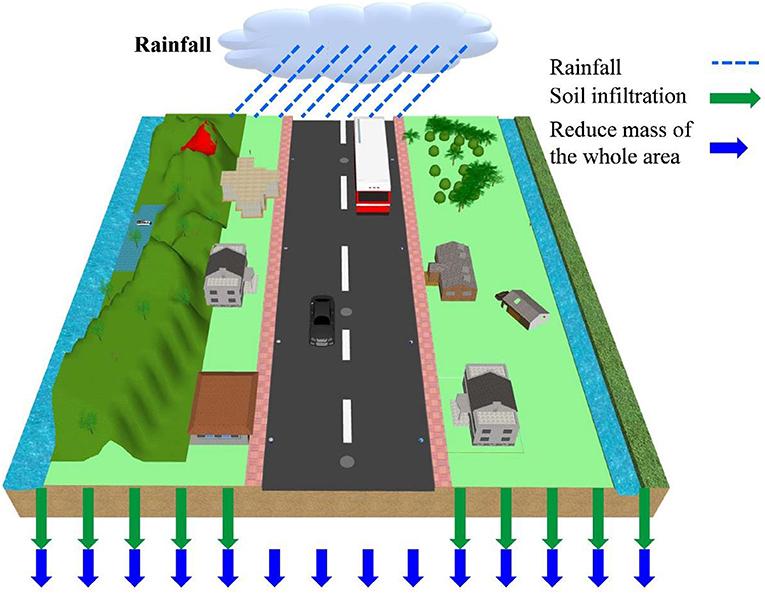
Figure 1. Schematic diagram of the existing approach.
The New Approach
The rainwater is subtracted through inlets in the actual rainfall-runoff process. The new approach subtracts mass only at the inlets (Figure 2), and the mass subtracted is calculated by the weir formula after correction, as shown in Equation (11). In contrast with the coupled model, the new approach ignores the hydrodynamic processes of the drainage pipe. The new approach is more in accordance with the actual physical processes of the flooding and inundation process. Meanwhile, in order to improve the accuracy of the new approach, a correction is applied in the formula for calculating the subtracted mass.
where α2 represents the subtracted mass rate in the inlet of the new approach (mm/h); flag is the general land attribute term of the surface grids, Inlet denotes grids with the attribute term ‘inlet’; qInlet, introduced later, is the correction of qin that is calculated by Equation (8) (m3/s), and AS is the area of one surface grid.
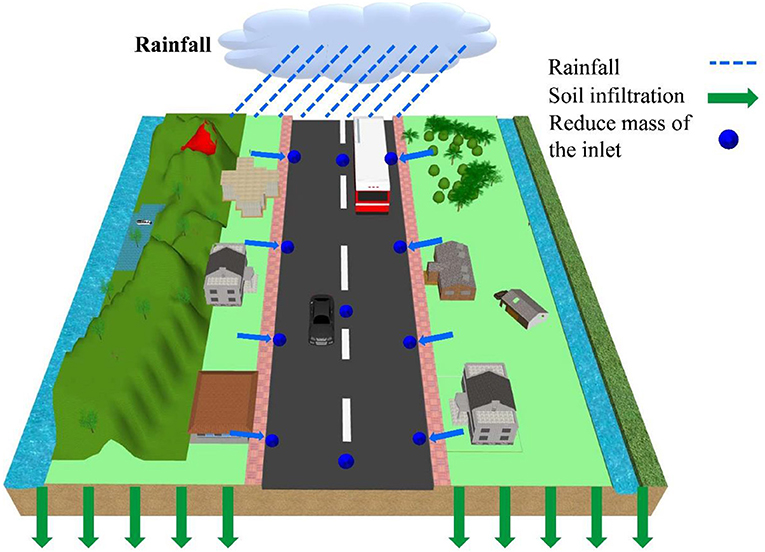
Figure 2. Schematic diagram of the new approach.
It is necessary to correct qin for better effect. If we do not correct the inflow, the mass subtracted will be larger than the actual condition. This is because of limited drainage-pipe capacity: the drainage pipe cannot discharge so much rainwater within a short period of time because of the restriction on the size of the drainage pipe. Hence, a correction of inflow based on the size of the drainage pipe is required. Firstly, the maximum discharge of the pipe, QPmax, is computed by Equations (13) and (14); both equations reference Code GB 50014-2006. Secondly, the total inflow, Qi, of all of the qI in the ith pipe is calculated, where i represents the id of the drainage pipe. Thirdly, the values of the maximum pipe flow QPmax and the total inflow Qi are compared, and the inlet inflow qI must be corrected when Qi > Qpmax. A coefficient representing the ratio of Qi and QPmax is used to achieve the correction of inlet inflow qin. The detailed equations are shown as follows.
where QP represents the flow of the drainage pipe based on Code GB 50014-2006, and QPmax is the status of full pipe flow; Ap is the discharge section area of the pipe; Rp is the hydraulic radius of the pipe; n is the Manning coefficient in the pipe; dp is the diameter of the pipe; Ip is the slope of the pipe. The diameter of the pipe can be determined according to the design capability of drainage pipes and the relevant code (The Ministry of Housing and Urban-Rural Development of the People's Republic of China, 2006). The slope of the pipe can be obtained with reference to the terrain features (Liang and Cheng, 2018). The maximum discharge of the pipe network can also be calibrated according to actual inundation and flooding if we can get measured data.
where Qi represents the total flow of all inlets to the ith pipe and the subscript j represents the id of the inlet. The symbol diagram of the computation process is shown in Figure 3.
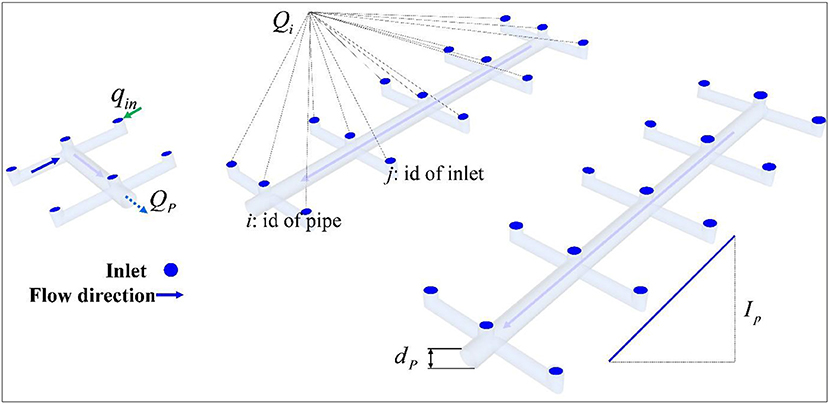
Figure 3. Symbol diagram of the new approach.
A flow diagram of the methods for reflecting the capacity of pipe network drainage is shown in Figure 4. As a first step, the same basic data are provided to the different approaches, including the initial conditions, the Digital Elevation Model (DEM), and the land use. The rainfall and soil infiltration are then calculated. The third step is to modify the rainfall source term to reflect the capacity of the drainage pipe. It is reduced over the whole area with the existing approach, while only grids with the inlet type are reduced in the new approach. In the new approach, the inflow of the inlet is corrected when the total inflow exceeds the drainage capacity, which is based on the design standards and actual situation of the drainage pipe. Both the existing approach and the new approach correct the rainfall source term in the model to reflect the capacity of the drainage pipe network. Finally, the fluxes, slope source term, and friction source term calculations are the same for the different approaches.
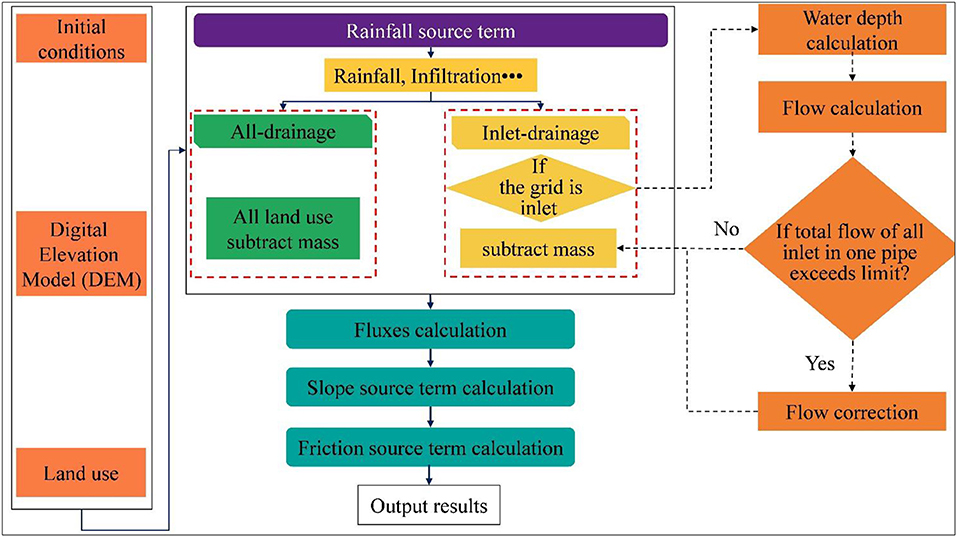
Figure 4. Flow diagrams of the new approach and the existing approach.
Test Cases
In order to investigate the effectiveness of the new approach and the existing approach in representing the capability of drainage pipe systems, the rainfall-runoff process is simulated in two cases: an idealized urban catchment and the Fengxi New City of the Xixian New Area urban catchment. Meanwhile, the coupled model is applied to quantitatively compute the amount of flooding to compare the effects of the two approaches. The subtracted mass rate of the existing approach in each case is first calibrated based on the results of the coupled model, and then the three different approaches are used to simulate the rainfall-runoff process under rainfall with different return periods.
Rainfall-Runoff Process in an Idealized Urban Catchment
To investigate the performance of the existing approach and the new inlet-drainage approach for the urban catchment, rainfall and runoff propagating over an idealized urban catchment are computed to demonstrate the performance of the three methods. In the test case, the idealized urban catchment is 240 m long and 284 m wide, the cross-sectional width consists of a 130-m-wide confluence area on both sides and a 24-m-wide road, as shown in Figure 5A. The size of the idealized urban catchment is based on an actual urban catchment. According to the code for the design of outdoor wastewater engineering (The Ministry of Housing and Urban-Rural Development of the People's Republic of China, 2006) and some research (Van Dijk et al., 2014; Liang and Cheng, 2018), the vertical and horizontal slopes of the urban area are taken as i1 = 0.003 and i2 = 0.005, respectively. The road is 0.2 m lower than the sides, and there is a slope of i3 = 0.02 from the middle of the road to the side of the road (Figure 5B).
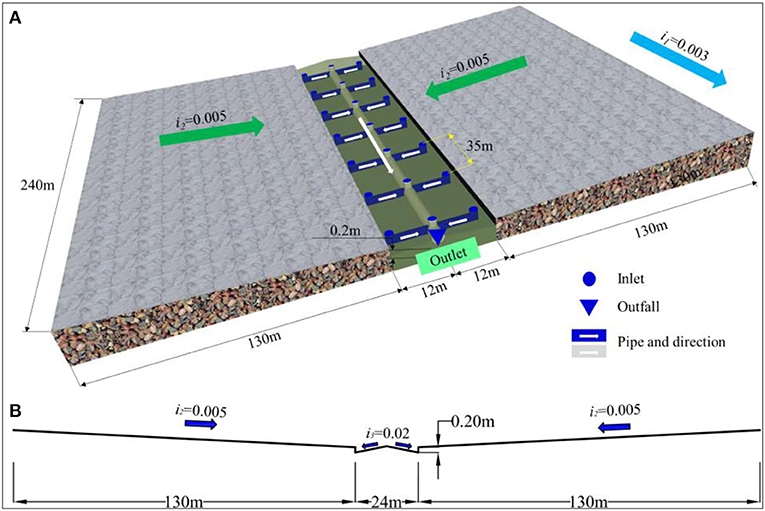
Figure 5. Schematic diagram of the ideal urban catchment (A: Stereogram and drainage-pipe layout; B: cross-section diagram).
The drainage-pipe layout is determined according to actual survey, combined with the code. The inlet is 0.7 m long and 0.4 m wide. Inlets are generally 25–50 m apart on the two sides of the road, considered to be 35 m for this study, and the main pipe is laid in the middle of the road. Therefore, there are 20 inlets, 1 outlet, and 20 pipes in the urban area. The drainage-pipe layout is shown in Figure 5A.
The rainwater design flow is calculated by using the following inference formula.
where QS is the rainwater design flow (m3/s); i denotes the rainfall intensity (mm/h); ψ represents the runoff coefficient; F is the catchment area (m2).
The design storm from Xi'an County, Shaanxi Province, with a return period of 1 year (the standard for the drainage-pipe design of the study area) and a duration of 2 h is employed as rainfall input data. The storm formula is expressed as follows (Bi et al., 2015):
where i denotes the rainfall intensity (mm/h); p is the return period, year; t denotes rainfall duration, min.
Finally, the pipe diameter is calculated according to Equation (19).
where v is the pipe flow velocity. According to the code, the minimum value is 0.6 m/s, and here it is 1 m/s. After calculation, the pipe diameter is 0.8 m.
Regarding the boundary condition, all boundaries are closed boundaries except for the outlet. The Manning value on both sides is 0.03, and that on the road is 0.014. The computational domain is discretized into a 1-m resolution DEM. The rainfall with a constant intensity of 60 mm/h and with a duration of 3,600 s was selected for calibration of the subtracted values of the existing approach and of the new approach; the simulation duration is 7,200 s. Under the above rainfall event, firstly, simulation with the coupled model without infiltration in the urban area is used to obtain the water discharge volumes at the outlet of the road. Secondly, the subtracted values in the existing approach are calibrated until the error of discharge volumes between the existing approach and coupled model at the 2nd h is <5%. Finally, a subtracted value of 16.5 mm/h is obtained for the existing approach. The related parameters in the new approach are consistent with the coupled model. A simulation without a drainage pipe and no infiltration over the whole area is performed to reflect the drainage effect of the pipe network. The process of the rainfall event and discharge volumes at the outlet under different scenarios are shown in Figure 6.
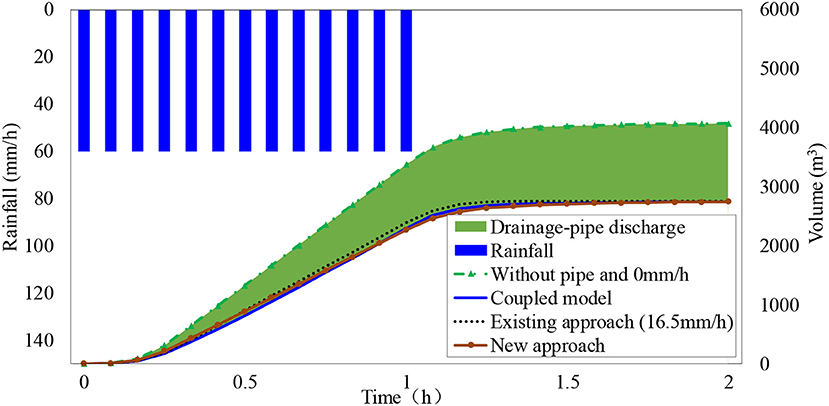
Figure 6. Rainfall process diagram and volume process diagram under different scenarios.
Simulations using the coupled model, the existing approach, and the new approach were then run for different return periods, and the effects of the existing approach and the new approach were evaluated based on the coupled model results. The design storms from Xi'an County, Shaanxi Province, with return periods of 2, 5, 10, and 50 years and a duration of 2 h are employed as rainfall input data (Figure 7). The storm formula is shown in Equation (18). The volumes processed at the outlet of the ideal urban catchment are presented in Figure 8. The results clearly demonstrate that the new approach is more effective than the existing approach, especially for the rainfall with a 2- and 5-years return period. Moreover, the runoff delay in the existing approach can be clearly observed in Figure 8. Compared with the coupled model, the runoff delay times in the existing approach are 1,200–1,500 s under rainfall events with different return periods, whereas there is almost no delay in the new approach.
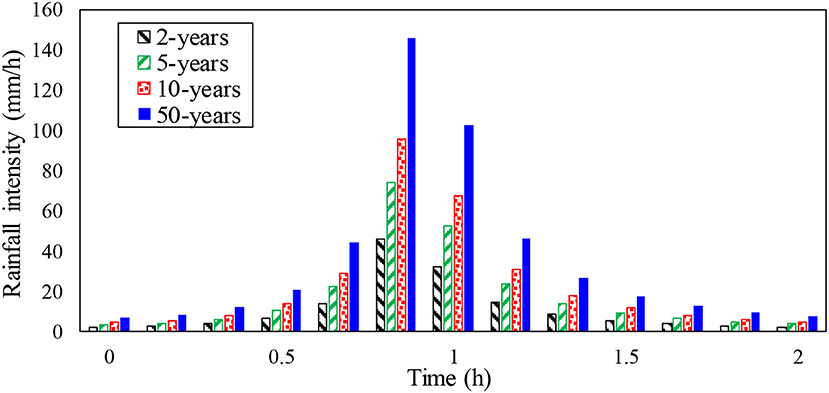
Figure 7. Hyetography of design storms with different return periods.
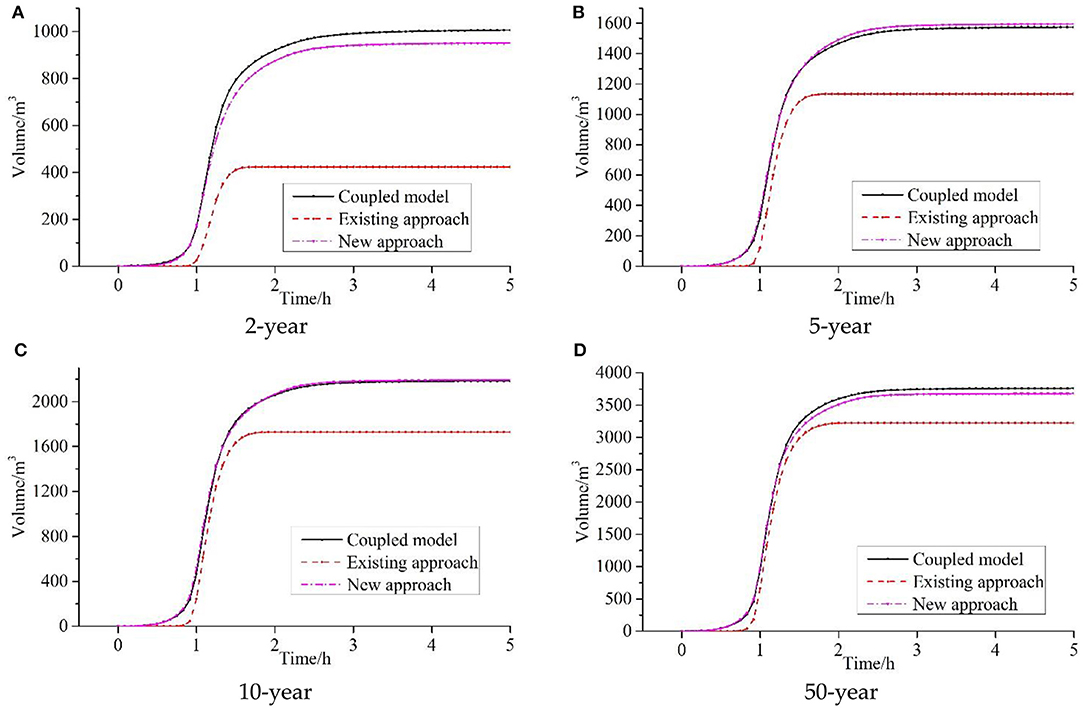
Figure 8. Simulated volumes at the outlet of the road of the urban area for different approaches under (A) 2-year, (B) 5-year, (C) 10-year, and (D) 50-year rainfall events.
The volumes at the outlet with different approaches and the error vs. the coupled model are listed in Table 1. The results clearly demonstrate that the new approach is very effective in assessing the capability of a drainage pipe compared to the coupled model. The error percentage between the coupled model and the existing approach is 13.89–57.34%, which decreases with an increase in the rainfall return period. The error between the coupled model and the new approach is only 0.14–6.66% and is much smaller than with the existing approach. Compared with the existing approach, the error with the new approach can reduce by 57.97, 27.89, 20.86, and 14.28% for rainfall events with the return periods of 2, 5, 10, and 50 years, respectively. In other words, the new approach is more similar to the coupled model than is the existing approach.
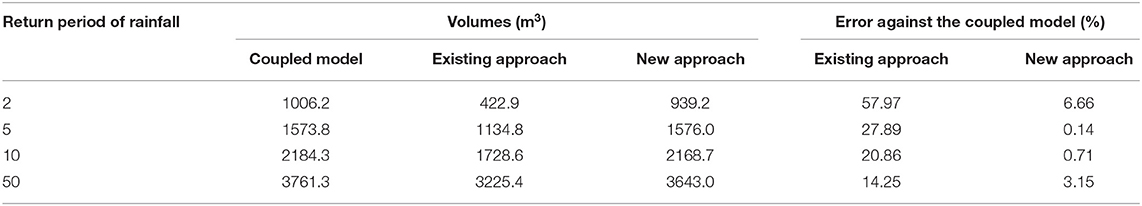
Table 1. Comparison of volumes with different approaches and error vs. the coupled model (5th h).
With regard to the computational efficiency, the new approach takes only an average of 493.92 s with 73,840 cells in the rainfall with different return periods, while simulation with the coupled model costs an average of 1,806.39 s, showing that the new approach can accelerate the computation by 3.77 times while generating the results with similar accuracy.
Rainfall-Runoff Process in Fengxi Urban Catchment
To investigate the effectiveness of the existing approach and the new approach for the rainfall-runoff process in a real catchment, the three approaches are implemented for the abovementioned conditions in Fengxi New City of Xixian New Area urban catchment, China.
The Fengxi New City urban catchment (Figure 9) is applied to calibrate the parameters of the reduction rate of the existing approach and the new approach in an actual catchment. It is a typical urban area with a catchment area of 47.35 hm2. The catchment is located in Xixian New Area, Shaanxi Province, China. The regional climate is classified as monsoonal, and more than 50% of the rainfall falls from July to September. The input data to the model include the DEM with a resolution of 2 m (Figure 9A), infiltration rates, and Manning coefficients (Table 2). The soil infiltration rate of different land use types is based on actual measurement using double-ring infiltrometers, which consist of open inner and outer cylinders. Both of the cylinders should be inserted manually into the soil then a constant water head should be maintained. The use of the outer cylinder helps to decrease the error, and the water volume added into the inner cylinder is measured to determine the soil infiltration rate (ASTM, 2009; Fatehnia et al., 2016). The Manning coefficient of different land use types is based on Hou et al. (2018b). Figure 9B illustrates the five basic types of land use in the study area—Grassland, Roads, Bare land, Buildings, and Forests. The layout of the drainage pipe network of Fengxi New City urban catchment is shown in Figure 9C. It comprises 81 inlets, 4 outlets, and 81 pipes. The diameter of the pipe is 0.8 m. This data information was provided by the Technology Research Center for Sponge City, Fengxi New City. Moreover, Figure 9D displays the rainfall hyetograph for the study area, where the maximum rainfall was observed. The data of the flood event that occurred in the Fengxi New City on August 25th, 2016, is adopted for the simulation. The rainfall, which lasted 7.5 h, started at 00:30 and ended at 08:00. The maximum hourly rainfall, at 3.1 h into the storm, was 65.4 mm/h, the total rainfall was 66 mm, and the return period of the storm event is about 50 years. The inundation data were observed on-site, and the measured area inundated at the 5th h was about 1,600 m2.
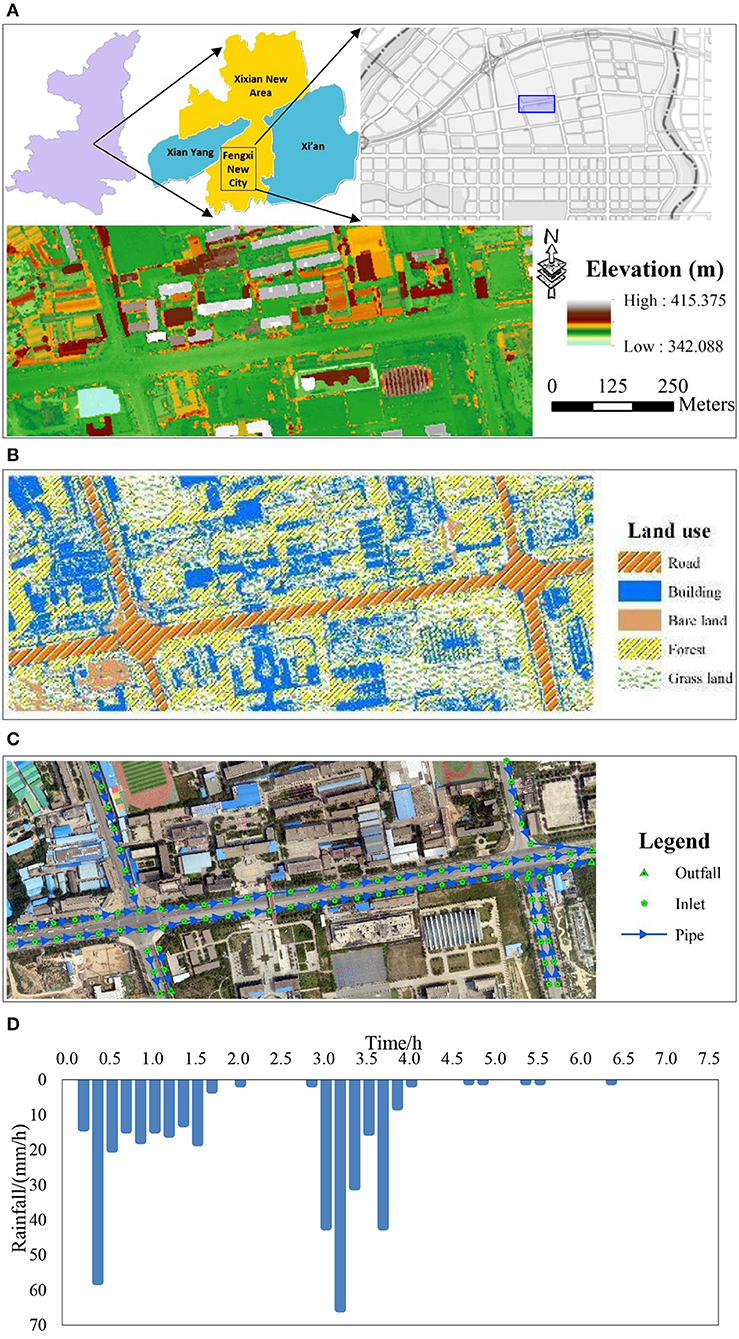
Figure 9. Study catchment in Fengxi New City, Xixian New Area, China. (A) Digital Elevation Model (DEM); (B) land use map; (C) digital orthophoto map and the drainage-pipe layout; (D) hyetography in the study area.
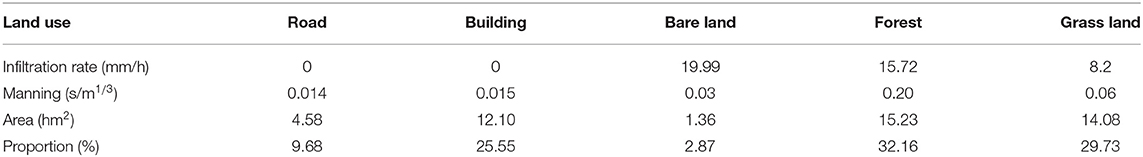
Table 2. Infiltration rate (mm/h), Manning coefficient (s/m1/3), and proportion (%) under different land use types in the coupled model.
The coupled model is used to simulate the rainfall-runoff process in the study catchment under the above rainfall event. The result from the coupled model at the 5th h is 1,596 m2. The results from the coupled model and an actual observation are shown in Figure 10. The red lines represent the inundation extents from the simulation result of the coupled model. The inundation is mainly concentrated at the side of the road, which is consistent with the actual situation. This clearly shows that the inundation areas simulated by the coupled model exhibit good agreement with the measured data. Meanwhile, it also validates the coupled model.
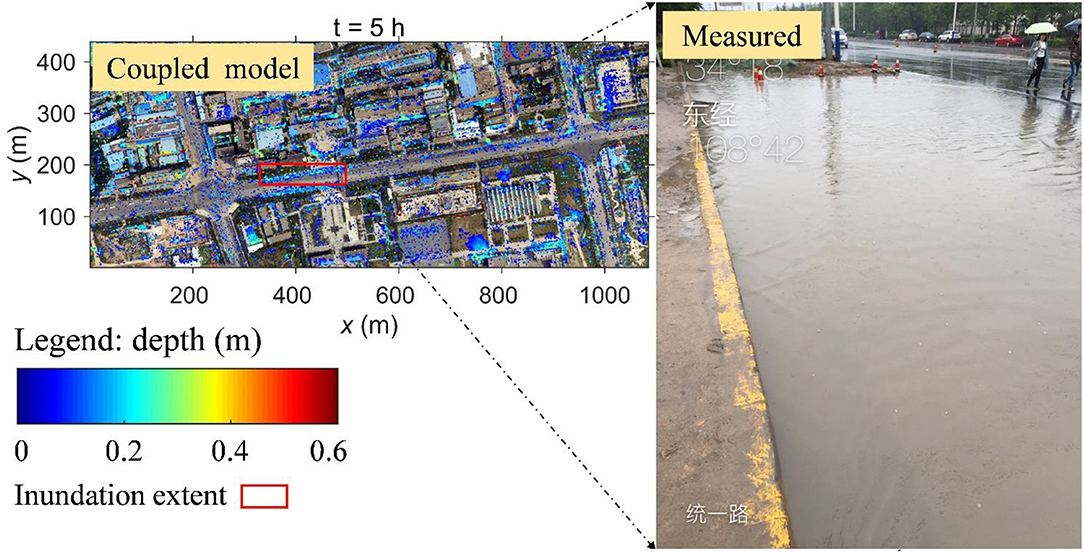
Figure 10. The coupled model extent and observed, measured inundation extent in the study area (5th h).
The reduction rate in the existing approach is then calibrated according to the measured data and the results of the coupled model. After many trial calculations, finally, the reduction rate of the existing approach in all areas is 6.9 mm/h. The parameters of the new approach are consistent with the coupled model. The inundation areas on the road under the existing approach and the new approach are 1,612 and 1,524 m2, respectively. Compared with the measured data, the error of both results is <5%, which is good agreement with the measured data. This indicates that the reduction rate is reasonable. The measured data and the evolution of areal inundation under different approaches are shown in Figure 11. The figure clearly shows that the new approach is more consistent with the coupled model than is the existing approach. Compared with the coupled model, the inundation area in the existing approach is too small in the first 3 h, while it is too high in the latter part of the rainfall process. The inundation extents with both the existing approach and the new approach at the 5th h are very close to the measured data and the coupled model.
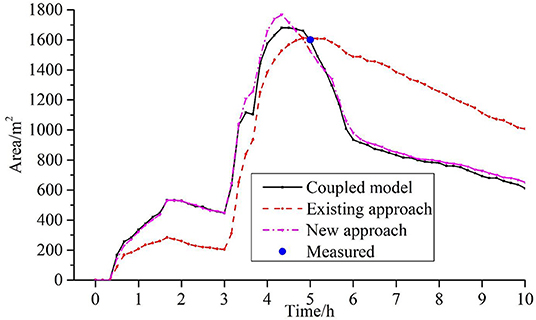
Figure 11. Simulation results of the areal inundation evolution under different approaches.
To systematically compute the effects of the different approaches on runoff process, the design storms from Xi'an County, Shaanxi Province, with different rainfall recurrence intervals (2, 5, 10, and 50 years) and four approaches are imported into the model to simulate the runoff process. The simulation duration is 8 h. Figure 12 shows the inundated area and the evolution of the inundation extent under rainfall events of different return periods. The results clearly demonstrate that there are significant differences between the existing approach and the new approach, especially in the fading process and the peak inundation. Compared with the coupled model, the inundation areas with the existing approach are low under rainfall with return periods of 2 and 5 years and high under rainfall with return periods of 10 and 50 years. This illustrates that the drainage capacity under rainfall with a small return period may be overestimated in the existing approach and may be underestimated under rainfall with a large return period. However, the inundation evolution of the new approach agrees well with the coupled model; this indicates that the new approach can accurately estimate the drainage capacity under rainfall with different return periods. The new approach is significantly better than the existing approach under rainfall with different return periods.
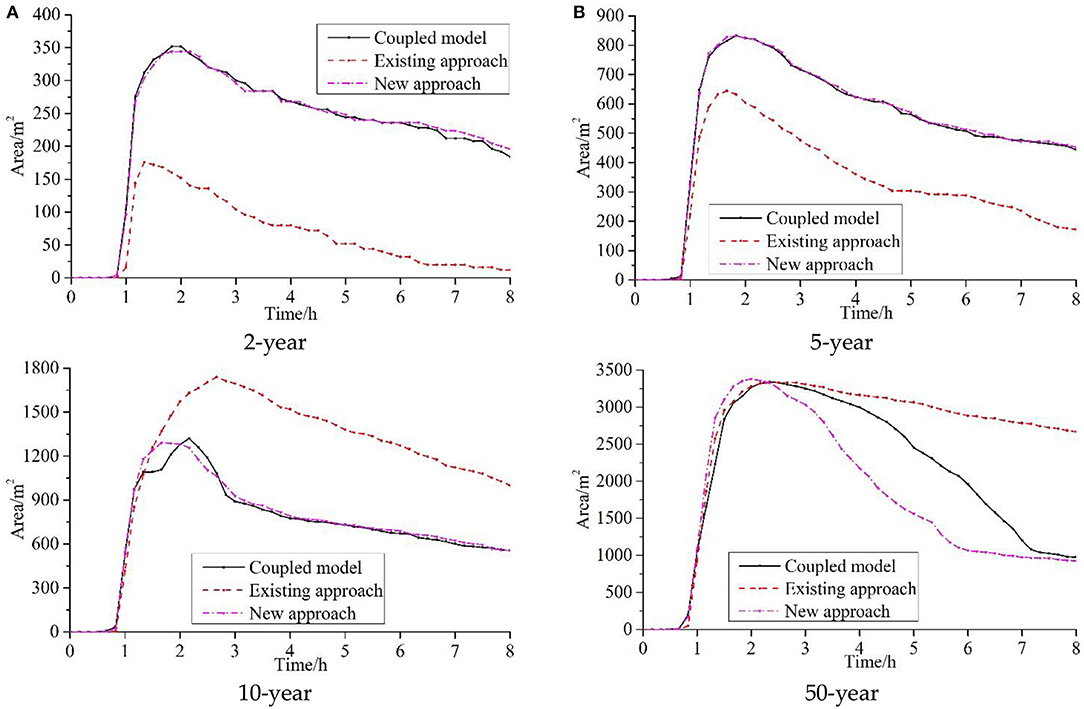
Figure 12. Comparison of inundation extent evolution for different methods ((A) 2-year, (B) 5-year, (C) 10-year, and (D) 50-year).
The final inundation areas with the different approaches and the error vs. the coupled model are presented in Table 3. We can clearly see that the effectiveness of the new approach is better than that of the existing approach in different scenarios. The errors between the coupled model and the existing approach are 93.48, 61.26, 79.86, and 173.36% for rainfall events with return periods of 2, 5, 10, and 50 years, respectively. The error between the coupled model and the new approach is 0.00–6.52%. The new approach can reduce the error with the existing approach by 59.46–168.03% for the rainfall events with the return periods of 2, 5, 10, and 50 years. The results clearly demonstrate that the new approach is very effective for assessing the drainage-pipe capability. In short, the new approach is much more effective, especially when the inundation recedes, which is very similar to the results in the idealized urban catchment, again confirming that this research is valuable for modeling urban areas for which drainage-pipe data are unavailable.
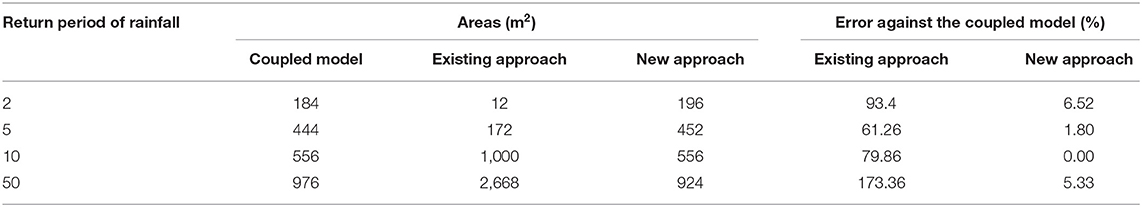
Table 3. Final inundation area (8 h) with the different approaches and the error vs. the coupled model.
Moreover, the new approach takes only 969.89 s for rainfall with different return periods with 119,460 cells, while the simulation through the coupled model takes 2728.84 s, indicating that this approach can accelerate the computation by 3.29 times while generating results with similar accuracy.
Conclusions
In this paper, a novel inlet-drainage approach for approximately computing the drainage at inlets is proposed to reflect the effect of drainage pipes in urban areas for which drainage-pipe data are unavailable.
The results of the new approach could more effectively reflect the effect of a drainage pipe than could the existing approach in an ideal urban catchment and an actual urban catchment. The error between the coupled model and the new approach is only 0.00–6.66% in different scenarios. Compared with the existing approach, the error of the new approach can be reduced by 11.10–51.31% in the idealized urban catchment under rainfall with different return periods and can be reduced by 59.46–168.03% in the realistic urban catchment. In addition, the computation time was significantly shorter than with the coupled model while achieving similar accuracy. The new approach accelerates the simulation by 3.29–3.77 times according to the grid properties.
In summary, the simulation results indicate that the new inlet-drainage approach is a more reliable and efficient method for reflecting drainage capacity than is the existing approach. The analysis improves the understanding of urban flood processes and is helpful for decision-making in flood risk management. Meanwhile, the research is valuable for modeling an urban area for which drainage-pipe data are unavailable. However, the new approach is not able to reflect the overflow and backflow process of the drainage pipe. Further research is needed into more advanced methods to fully reflect the effects of drainage pipes of areas for which data are unavailable.
Data Availability Statement
All datasets generated for this study are included in the article/supplementary material.
Author Contributions
DL and JH contributed significantly to the analysis and manuscript preparation. JX, YT, and DY performed the data analyses and wrote the manuscript. DZ and XG helped to perform the analysis, with constructive discussions. All authors contributed to the development of ideas and to write the manuscript.
Funding
This work was partly supported by the Visiting Researcher Fund Program of State Key Laboratory of Water Resources and Hydropower Engineering Science (2016HLG01), National Key Research Program of China (2016YFC0402704), the Science and Technology Department Project of Shaanxi Province (Grant No. 2017JQ3043), IWHR Research and Development Support Program (JZ0145B772017), and the International Cooperation and Exchange Program for Science and Technology (Grant No. 2017KW-014).
Conflict of Interest
XG was employed by company Northwest Engineering Corporation Limited of the Power Construction Corporation of China, Xi'an, China.
The remaining authors declare that the research was conducted in the absence of any commercial or financial relationships that could be construed as a potential conflict of interest.
Acknowledgments
We wish to acknowledge all the data support by Fengxi New City Development and Construction Group Co., Ltd, of Shaanxi Xixian New Area. We thank the State Key Laboratory of Water Resources and Hydropower Engineering Science, National Key Research Program of China, Science and Technology Department Project of Shaanxi Province, IWHR, and International Cooperation and Exchange Program for Science and Technology for their financial support.
References
Ali, M., Khan, S. J., Aslam, I., and Khan, Z. (2011). Simulation of the impacts of land-use change on surface runoff of Lai Nullah Basin in Islamabad, Pakistan. Landsc. Urban Plan. 102, 271–279. doi: 10.1016/j.landurbplan.2011.05.006
ASTM (2009). ASTM D3385-2009 D3385-09, Standard Test Method for Infiltration Rate of Soils in Field Using Double-Ring Infiltrometer. West Conshohocken, PA: ASTM International. Available online at: www.astm.org.
Bi, X., Dang, C., Cheng, L., Luo, H., Shi, M., and Zhao, R. (2015). Study on compiling rainstorm intensity formula in Xi'an urban. J. Anhui Agric. Sci. 43, 223–225+228. doi: 10.13989/j.cnki.0517-6611.2015.26.212
Chang, T.-J., Wang, C.-H., and Chen, A. S. (2015). A novel approach to model dynamic flow interactions between storm sewer system and overland surface for different land covers in urban areas. J. Hydrol. 524, 662–679. doi: 10.1016/j.jhydrol.2015.03.014
Chao, L., Zhang, K., Li, Z., Wang, J., Yao, C., and Li, Q. (2019). Applicability assessment of the CASCade Two Dimensional SEDiment (CASC2D-SED) distributed hydrological model for flood forecasting across four typical medium and small watersheds in China. J. Flood Risk Manag. 12:e12518. doi: 10.1111/jfr3.12518
Chen, X., Ji, P., Wu, Y., Zhao, Y., and Zeng, L. (2017). Coupling simulation of overland flooding and underground network drainage in a coastal nuclear power plant. Nucl. Eng. Des. 325, 129–134. doi: 10.1016/j.nucengdes.2017.09.028
Environment Agency (2013). Updated Flood Map for Surface Water-national Scale Surface Water Flood Mapping Methodology. Bristol: Environment Agency.
Fan, Y., Ao, T., Yu, H., Huang, G., and Li, X. (2017). A coupled 1D-2D hydrodynamic model for urban flood inundation. Adv. Meteorol. 2017, 1–12. doi: 10.1155/2017/2819308
Fatehnia, M., Tawfiq, K., and Ye, M. (2016). Estimation of saturated hydraulic conductivity from double-ring infiltrometer measurements. Eur. J. Soil Sci. 67, 135–147. doi: 10.1111/ejss.12322
Hou, J., Guo, K., Liu, F., Hao, H., Liang, Q., Tong, Y., et al. (2018a). Assessing slope forest effect on flood process caused by a short-duration storm in a small catchment. Water 10:1256. doi: 10.3390/w10091256
Hou, J., Liang, Q., and Xia, X. (2015). Robust absorbing boundary conditions for shallow water flow models. Environ. Earth Sci. 74, 7407–7422. doi: 10.1007/s12665-015-4743-6
Hou, J., Wang, R., Li, G., and Li, G. (2018b). High-performance numerical model for high-resolution urban rainfall-runoff process based on dynamic wave method. J. Hydroelectr. Eng. 37, 40–49. doi: 10.11660/slfdxb.20180305
Huang, X., Cao, Y., and Li, J. (2020). An automatic change detection method for monitoring newly constructed building areas using time-series multi-view high-resolution optical satellite images. Rem. Sens. Environ. 244:111802. doi: 10.1016/j.rse.2020.111802
Jang, J.-H., Chang, T.-H., and Chen, W.-B. (2018). Effect of inlet modelling on surface drainage in coupled urban flood simulation. J. Hydrol. 562, 168–180. doi: 10.1016/j.jhydrol.2018.05.010
Khaing, Z. M., Zhang, K., Sawano, H., Shrestha, B. B., Sayama, T., and Nakamura, K. (2019). Flood hazard mapping and assessment in data-scarce Nyaungdon area, Myanmar. PLoS ONE 14:e0224558. doi: 10.1371/journal.pone.0224558
Kratt, C. B., Woo, D. K., Johnson, K. N., Haagsma, M., Kumar, P., Selker, J., et al. (2020). Field trials to detect drainage pipe networks using thermal and RGB data from unmanned aircraft. Agric. Water Manag. 229:105895. doi: 10.1016/j.agwat.2019.105895
Lashford, C., Rubinato, M., Cai, Y., Hou, J., Abolfathi, S., Coupe, S., et al. (2019). SuDS & Sponge cities: a comparative analysis of the implementation of pluvial flood management in the UK and China. Sustainability 11:213. doi: 10.3390/su11010213
Leandro, J., Chen, A. S., Djordjevic, S., and Savic, D. A. (2009). Comparison of 1D/1D and 1D/2D coupled (Sewer/Surface) hydraulic models for urban flood simulation. J. Hydraul. Eng. ASCE 135, 495–504. doi: 10.1061/(asce)hy.1943-7900.0000037
Li, Q., Liang, Q., and Xia, X. (2020). A novel 1D-2D coupled model for hydrodynamic simulation of flows in drainage networks. Adv. Water Resour. 137:103519. doi: 10.1016/j.advwatres.2020.103519
Liang, Q., and Marche, F. (2009). Numerical resolution of well-balanced shallow water equations with complex source terms. Adv. Water Resour. 32, 873–884. doi: 10.1016/j.advwatres.2009.02.010
Liang, Q., Smith, L., and Xia, X. (2016). New prospects for computational hydraulics by leveraging high-performance heterogeneous computing techniques. J. Hydrodyn. 28, 977–985. doi: 10.1016/s1001-6058(16)60699-6
Liang, X., and Cheng, S. (2018). Study on the influence of roadway slope on pavement drainage. Water Wastewater Eng. 54, 5–19. doi: 10.13789/j.cnki.wwe1964.2018.0058
Malarvizhi, K., Kumar, S. V., and Porchelvan, P. (2016). Use of high resolution Google Earth satellite imagery in landuse map preparation for urban related applications. Proc. Technol. 24, 1835–1842. doi: 10.1016/j.protcy.2016.05.231
Martínez, C., Sanchez, A., Toloh, B., and Vojinovic, Z. (2018). Multi-objective evaluation of urban drainage networks using a 1D/2D flood inundation model. Water Resour. Manag. 32, 4329–4343. doi: 10.1007/s11269-018-2054-x
Rossman, L. A. (2010). Storm Water Management Model: User's Manual Version 5.0. Washington, DC: Environmental Protection Agency.
Russo, B., Sunyer, D., Velasco, M., and Djordjević, S. (2015). Analysis of extreme flooding events through a calibrated 1D/2D coupled model: the case of Barcelona (Spain). J. Hydroinform. 17:473. doi: 10.2166/hydro.2014.063
The Ministry of Housing and Urban-Rural Development of the People's Republic of China (2006). GB 50014-2006 Code for Design of Outdoor Wastewater Engineering. Beijing: China Planning Press.
Van Dijk, E., Van der Meulen, J., Kluck, J., and Straatman, J. H. M. (2014). Comparing modelling techniques for analysing urban pluvial flooding. Water Sci. Technol. 69, 305–311. doi: 10.2166/wst.2013.699
Wang, Y., Chen, A. S., Fu, G., Djordjević, S., Zhang, C., and Savić, D. A. (2018). An integrated framework for high-resolution urban flood modelling considering multiple information sources and urban features. Environ. Model. Softw. 107, 85–95. doi: 10.1016/j.envsoft.2018.06.010
Xia, X., Liang, Q., Ming, X., and Hou, J. (2017). An efficient and stable hydrodynamic model with novel source term discretization schemes for overland flow and flood simulations. Water Resour. Res. 53, 3730–3759. doi: 10.1002/2016wr020055
Yu, D., and Coulthard, T. J. (2015). Evaluating the importance of catchment hydrological parameters for urban surface water flood modelling using a simple hydro-inundation model. J. Hydrol. 524, 385–400. doi: 10.1016/j.jhydrol.2015.02.040
Zhang, K., Chao, L., Wang, Q., Huang, Y., Liu, R., Hong, Y., et al. (2019). Using multi-satellite microwave remote sensing observations for retrieval of daily surface soil moisture across China. Water Sci. Eng. 12, 85–97. doi: 10.1016/j.wse.2019.06.001
Keywords: urban flooding, numerical simulation, unavailable drainage pipe, inlet drainage, surface flow
Citation: Li D, Hou J, Xia J, Tong Y, Yang D, Zhang D and Gao X (2020) An Efficient Method for Approximately Simulating Drainage Capability for Urban Flood. Front. Earth Sci. 8:159. doi: 10.3389/feart.2020.00159
Received: 07 January 2020; Accepted: 28 April 2020;
Published: 16 June 2020.
Edited by:
Ke Zhang, Hohai University, ChinaReviewed by:
Juan Pablo Rodríguez Sánchez, University of Los Andes, ColombiaShuliang Zhang, Nanjing Normal University, China
Copyright © 2020 Li, Hou, Xia, Tong, Yang, Zhang and Gao. This is an open-access article distributed under the terms of the Creative Commons Attribution License (CC BY). The use, distribution or reproduction in other forums is permitted, provided the original author(s) and the copyright owner(s) are credited and that the original publication in this journal is cited, in accordance with accepted academic practice. No use, distribution or reproduction is permitted which does not comply with these terms.
*Correspondence: Jingming Hou, jingming.hou@xaut.edu.cn; Junqiang Xia, xiajq@whu.edu.cn