Study on the acoustic emission and thermal infrared signal characteristics of granite with freeze-thaw damage in cycle loading process
 Yufei Liang
 Qingwen Yang
 Ling Zhu
 Tao Jiang1
  Meibeng Gao
- 1State Key Laboratory of Geohazard Prevention and Geoenvironment Protection, Chengdu University of Technology, Chengdu, China
- 2School of Emergency Management, Xihua University, Chengdu, China
Acoustic emission and thermal infrared signals are related to the process of rock breaking. In this paper, the acoustic emission and thermal infrared signals of rock are obtained during the loading process of indoor granite freeze-thaw cycle test and uni-axial compression test. Then the acoustic emission signals sent out during rock breaking are analyzed by short-time Fourier transform to get the peak frequency. infrared radiation thermographic sensor is applied to monitor and record the temperature change on the surface of rock so as to get the influence of thermal infrared radiation characteristics during rock materials deformation and breaking. Under the same axial stress, the samples passing through more freeze-thaw cycles have higher surface temperature. Both acoustic emission and thermal infrared temperature show that tensile failure is the main failure factor to granite samples. As freeze-thaw effect results in more micro fissures inside rock, the granite samples develop in the tendency of large breakage increases and small breakage decreases. This phenomenon shows that freeze-thaw cycle could restrict the heat release of granite sample.
1 Introduction
Rock failure is the main cause to many geological disasters, such as collapse, landsliding and tunnel collapse. Rock failures caused by temperature change and fatigue loading can lead to serious losses (Mateos et al., 2012; Strunden et al., 2015; Cui et al., 2022; Huang et al., 2018; Song et al., 2021). The freeze-thaw deterioration (Nicholson et al., 2000; Bayram, 2012; Freire-Lista et al., 2015; Ghobadi et al., 2015; Gao et al., 2020; Wang et al., 2021; Li et al., 2022) and fatigue (e.g. earthquake and blasting) deterioration (Attewell and Farmer, 1973; Xiao et al., 2011; Zhou et al., 2021; Cui et al., 2021) of various types of rock including sandstone, limestone and granite are widely studied. The joint effect of freeze-thaw-fatigue (FTF) sees worse results in rock deterioration than the singular free-thaw effect or fatigue effect (Shan and Liao, 2002; Cai et al., 2020a; Song et al., 2021).
Acoustic emission signals from the inside of rock are used for identifying where and how many times damage takes place (Zhang et al., 2015; Meng et al., 2018; Yang et al., 2020; Li et al., 2021a). For the thermal effects of thermal infrared wave in electromagnetic radiation wave, it is applicable to separate thermal infrared wave from electromagnetic radiation wave by germanium lens with specific refraction coefficient to show the damage degree of rock (He et al., 2017; Sun et al., 2017; Xiao et al., 2019; Cai et al., 2020b). Measuring energy released by stress-induced rock damage by acoustic emission (AE) and infrared radiation (IR) abnormal phenomena is directly affected by internal cracks or flaws of rock (Zhao and Jiang, 2010). As AE and IR are the products of physical effect, geophysical method can be used to monitor AE and IR and detect the damage degree of rock, for the purpose of forecasting the upcoming rock failure event in geological disaster and tunnel rock mechanical engineering practice.
Most of researchers apply different loading methods and speeds, the average infrared radiation temperature (AIRT) during rock damaging process as well as the transient temperature of rock failure and the variance of successive minus infrared image temperature (VSMIT) in IR and AE tests. They identify AIRT abnormality under high stress in plastic stage as the IR and AE omens of rock damage and find the control effects of stress to IR (He et al., 2010; Gong et al., 2015; Kim et al., 2015; Ma et al., 2016; Li et al., 2021b). AE signal count and AE energy increase when rock stress decreases. But the AE parameters change little before rock cracking (Wu et al., 2016). Correlation dimension of AE sequence would drop all of a sudden before rock cracking, which could be taken to forecast of rock instability under load (Ma et al., 2018a). By virtue of infrared thermal instrument monitoring system and AE monitoring system, some scholars have studied the variation characteristics of AE frequency spectrum, AE distribution and AIRT in the process of rock damage and cracking (Ma et al., 2018b; Li et al., 2018).
Previous studies mainly focus on comparing the response speeds to the same rock damage phenomenon of infrared and acoustic emission, instead of the spatial relationship between them. Infrared and acoustic emission information is of homologous anomalies as both of them are results of damage, which makes it difficult to identify the omens of rock damage correctly by single information source based on the corresponding phenomenon (temporal and spatial) relationship. Besides, acoustic emission signals are easily polluted by outside noise and thermal infrared wave cannot easily position the damage inside rock (Zhang et al., 2021). But the problem can be solved by link up and integrate the two independent information together. In this paper, acoustic emission and thermal infrared techniques are used for mutual complementation. Taking the granite samples gone through freeze-thaw damage as the subject of fatigue test, we collect the acoustic emission and thermal infrared data of samples during the test to analyze and influence of freeze-thaw in early stage on rock fatigue damage.
2 Method
2.1 Test method
The granite for test is taken from the Luanshibao Landslide in Litang County, Sichuan Province, China. It is made into standard cylinder shape of 50 mm × 50 mm × 100 mm, with the high error between both ends smaller than 0.02 mm. The cylinder shaped samples are prepared according to ISRM specifications and provision (ISRM, 2007), meeting the requirements for regular rock mechanical test. Three samples numbered as S1, S2 and S3 are made. The vertical wave speed of rock samples is used to estimate the different damage conditions of samples before test. The vertical wave speeds of rock samples in this paper are 5,099 m/s, 5,086 m/s and 5,032 m/s respectively. The maximum difference between them is only 1.3%, based on which it is concluded that the three samples show the same damage state from the beginning.
2.1.1 Freeze-thaw Test
Put the samples into vacuum context for 30 min first, then make it immersed into distilled water for 1,080 min. After all preparations, free it up at the temperature of −20°C for 6 h before melt it in 20°C water for 6 h. In this way, a 12 h freeze-thaw cycle is completed. And the three samples will be put into cycle for 100 times (S1), 200 times (S2), and 500 times (S3) respectively.
2.1.2 Fatigue Test
After freeze-thaw test, the US MTS815 test machine is applied. Add a 0.5 Hz sine wave, fix the lower limit stress ratio at 0.3, and increase the upper limit stress ratio from 0.4 to 0.7 by the frequency of 0.05 every time. Impose seven loading levels to each sample and cycle 30 times at every level. After each level of cycling, add the stress to the next level at the loading speed of 1 kN/s. When all the seven levels of loading are completed, increase the stress statically at the rate of 1 kN/s until the sample is broken (Figure 1).
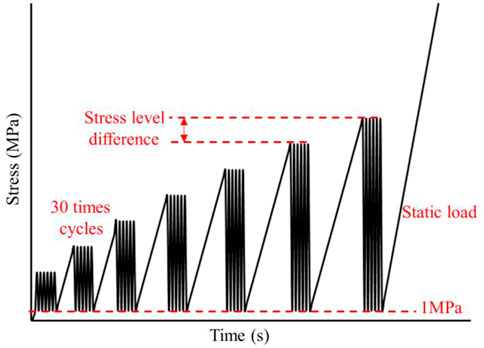
FIGURE 1. Schematic diagram of low-cycle multi-period cyclic loading stress path.
2.2 Monitoring
2.2.1 Thermal Infrared Monitoring
Receive the thermal radiation on the surface of rock with FLIR T1040 IR thermographic sensor produced by FLIR Systems, Inc. The sensor is provided with the resolution ratio of 1,024 × 768, spectrum range of 7.5–14 μm and temperature sensitivity lower than 0.02°C. Convert the radiation energy into temperature (Boltzmann, 1884) by the formula we=εαT4. Wherein, T is temperature (K), we is the general radiation energy at T, ε is radiation coefficient (for gray objects, 0<ε<1, for black ones, ε=1), and α=5.6696×10⁻⁸ W/(m2·K4) is Stefan–Boltzmann constant. Refer to Figure 2 for the schematic diagram of thermal infrared radiation detection.
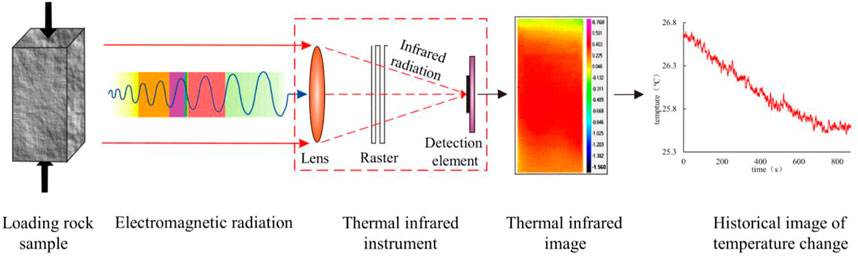
FIGURE 2. Schematic diagram of thermal infrared radiation detection principle (According to Cai, 2020b).
During test, IR thermographic sensor is placed about 1.0 m from sample and any possible impacts over thermal infrared temperature including passing of people shall be completely avoided. Eliminate all light sources producing thermal radiation by all means like letting down curtain and closing windows. Before test, samples shall be put in laboratory for at least 24 h to make their temperature same as the ambient temperature (24°C).
2.2.2 Acoustic Emission Monitoring
The Micro–II Digital AE System acoustic emission sensor produced by Physical Acoustics Corporation (PAC) of the United States is applied for acoustic emission monitoring. Apply petroleum jelly on the surface of sensor before sticking the sensor on the surface of sample. The sensor would transfer the elastic wave produced by rock breaking into electrical signals. The ring count of acoustic emission is the number of electrical signals exceeding threshold. During test, the sampling threshold of acoustic emission is set at 40 dB, pre-amplifier gain set at 40 dB and sampling time interval at 1 μs The test loading monitoring device diagram is shown in Figure 3.

FIGURE 3. Diagram of test loading monitoring device.
2.3 Data processing
Calculate the mean thermal infrared temperature on the surface of sample by formula
Acoustic emission signal is a kind of non-stationary signal which can be analyzed by fast Fourier transform (FFT), a classic method to analyze non-stationary signal (Takai and Mifune, 2002). FFT can convert acoustic emission signals to frequency domain. Before FFT process, wavelet domain denoising shall be conducted first on acoustic emission wave signals (Figure 4A) to get the two dimensional spectrum (Figure 4B). In the spectrum curve, the frequency of the maximum amplitude is taken as the dominant frequency and the frequency with amplitude lower than the dominant frequency but higher than others as the secondary dominant frequency (Jia, 2013).
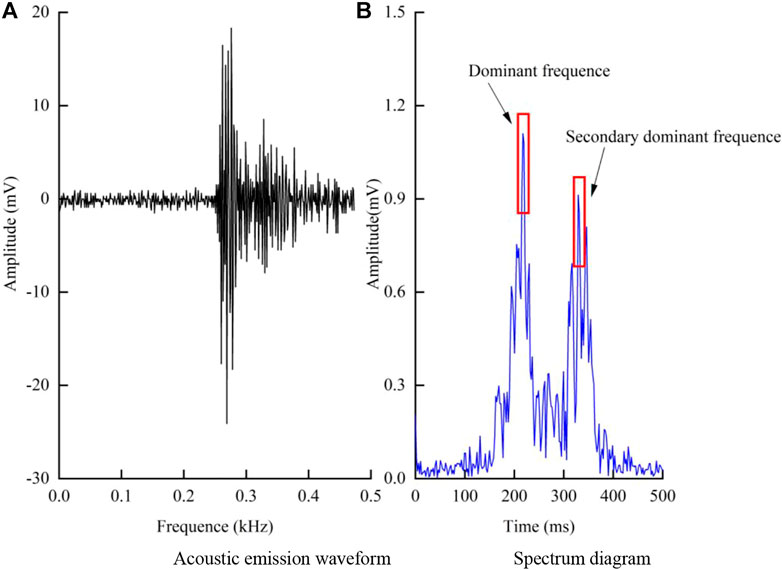
FIGURE 4. Waveform and spectrum of acoustic emission signal. (A) Acoustic emission waveform (B) Spectrum diagram.
Mark the maximum amplitude value in wave form as A, the duration for the process from first exceeding the threshold to the peak amplitude as RT, the times of signal amplitude exceeding the threshold as AE count and the time interval from amplitude first reaching the threshold to lower than the threshold as duration. The ration between RT and A is defined as RA, ration between AE count and RT as average frequency (AF) (Figure 5A). If RA is horizontal ordinate and AF vertical ordinate, the top left corner of Figure 5B is classified as tensile failure and bottom right corner as shear failure. The division line between tensile failure and shear failure is related to material types (JCMS-B5706, 2003).
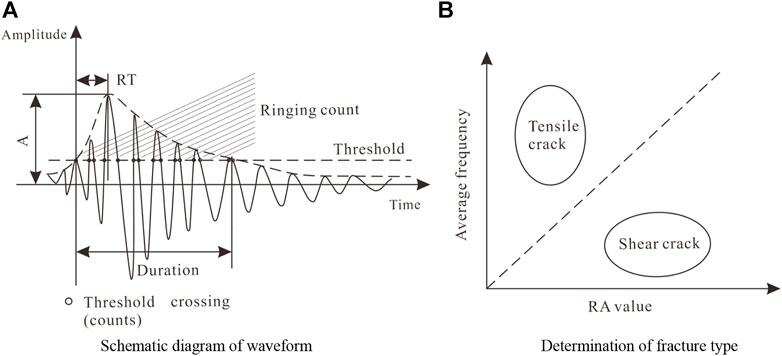
FIGURE 5. Characteristic parameters of acoustic emission signal. (A) Schematic diagram of waveform (B) Determination of fracture type.
3 Results
3.1 Freeze-thaw deformation
The relationship curve between axial and lateral strains of rock and time throughout freeze-thaw cycle process is shown in Figure 6. As temperature drops, both axial and lateral strains increase, which demonstrate that sample has expansion deformation. When the temperature reaches the bottom point, the sample expansion reaches the maximum extent and strain stops increasing. When the temperature rises, both axial and lateral strains drop quickly, which represents that sample shrinks. When the temperature increases to and stops at 25°C, both axial and lateral strains decrease to the minimum value gradually.
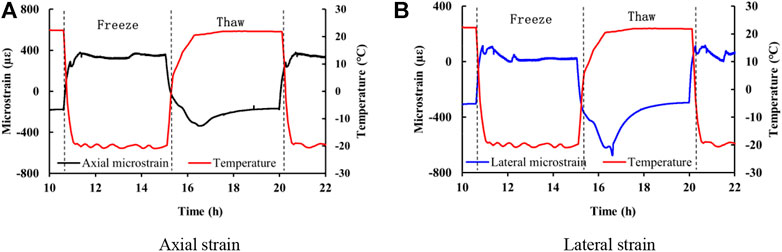
FIGURE 6. The relationship curve between rock microstrain and time under one freeze-thaw cycle (S1). (A) Axial strain (B) Lateral strain.
3.2 Strength and modulus
As the freeze-thaw cycle index of sample increases to 200 from 100, their peak strength decreases from 190 to 168 MPa (Figure 7). In the process of fatigue loading on S1 and S2, the maximum strain is 0.025% and no remarkable deformation occurs (Figure 6). For S3, the peak strength is 71 MPa, and strain suddenly increases by 0.1% after 120 times of cycling. After very short elastic deformation, the peak strength is soon reached during the static loading right after the cycle loading process. Compared with S3 the strain of which decreases gradually with the increasing strain after peak strength, the strains of S1 and S2 quickly drop to the minimum after peak strength. With the increasing of loading-unloading cycle index, the elastic modulus of sample is in linear increase tendency (Figure 8). In the process of freeze-thaw cycle index increasing from 100 to 200, the maximum reduction of sample elastic modulus reaches 20 MPa. And in the section of freeze-thaw cycle index from 200 to 500, the maximum reduction of sample elastic modulus is up to 40 MPa.
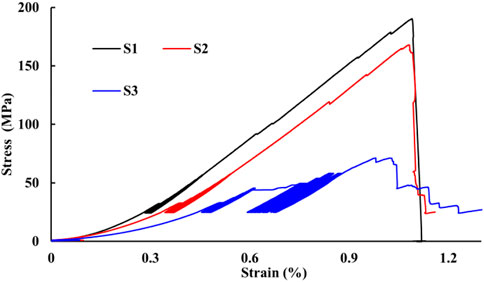
FIGURE 7. Stress-strain curve of granite samples under different freeze-thaw cycles.
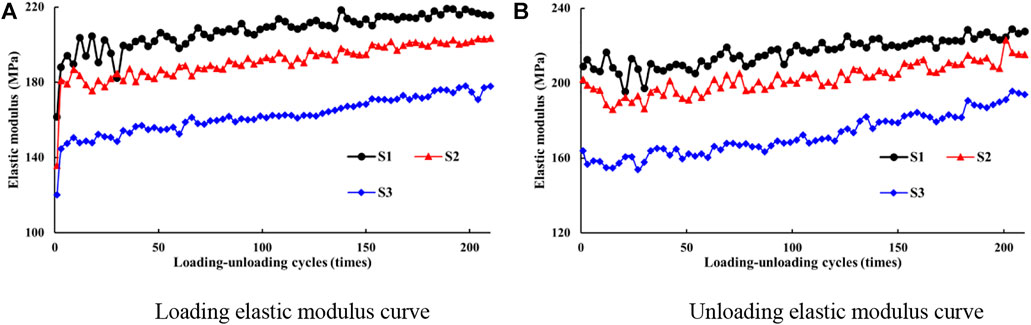
FIGURE 8. Variation of loading and unloading elastic modulus with loading-unloading cycles under different freeze-thaw conditions. (A) Loading elastic modulus curve (B) Unloading elastic modulus curve.
3.3 Infrared thermography and temperature
Figure 9 shows the infrared thermographic changes of S1, S2, and S3 throughout the loading process. For S1, abnormal local high temperature phenomenon is found in four places at 882.7s (Figure 9A). Among them, three places (A1, A2, and A3) are distributed on the rim of sample in dot-like form, while the other one (A4) spreads obliquely up to the center from the rim in linear form, then go on extending to the middle or sample with the width and temperature increasing. The temperature of A4 reaches the peak (30.5°C) at 884.2 s. And then A4 diffuses with the temperature goes down slowly. For S2, the first abnormal high temperature occurs at 865.3 s (B1). After that B1 extends obliquely down to the bottom left. The second abnormality (B2) extending obliquely up is found at 871.4 s (Figure 9B). For S3, the first point is the abnormal low-temperature phenomenon C1 occurs at 793.2 s. Then abnormal low-temperature points C2 and C3 emerge on the upper and lower ends of sample separately. Before sample loading, the temperature on both ends of all samples is slightly lower than the central temperature (about 0.4°C). After loading begins, sample temperature drops gradually, high temperature area shrinks. Final failure of S1 is mainly controlled by the main fracture developed by A4. Final failure of S2 is mainly controlled by the two main fractures developed by B1 and B2. And final failure of S3 is mainly controlled by several cracks (Figure 9C).
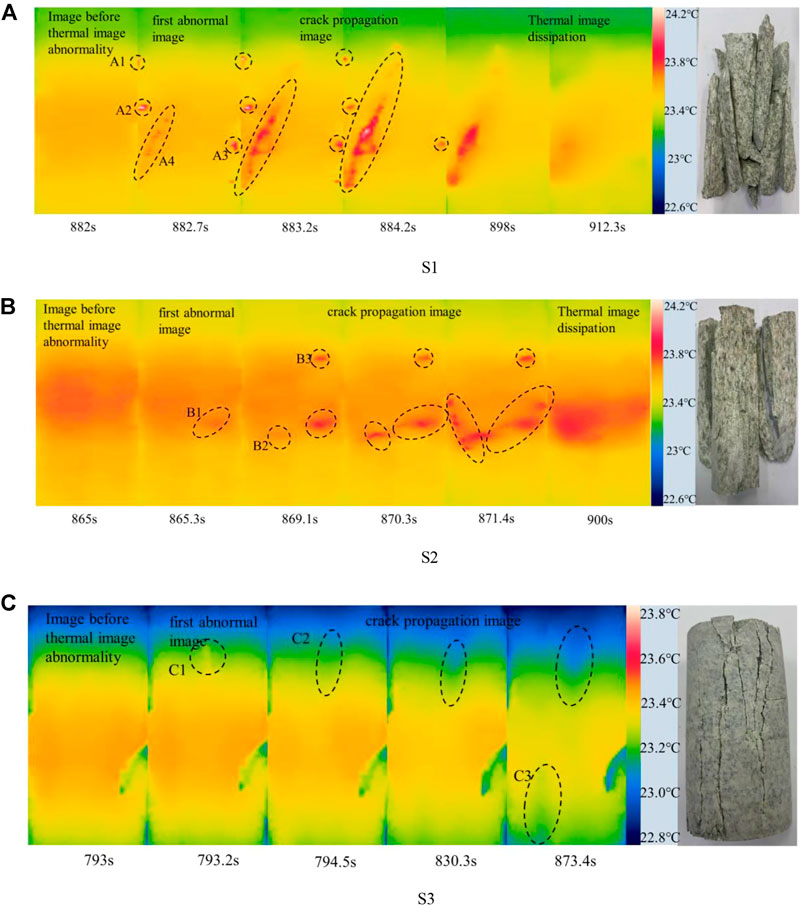
FIGURE 9. Evolution of thermal images at typical moments during granite loading under different freeze-thaw conditions. (A) S1 (B) S2 (C) S3.
Figure 10 displays the axial stress of samples, average surface temperature of samples and changes in acoustic emission ring counts along with time. The three samples (S1, S2, and S3) have a decrease in their temperatures all the time, with the final reductions of 0.58, 0.60, and 1.03°C respectively. Three straight lines with slopes reducing in turn (E1, E2, and E3) could be applied for fitting for the temperature curves of S1 and S2. For S3, its temperature curve could be directly fit by E1 and E3.
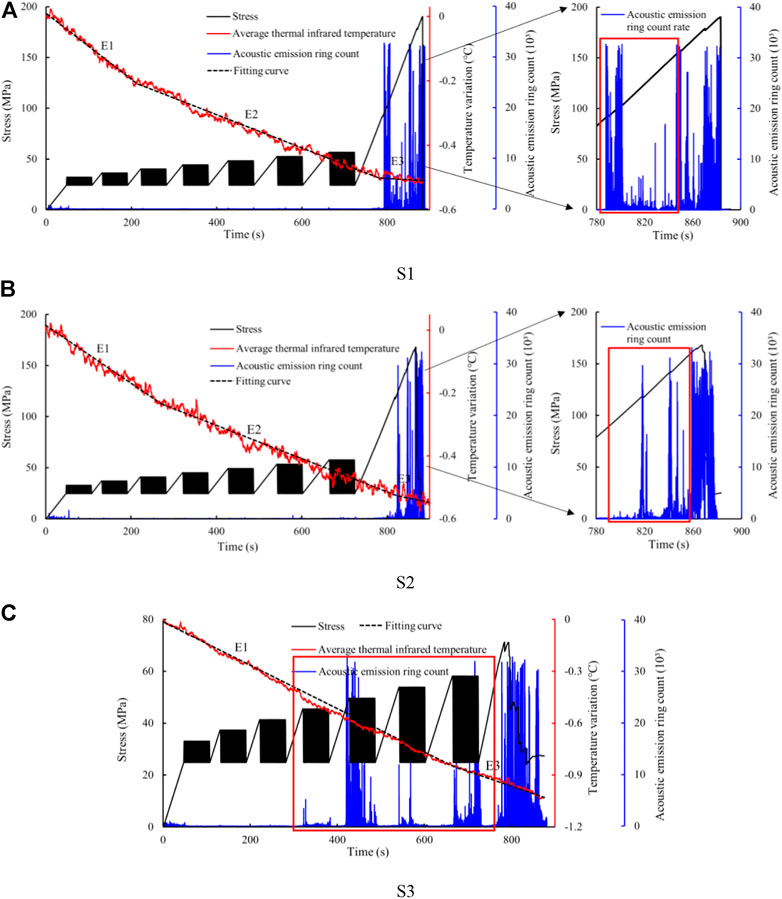
FIGURE 10. Historical images of axial stress, temperature and acoustic emission count of granite samples with time under different freeze-thaw cycles. (A) S1 (B) S2 (C) S3.
3.4 Acoustic emission event
Before fatigue loading, S1, S2 and S3 have produced relatively more ring counts, which are 69.36 × 10³, 82.25 × 10³ and 109 × 103. During fatigue loading, the acoustic emission events of S1 and S2 are rare, mainly concentrated in the static loading stage after fatigue loading. While S3 have four acoustic emission events (at 323, 415, 535, and 665 s) during fatigue loading process with the accumulated ring counts of 331 × 103, 3,371 × 103, 719 × 103 and 1869 × 103 respectively (Figure 10).
The changes in the dominant frequency and secondary dominant frequency of acoustic emission are shown in Figure 11. The acoustic emission frequency are divided into low, medium and high levels, which are 70–150 kHz (yellow area), 150–285 kHz (orange area) and 285–500 kHz (green area) respectively. During fatigue loading, 95% dominant frequency signals and 86% secondary dominant frequency signals of the three samples are distributed in low and high levels. The total number of dominant and secondary dominant frequency signals of S3 is 2.41 times S1 and 1.46 times S2. While the numbers of dominant frequency signals and secondary dominant frequency signals of S3 in medium level are 2.08 times and 3.66 times S1 as well as 1.59 times and 2.94 times S2 respectively. Throughout the whole loading process, the high frequency signal averages of dominant frequency signals of S1, S2, and S3 are 310.6 kHz, 315.4 kHz and 308.5 kHz, the low frequency signal averages of dominant frequency signals are 118.0 kHz, 115.2 kHz and 112.9 kHz, the high frequency signal averages of secondary dominant frequency signals are 312.8 kHz, 316.0 kHz and 311.0 kHz, and the low frequency signal averages of secondary dominant frequency signals are 117.1 kHz, 119.7 kHz and 114.2 kHz, respectively. It can be concluded that there is small difference between the dominant frequency signal average and secondary dominant frequency signal average of the three samples.
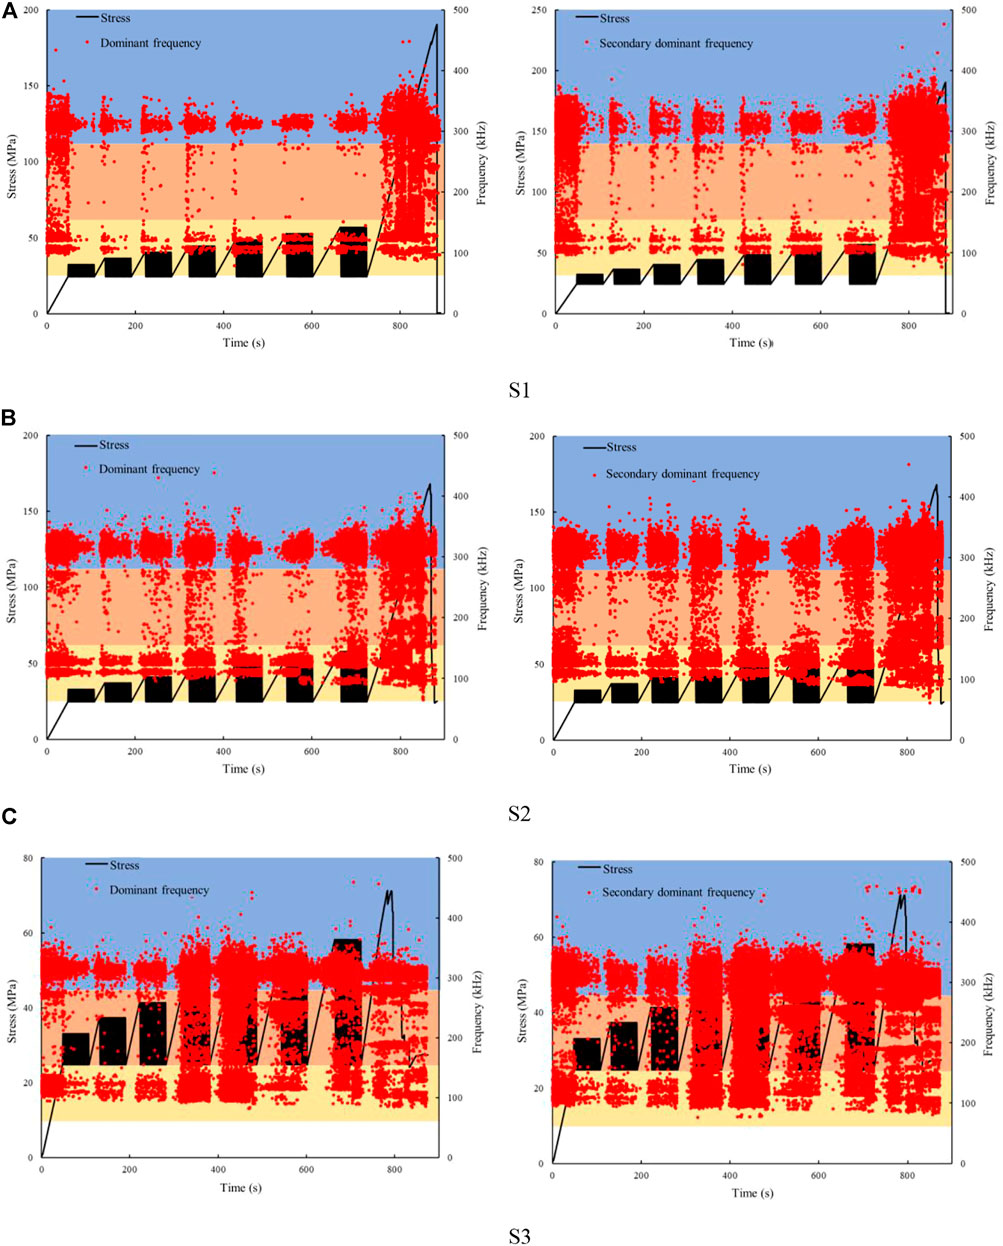
FIGURE 11. Evolution characteristics of dominant frequency and secondary frequency of acoustic emission during the fracture process of granite with different initial freeze-thaw damage. (A) S1 (B) S2 (C) S3.
In the condition of low freeze-thaw time (S1), the number of tensile failure increases quickly in the period of static loading before fatigue loading (Figure 12), then slow down in the fatigue loading and soon grows fast again in the static loading period after fatigue loading. The larger curve rate of S2 than S1 during fatigue stage shows that the tensile failure increment of S2 is remarkably more than S1 during fatigue loading. In the condition of high freeze-thaw time (S3), tensile failure signal starts to increase fast in the middle of fatigue loading. Both S1 and S2 are inactive in shear failure motion throughout the entire fatigue loading period. But S3 has the shear failure signals increase fast in the middle of fatigue loading. However, its tensile failure signals increases faster than its shear failure signals. According to the thermal infrared curve, S3 still absorbs heat in Stage E3, while the slope of its fitted straight line gets smaller.
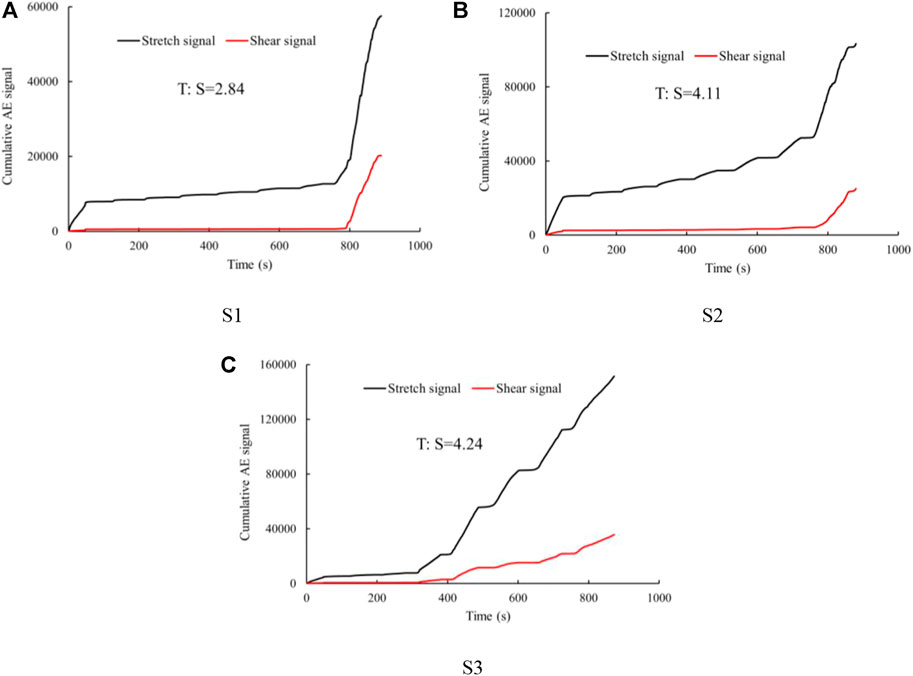
FIGURE 12. Damage classification based on the rise time ratio (RA) value of granite with different freeze-thaw cycles. (A) S1 (B) S2 (C) S3.
The three samples are almost the same in the dominant frequency ratio in medium frequency signals (Figure 13). S1 and S2 are similar in the dominant frequency ratio in their high frequency and low frequency signals. While S3 shows higher high frequency ratio and lower low frequency ratio than S1 and S2. Compared with S1, the medium frequency ratio in secondary dominant frequency signals of S3 increases remarkably, which results in a reduction of low frequency ratio of S3 (Figure 14).
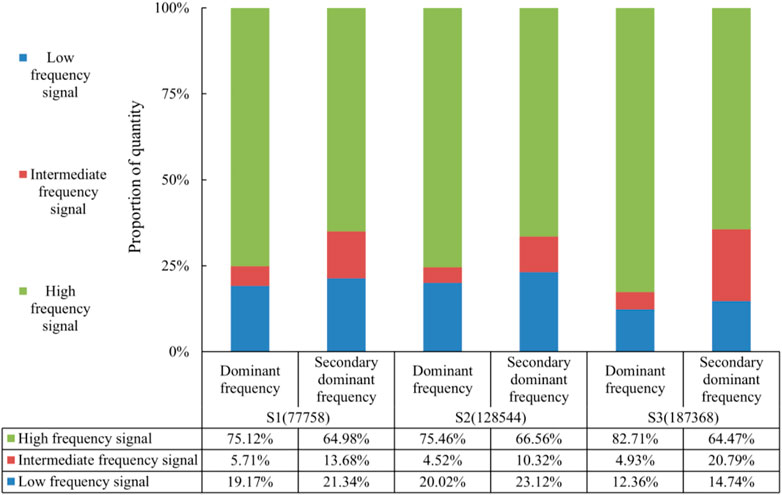
FIGURE 13. The proportion of dominant frequency and secondary frequency of acoustic emission in low, medium and high frequency ranges of different freeze-thaw granites.
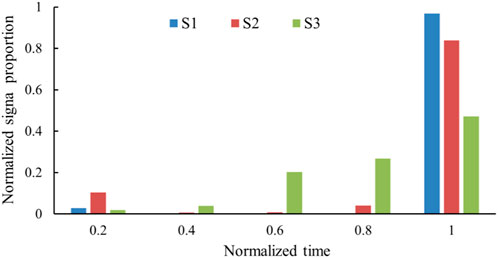
FIGURE 14. Time distribution of shear signal.
4 Discussion
Rock failure is the process of energy transfer, conversion and exchange between rock and outside (Xie et al., 2004; Sun et al., 2020). All data monitored by acoustic emission and thermal infrared instruments come from the energy produced by rock cracking. Rising of temperature represents the shear crack (friction causes heat) and dropping of temperature represents tensile crack (tensile failure absorb heat) (Zhang and Liu, 2011). The value of comprehensive temperature depends on the competition between the heat production by shear failure and heat absorption by tensile failure. In the early static loading stage, the gas (CO2, O2) escapes out of the pores and takes the heat away as the previous defects (e.g., pore and micro cracks, etc.) gradually tends closed (Wu et al., 2006). Rock with the higher porosity could absorb more gas, in the same time, thermal infrared temperature drops more (Wu et al., 2006). The temperature of sample keeps decreasing in the fatigue loading stage, from which it can be concluded that micro tensile failure keeps developing inside sample under the effect of circular loading. Although the friction between cracks and grains would release heat, the heat consumption by the developing and expanding of tensile crack cannot be compensated. A great deal of acoustic emission signals produced by sample during the static loading process after fatigue loading shows that enough elastic energy has been stored inside sample to trigger centralized expansion of numerous cracks (Martin and Chandle., 1994; Song et al., 2019; Zhang et al., 2020). In this period, the downtrend of temperature-time curve of sample is weakened apparently which means that the proportion of shear failure in all failures increases significantly. According to Figure 10, the smaller the slope of fitted line, the more heat released by shear failure.
Acoustic emission spectrum could effectively reflect the failure characteristics of acoustic emission source (Jia et al., 2013; Fan et al., 2020) and peak frequency could reflect the frequency characteristics of signals (Ni and Iwamotoet al, 2002). Large cracks tend to produce low-frequency acoustic emission signals, while micro ones tend to product high-frequency signals found by Ohnaka and Mogi (1982). It can be concluded by testing that freeze-thaw cycle could not only increase the number of acoustic emission signals, but also raise the proportion of high-frequency signals, lower the proportion of low-frequency signals. In other words, freeze-thaw cycle makes rock develop with more large cracks and less small cracks, which may because that freeze-thaw cycle causes more micro cracks inside rock.
If an acoustic emission signal has relatively low RA value or high AF value, it can be judged that the failure mechanism is more likely to be tensile failure (Guzmán et al., 2015). The acoustic emission signals of shear failure usually have relatively low frequency and long duration. For the majority of materials, shear failure usually comes after tensile failure (Chang and Lee, 2004). According to previous researches, the ratio between RA and AF on boundary is taken as 50 (Ohtsu et al., 2010; Guzmán et al., 2015; Shan et al., 2021). The changes in the numbers of rock tensile failure and shear failure events along with test time are shown in Figure 12. For the three samples, the numbers of tensile signals are 57518, 103345, and 151531, the numbers of shear signals are 20220, 25100, and 35777 respectively. With the increasing times of freeze-thaw cycles, the number of AE events raises remarkably, while the ratio of tensile failure events to shear failure events also raises accordingly. All these phenomena show that tensile failure is the major failure type sample. And acoustic emission shows the same main failure type as the thermal infrared temperature.
5 Conclusion
To study the different freeze-thaw effects on rock in early stage, different freeze-thaw fatigue coupling tests are conducted to granite, and thermal infrared thermal imagery and acoustic emission monitoring system are applied to monitor and record the whole loading process. With the proceeding of freeze-thaw cycle, the first abnormal thermal image occurs in advance. According to the acoustic emission signals, it could be known that the number of AE events and tensile crack ratio increase with the freeze-thaw cycles, but the shear crack ratio decreases. Cracks tend to develop into tensile cracks. After analyzing the different IR and AE signals of granite cracking evolution under different freeze-thaw conditions, it is believed that sample failure turns to being controlled by micro cracks from by large-scale cracks with the proceeding of freeze-thaw cycle. For sample have gone through more freeze-thaw cycles, cracks are significantly developed inside, the cracking happens earlier and plenty of acoustic emission signals are released in the middle of loading period.
Data availability statement
The original contributions presented in the study are included in the article/Supplementary Material, further inquiries can be directed to the corresponding authors.
Author contributions
YL did the conceptualization, review, and editing. QY performed data curation and formal analysis. LZ did the methodology, collected the resources, and prepared the original draft. TJ was responsible for data curation and Language. MG did the validation. YL and QY did the investigation and funding acquisition. All authors have read and agreed to the published version of the manuscript.
Funding
This study was partially supported by the National Science Foundation of China (No. 41931296 and 41907254), and the State Key Laboratory of Geohazard Prevention and Geoenvironment Protection Independent Research Project (SKLGP 2021Z014).
Conflict of interest
The authors declare that the research was conducted in the absence of any commercial or financial relationships that could be construed as a potential conflict of interest.
Publisher’s note
All claims expressed in this article are solely those of the authors and do not necessarily represent those of their affiliated organizations, or those of the publisher, the editors and the reviewers. Any product that may be evaluated in this article, or claim that may be made by its manufacturer, is not guaranteed or endorsed by the publisher.
References
Attewell, P. B., and Farmer, I. W. (1973). Fatigue behaviour of rock. Int. J. Rock Mech. Min. Sci. Geomechanics Abstr. 10 (1), 1–9. doi:10.1016/0148-9062(73)90055-7
Bayram, F. (2012). Predicting mechanical strength loss of natural stones after freeze–thaw in cold regions. Cold Reg. Sci. Technol. 83, 98–102. doi:10.1016/j.coldregions.2012.07.003
Boltzmann, L. (1884). Ableitung des Stefan’schen Gesetzes, betreffend die Abhängigkeit der Wärmestrahlung von der Temperatur aus der electromagnetischen Lichttheorie. Ann. Phys. 258, 291–294. doi:10.1002/andp.18842580616
Cai, X., Zhou, Z., Tan, L., Zang, H., and Song, Z. (2020a). Water saturation effects on thermal infrared radiation features of rock materials during deformation and fracturing. Rock Mech. Rock Eng. 53 (11), 4839–4856. doi:10.1007/s00603-020-02185-1
Cai, X., Zhou, Z., Zang, H., and Song, Z. (2020b). Water saturation effects on dynamic behavior and microstructure damage of sandstone: Phenomena and mechanisms. Eng. Geol. 276, 105760. doi:10.1016/j.enggeo.2020.105760
Chang, S. H., and Lee, C. I. (2004). Estimation of cracking and damage mechanisms in rock under triaxial compression by moment tensor analysis of acoustic emission. Int. J. Rock Mech. Min. Sci. 41 (7), 1069–1086. doi:10.1016/j.ijrmms.2004.04.006
Cui, S., Pei, X., Jiang, Y., Wang, G., Fan, X., Yang, Q., et al. (2021). Liquefaction within a bedding fault: Understanding the initiation and movement of the Daguangbao landslide triggered by the 2008 Wenchuan Earthquake (Ms= 8.0). Eng. Geol. 295, 106455. doi:10.1016/j.enggeo.2021.106455
Cui, S., Wu, H., Pei, X., Yang, Q., Huang, R., and Guo, B. (2022). Characterizing the spatial distribution, frequency, geomorphological and geological controls on landslides triggered by the 1933 Mw 7.3 Diexi Earthquake, Sichuan, China. Geomorphology 403, 108177. doi:10.1016/j.geomorph.2022.108177
Freire-Lista, D. M., Fort, R., and Varas-Muriel, M. J. (2015). Freeze–thaw fracturing in building granites. Cold Reg. Sci. Technol. 113, 40–51. doi:10.1016/j.coldregions.2015.01.008
Gao, F., Cao, S., Zhou, K., Lin, Y., and Zhu, L. (2020). Damage characteristics and energy-dissipation mechanism of frozen–thawed sandstone subjected to loading. Cold Reg. Sci. Technol. 169, 102920. doi:10.1016/j.coldregions.2019.102920
Ghobadi, M. H., and Babazadeh, R. (2015). Experimental studies on the effects of cyclic freezing–thawing, salt crystallization, and thermal shock on the physical and mechanical characteristics of selected sandstones. Rock Mech. Rock Eng. 48 (3), 1001–1016. doi:10.1007/s00603-014-0609-6
Gong, W., Peng, Y., Sun, X., He, M., Zhao, S., Chen, H., et al. (2015). Enhancement of low-contrast thermograms for detecting the stressed tunnel in horizontally stratified rocks. Int. J. Rock Mech. Min. Sci. 74, 69–80. doi:10.1016/j.ijrmms.2014.12.002
Guzmán, C., Torres, D., Hucailuk, C., and Filipussi, D. (2015). Analysis of the acoustic emission in a reinforced concrete beam using a four points bending test. Procedia Mater. Sci. 8, 148–154. doi:10.1016/j.mspro.2015.04.058
He, M., Jia, X., Gong, W., and Faramarzi, L. (2010). Physical modeling of an underground roadway excavation in vertically stratified rock using infrared thermography. Int. J. Rock Mech. Min. Sci. 47 (7), 1212–1221. doi:10.1016/j.ijrmms.2010.06.020
He, Y., and Kusiak, A. (2017). Performance assessment of wind turbines: Data-derived quantitative metrics. IEEE Trans. Sustain. Energy 9 (1), 65–73. doi:10.1109/TSTE.2017.2715061
Huang, S., Liu, Q., Liu, Y., Kang, Y., Cheng, A., and Ye, Z. (2018). Frost heaving and frost cracking of elliptical cavities (fractures) in low-permeability rock. Eng. Geol. 234, 1–10. doi:10.1016/j.enggeo.2017.12.024
ISRM (2007). The complete ISRM suggested methods for rock characterization, testing and monitoring: 1974–2006. Turkey: ISRM Turkish National Group and the ISRM. doi:10.2113/gseegeosci.15.1.47
JCMS-B5706, (2003). Monitoring method for active cracks in concrete by acoustic emission. Fed. Constr. Mat. Ind. Jpn., 23–28.
Jia, X., N. (2013). Experimental study on acoustic emission Eigen-frequency spectrum features of strain bursts. Beijing, China: University of Mining and Technology.
Kim, J. S., Lee, K. S., Cho, W. J., Choi, H. J., and Cho, G. C. (2015). A comparative evaluation of stress–strain and acoustic emission methods for quantitative damage assessments of brittle rock. Rock Mech. Rock Eng. 48 (2), 495–508. doi:10.1007/s00603-014-0590-0
Li, H., Deng, J., Feng, P., Pu, C., Arachchige, D. D., and Cheng, Q. (2021a). Short-term nacelle orientation forecasting using bilinear transformation and ICEEMDAN framework. Front. Energy Res. 9, 780928. doi:10.3389/fenrg.2021.780928
Li, H., Deng, J., Yuan, S., Feng, P., and Arachchige, D. D. (2021b). Monitoring and identifying wind turbine generator bearing faults using deep belief network and EWMA control charts. Front. Energy Res. 9, 799039. doi:10.3389/fenrg.2021.799039
Li, H., He, Y., Xu, Q., Deng, J., Li, W., and Wei, Y. (2022). Detection and segmentation of loess landslides via satellite images: A two-phase framework. Landslides 19 (3), 673–686. doi:10.1007/s10346-021-01789-0
Li, Z., Cheng, F., Wei, Y., Cao, K., Zhang, X., Zhang, Y., et al. (2018). Study on coal damage evolution and surface stress field based on infrared radiation temperature. J. Geophys. Eng. 15 (5), 1889–1899. doi:10.1088/1742-2140/aabf1f
Ma, L., and Sun, H. (2018a). Spatial-temporal infrared radiation precursors of coal failure under uniaxial compressive loading. Infrared Phys. Technol. 93, 144–153. doi:10.1016/j.infrared.2018.07.034
Ma, L., Sun, H., Zhang, Y., Hu, H., and Zhang, C. (2018b). The role of stress in controlling infrared radiation during coal and rock failures. Strain 54 (6), e12295. doi:10.1111/str.12295
Ma, L., Sun, H., Zhang, Y., Zhou, T., Li, K., and Guo, J. (2016). Characteristics of infrared radiation of coal specimens under uniaxial loading. Rock Mech. Rock Eng. 49 (4), 1567–1572. doi:10.1007/s00603-015-0780-4
Martin, C. D., and Chandler, N. A. (1994). The progressive fracture of Lac du Bonnet granite. Int. J. Rock Mech. Min. Sci. Geomechanics Abstr. 31 (6), 643–659. doi:10.1016/0148-9062(94)90005-1
Mateos, R. M., García-Moreno, I., and Azañón, J. M. (2012). Freeze–thaw cycles and rainfall as triggering factors of mass movements in a warm mediterranean region: The case of the tramuntana range (majorca, Spain). Landslides 9 (3), 417–432. doi:10.1007/s10346-011-0290-8
Meng, Q., Zhang, M., Han, L., Pu, H., and Chen, Y. (2018). Acoustic emission characteristics of red sandstone specimens under uniaxial cyclic loading and unloading compression. Rock Mech. Rock Eng. 51 (4), 969–988. doi:10.1007/s00603-017-1389-6
Ni, Q. Q., and Iwamoto, M. (2002). Wavelet transform of acoustic emission signals in failure of model composites. Eng. Fract. Mech. 69 (6), 717–728. doi:10.1016/S0013-7944(01)00105-9
Nicholson, D. T., and Nicholson, F. H. (2000). Physical deterioration of sedimentary rocks subjected to experimental freeze–thaw weathering. Earth Surf. Process. Landf. 25 (12), 1295–1307. doi:10.1002/1096-9837(200011)25:12<1295::AID-ESP138>3.0.CO;2-E
Ohnaka, M., and Mogi, K. (1982). Frequency characteristics of acoustic emission in rocks under uniaxial compression and its relation to the fracturing process to failure. J. Geophys. Res. 87 (B5), 3873–3884. doi:10.1029/JB087iB05p03873
Ohtsu, M. (2010). Recommendation of RILEM TC 212-ACD: Acoustic emission and related NDE techniques for crack detection and damage evaluation in concrete*. Mat. Struct. 43 (9), 1183–1186. doi:10.1617/s11527-010-9639-z
Shan, K., Zhang, Y., Zheng, Y., Cheng, Y., and Yang, Y. (2021). Effect of fault distribution on hydraulic fracturing: Insights from the laboratory. Renew. Energy 163, 1817–1830. doi:10.1016/j.renene.2020.10.083
Shan, Y., and Liao, K. (2002). Environmental fatigue behavior and life prediction of unidirectional glass–carbon/epoxy hybrid composites. Int. J. Fatigue 24 (8), 0–859. doi:10.1016/S0142-1123(01)00210-9
Song, Z., Konietzky, H., and Herbst, M. (2019). Three-dimensional particle model based numerical simulation on multi-level compressive cyclic loading of concrete. Constr. Build. Mat. 225, 661–677. doi:10.1016/j.conbuildmat.2019.07.260
Song, Z., Wang, Y., Konietzky, H., and Cai, X. (2021). Mechanical behavior of marble exposed to freeze-thaw-fatigue loading. Int. J. Rock Mech. Min. Sci. 138, 104648. doi:10.1016/j.ijrmms.2021.104648
Strunden, J., Ehlers, T. A., Brehm, D., and Nettesheim, M. (2015). Spatial and temporal variations in rockfall determined from TLS measurements in a deglaciated valley, Switzerland. J. Geophys. Res. Earth Surf. 120 (7), 1251–1273. doi:10.1002/2014JF003274
Sun, H., Liu, X. L., Zhang, S. G., and Nawnit, K. (2020). Experimental investigation of acoustic emission and infrared radiation thermography of dynamic fracturing process of hard-rock pillar in extremely steep and thick coal seams. Eng. Fract. Mech. 226, 106845. doi:10.1016/j.engfracmech.2019.106845
Sun, H., Ma, L., Adeleke, N., and Zhang, Y. (2017). Background thermal noise correction methodology for average infrared radiation temperature of coal under uniaxial loading. Infrared Phys. Technol. 81, 157–165. doi:10.1016/j.infrared.2017.01.001
Takai, N., and Mifune, Y. (2002). Digital watermarking by a holographic technique. Appl. Opt. 41 (5), 865–873. doi:10.1364/AO.41.000865
Wang, Y., Gao, S. H., Li, C. H., and Han, J. Q. (2021). Energy dissipation and damage evolution for dynamic fracture of marble subjected to freeze-thaw and multiple level compressive fatigue loading. Int. J. Fatigue 142, 105927. doi:10.1016/j.ijfatigue.2020.105927
Wu, X., Gao, X., Zhao, K., Liu, J., and Liu, X. (2016). Abnormality of transient it in the process of rock failure. Chin. J. Rock Mech. Eng. 35 (8), 1578–1594. (In Chinese). doi:10.13722/j.cnki.jrme.2015.1052
WuL Liu, S., Wu, Y., and Wang, C. (2006). Precursors for rock fracturing and failure—Part II: IRR T-curve abnormalities. Int. J. Rock Mech. Min. Sci. 43 (3), 483–493. doi:10.1016/j.ijrmms.2005.09.001
Fan, X., Li, S., Chen, X., and Guo, Y. (2020). Fracture behaviour analysis of the full‐graded concrete based on digital image correlation and acoustic emission technique. Fatigue Fract. Eng. Mat. Struct. 43 (6), 1274–1289. doi:10.1111/ffe.13222
Xiao, F., He, J., Liu, Z., Shen, Z., and Liu, G. (2019). Analysis on warning signs of damage of coal samples with different water contents and relevant damage evolution based on acoustic emission and infrared characterization. Infrared Phys. Technol. 97, 287–299. doi:10.1016/j.infrared.2019.01.007
Xiao, J. Q., Feng, X. T., Ding, D. X., and Jiang, F. L. (2011). Investigation and modeling on fatigue damage evolution of rock as a function of logarithmic cycle. Int. J. Numer. Anal. Methods Geomech. 35 (10), 1127–1140. doi:10.1002/nag.946
Xie, H., Peng, R., and Ju, Y. (2004). Energy dissipation of rock deformation and fracture. Chin. J. Rock Mech. Eng. 23 (21), 3565–3570. (In Chinese). doi:10.1016/j.jnucmat.2004.03.002
Yang, J., Mu, Z., and Yang, S. (2020). Experimental study of acoustic emission multi-parameter information characterizing rock crack development. Eng. Fract. Mech. 232, 107045. doi:10.1016/j.engfracmech.2020.107045
Zhang, G. K., Li, H. B., Wang, M. Y., and Li, X. F. (2020). Crack initiation of granite under uniaxial compression tests: A comparison study. J. Rock Mech. Geotechnical Eng. 12 (3), 656–666. doi:10.1016/j.jrmge.2019.07.014
Zhang, Y., and Liu, S. J. (2011). Thermal radiation temperature field variation of hole rock in loading process. Rock Soil Mech. 32 (4), 1013–1017. (In Chinese). doi:10.16285/j.rsm.2011.04.003
Zhang, Y., Zhou, B., Yu, F., and Chen, C. (2021). Cluster analysis of acoustic emission signals and infrared thermography for defect evolution analysis of glass/epoxy composites. Infrared Phys. Technol. 112, 103581. doi:10.1016/j.infrared.2020.103581
Zhang, Z., Zhang, R., Xie, H., Liu, J., and Were, P. (2015). Differences in the acoustic emission characteristics of rock salt compared with granite and marble during the damage evolution process. Environ. Earth Sci. 73 (11), 6987–6999. doi:10.1007/s12665-015-4406-7
Zhao, Y., and Jiang, Y. (2010). Acoustic emission and thermal infrared precursors associated with bump-prone coal failure. Int. J. Coal Geol. 83 (1), 11–20. doi:10.1016/j.coal.2010.04.001
Keywords: granite, acoustic emission, thermal infrared, freeze-thaw cycle, damage
Citation: Liang Y, Yang Q, Zhu L, Jiang T and Gao M (2022) Study on the acoustic emission and thermal infrared signal characteristics of granite with freeze-thaw damage in cycle loading process. Front. Earth Sci. 10:1002888. doi: 10.3389/feart.2022.1002888
Received: 25 July 2022; Accepted: 15 August 2022;
Published: 15 September 2022.
Edited by:
Jingren Zhou, Sichuan University, ChinaReviewed by:
Dongming Gu, China University of Geosciences Wuhan, ChinaYong Zheng, Chongqing Jiaotong University, China
Copyright © 2022 Liang, Yang, Zhu, Jiang and Gao. This is an open-access article distributed under the terms of the Creative Commons Attribution License (CC BY). The use, distribution or reproduction in other forums is permitted, provided the original author(s) and the copyright owner(s) are credited and that the original publication in this journal is cited, in accordance with accepted academic practice. No use, distribution or reproduction is permitted which does not comply with these terms.
*Correspondence: Qingwen Yang, yangqingwen1991@outlook.com