Energy Evolution and Acoustic Emission Characteristics of Uniaxial Compression Failure of Anchored Layered Sandstone
 Yang Yu1
  Guang-Liang Feng
 Hao-Sen Guo
- 1Key Laboratory of Geotechnical Engineering Infrastructure and Safety Control, East China Jiaotong University, Nanchang, China
- 2State Key Laboratory of Geomechanics and Geotechnical Engineering, Institute of Rock and Soil Mechanics, Chinese Academy of Sciences, Wuhan, China
- 3Hubei Key Laboratory of Disaster Prevention and Mitigation, China Three Gorges University, Yichang, China
To study the energy evolution and acoustic emission characteristics of layered sandstone under anchorage in the process of deformation and failure, the sandstone samples from Chuxiong Yi Autonomous Prefecture, Yunnan Province were selected for uniaxial compression testing. The energy evolution in the process of sandstone failure and the spatial fractal characteristics of acoustic emission events in the process of deformation and failure were investigated. Research results show that anchoring can make layered sandstone store more energy, the stored energy first increases, then decreases with the increase of bedding angle; the B value of sandstone under anchorage is generally higher than that of unanchored sandstone in the whole deformation and failure process, and the continuous decline in B value can be used to indicate a precursor to instability and failure; under the action of anchoring, the D value of sandstone (its fractal dimension) also increases, then decreases with the increase of bedding angle. The D value changes within [2, 3]. At a given bedding angle, the D value of anchored sandstone is greater than that of unanchored sandstone, the D value of 30° anchored sandstone increased the most (by 12.33%); the maximum D value occurred in 45° anchored sandstone (reaching 2.72) and the spatial distribution of acoustic emission events and damage of sandstone under anchorage is also more uniform; under increasing stress, the number of acoustic emission events is less widely distributed in the early stage and more densely distributed in the later stage. The growth rate of the D value varies across different peak stress ranges, which is more significant under the action of anchorage. The acoustic emission event counts grow evenly and slowly in the space, and the toughness of sandstone is improved to a certain extent under the action of anchorage.
Introduction
China’s infrastructure is developing apace and the demand for traffic efficiency between cities is also increasing. Therefore, tunnels are often needed to be built in mountainous areas to shorten journeys. Various tunnel projects are planned, are under construction, and have been built (Feng et al., 2015; Feng et al., 2022; Yu et al., 2021). Tunnels often cross layered rock mass with obvious layered structure and significant anisotropy (Song et al., 2020; Yan et al., 2020), and the internal cracks of layered rock mass are further developed under the action of vibration and other external loads during tunnel construction, resulting in the continuous accumulation of internal damage and rock failure. For complex layered rock mass, anchoring technology is often used to strengthen the rock mass. Therefore, it is of great significance to evaluate the stability of layered sandstone and provide precursory information before the failure of layered sandstone by studying the energy evolution law and acoustic emission characteristics of underlying sandstone in the process of deformation and failure (Li, 2017; Li et al., 2020; Li et al., 2021a; Li et al., 2021b). It is necessary to study the energy evolution and acoustic emission variation characteristics of sandstone with different bedding planes during deformation and failure under anchorage.
Many scholars at home and abroad have done a lot of research on the anchorage mechanism of layered rock mass (Kang 2014; Cai et al., 2015; Zhang et al., 2016). Through theoretical analysis, indoor simulation test and in-situ support test, they have conducted a lot of research on the bolt load transfer mechanism and bolt anchorage effect in layered rock mass and accumulated rich experience. To a certain extent, it deepens the understanding of anchorage mechanism to the reinforcement mechanism of layered rock mass. At present, scholars have investigated the evolution of internal energy dissipation and transfer during different types of rock deformation and failure under different stress paths (Ma et al., 2020; Zhang et al., 2021; Yang et al., 2019). The research shows that the rock exchanges material and energy with the outside world all the time during its deformation and failure, which is embodied in an energy dissipation evolution process. The internal relationship between energy dissipation, energy release, and rock strength in the process of rock deformation and failure was studied by energy theory (Gao et al., 2020). The energy mechanism of rock damage was explored based on the triaxial cyclic compression test. The damage variable used to describe the damage evolution process of rock was established through the study of the increment of dissipated energy (Geng and Cao, 2020; Wu et al., 2019). With the local deformation and damage of rock, the phenomenon of energy release and propagation in the form of elastic waves was called acoustic emission. The location information of acoustic emission events in rock was obtained through the reception and processing of elastic wave data by an acoustic emission monitoring system, and the characteristics of acoustic emission parameters in the process of rock failure were used to study the internal damage evolution in rock (Meng et al., 2019; Chen et al., 2021; Liu et al., 2021). Through the monitoring and analysis of the evolution and development of internal micro-cracks and macro-cracks based on the characteristics of acoustic emission parameters in the process of rock failure, the strain-concentration area was found to mainly accumulate and expand on both sides of the crack (Tang et al., 2020; Wang et al., 2020). Through uniaxial or triaxial compression tests of different kinds of rocks, supplemented by acoustic emission monitoring system, the spatial damage distribution and deformation and failure characteristics of rocks were investigated, and their progressive failure characteristics were explored in cyclic loading and unloading tests (He et al., 2021; Li et al., 2021; Zhang et al., 2021).
To sum up, the above research mainly focuses on the research of mechanical anchorage mechanism, energy evolution law and acoustic emission parameters in the deformation and failure process of layered rock. There are few studies on the evaluation of layered rock mass stability under the action of anchor and the precursory information before the failure of layered sandstone, and the disasters caused by bedding structure to engineering rock mass are still common. Therefore, based on the uniaxial compression test, a comparative study of anchored sandstone and unanchored sandstone was investigated, and the energy evolution, acoustic emission characteristics, and spatial fractal characteristics of acoustic emission events in the deformation and failure process of sandstone with five bedding angles of 0°, 30°, 45°, 60°, and 90° were explored. This study has important application value for revealing the damage and instability mechanism of layered rock mass with similar properties in practical engineering and providing the precursory information and failure characteristics of underlying sandstone before failure.
Test Preparation and Test Scheme
Rock Sample Preparation and Bolt Selection
The yellow sandstone samples selected for the test were taken from Chuxiong Yi Autonomous Prefecture, Yunnan Province, China. As shown in Figure 1, the bedding angles of 0°, 30°, 45°, 60°, and 90° were drilled on site; according to the method suggested by the International Society for Rock Mechanics, the rock sample was made into a cylindrical sample with a height of 100 mm and a diameter of 50 mm. Both ends and sides of the rock sample were polished to ensure that the unevenness and non-perpendicularity were less than 0.02 mm. After the preparation of rock samples, ZT802 non-metallic ultrasonic testing analyzer (Figure 2) was used to measure the wave velocity of each rock sample three times at different positions at both ends of each sample, before taking the average value, having eliminated outliers.
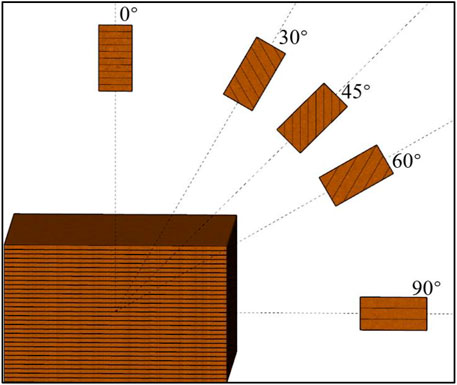
FIGURE 1. Schematic diagram of rock sample preparation.
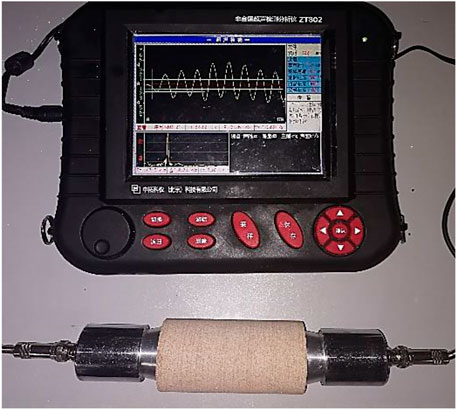
FIGURE 2. ZT802 non-metal ultrasonic testing analyzer.
The bolt material is 45 steel with similar mechanical parameters to an engineering bolt, which is processed into a screw with strength grade of 8.8. The comparison results between the mechanical parameters and the engineering bolt are listed in Table 1.

TABLE 1. Mechanical parameters of 45 steel bolt and an engineering bolt.
Referring to the design parameters such as bolt diameter of 16–25 mm and row spacing of 0.5–1.0 m in the actual engineering bolt support design, a bolt setting with a diameter of 30 mm at a row spacing of 0.6 m was selected for physical simulation. Laboratory tests were applied to bolts with a diameter of 3 mm, the bolt distance from the two end faces is 20 mm and the inter-row distance is 60 mm for purposes of simulation. The geometric similarity ratio of bolt diameter and bolt spacing is 10:1. The schematic diagram of anchored rock sample and bolt position is shown in Figure 3.
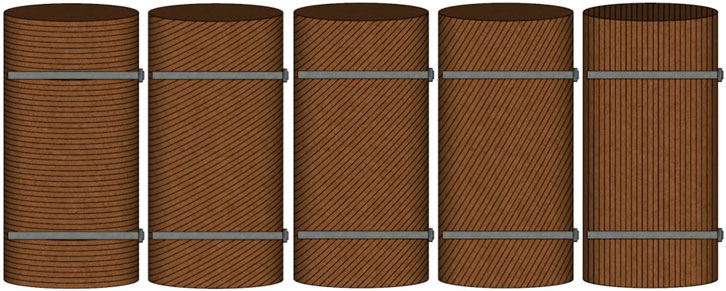
FIGURE 3. Schematic diagram of anchor rock sample and anchor bolt position.
Test Equipment and Test Scheme
The energy evolution and acoustic emission characteristics of bedding sandstone under anchorage were measured by conventional uniaxial compression. Rock samples were divided into unanchored and anchored at both ends. When installing the anchor rod, a hole with a diameter of 4 mm in combination with the position was drilled, as shown in Figure 3. After verifying that there was no debris in the hole, we injected an anchoring agent, and then slowly inserted the bolt (with its nut) into the hole and used a torque wrench to apply a 0.5-kN preload to the nut. After the preparation of anchored sandstone, a ZT802 non-metallic ultrasonic testing analyzer was used to measure the same wave velocity of each rock sample, and outliers were eliminated. During the test, three groups of parallel tests were conducted for each rock sample to improve the authenticity of the test data.
The conventional uniaxial compression test adopts the ZTRE-210 microcomputer-controlled rock triaxial test system, accompanied by the 8-channel Micro-II Express Digital AE System acoustic emission monitoring system to collect the acoustic emission information during compression loading of the rock specimens. The schematic diagram of the test equipment is shown in Figure 4, and the layout position of the acoustic emission sensor on the rock sample is illustrated in Figure 5. The tests were load-controlled at a rate of 0.5 kN/s until the rock sample had been damaged. Through the test, the average values of the key parameters of the rock samples are listed (Tables 2, 3).
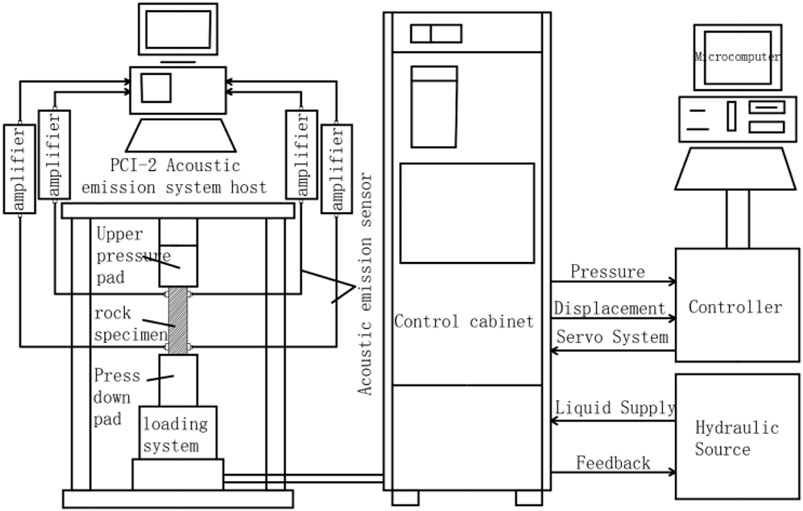
FIGURE 4. Schematic diagram of the test equipment.
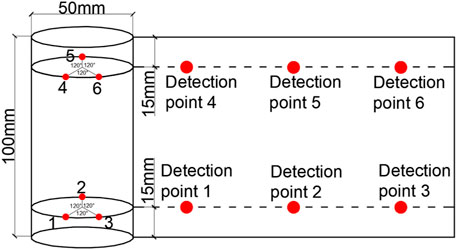
FIGURE 5. Layout of an acoustic emission probe.
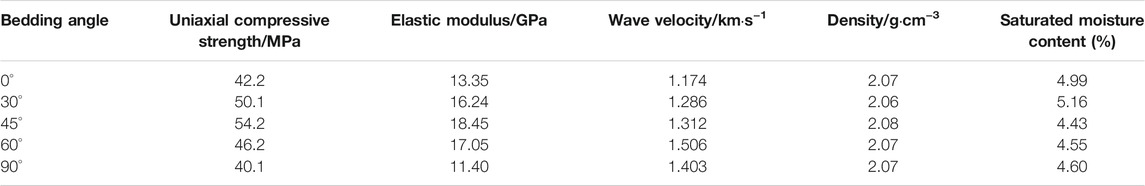
TABLE 2. Average value of key parameters of unanchored rock samples.
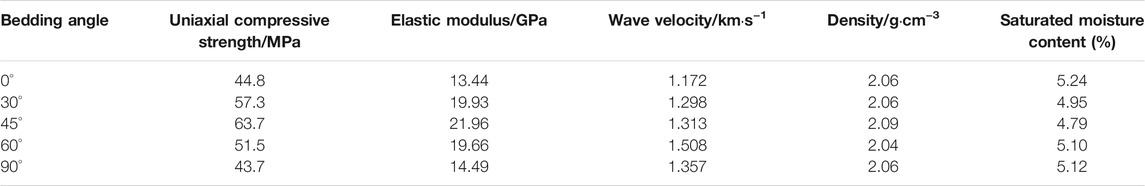
TABLE 3. Average value of key parameters of anchored rock samples.
Analysis of Energy Evolution in Rock Specimens
Energy Calculation
The study of energy theory shows that the essence of rock deformation and failure process is the dissipation and release of internal energy under external load. Instability failure will occur when the internal energy is suddenly released. The internal stored energy before rock failure corresponds to the total input energy W of the uniaxial compression test press, During uniaxial loading, part of the energy stored in the rock will be stored in the form of elastic strain, which is called releasing elastic strain energy Ws, and the other part is mainly dissipated in the form of irreversible plastic deformation and damage to the rock, which is called dissipative strain energy Wd. Assuming that the experimental system has no energy exchange with the outside world and ignores the kinetic energy loss during instability failure, the relationships between total input strain energy W, releasable elastic strain energy Ws and dissipated strain energy Wd are given by:
where W = the total input energy; Ws = the elastic strain energy; Wd = the dissipative strain energy;
Analysis of Energy Dissipation and Transfer in Rock Specimens
According to Formulae 1, 2, 3, the relationship curves of input strain energy, elastic strain energy, dissipated strain energy, and the ratio of dissipated energy to elastic energy of unanchored and anchored layered sandstone were calculated (Figures 6, 7): Because the test was load-controlled and the rock was brittle rock, there was no post-peak stage, so the pre-peak stage of rock sample was selected for energy calculation in the present work. Limited by the length of the article, we only analyzed the energy dissipation and transfer in layered sandstone at 45° and 90° in anchored and unanchored conditions (other layered sandstone samples show similar energy evolution trends).
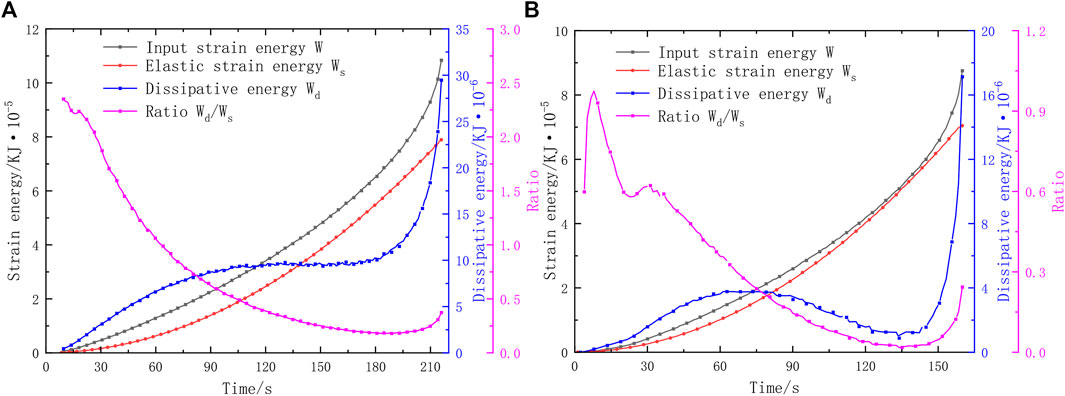
FIGURE 6. Energy evolution in layered sandstone without an anchor: (A) No anchor 45°; (B) No anchor 90°.
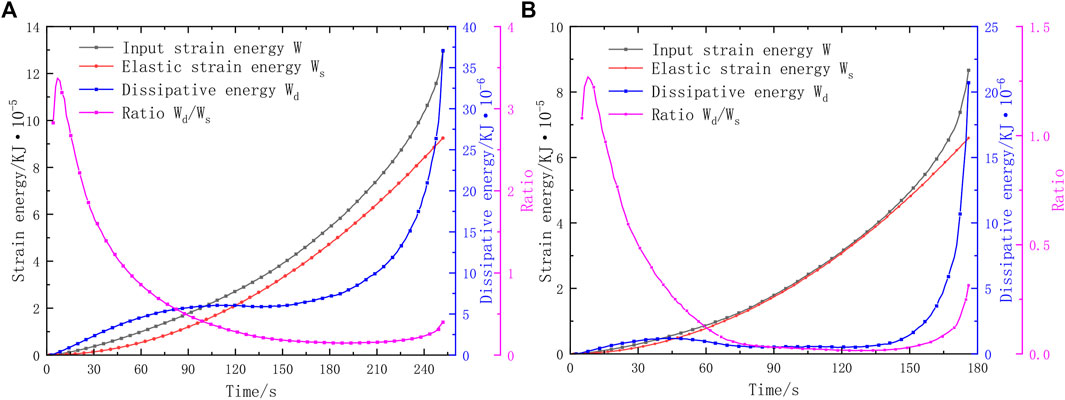
FIGURE 7. Energy evolution in layered sandstone with an anchor: (A) Anchor 45°; (B) Anchor 90°.
According to the energy evolution curves of rock samples in Figures 6, 7: Throughout the uniaxial compression process, the total strain energy input by the press to the rock is mainly stored in the rock as elastic strain energy. In the initial compaction stage, the internal micro-cracks of the rock sample are gradually compacted and closed, and the friction damage of the micro-cracks leads to the internal energy of the rock sample dominated by the dissipated energy. In the process of fracture closure, the rate of growth of the dissipated energy gradually decreases, and the elastic energy gradually exceeds the dissipated energy after fracture closure; with the continuous increase of stress, the rock sample enters the elastic stage. When the Wd/Ws ratio decreases to about 0.4, the growth of dissipated energy basically stops. Since then, the dissipated energy of 45° rock samples remains unchanged at the peak level, and the dissipated energy of 90° rock samples gradually decreases after reaching the peak, indicating that the 45° bedding sandstone is more stable than 90° bedding sandstone, and the internal fracture development is relatively slow during compression. The energy evolution curve of the rock sample shows a growth stage in which the growth rate of the dissipated energy increases gradually compared with the elastic stage. The internal cracks in the rock bifurcate and develop rapidly, then resulting in local shear failure until the cracks penetrate and the fracture surface is damaged.
The energy calculation results of sandstone with five bedding angles during failure show that: In the sandstone with the same bedding angle, the anchored sandstone generally stores more total input strain energy, elastic strain energy and dissipation energy than the unanchored sandstone. In unanchored and anchored layered sandstone, the total input strain energy, elastic strain energy and dissipation energy of rock samples basically increase first and then decrease with the increase of bedding angle, but increase will occur in 90° bedding sandstone. It can be seen from Formula 2 that the stored energy of rock is related to the peak stress of rock and the corresponding strain at the peak stress. Although the compressive strength of 90° bedding sandstone is slightly lower than that of 60° bedding sandstone, the strain at failure is greater than that of 60° bedding sandstone, resulting in the increase of total input strain energy of 90° bedding sandstone compared with 60° bedding sandstone. In the case of unanchored specimens, the layered sandstone slides along the weak bedding plane in the elastic stage, making the local shear fracture zones gradually cross-connect until failure occurs. In the energy evolution process, the dissipative energy will exhibit dense fluctuations in a localized area during the elastic stage. After the dissipative energy fluctuation is completed, the dissipative energy will increase sharply, and then the rock sample will be damaged. Under the action of anchoring, there is no sharp fluctuation in dissipated energy in the elastic stage, indicating that the anchor can increase the stability and compressive strength of bedded sandstone.
Characteristics of Acoustic Emission During Rock Sample Failure
Acoustic Emission Parameter Analysis
The common characteristic parameters of acoustic emission include event count, energy, amplitude, and duration. According to the acoustic emission count (cumulative count) and energy (cumulative energy) in the process of rock failure, we studied the degree of occurrence and development of cracks in the rock to through failure and the intensity of accompanying acoustic emission events (Guo and Wong, 2020; Jiang et al., 2020; Meng et al., 2021). Here, we list the test results of 60° bedding specimens as an example.
The changes of acoustic emission parameters during loading, deformation and failure of anchored rock are shown in Figures 8, 9. In the initial stage of loading, the two rock samples are in the compaction stage, and the acoustic emission counting rate and energy are at a low level and fluctuate within a small range. At that time, the specimen is undergoing closure of primary joints and micro-fractures in the rock. During this period, it can be seen from the enlarged drawing of Zone I that there is a small wave peak in the acoustic emission counting rate. After the wave peak, the acoustic emission counting rate and energy rate will enter a stable period for a certain time when, the rock sample enters the elastic stage, and there are few new cracks (a quiet period in AE terms), in which the anchoring effect is small; with increasing load, the acoustic emission count rate of rock will increase gradually. The count rate and energy remain low and irreversible plastic deformation and new cracks occur in the rock sample, and the sandstone particles continue to slip between the same bedding plane, resulting in an upward acoustic emission count rate (an AE transition period). At the initial stage of this stage, the acoustic emission count rate of anchored rock will increase and decrease sharply within a small range compared with that in the calm period, indicating that the anchor rod has inhibited the development of primary fractures in the rock sample. In the middle and late plastic stage, the acoustic emission counting rate shows an upward trend, and the count rate will increase sharply in a short time. At this time, the internal crack of the rock sample rapidly develops into a through-crack, forms a fracture surface, and immediately destroys the rock (the so-called active period of acoustic emission). In this stage, the peak stress, internal cumulative energy and cumulative count of the anchored rock are significantly greater than those of the unanchored rock sample. At the same time, the high count-rate and high energy-release range of the anchored rock in the active period are longer than those of the unanchored rock, showing that the anchored rock is more stable. After the rock sample has been damaged, the acoustic emission count rate of rock samples with or without anchors decreases sharply and disappears rapidly (the so-called acoustic emission attenuation period). There is obvious shear failure of rock with or without anchorage. Other bedding angles in the rock specimens show similar AE characteristics in the process of uniaxial compression deformation and failure.
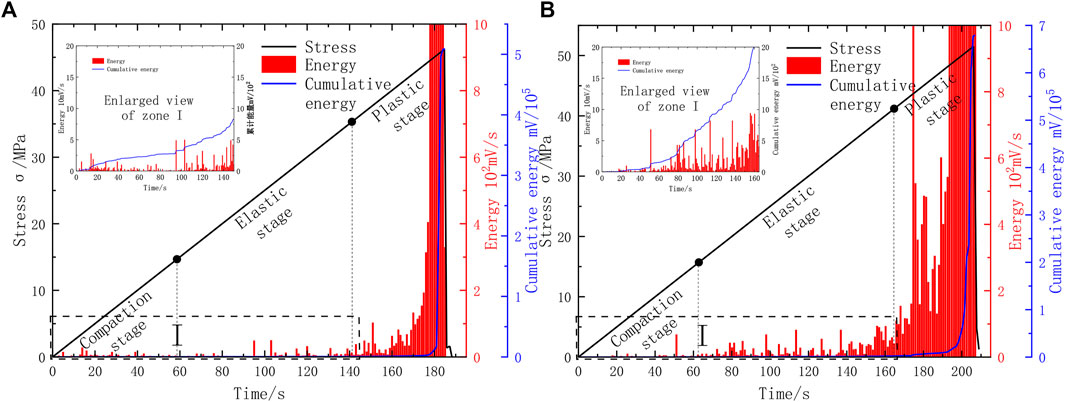
FIGURE 8. Relationship between acoustic emission energy and cumulative energy of rock sample and stress: (A) Unanchored bedding sandstone; (B) Anchored bedding sandstone.
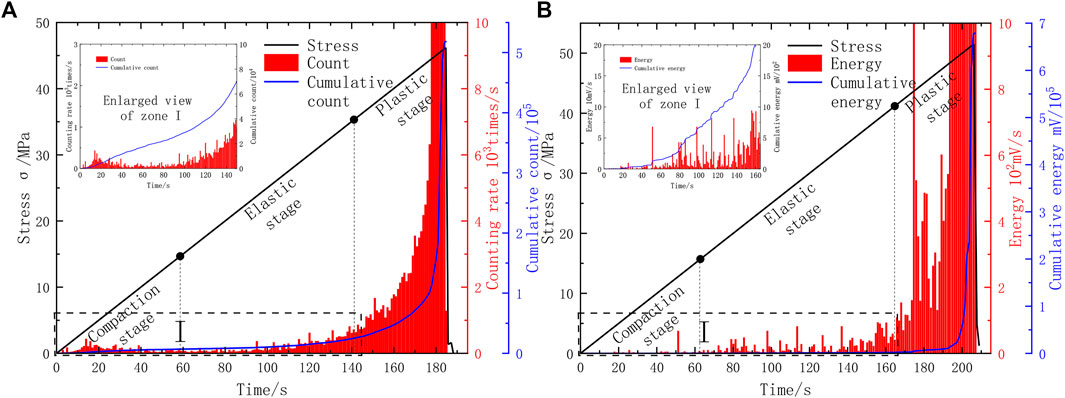
FIGURE 9. Relationship between acoustic emission counting and cumulative counting of rock samples and stress: (A) Unanchored bedding sandstone; (B) Anchored bedding sandstone.
Acoustic Emission B-Value Characteristics
The B value represents the parameter of seismic magnitude frequency relationship. At present, research into the B value is not limited to seismic analysis. In rock, the acoustic emission event generated in the process of deformation and failure can be regarded as microseismic activity, and the event amplitude can be regarded as the seismic grade. By studying the variation of acoustic emission B value, the precursory characteristics of sandstone instability and failure at different bedding angles under anchorage were revealed (Liu et al., 2020).
where a and b are constants, N represents the number of microseismic events, and m is the magnitude. The calculation of n is based on the statistics pertaining to a large number of data, and two statistical methods can be used: differential frequency and cumulative frequency. In the differential frequency, N is the earthquake frequency with magnitude in the interval [m − ∆m, m + ∆m]. In the calculation of the acoustic emission B value, the acoustic emission amplitude A (dB) is divided by 20 to replace the magnitude m, i.e., m = A/20. In the study of acoustic emission events, the B value can be used as the characteristic parameter indicative of rock damage propagation state and range to detect imminent dynamic disasters in the rock mass.
Acoustic emission events will produce large fluctuations in the process of rock compression, so a given number of events can be selected for each window, and the B value is calculated by sliding grouping, so as to increase the statistical validity of data pertaining to the number of events, and the maximum likelihood estimation method is used to calculate the B value (Amitrano, 2003):
where
The time-normalized coordinate system is used to represent the variation relationship between B and amplitude of events in sandstone with different bedding angles under anchorage (Figure 10). In the initial compaction stage of loading, there are few acoustic emission events in the rock sample, the cracking scale of primary joints and micro-fractures in the rock is small, and B is high. The initial B value at this time reflects the state of B value when there is only small fracture activity in the initial compaction stage, and can also be used as a reference value for the change of B value in the whole process. With the increase of B value, the small cracks increase continuously, and the B value is less than the initial b value at the final failure. With increasing stress, the B value of sandstone shows an upward trend in the elastic stage and the distribution of micro-cracks and acoustic emission events in sandstone is relatively uniform, and sandstone is stable. When the time reaches about 0.7, as the sandstone changes from the elastic stage to the plastic stage, due to the large collection of micro-cracks in sandstone, large cracks are formed. In the locally damaged area, the stress-drop in the corresponding sandstone specimen occurs many times, accompanied by high-amplitude, high-energy events, and B continues to decline. Finally, the large cracks in the sandstone are connected and unstable failure occurs whereupon, the B value reaches a minimum.
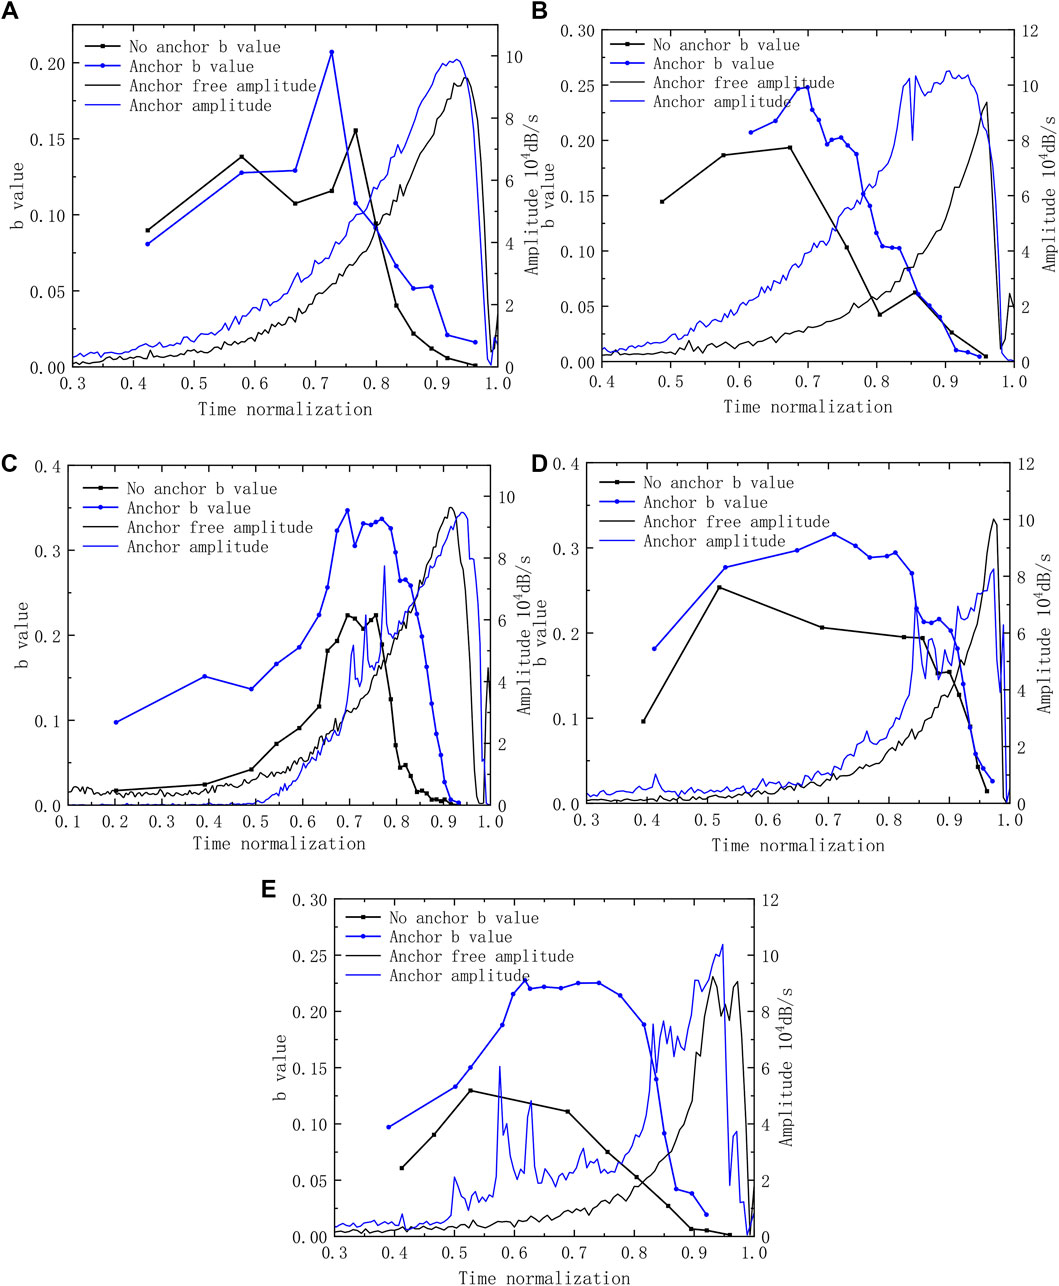
FIGURE 10. Relationship between b value and amplitude of layered sandstone: (A) 0° sandstone; (B) 30° sandstone; (C) 45° sandstone; (D) 60° sandstone; (E) 90° sandstone.
It can be seen from Figure 10 that the B value of anchored layered sandstone first increases, then decreases throughout the uniaxial compression deformation process. For sandstone at a given bedding angle, the number of acoustic emission events of anchored sandstone exceeded that of unanchored sandstone, and the B value is generally higher than that of unanchored sandstone in different stages, indicating that the development of internal fractures under the action of anchorage can be effectively restrained, the compressive strength of rock can be improved, and the toughness of the sandstone can be improved. The continuous decrease of B value can be regarded as precursory information before the failure of anchored and unanchored layered sandstone.
Analysis of Spatial Fractal Evolution of Acoustic Emission Events
The fractal dimension of acoustic emission events in rock failure process is a measure of the disorder of micro-cracks in rock, which can reflect the tendency of micro-damage evolution to macro-cracks (Liu et al., 2019; Ma et al., 2021; Zhao et al., 2021). Xie et al. (2011) proposed a sphere-covering method and column-covering method to predict the spatial fractal distribution of rock acoustic emission events (Figure 11). The sphere-covering method mainly covers the central area, which cannot reflect the damage to the areas at both ends of the specimen, therefore, according to the geometry of the cylindrical rock specimens, the cylinder-covering method and calculation model could be adopted to calculate the spatial fractal dimension of sandstone with different bedding angles under the action of anchorage.
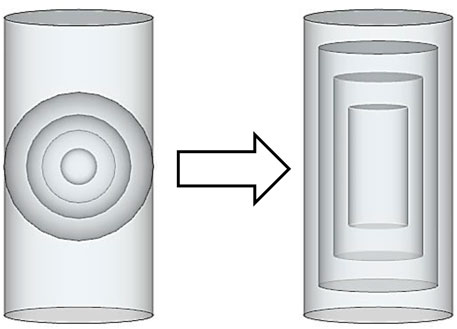
FIGURE 11. Sphere and cylinder-covering methods.
In the cylinder-covering method, the fractal dimension model in the space of acoustic emission events follows the volume distribution, as given by (Xie, 1996):
where, the radius R and height h change in the same proportion (
According to fractal theory, the relationship between the spatial distribution number of acoustic emission events and the radius r of the micro-cylinder can be expressed as:
Taking the logarithm of both sides:
where r = the radius of the micro-cylinder (the radii selected herein are 5, 10, 15, 20, and 25); N(r) = the number of acoustic emission events in a micro-cylinder with radius r; D = fractal dimension; C = a constant (taken herein as 0.25).
According to the fractal dimension calculation principle, the double logarithmic coordinates of the spatial distribution number N(r) of acoustic emission events of sandstone with different bedding angles and the corresponding spatial radius under the action of anchorage were made. The linear correlation of
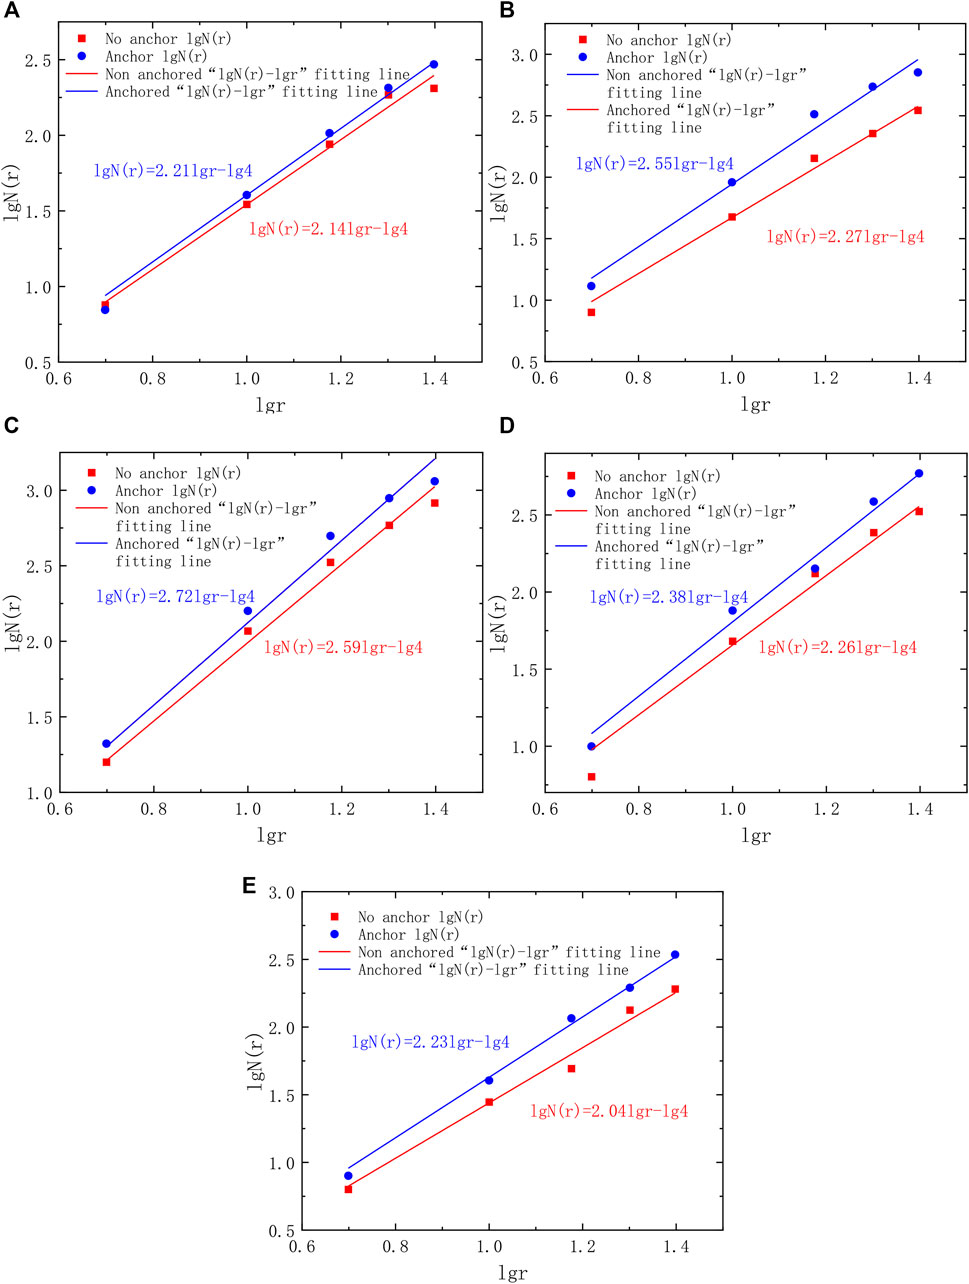
FIGURE 12. Fractal dimension fitting line of layered sandstone: (A) 0° sandstone; (B) 30° sandstone; (C) 45° sandstone; (D) 60° sandstone; (E) 90° sandstone.
Through the linear analysis of fractal dimension fitting between anchored and unanchored sandstones with different bedding angles (Figure 12), the acoustic emission events of sandstone in the failure process were found to have fractal characteristics in space, and the range of variation of fractal dimension D is within [2, 3]. The increase of D value indicates that the spatial distribution of events in sandstone is more uniform, that is, the damage is evenly distributed in sandstone, on the contrary, the smaller the D value, the more the acoustic emission events are intensively distributed in space, indicating that the rock is locally severely damaged. The fractal dimension D of sandstone first increases, then decreases with the increase of bedding angle (Figure 13). The D value shows a positive correlation with the compressive strength of sandstone. The fractal dimension D of anchored sandstone is greater than that of unanchored sandstone, the growth rate of 30° bedding anchored sandstone (in terms of D value) is the largest (reaching 12.33%), and the largest D value occurs in 45° bedding anchored sandstone (reaching 2.72). The increase in D shows that the distribution of internal cracks in sandstone can become uniform when anchored, and the degree of stress concentration therein can be reduced. Figure 14 shows the time distribution of the height of acoustic emission events of anchored and unanchored sandstone in different bedding orientations. The acoustic emission events increase with the increase of time under compression. The number of acoustic emission events of sandstone increases under the action of anchorage. The distribution of damage to the rock can be seen more intuitively through the range of distribution of acoustic emission events. In the 30° bedding sandstone, the acoustic emission time of unanchored sandstone is mainly concentrated in the height range of 0–40 mm wherein, many acoustic emission events have occurred in the initial stage of loading, cracks appear in the sandstone, local damage occurs, finally developing into through-cracks, resulting in instability and failure. The acoustic emission events in anchored sandstone are evenly distributed over the height of the specimens. A small number of acoustic emission events occur in anchored specimens in the early stage and these are evenly distributed, thus avoiding sudden damage to the rock due to local stress concentration. Therefore, the fractal dimension D can reflect the severity of the damage and its distribution in the rock. The lower the D value, the more concentrated the damage, and the greater the D value, the more uniform and widespread the damage.
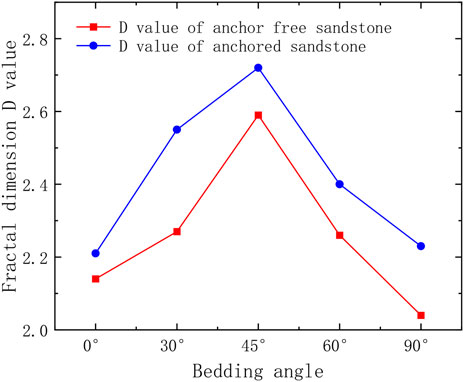
FIGURE 13. Relationship between D value and bedding angle of anchored and unanchored sandstone.
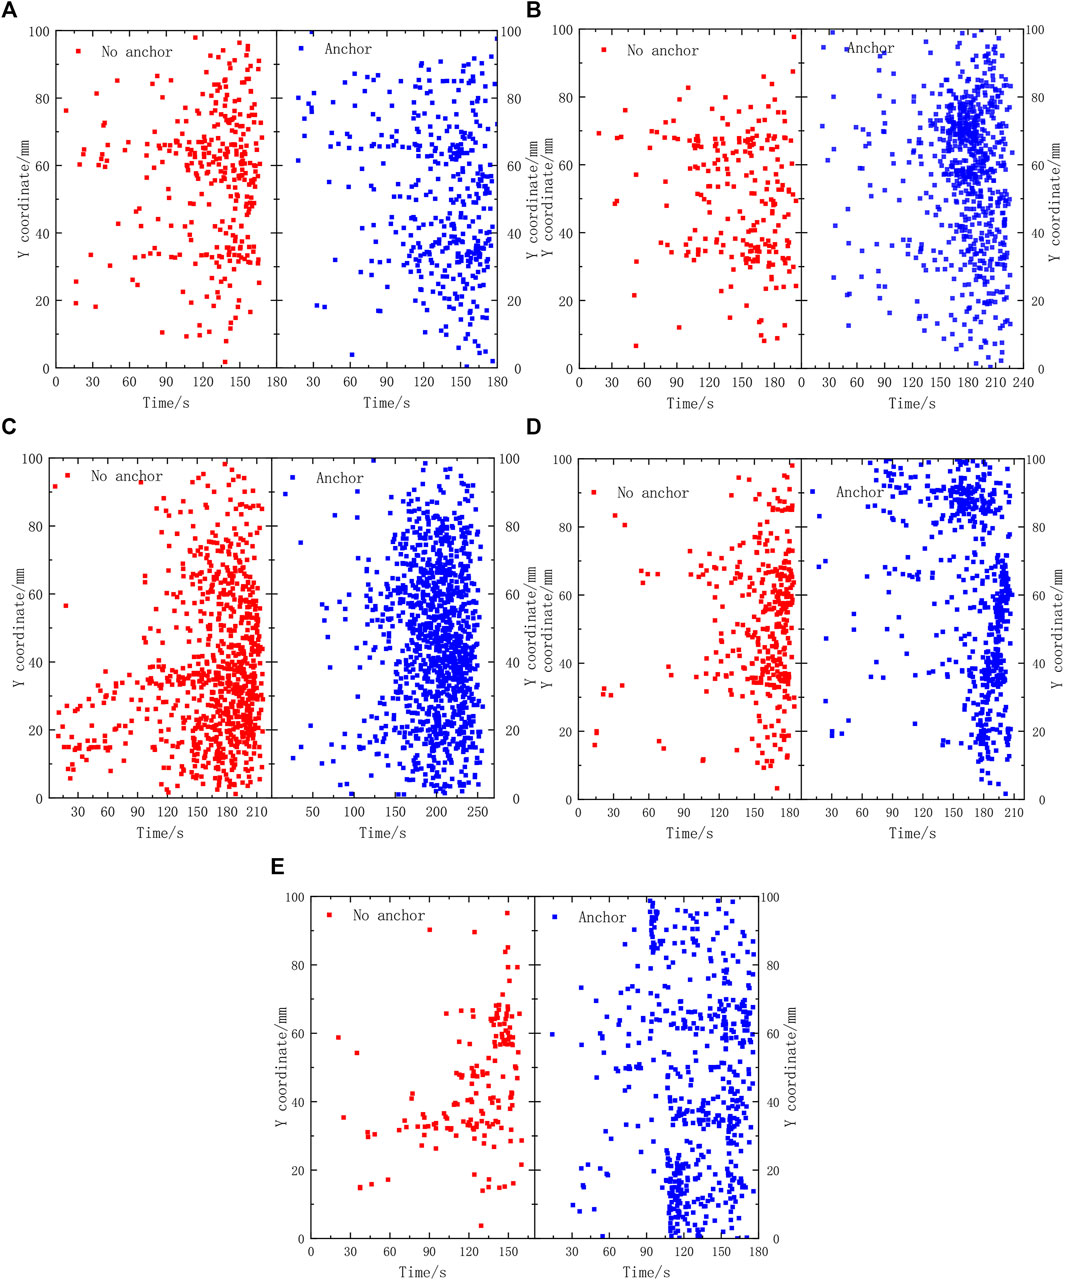
FIGURE 14. Distribution of acoustic emission event height with time in layered sandstone: (A) 0° sandstone; (B) 30° sandstone; (C) 45° sandstone; (D) 60° sandstone; (E) 90° sandstone.
From the relationship between acoustic emission event spatial fractal dimension D and relative peak stress in Figure 15, it can be seen that with the continuous increase of stress, acoustic emission spatial fractal dimension D tends to increase, and the D value of anchored sandstone is generally greater than that of unanchored sandstone throughout the process. Before the stress reaches 0.3
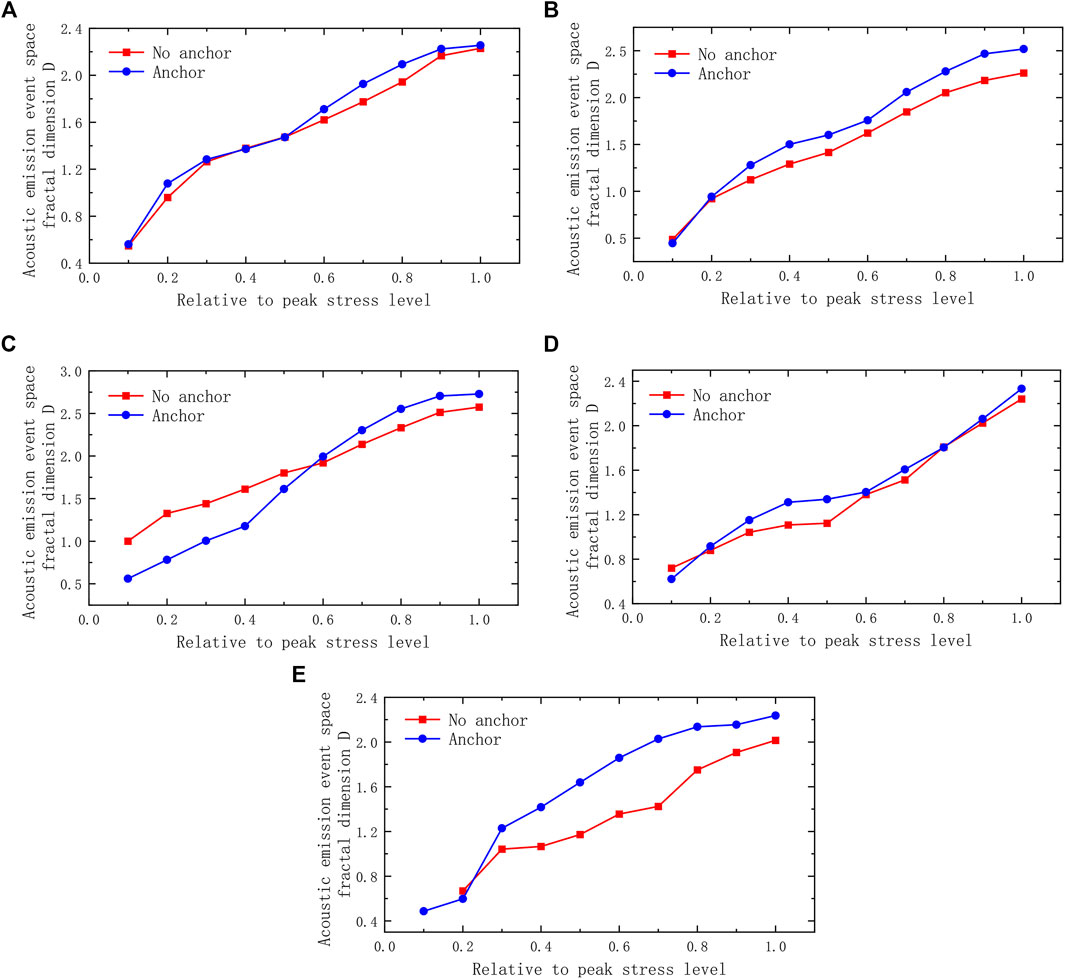
FIGURE 15. Relationship between acoustic emission event spatial fractal dimension and stress: (A) 0° sandstone; (B) 30° sandstone; (C) 45° sandstone; (D) 60° sandstone; (E) 90° sandstone.
It can be seen from Formula 8 that the number of acoustic emission events has a positive proportional exponential growth relationship with D. in the initial stage, there are few acoustic emission events, and the value of D in the same space is small. In the magnitude and change rate of D value under different stresses in uniaxial compression, the former can represent the number of acoustic emission events to a certain extent, and the latter can represent the growth rate of acoustic emission events in the process of compression. For 60° bedding sandstone, obvious shear failure occurs along the bedding plane at the weak anchorage during deformation and failure, and the D value changes little, showing a linear change from the plastic stage to final failure, indicating significant brittleness: the effect of the anchor bolt on improving the toughness of this bedding rock sample is insignificant. At other bedding angles, the D value tends to be stable in the process of plastic deformation and failure. At this time, although the sandstone has produced a wide spatial range of damage, the acoustic emission events increase evenly and slowly in the space near the point of failure. This phenomenon is more obvious than that of unanchored sandstone, therefore, the bolt can improve the toughness of sandstone to a certain extent. Therefore, in engineering practice, using anchor bolts to anchor layered sandstone can improve the strength and stability of the surrounding rock.
Conclusion
1) In the process of uniaxial compression, the total input strain energy of the press to the sandstone is mainly stored as elastic strain energy. Among them, 45° bedding sandstone stores the most energy, and anchored sandstone stores more energy than unanchored sandstone. The release of energy increases continuously in the compaction stage of sandstone, remaining quasi-stable in the elastic stage until the release of energy in the plastic stage increases exponentially until instability failure of the sandstone occurs.
2) The high count and high energy of acoustic emission mainly occur in the stage of plastic damage. In the compaction stage, the acoustic emission count and energy of anchored and unanchored sandstone exhibit low peaks. With the increase of pressure, the anchored sandstone shows a higher count and energy earlier than the unanchored sandstone, and the duration thereof is longer than in unanchored specimens. The sandstone has higher stability under the action of anchorage.
3) The B values of anchored and unanchored sandstones with different bedding angles first increase, then decrease during the process leading to eventual failure. The B value of anchored sandstone is generally higher than that of unanchored sandstone throughout the compression process. The anchoring effect can inhibit the development of internal fractures and improve the compressive strength and toughness of sandstone. At failure, B decreases continuously and rapidly which can be regarded as precursory information warning of the imminent failure of anchored and unanchored sandstone masses.
4) The acoustic emission events in the failure process of anchored and unanchored layered sandstone have fractal characteristics in space, and the range of fractal dimension D is [2, 3]. With the increase of bedding angle, D first increases, then decreases, which is consistent with the changes in energy storage and compressive strength. At the same bedding angle, the D value of anchored sandstone is greater than that of unanchored sandstone; D increases with the relative peak stress, showing a process of rapid growth and then slow growth which then repeats. The acoustic emission event counts grow uniformly and slowly in space, and the toughness and stability of sandstone are improved to a certain extent.
Data Availability Statement
The original contributions presented in the study are included in the article/Supplementary Material, further inquiries can be directed to the corresponding author.
Author Contributions
Methodology, YY; investigation, D-CZ and H-SG; resources, D-XG and G-LF; writing—Original draft preparation, YY and D-CZ; writing—Review and editing, G-LF, and D-XG; supervision, G-LF. All authors have read and agreed to the published version of the manuscript.
Conflict of Interest
The authors declare that the research was conducted in the absence of any commercial or financial relationships that could be construed as a potential conflict of interest.
Publisher’s Note
All claims expressed in this article are solely those of the authors and do not necessarily represent those of their affiliated organizations, or those of the publisher, the editors and the reviewers. Any product that may be evaluated in this article, or claim that may be made by its manufacturer, is not guaranteed or endorsed by the publisher.
Acknowledgments
The authors acknowledge the financial support from the National Natural Science Foundation of China (Nos 42177156, 51969007), the Fund of Jiangxi Department of Science and Technology (No. 20202ACBL214016), the Open Fund of Hubei Key Laboratory of Disaster Prevention and Mitigation (China Three Gorges University) (No. 2020KJZ03), and the Science and Technology Project of Jiangxi Provincial Department of Transportation (No. 2021Z0004).
References
Amitrano, D. (2003). Brittle-ductile Transition and Associated Seismicity: Experimental and Numerical Studies and Relationship with the B Value. J. Geophys. Res. Solid Earth 108 (B1), 2044. doi:10.1029/2001jb000680
Cai, Y., Jiang, Y., Djamaluddin, I., Iura, T., and Esaki, T. (2015). An Analytical Model Considering Interaction Behavior of Grouted Rock Bolts for Convergence-Confinement Method in Tunneling Design. Int. J. Rock Mech. Mining Sci. 76, 112–126. doi:10.1016/j.ijrmms.2015.03.006
Chen, Z., Xu, L., and Shang, Y. (2021). Influence of Joint Angle on the Acoustic Emission Evolution Characteristics and Energy Dissipation Rule of Rock Mass. Geotechnical Geol. Eng. 39 (4), 1621–1635. doi:10.1007/s10706-020-01581-2
Feng, G.-L., Feng, X.-T., Chen, B.-R., Xiao, Y.-X., and Yu, Y. (2015). A Microseismic Method for Dynamic Warning of Rockburst Development Processes in Tunnels. Rock Mech. Rock Eng. 48 (5), 2061–2076. doi:10.1007/s00603-014-0689-3
Feng, G.-L., Chen, B.-R., Xiao, Y.-X., Jiang, Q., Li, P.-X., Zheng, H., et al. (2022). Microseismic Characteristics of Rockburst Development in Deep TBM Tunnels with Alternating Soft -Hard Strata and Application to Rockburst Warning: A Case Study of the Neelum -Jhelum Hydropower Project. Tunn. Undergr. Sp. Tech. 122, 104398. doi:10.1016/j.tust.2022.104398
Gao, L., Gao, F., Zhang, Z., and Xing, Y. (2020). Research on the Energy Evolution Characteristics and the Failure Intensity of Rocks. Int. J. Mining Sci. Tech. 30 (5), 705–713. doi:10.1016/j.ijmst.2020.06.006
Geng, J., and Cao, L. (2020). Failure Analysis of Water-Bearing sandstone Using Acoustic Emission and Energy Dissipation. Eng. Fracture Mech. 231, 107021. doi:10.1016/j.engfracmech.2020.107021
Guo, T. Y., and Wong, L. N. Y. (2020). Microcracking Behavior of Three Granites under Mode I Loading: Insights from Acoustic Emission. Eng. Geology. 278, 105823. doi:10.1016/j.enggeo.2020.105823
He, M., Zhang, Z., Zhu, J., and Li, N. (2021). Correlation between the Constant Mi of Hoek-Brown Criterion and Porosity of Intact Rock. Rock Mech. Rock Eng. doi:10.1007/s00603-021-02718-2
Jiang, Z., Li, Q., Hu, Q., Liang, Y., Xu, Y., Liu, L., et al. (2020). Acoustic Emission Characteristics in Hydraulic Fracturing of Stratified Rocks: A Laboratory Study. Powder Tech. 371, 267–276. doi:10.1016/j.powtec.2020.05.050
Kang, H. (2014). Support Technologies for Deep and Complex Roadways in Underground Coal Mines: a Review. Int. J. Coal Sci. Technol. 1 (3), 261–277. doi:10.1007/s40789-014-0043-0
Li, C., Liu, N., Liu, W., and Feng, R. (2021). Study on Characteristics of Energy Storage and Acoustic Emission of Rock under Different Moisture Content. Sustainability 13 (3), 1041. doi:10.3390/su13031041
Li, H. R., He, M. C., and Shen, R. X. (2021a). Acoustic Emission Waveform Analysis of sandstone Failure with Different Water Content. Geofluids, 5290076.
Li, H. (2017). Mechanical Properties and Acoustic Emission Characteristics of Thick Hard Roof sandstone in Shendong Coal Field. Int. J. Coal Sci. Technol. 4 (2), 147–158. doi:10.1007/s40789-017-0163-4
Li, H., Qiao, Y., Shen, R., He, M., Cheng, T., Xiao, Y., et al. (2021b). Effect of Water on Mechanical Behavior and Acoustic Emission Response of sandstone during Loading Process: Phenomenon and Mechanism. Eng. Geology. 294, 106386. doi:10.1016/j.enggeo.2021.106386
Li, H., Shen, R., Wang, E., Li, D., Li, T., Chen, T., et al. (2020). Effect of Water on the Time-Frequency Characteristics of Electromagnetic Radiation during sandstone Deformation and Fracturing. Eng. Geology. 265, 105451. doi:10.1016/j.enggeo.2019.105451
Liu, W., Ma, L., Sun, H., and Muhammad Khan, N. (2021). An Experimental Study on Infrared Radiation and Acoustic Emission Characteristics during Crack Evolution Process of Loading Rock. Infrared Phys. Tech. 118, 103864. doi:10.1016/j.infrared.2021.103864
Liu, X., Han, M., and He, W. (2020). A New B Value Estimation Method in Rock Acoustic Emission Testing. J. Geophys. Res. Solid Earth 125 (12). doi:10.1029/2020jb019658
Liu, Y., Lu, C.-P., Zhang, H., and Wang, H.-Y. (2019). Numerical Investigation of Slip and Fracture Instability Mechanism of Coal- Rock Parting-Coal Structure (CRCS). J. Struct. Geology. 118, 265–278. doi:10.1016/j.jsg.2018.11.001
Ma, L. H., Jiang, X., and Chen, J. (2021). Analysis of Damages in Layered Surrounding Rocks Induced by Blasting during Tunnel Construction. Int. J. Struct. Stab. Dyn. 21 (7), 2150089. doi:10.1142/s0219455421500899
Ma, Q., Tan, Y., Liu, X., Gu, Q., and Li, X. (2020). Effect of Coal Thicknesses on Energy Evolution Characteristics of Roof Rock-Coal-Floor Rock sandwich Composite Structure and its Damage Constitutive Model. Composites B: Eng. 198 (1), 108086. doi:10.1016/j.compositesb.2020.108086
Meng, F. Z., Wong, L. N. Y., and Zhou, H. (2019). Asperity Degradation Characteristics of Soft Rock-like Fractures under Shearing Based on Acoustic Emission Monitoring. Eng. Geology. 266, 105392.
Meng, Y., Jing, H., Liu, X., Yin, Q., and Wei, X. (2021). Experimental and Numerical Investigation on the Effects of Bedding Plane Properties on the Mechanical and Acoustic Emission Characteristics of sandy Mudstone. Eng. Fracture Mech. 245 (10), 107582. doi:10.1016/j.engfracmech.2021.107582
Song, H., Zhao, Y., and Elsworth, D. (2020). Anisotropy of Acoustic Emission in Coal under the Uniaxial Loading Condition. Chaos, Solitons & Fractals, 130. doi:10.1016/j.chaos.2019.109465
Tang, J.-H., Chen, X.-D., and Dai, F. (2020). Experimental Study on the Crack Propagation and Acoustic Emission Characteristics of Notched Rock Beams under post-peak Cyclic Loading. Eng. Fracture Mech. 226 (6), 106890. doi:10.1016/j.engfracmech.2020.106890
Wang, Y., Wang, N., Wang, Z., Chen, Y., Wang, Y., and Zhao, H. (2020). Experimental Study on Ae Characteristics of Granite under Uniaxial Tension at Different Strain Rates. J. Wuhan Univ. Technol.-Mat. Sci. Edit. 35 (4), 691–698. doi:10.1007/s11595-020-2309-2
Wu, H., Zhao, G., and Liang, W. (2019). Investigation of Cracking Behavior and Mechanism of sandstone Specimens with a Hole under Compression. Int. J. Mech. Sci. 163, 105084. doi:10.1016/j.ijmecsci.2019.105084
Xie, H. P., Liu, J. F., Ju, Y., Li, J., and Xie, L. Z. (2011). Fractal Property of Spatial Distribution of Acoustic Emissions during the Failure Process of Bedded Rock Salt. Int. J. Rock Mech. Mining Sci. 48 (8), 1344–1351. doi:10.1016/j.ijrmms.2011.09.014
Yan, B., Wang, P., and Ren, F. (2020). A Review of Mechanical Properties and Constitutive Theory of Rock Mass Anisotropy. Arabian J. Geosciences 13 (12), 1–16. doi:10.1007/s12517-020-05536-y
Yang, J. M., Qiao, L., and Yuan, L. I. (2019). Effect of Bedding Dip on Energy Evolution and Rockburst Tendency of Loaded Phyllite. Chin. J. Eng. 41 (10), 1258–1265.
Yu, Y., Feng, G. L., Xu, C. J., Chen, B.-R., Geng, D.-X., and Zhu, B.-T. (2022). Quantitative Threshold of Energy Fractal Dimension for Immediate Rock-Burst Warning in Deep Tunnel: A Case Study. Lithosphere, 1699273. doi:10.2113/2021/1699273
Zhang, B., Li, S., Xia, K., Yang, X., Zhang, D., Wang, S., et al. (2016). Reinforcement of Rock Mass with Cross-Flaws Using Rock Bolt. Tunnelling Underground Space Tech. 51, 346–353. doi:10.1016/j.tust.2015.10.007
Zhang, L., Cong, Y., Meng, F., Wang, Z., Zhang, P., and Gao, S. (2021). Energy Evolution Analysis and Failure Criteria for Rock under Different Stress Paths. Acta Geotech. 16, 569–580. doi:10.1007/s11440-020-01028-1
Keywords: rock anchorage, bedding sandstone, energy evolution, acoustic emission, b value, spatial fractal
Citation: Yu Y, Zhao D-C, Feng G-L, Geng D-X and Guo H-S (2022) Energy Evolution and Acoustic Emission Characteristics of Uniaxial Compression Failure of Anchored Layered Sandstone. Front. Earth Sci. 10:841598. doi: 10.3389/feart.2022.841598
Received: 22 December 2021; Accepted: 18 January 2022;
Published: 09 February 2022.
Edited by:
Faming Huang, Nanchang University, ChinaReviewed by:
Zetian Zhang, Sichuan University, ChinaLi Ren, Sichuan University, China
Hongru Li, Tongji University, China
Nan Li, China University of Mining and Technology, China
Mingming He, Xi’an University of Technology, China
Baoyun Zhao, Chongqing University of Science and Technology, China
Copyright © 2022 Yu, Zhao, Feng, Geng and Guo. This is an open-access article distributed under the terms of the Creative Commons Attribution License (CC BY). The use, distribution or reproduction in other forums is permitted, provided the original author(s) and the copyright owner(s) are credited and that the original publication in this journal is cited, in accordance with accepted academic practice. No use, distribution or reproduction is permitted which does not comply with these terms.
*Correspondence: Guang-Liang Feng, glfeng@whrsm.ac.cn