Numerical simulation of creep fracture evolution in fractured rock masses
 Zhao Na
 Meng Lixin
 Wang Laigui
 - College of Mechanics and Engineering, Liaoning Technical University, Fuxin, China
The initiation, expansion, and penetration of microscopic cracks in rock is the macroscopic manifestation of creep. This paper investigates mechanical creep characteristics and fracture evolution processes in rock masses with different fracture angles, lengths, and rock bridge dip angles. Single fractures, dual parallel fractures, and fracture groups are considered. The approach comprises discrete element simulation based on continuum mechanics, utilizing the continuous and discontinuous software, GDEM. Single-fracture rock masses are characterized by a progressive fracture development mode dominated by tensile shear failure. The rate of creep and fracture magnitude both increase according to fracture length. With increasing fracture inclination angle, creep rate and fracture magnitude increase and decrease. The creep rate and degree of rupture are highest for fractures inclined at 30°. The dual-fracture rock mass exhibits both tensile crack failure and compressional shear failure. Creep rates are highest, and rupture effects are most apparent at rock bridge inclination angles of 90°. If the rock bridge is too long or too short, the stable creep stage is prolonged, but the creep acceleration stage intensifies due to interaction between fracture-bounded rock masses. The failure mode, in this case, involves collective failure by tension fractures and compressional shear. Creep rate and fracture magnitude increase with the number of fractures, which accelerates rock mass deformation to a certain extent. However, when the number of fractures reaches a certain threshold, a relatively stable structure may become established, slowing down the creep rate, especially during the creep acceleration stage. This study can provide a theoretical basis and reference for investigating the creep rupture law of rock mass engineering and the prevention and control of fractured rock mass geological disasters.
1 Introduction
The deformation and stress of the rock are affected by the time factor. Under constant load, its deformation gradually increases with time, which is called rock creep. The essence of rock creep rupture is the macroscopic manifestation of microscopic crack initiation, expansion, and penetration, mainly due to the non-uniformity of rock. Rock non-uniformity comprises both material and structural heterogeneity: the former relating to a rock’s mineralogical composition and the latter corresponding to the pores, fissures, and discontinuities it contains. As a result, natural rock masses have large numbers of fractures and voids of varying sizes, defining smaller fracture-bounded rock masses with different structural forms.
A fractured rock mass is a complex engineering medium widely encountered in slope, tunnel, and cavern engineering projects. As such, there is a significant body of relevant research literature. Du Yan et al. (Du et al., 2022) summarized the development process of rock bolt support technology for slope engineering in China, and made a detailed discussion on the progress and prospect of rock bolt support for slope engineering in my country. Yang Shengqi et al. (Yang et al., 2012; Yang et al., 2014) explored the mechanical properties of fractured sandstones through uniaxial compression tests, analyzing the effect of fracture dip angle on the strength and deformation behavior of sandstone specimens containing defects. Li et al. (2005) tested crack propagation in marble specimens under uniaxial compression, finding that the critical buckling load, strain at failure, and elastic modulus were each lower in specimens with prefabricated cracks. Ren Jianxi (Ren and Hui, 2005) conducted real-time CT scanning of microscopic failure in single-fracture sandstone samples under triaxial compression. Their results showed that the failure process can be divided into stages of linear development, micro-crack initiation and propagation, rapid damage development, and post-peak accelerated damage. Rates of damage development were higher in rocks with pre-existing fractures than in initially intact rocks. Li et al. (2022) freeze-thaw granite based on high-resolution computed tomography, and the results show that the peak stress of granite decreases to different degrees with the increase of the number of freeze-thaw cycles. Xiao Taoli (Xiao et al., 2015) carried out conventional triaxial compression tests on a rectangular sample of high-strength silica fume mortar prepared with a single fracture of well-defined size and orientation. Crack propagation behavior under triaxial compression was found to relate strongly to the inclination angle of the prefabricated crack. Sun Chaoyang (Sun, 2015) investigated the peak strength under uniaxial load of similar materials containing prefabricated fractures of different angles. That study found a trend in which peak strength first decreased and then increased with the increasing fracture angle. Wu Yu et al. (Wu et al., 2021) conducted uniaxial compression tests on single-crack and double-crack rock masses, finding that single-crack examples underwent tensile shear failure. In the double-crack case, the failure mode was more complex because of interaction between the cracks, resulting in a combination of tensile fracturing and compressional shear failure.
In addition to compression tests, some scholars have conducted extensive creep experiments. Wang Yongyan et al. (Wang et al., 2018a) performed uniaxial and triaxial compression creep tests and confining pressure unloading tests on single-fracture rock specimens. They found that steady-state creep rate varied with fracture angle and proposed an equation to describe the creep. Liang Bing et al. (Liang et al., 2019) conducted uniaxial creep tests on pre-fractured diabase samples and derived a creep model for that lithology from analysis of their test data. Sun Qichao (Sun, 2018) analyzed rock deformation, energy consumption, and acoustic emission characteristics during time-delay failure under conditions of high-stress creep. They studied changes in mechanical properties, such as rock strength, after creep involving rupture features. Hu Bo et al. (Hu et al., et al.) conducted a long-term uniaxial compression creep test on a 45° single-crack red sandstone and found that the sample did not experience an accelerated creep failure stage. They established damage creep in the sample on the basis of the effective stress principle. From splitting tensile strength tests (Brazilian Tests), Wang Hui et al. (Wang et al., 2020) obtained fracture characteristics and failure mechanisms developed under the combined influence of bedding and prefabricated fractures. Zhang et al. (2022) studied the fracture characteristics of layered sandstone. They found that the failure mode and strength of layered sandstone were related to the bedding dip angle, showing obvious anisotropy. Zhao Cheng et al. (Zhao et al., 2016) used the digital image correlation method (DICM) as the basis for a systematic study of crack propagation and microscopic damage evolution in rock-like materials with different preset single cracks under uniaxial compression.
Compared with physical experimentation, numerical simulation has the advantages of low cost, fast processing, and richness of analytic results. In addition, multiple comparative experiments can be carried out on an identical numerical rock sample, thus avoiding errors caused by inevitable differences among physical samples. To validate the accuracy of test results, Zhang Shilin et al. (Zhang et al., 2016) used both uniaxial compression tests and numerical simulation to study the expansion mechanism of red sandstone fractures under different opening conditions. Through uniaxial and biaxial compression numerical experiments, Xu et al. (Xu and Li, 2017) found that rock failure initiated in the area around the fracture. By comparing laboratory creep tests on granite with discrete element numerical simulations of those test, Chen et al. (Chen and Konietzky, 2014) were able to propose some generalizations for brittle rocks. NiuJiangrui et al. (Niu et al., 2016) conducted uniaxial compression tests on fractured specimens with different degrees of opening and used the mechanical parameters the obtained in numerical simulations. Zhang Meili (Zhang, 2019) derived crack initiation stress values for rock samples with different fracture orientation, and also carried out uniaxial and multiaxial numerical tests on cross-fractured samples using Rock Failure Process Analysis (RFPA). Hu Guanghui (Hu et al., 2018) conducted uniaxial compression and uniaxial creep tests and employed discrete element modeling software (specifically PFC3D) to simulate time-dependent damage and failure processes for rocks. A combination of laboratory experiments and simulation were used to explore the creep instability mechanism for brittle rocks. Haeri et al. (Sarfarazi et al., 2017a; Sarfarazi et al., 2017b; Haeri et al., 2017; Haeri et al., 2018) conducted extensive research into fractured rock masses using the particle flow simulation method, obtaining fracture toughnesses for different model scenarios and different and external conditions. Wang Hui (Wang et al., 2015) et al. carried out an RFPA numerical simulation study of single-crack rock specimens and found that with increasing crack elongation, the peak strength of the specimen decreased.
In rock engineering, macroscopic fracture instability and failure of fractured rock bodies under prolonged stress relate directly to the distribution of internal micro-cracks and the generation, expansion, and penetration of micro-cracks during deformation. The shape of propagating cracks and the mechanical response to deformation, which vary significantly between different fractured rock masses, will directly affect the engineering stability of the rock. Fractured rock masses can induce sliding deformation and damage to, for example, mine slopes, resulting in frequent engineering accidents and causing loss of life and property. Du Yan et al. (Du et al., 2021; Du and Xie, 2022) reviewed the research on the genesis mechanism and early warning of rock collapse disasters, and proposed a cohesive safety factor (CSF) and a relatively objective analysis method, which can effectively identify unstable rocks. It provides a relatively complete quantitative evaluation index and evaluation standard for rock collapse early warning and prevention. It is significant to study the creep instability characteristics of fractured rock masses for the early warning and prevention of geological disasters in China.
Existing studies have mainly analyzed the expansion and penetration of rock mass cracks under different loading conditions from the perspectives of experiments, theory, and numerical calculation but have not discussed the relationship between the initiation, propagation, and penetration of microscopic cracks and macroscopic creep deformation. The main innovation of the thesis is to analyze the relationship between microscopic crack propagation, penetration, and macroscopic creep deformation under different crack characteristics. At the same time, due to the difficulty in obtaining double-fissure and multi-fissure rock mass specimens, it is not easy to manufacture, and there are relatively few studies. However, the microscopic and macroscopic behavior can be effectively coupled using the continuous–discontinuous simulation software GDEM (discussed further in the next section). The creep process is simulated to explore relationships between different fracture lengths and orientations for rock masses with single fractures, different rock bridge inclination angles and lengths for rock masses with dual fractures, and between creep deformation and rupture for larger groups of fractures. A theoretical basis is provided for the study of creep rupture crack propagation, which is relevant for practical creep control of fractured rock masses.
2 Principles of deformation modeling using GDEM software
The continuous–discontinuous deformation simulation used in this study is a discrete element method based on continuum mechanics. The approach couples finite elements and discrete elements: finite element calculations are performed inside the block and discrete element calculations are performed on the block boundary. This allows simulation of material deformation and motion characteristics in both continuous and discontinuous states and can also represent progressive failure processes through that continuum.
The continuous–discontinuous model comprises elastically-coupled characterization elements composed of micro-elements. Each characterization element has a different elastic modulus because of the different fracture conditions of its constituent micro-elements (Figure 1). For a given characterization element, the elastic modulus distribution is calculated from the distribution of fracture degree within it, reflecting the microscopic heterogeneity of the rock. The connections (elastic or fractured) between characterization elements simulate the initiation, propagation, and link-up of microscopic cracks, and thus represents the evolution of macroscopic fractures during progressive rock creep and rupture.
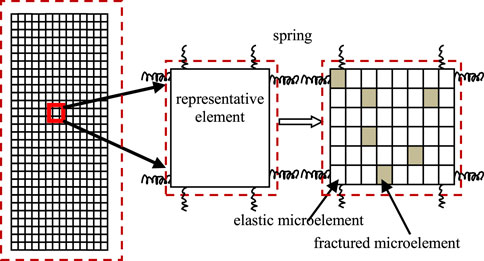
FIGURE 1. Continuous–discontinuous calculation principle.
2.1 Numerical example
As an informative example, the continuous–discontinuous software GDEM is used to simulate fracture propagation in a rock with a single pre-existing fracture under constant load. A rock mass model and uniaxial compression numerical experiment can be obtained for the same material parameters and loading stress. Different rock mass fracture patterns result from different initial fracture angles, and these can be compared with the laboratory results of Jiang Mingjing et al. (Jiang et al., 2015), as shown in Figure 2.
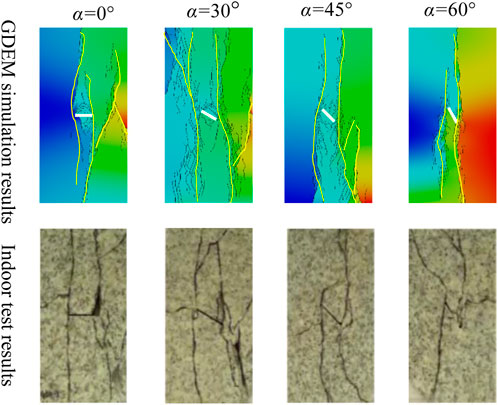
FIGURE 2. Comparison of failure morphology between GDEM simulations and laboratory test specimens.
Laboratory experiments and GDEM numerical simulations both show that, for different initial fracture angles, α (where α denotes the angle between the crack and the horizontal):
• When α = 0°, the wing crack propagates along the prefabricated crack tip along the axial loading direction, and minor secondary cracks appear over time.
• When α = 30°, the crack initiates and expands along the prefabricated crack, and finally penetrates to form a tensile fracture. The lower end of the right wing crack extends to the right to develop a through-going secondary crack.
• When α = 45°, the crack on the right wing of the main fracture expands and penetrates. The lower right end of the prefabricated crack forms a closed triangular surface with the secondary crack.
• When α = 60°, a shear crack is initiated at the right tip of the prefabricated inclined fracture and propagates along the loading direction until it penetrates.
From this comparison, it is clear that GDEM simulations of crack growth patterns closely resemble laboratory examples, with the advantage that fracture initiation, propagation, and development directions can be more readily followed numerically. Based on this, the continuous–discontinuous deformation software GDEM appears to effective in simulating the evolution processes of rock fracture propagation.
3 Simulation of creep rupture in a rock mass with a single fracture
3.1 Computational model
To better study the details of crack propagation during rock creep, the GDEM software is first used to simulate the deformation of a rock with a single initial fracture under constant load. The analysis is repeated for different fracture lengths and inclination angles to constrain the evolution of creep crack propagation. The calculation model is illustrated in Figure 3, where α is the angle between the crack and the horizontal direction, and b is the half-length of the crack. The size of the model is 50 mm × 100 mm, and different crack angles and lengths are selected for calculation. The experimental scheme is shown in Table 1.
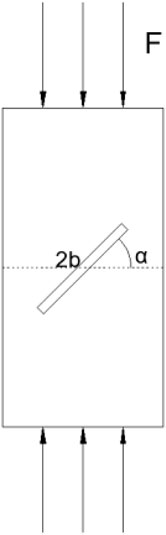
FIGURE 3. Numerical computation model.
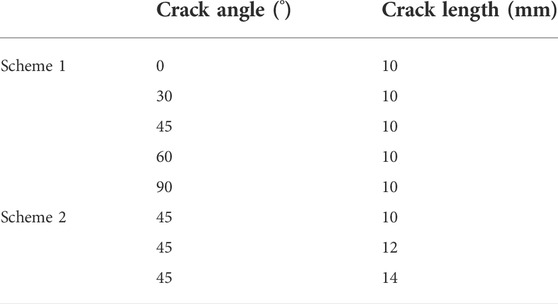
TABLE 1. Calculation scheme.
Based on a comparison between data collected in this study and test data for samples of the Jinping marble (Sichuan Province, China), the Mohr–Coulomb model is considered appropriate to represent the process of continuous–discontinuous deformation and rupture. Mechanical parameters are shown in Table 2.

TABLE 2. Calculated mechanical parameters of the rock mass.
For discrete elements or blocks of a deformable body, the normal stiffness and tangential stiffness are actually the stiffness of the contact surface. For the continuous–discontinuous model, the virtual contact surface of the element contact spring is represented by the deformable element, and the characteristic stiffness of that element is selected 10 times or 100 times to ensure continuity of contact, and to ensure that appropriate values are transferred. A spring connection is used between elements, and the constitutive model of the spring connection is a brittle fracture model (brittleMC). The material parameters are shown in Table 3. Numerical calculations are terminated when the rock mass develops a throughgoing fracture or if the calculation does not converge.

TABLE 3. Mechanical parameters of the rock mass contact surface.
3.2 Evolution of rock creep rupture crack propagation
A simplified model of a single-fracture rock mass is established using GDEM, as shown in Figure 4A, where the length of the fissure is 10 mm, and the inclination angle is 30°. Elements are defined by a three-node triangular mesh. To resolve crack initiation more clearly, mesh refinement processing is performed near the crack, as shown in Figure 4B. The model has 2,786 nodes and 5,392 elements. The lower boundary of the model is fixed and the upper boundary is loaded with a surface force of 4 MPa.
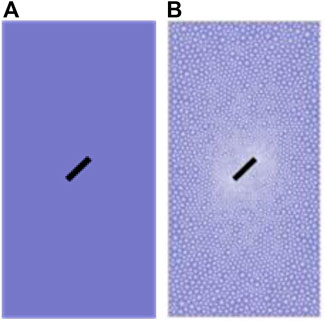
FIGURE 4. Single fracture model and meshing.
It can be seen from Figures 5, 6 that, under constant load, a rock mass with single preexisting fracture develops microscopic cracks which gradually extend and expand; the macroscopic manifestation of this is creep deformation. Rock creep can generally be divided into three phases. The first, a deceleration creep stage, initially involves no new secondary cracks in the rock mass (from 0 s to 1,250 s in the simulation) but wing cracks (a and b in Figure 6) are gradually generated at the upper and lower ends of the pre-existing fracture. Midway through this stage (at 2,900 s in the simulation), crack a expands into cracks d and e (Figure 6). Subsequently (at 5,550 s), a secondary crack c initiates at the lower end of the preexisting fracture. In the second phase (from 6,400 s in the simulation), the rock mass enters the constant velocity creep stage with further crack expansion and, extension and initiation of new cracks (g and f in Figure 6). Finally, (at 60,000 s) macroscopic deformation increases as the rock mass enters the accelerated creep stage, as microcracks develop a diverging, branch-like, distribution and coalesce to form a macroscopic fracture surface. At this stage, the rock still has a certain load-bearing capacity. Beyond this, macroscopic deformation accelerates, and the creep rate gradually increases.
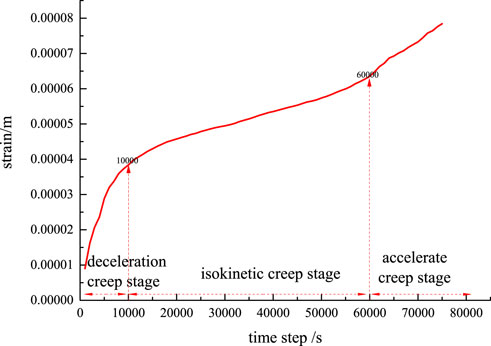
FIGURE 5. Creep deformation curve: single fracture model.
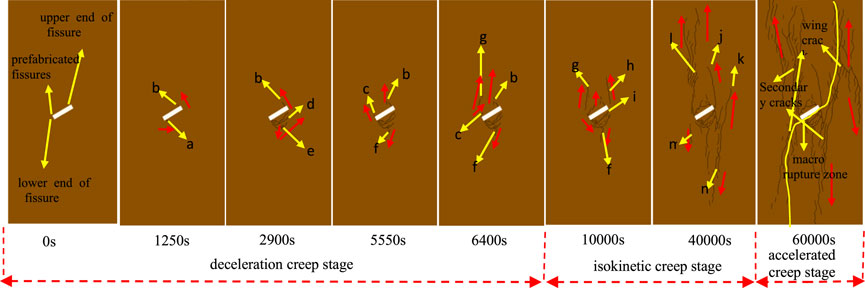
FIGURE 6. Creep rupture crack propagation in a rock mass with a single fracture.
3.2.1 Effect of fracture angle on rock creep rupture
In this numerical experiment, a rock model with a single fracture of length 10 mm and width 2 mm is subjected to simulated uniaxial compressive creep. By varying the relative fracture angle (0°, 30°, 45°, 60°, and 90°) while maintaining the same material parameters and loading stress, the creep rupture behavior and equivalent displacement cloud map can be obtained for each angular case. Strain data for specified monitoring points can also be derived for each fracture angle through software post-processing. Figures 7, 8 show the resulting creep curves (strain curves) and stable creep rates for the rock mass with different fracture angles.
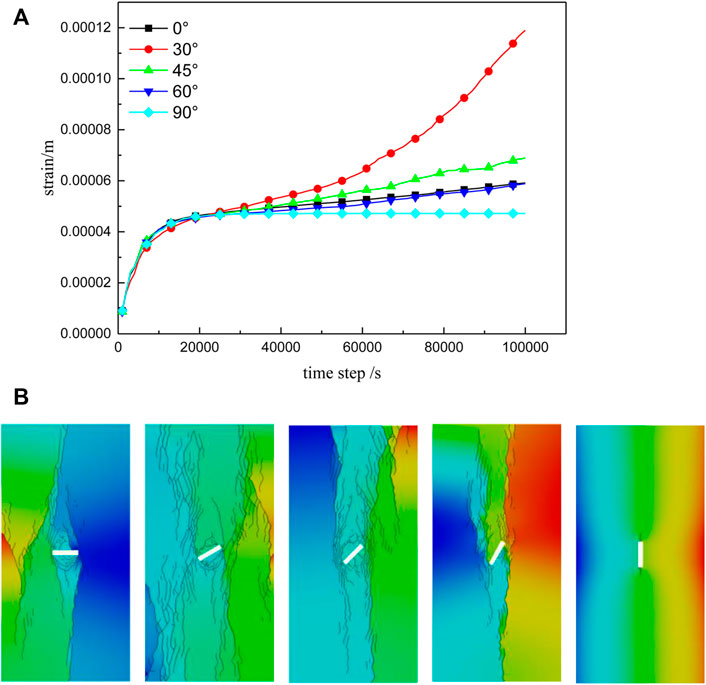
FIGURE 7. Creep curves (A) and fracture diagrams (B) for single-fracture rock masses with different fracture angles.
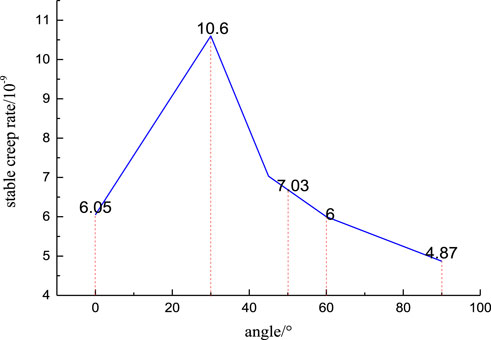
FIGURE 8. Stable creep rate of a fractured rock mass at different angles.
It can be seen from Figure 7 that, under constant load, creep-equivalent displacement, and macroscopic behavior when creep rupture occurs differ significantly for the different fracture angle cases. When α = 0°, the main deformation mode is tensile shear. Vertical wing cracks are generated, and inclined secondary cracks continue to expand and extend, but the structure is relatively stable and the degree of rupture is relatively small. For the case of α = 30°, wing cracks and coplanar and inclined secondary cracks are generated at the crack tip simultaneously. Cracks continue to develop, and X-type conjugate shear failure occurs through the ‘prefabricated’ fracture after a certain degree of expansion. For α = 45°, cracks initiate from the tip of the main fracture and wing cracks continue to expand until penetration rupture occurs. However, at this angle, the rupture volume around the prefabricated fracture is smaller, and the crack rupture effect is slightly weaker than that at α = 30°. In the case of α = 60°, the crack propagation effect appears to be diminished, and vertical penetration develops along the upper end of the main fracture. When α = 90°, the fractured rock mass forms a relatively stable structure: under load, the greatest principal stress direction is parallel to the longitudinal direction of the fracture, and crack propagation is not obvious.
From Figures 7, 8 it can be seen that, before 1,200 s, the fractured rock mass is characterized by instantaneous elastic deformation for all fracture angles. From 1,200 to 20,000 s, crack initiation occurs with different orientations but the creep curves are similar for each fracture angle; this is the deceleration creep stage. From 20,000 s, deformation enters the constant velocity creep stage. It can be seen from Figure 8 that creep rates for different fracture angles diverge significantly at this time. For α = 0° creep rate is 6.05 × 10⁻⁹/s. For α = 30° the creep rate is 1.06 × 10⁻⁸/s. For α = 45°, the creep rate is 7.03 × 10⁻⁹/s. For α = 60°, creep rate is 6.00 × 10⁻⁹/s. For α = 90°, the creep rate is 4.87 × 10⁻⁹/s. After about 50,000 s, the case with α = 30° begins to show accelerated creep as it enters the third stage (accelerated creep). When loading reaches about 60,000 s, the cases with α = 45° and 60° fractures also begin to enter the accelerated creep stage. Overall, the rock mass creep rate first increases and then decreases with increasing initial fracture angle. The rate of creep is highest when the fracture inclination angle is 30°; in this case the rock mass structure is prone to rupture.
3.2.2 Effect of crack length on creep rupture
A rock mass model with a single 45° fracture of 2 mm width is simulated numerically for uniaxial compressive creep experiments in which different fracture lengths (10 mm, 12 mm, and 14 mm) are tested for constant material parameters and loading stress. Creep rupture curves for single cracks of different lengths are shown in Figure 9.
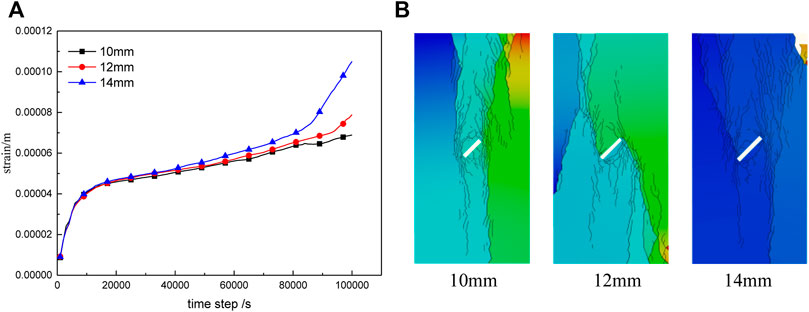
FIGURE 9. Creep curves (A) and rupture diagrams (B) for different fracture lengths.
Figure 9 illustrates that, with increasing fracture length, the void volume of the rock mass enlarges, structural inhomogeneity increases, and crack propagation and rupture become more severe. Creep rate is positively correlated to crack length.
At the onset of creep, creep rates for different crack lengths are similar. When deformation enters the constant velocity stage, the creep rate becomes more obviously affected by crack length: the longer the crack, the higher the creep rate, and earlier the entry into the accelerated creep stage. Both creep rate and fracture degree increase with increasing crack length.
3.2.3 Comparison and validation of simulation results
For the numerical simulation of fractured rock masses, many researchers use peri-dynamics and related methods to determine microscopic parameters and use general particle dynamics and field enrichment finite element methods to explore scale effects (Zhou et al., 2014; Zhou et al., 2015; Bi et al., 2016; Wang et al., 2016; Wang et al., 2018b; Zhou et al., 2018; Zhou et al., 2019; Zhang and Zhou, 2020; Wang and Zhou, 2021; Zhou et al., 2021). To validate the findings this study, simulation results for single-fracture rock scenarios (lengths of 10 mm, 15 mm, and 20 mm) without mesh refinement were selected. Numerical results of Wang et al. (Wang et al., 2016) were used for the comparison, as shown in Figure 10.
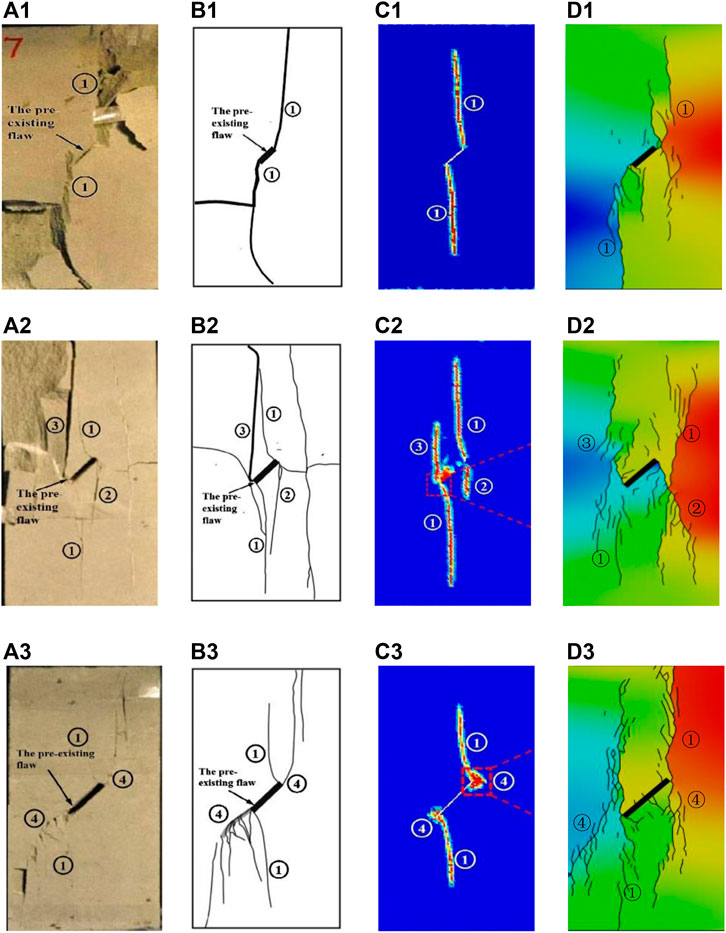
FIGURE 10. Comparison of numerical simulation results.
It can be seen from Figure 10d1 that, when the fracture length is 10 mm, wing cracks 1) appear at both ends of the prefabricated fracture in the numerical simulation of this study. This agrees well with numerical simulations and experimental results published by other scholars (Figures 10a1–c1). For a fracture length of 15 mm, the wing cracks developed in this study are directly comparable to those seen in numerical simulations and experiments of other researchers. Along the upper and lower ends of the prefabricated fracture, inclined secondary cracks 2) and tensile cracks 3) are secondarily extended, as shown in Figures 10a2–d2. When the crack length is 20 mm, the wing cracks 1) initiate and expand along the upper and lower ends of the prefabricated fracture. A coplanar secondary crack 4) propagates along the prefabricated fracture, as shown in Figures 10a3–d3. In summary, the numerical simulations from this study are in good agreement with the experiments and simulations of previous researchers. The numerical model results appear to be reliable.
4 Simulation of creep rupture in a rock mass with two parallel fractures
4.1 Parametric model for parallel double fractures
To investigate crack propagation during creep of a rock mass with two fractures, GDEM software is used to simulate crack growth under constant load. The fractures are set up to be parallel and offset. The analysis involves varying the length and inclination angle of the intervening rock bridge. The calculation model is shown in Figure 11, where b is the half-length of the fracture, c is the fracture width, α is the inclination angle between the fracture and horizontal, and β is the inclination angle between the rock bridge and horizontal. The size of the model is 50 mm × 100 mm, and different rock bridge lengths and inclination angles are selected for analysis. The calculation scheme is summarized in Table 4.
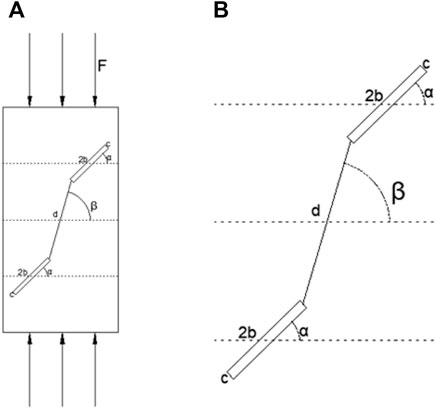
FIGURE 11. Numerical calculation model: (A) double-crack axial force diagram; (B) partial enlarged view of the rock bridge.
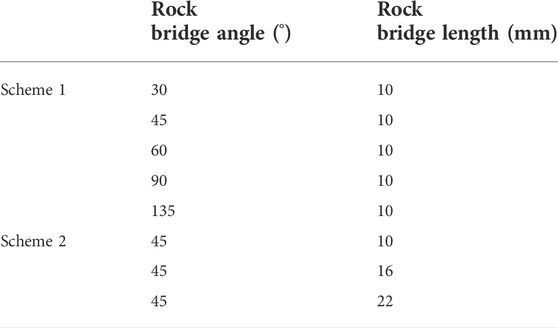
TABLE 4. Calculation scheme: dual parallel fractures.
4.2 Influence of rock bridge length on creep behavior
Numerical simulations of creep in the dual-fracture model are carried out under uniaxial compression. Three different rock bridge length are simulated. Creep rupture curves are derived from the monitoring point data, as shown in Figure 12.
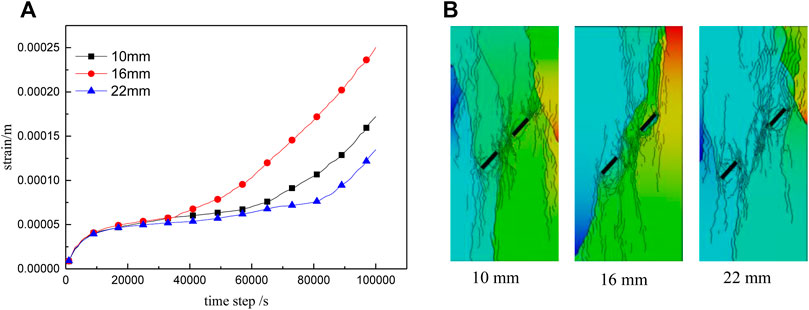
FIGURE 12. Creep curve (A) and rupture diagram (B) for fractured rock masses with different rock bridge lengths.
Rock cracks propagate from the main fracture tip and gradually expand under uniaxial compression. The failure mode is dominated by compressional shear failure, accompanied by tensile failure. Fracture modes for different rock bridge lengths are shown in Figure 12. When the rock bridge length, d, is 10 mm, the rock mass expands along the fracture tips towards the loading direction, with local shear failure leading to more general fracture instability. When d = 16 mm, the failure mode involves a throughgoing (penetrative) shear fracture accompanied by a high degree of fragmentation. For the case of d = 22 mm, local shear failure occurs on the upper crack, resulting in overall instability and fracture.
As shown by the creep curve (Figure 12A), during the creep deceleration stage, the change curves for different rock bridge lengths are roughly the same. During the constant velocity creep stage, creep rates for rock bridges with d = 10 mm and d = 16 mm are greater than for the d = 22 mm case. The rock mass with the d = 16 mm rock bridge enters the accelerated creep stage earliest, at 33,000 s. The rock mass with the d = 10 mm rock bridge enters the accelerated creep stage somewhat later, at 60,000 s. The onset of accelerated creep is latest for the d = 22 mm case (80,000 s) but, after entering the accelerated creep stage, the creep rate becomes higher than in the other two cases. The length of the rock bridge clearly affects the creep of the rock mass: longer or shorter bridges prolong stable creep deformation, but ultimately lead to higher strain rates during the creep acceleration stage.
4.3 Influence of rock bridge inclination angle on the creep behavior
To assess the impact of rock bridge orientation, uniaxial compressive creep simulations are conducted for five different rock bridge inclination angles (Table 4). The resulting creep rupture curves are shown in Figure 13.
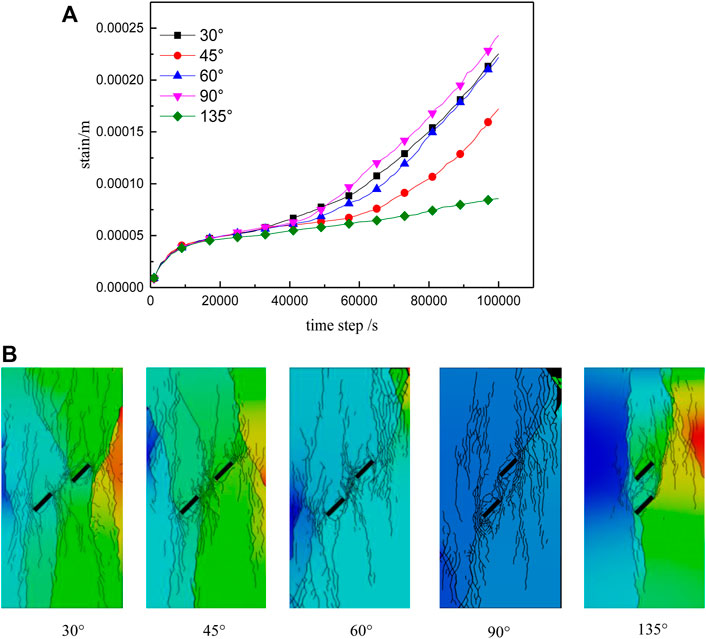
FIGURE 13. Creep curves (A) and rupture diagrams (B) for fractured rock masses with different rock bridge angles.
It can be seen from the creep rupture curves for the dual-fracture rock mass (Figure 13A) that when β = 30°, the rock mass crack expands along the tip of the prefabricated fracture and exhibits conformal shear failure. When β = 45°, the rock mass continues to expand along the wing cracks of prefabricated fracture until penetrative rupture occurs, which is shear failure. For the case of β = 60°, cracks extend along the tips and between the fractures until penetrative rupture takes place; this is shear failure. For the simulation with β = 90°, the rock mass expands rapidly around and at the tips of the prefabricated fracture, finally forming a macroscopic fracture, at which stage the upper right corner of the rock mass shows signs of failure and collapse. When β = 135°, fracture propagation occurs along the lower side of the rock mass. In this case, the prefabricated fractures mainly undergo expansion, eventually forming micro-fracture zones, still dominated by shear failure.
From analysis of the creep curves (Figure 13), it is clear that different rock bridge inclinations angles have no obvious effect on the strain rate during the primary creep (deceleration) stage. The rock mass begins to enter the accelerated creep stage earliest (at 42,000 s) for the case with a 90° rock bridge dip angle. The onset of accelerated creep for the β = 30° and β = 60° cases occurs slightly later, around 50,000 s. The β = 45° case shows entry into the accelerated creep stage after 58,000 s. The creep rupture effect is most pronounced when the rock bridge inclination angle is 90°.
5 Simulation of creep rupture in a rock mass with a set of fractures
To progress understanding of creep in fractured rock masses, the simply fractured rock scenario is expanded to rock masses with multiple fractures. This takes the modeling closer toward real-world scenarios. The simulation experiments are initialized with stepped or en echelon sets of disconnected parallel fractures. Cases with two, four, six, and nine fractures are investigated for variations in creep behavior and influencing factors.
It can be seen from the creep rupture diagrams (Figure 14B) that, in moving from two fractures to four fractures, the degree of creep rupture increases. However, when the number of fractures increases to six, the degree of cracking is evidently lower than for four cracks. For nine fractures, the intensity of brittle deformation again becomes severe. From the creep curves (Figure 14A), it is apparent that deformation rate during the first stage of creep is roughly the same for all cases. However, with different fracture numbers, the strain of the rock mass undergoes different step changes into the second stage of creep. For the two-fracture case, the stable creep rate is 1.44 × 10⁻⁸/s. For the four-fracture case, the creep rate reaches the maximum value of 2.24 × 10⁻⁸/s. The rock mass with six fractures develops a creep rate of 1.50 × 10⁻⁸/s. For the nine-fracture case, the rate is 2.23 × 10⁻⁸/s. The models containing nine and four fractures entered the accelerated creep stage first, followed by the two-fracture case. The rock mass with six fractures also entered the third acceleration stage, but with a lower strain rate. Creep rate and degree of strain are highest for the four-fracture case, and slightly lower for the nine-fracture case. The six- and two-fracture cases showed significantly lower strain. With increasing numbers of constituent fracture-bounded rock bodies, the creep rate of the rock mass is accelerated to a certain threshold, beyond which a relatively stable structure may be formed, causing the rock mass to creep. In this way, the rate of change diminishes, especially during the third stage of creep.
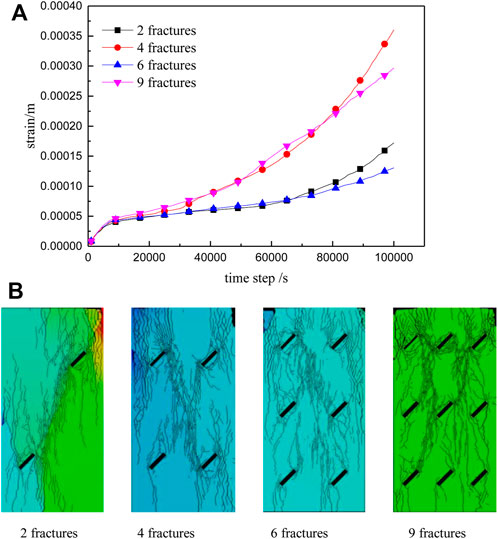
FIGURE 14. Creep curves (A) and rupture diagrams (B) for rock masses with parallel fracture sets.
6 Conclusion
This research carried out a series of numerical simulation experiments to investigate the creep evolution processes of simple fractured rock masses under loading. A combined discrete element–finite element modeling approach was adopted that used the continuous–discontinuous deformation simulation software GDEM. The following conclusions are drawn:
1) Single-fracture rock masses exhibit a progressive rupture mode dominated by tensile shear failure. The creep rate and degree of rupture increased with increasing fracture length. For α = 0° the creep rate is 6.05 × 10⁻⁹/s. For α = 30°, the creep rate is 1.06 × 10⁻⁸/s. For α = 45°, the creep rate is 7.03 × 10⁻⁹/s. For α = 60°, the creep rate is 6.00 × 10⁻⁹/s. For α = 90°, the creep rate is 4.87 × 10⁻⁹/s. With increasing fracture inclination angle, the deformation rate and intensity increase then decrease around a threshold angle of 30°, where the creep rate and rupture degree are the highest.
2) Dual-fracture rock masses exhibit tensile crack failure and compressional shear failure. When the inclination of the rock bridge between the fractures is 90°, the creep rate is at a maximum, and the rupture effect is most pronounced. A critical rock bridge length promotes early instability. For longer or shorter rock bridges, the phase of stable creep is prolonged, but creep rates during the subsequent acceleration phase are higher. The maximum strain value of the double-fractured rock mass is about twice that of the single-fractured rock mass.
3) In a loaded rock mass containing a group of fractures, an interaction effect leads to a combined failure mode involving tension fractures and compressional shear. For the two-fracture case, the stable creep rate is 1.44 × 10⁻⁸/s. For the four-fracture case, the creep rate reaches the maximum value of 2.24 × 10⁻⁸/s. The rock mass with six fractures develops a creep rate of 1.50 × 10⁻⁸/s. For the nine-fracture case, the rate is 2.23 × 10⁻⁸/s. For specific numbers of fractures, a relatively stable structure may become established, which slows down the creep rate, especially during the creep acceleration stage.
This paper reports a systematic series of numerical simulations with mechanical analysis which explore macro- and mesoscopic creep of fractured rock masses under load. These results are hoped to provide a valuable reference for research into the mechanical behavior and creep control of complex fractured rock masses.
Data availability statement
The raw data supporting the conclusions of this article will be made available by the authors, without undue reservation.
Author contributions
ZN, ML: Numerical simulation experiment design, manuscript writing; WL: Manuscript finalization; ZY: data processing.
Conflict of interest
The authors declare that the research was conducted in the absence of any commercial or financial relationships that could be construed as a potential conflict of interest.
Publisher’s note
All claims expressed in this article are solely those of the authors and do not necessarily represent those of their affiliated organizations, or those of the publisher, the editors and the reviewers. Any product that may be evaluated in this article, or claim that may be made by its manufacturer, is not guaranteed or endorsed by the publisher.
References
Bi, J., Zhou, X. P., and Qian, Q. H. (2016). The 3D numerical simulation for the propagation process of multiple pre-existing flaws in rock-like materials subjected to biaxial compressive loads. Rock Mech. Rock Eng. 49 (5), 1611–1627. doi:10.1007/s00603-015-0867-y
Chen, W., and Konietzky, H. (2014). Simulation of heterogeneity, creep, damage and lifetime for loaded brittle rocks. Tectonophysics 633, 164–175. doi:10.1016/j.tecto.2014.06.033
Du, Y., Li, H., Chicas, S. D., and Huo, L. (2022). Progress and perspectives of geotechnical Anchor bolts on slope engineering in China[J]. Front. Environ. Sci., 806. doi:10.3389/fenvs.2022.928064
Du, Y., and Xie, M. (2022). Indirect method for the quantitative identification of unstable rock. Nat. Hazards 112 (1), 1005–1012. doi:10.1007/s11069-021-05197-4
Du, Y., Xie, M., Jiang, Y., Chen, C., Jia, B., and Huo, L. (2021). Review on the formation mechanism and early warning of rock collapse[J]. Metal. Mine 50 (01), 106–119. doi:10.19614/j.cnki.jsks.202101008
Haeri, H., Sarfarazi, V., Yazdani, M., Shemirani, A. B., and Hedayat, A. (2018). Experimental and numerical investigation of the center-cracked horseshoe disk method for determining the mode I fracture toughness of rock-like material. Rock Mech. Rock Eng. 51 (1), 173–185. doi:10.1007/s00603-017-1310-3
Haeri, H., Sarfarazi, V., and Zhu, Z. (2017). Effect of normal load on the crack propagation from pre-existing joints using Particle Flow Code (PFC). Comput. Concr. 19 (1), 99–110. doi:10.12989/cac.2017.19.1.099
Hu, B., Yang, S., Xu, P., and Tian, W. (2019) Time-scale effect of single-fracture sandstone creep model parameters and numerical simulation of particle flow. Chinese Journal of Geotechnical Engineering 41 (5), 864–873.
Hu, G., Xu, T., Chen, C., and Yang, X. (2018). Microscopic creep Instability of brittle rock based on discrete element method. Eng. Mech. 35 (9), 26–36. doi:10.11779/CJGE201905009
Jiang, M., Zhang, N., Shen, Z., and Chen, H. (2015). Discrete element analysis of crack propagation mechanism under uniaxial compression of fractured rock mass. Geotech. Mech. 36 (11), 32933300+3314. doi:10.16285/j.rsm.2015.11.034
Li, B., Zhang, G., Wang, G., and Qiao, J. (2022). Damage evolution of Frozen-Thawed granite based on high-resolution computed tomographic scanning[J]. Front. Earth Sci., 760. doi:10.3389/feart.2022.912356
Li, Y. P., Chen, L. Z., and Wang, Y. H. (2005). Experimental research on pre-cracked marble under compression. Int. J. Solids Struct. 42 (9/10), 2505–2516. doi:10.1016/j.ijsolstr.2004.09.033
Liang, B., Zhang, T., Wang, J., Li, G., and Wang, B. (2019). Creep test and model study of fractured diabase. Exp. Mech. 34 (2), 351–357.
Niu, J., Huang, K., Yao, C., and Yang, J. (2016). Numerical simulation of rock failure with different fissure openings under uniaxial compression. People's Yangtze River 47 (22), 87–91. doi:10.16232/j.cnki.1001-4179.2016.22.019
Ren, J., and Hui, X. (2005). Preliminary CT analysis of meso-mechanism of fractured rock uniaxial compression damage expansion. Geotech. Mech. S1, 48–52. doi:10.16285/j.rsm.2005.s1.011
Sarfarazi, V., Haeri, H., and Shemirani, A. B. (2017). Direct and indirect methods for determination of mode I fracture toughness using PFC2D. Comput. Concr. Int. J. 20 (1), 39–47. doi:10.12989/cac.2017.20.1.039
Sarfarazi, V., Haeri, H., Shemirani, A. B., and Zhu, Z. (2017). Shear behavior of non-persistent joint under high normal load. Strength Mater. 49 (2), 320–334. doi:10.1007/s11223-017-9872-6
Sun, C. (2015). Research on the influence of different fracture angles on rock mass strength. Coal Technol. 34 (06), 113–115. doi:10.13301/j.cnki.ct.2015.06.042
Sun, Q. (2018). Research on mechanical properties and fracture behavior of marble under and after creep. [D] Quanzhou: Huaqiao University.
Wang, H., Gao, Z., Meng, X., and Ying, Z. (2015). Numerical simulation of single fracture rock failure under uniaxial compression. Coal Mine Saf. 46 (1), 29–32. doi:10.13347/j.cnki.mkaq.2015.01.008
Wang, H., Li, Y., Cao, S., Pan, R., Yang, H., Zhang, K., et al. (2020). Brazilian splitting test study on crack propagation and macroscopic failure mode of black shale with prefabricated fractures. Chin. J. Rock Mech. Eng. 39 (5), 912–926. doi:10.13722/j.cnki.jrme.2019.0839
Wang, L. F., and Zhou, X. P. (2021). A field-enriched finite element method for simulating the failure process of rocks with different defects. Comput. Struct. 250, 106539. doi:10.1016/j.compstruc.2021.106539
Wang, Y., Zhang, J., and Zhang, Y. (2018a). Experimental study on strength properties and creep model of single-fractured rocks. Sci. Technol. Eng. 18 (18), 94–100.
Wang, Y., Zhou, X., Wang, Y., and Shou, Y. (2018). A 3-D conjugated bond-pair-based peridynamic formulation for initiation and propagation of cracks in brittle solids. Int. J. Solids Struct. 134, 89–115. doi:10.1016/j.ijsolstr.2017.10.022
Wang, Y., Zhou, X., and Xu, X. (2016). Numerical simulation of propagation and coalescence of flaws in rock materials under compressive loads using the extended non-ordinary state-based peridynamics. Eng. Fract. Mech. 163, 248–273. doi:10.1016/j.engfracmech.2016.06.013
Wu, Y., Ren, X., Zhang, J., Gao, Y., and Zhang, Z. (2021). Numerical experimental study on uniaxial compression of rock with fractures. J. China Three Gorges Univ. Nat. Sci. Ed. 43 (02), 35–41. doi:10.13393/j.cnki.issn.1672-948x.2021.02.007
Xiao, T., Li, X., and Jia, S. (2015). Triaxial compression test study on failure characteristics of prefabricated fractured rock samples with two discontinuous penetrations. Chinese Journal of Rock Mechanics and Engineering 34 (12), 2455–2462. doi:10.13722/j.cnki.jrme.2014.1443
Xu, J., and Li, Z. (2017). Damage evolution and crack propagation in rocks with dual elliptic flaws in compression. Acta Mech. Solida Sin. 30 (6), 573–582. doi:10.1016/j.camss.2017.11.001
Yang, S. Q., Jing, H. W., and Xu, T. (2014). Mechanical behavior and failure analysis of brittle sandstone specimens containing combined flaws under uniaxial compression. J. Cent. South Univ. 21 (5), 2059–2073. doi:10.1007/s11771-014-2155-5
Yang, S., Liu, X., and Li, Y. (2012). Experimental analysis of mechanical properties of sandstone with holes and fissures under uniaxial compression. Chin. J. Rock Mech. Eng. 31 (S2), 3539–3547.
Zhang, J. Z., and Zhou, P. (2020). AE event rate characteristics of flawed granite: From damage stress to ultimate failure. Geophys. J. Int. 222 (2), 795–814. doi:10.1093/gji/ggaa207
Zhang, L., Niu, F., Liu, M., Ju, X., Wang, Z., Wang, J., et al. (2022). Fracture characteristics and anisotropic strength criterion of bedded sandstone[J]. Front. Earth Sci., 451. doi:10.3389/feart.2022.879332
Zhang, M. (2019). Numerical simulation of mechanical behavior characteristics of cross-fractured rock mass. Dalian: Dalian University of Technology.
Zhang, S., Du, Y., Li, T., Zhang, G., and Liu, Q. (2016). Study on the propagation mechanism of three-dimensional transparent fractures in red sandstone with different opening degrees under uniaxial compressive loading. J. Xi'an Univ. Sci. Technol. 7 (4), 548–553. doi:10.13800/j.cnki.xakjdxxb.2016.0415
Zhao, C., Liu, F., Tian, J., and Song, T. (2016). Study on single crack propagation and damage evolution law of rock based on uniaxial compression test. Chin. J. Rock Mech. Eng. 35 (A02), 3626–3632. doi:10.13722/j.cnki.jrme.2015.1270
Zhou, X., Jia, Z., and Wang, L. (2021). A field-enriched finite element method for brittle fracture in rocks subjected to mixed mode loading. Eng. Analysis Bound. Elem. 129, 105–124. doi:10.1016/j.enganabound.2021.04.023
Zhou, X. P., Bi, J., and Qian, Q. H. (2015). Numerical simulation of crack growth and coalescence in rock-like materials containing multiple pre-existing flaws. Rock Mech. Rock Eng. 48 (3), 1097–1114. doi:10.1007/s00603-014-0627-4
Zhou, X. P., Cheng, H., and Feng, Y. F. (2014). An experimental study of crack coalescence behaviour in rock-like materials containing multiple flaws under uniaxial compression. Rock Mech. Rock Eng. 47 (6), 1961–1986. doi:10.1007/s00603-013-0511-7
Zhou, X. P., Zhang, J. Z., Qian, Q. H., and Niu, Y. (2019). Experimental investigation of progressive cracking processes in granite under uniaxial loading using digital imaging and AE techniques. J. Struct. Geol. 126, 129–145. doi:10.1016/j.jsg.2019.06.003
Keywords: crack, creep rupture, crack growth, GDEM, structural heterogeneity
Citation: Na Z, Lixin M, Laigui W and Yibin Z (2022) Numerical simulation of creep fracture evolution in fractured rock masses. Front. Earth Sci. 10:901742. doi: 10.3389/feart.2022.901742
Received: 22 March 2022; Accepted: 29 June 2022;
Published: 26 July 2022.
Edited by:
Yan Du, University of Science and Technology Beijing, ChinaReviewed by:
Cheng Liu, Nanjing Forestry University, ChinaXiaoping Zhou, Chongqing University, China
Hadi Haeri, Islamic Azad University System, Iran
Copyright © 2022 Na, Lixin, Laigui and Yibin. This is an open-access article distributed under the terms of the Creative Commons Attribution License (CC BY). The use, distribution or reproduction in other forums is permitted, provided the original author(s) and the copyright owner(s) are credited and that the original publication in this journal is cited, in accordance with accepted academic practice. No use, distribution or reproduction is permitted which does not comply with these terms.
*Correspondence: Meng Lixin, mlx336699@163.com