Effect of Pyrolysis Temperature on PhysicoChemical Properties and Acoustic-Based Amination of Biochar for Efficient CO2 Adsorption
 Riya Chatterjee1
  Baharak Sajjadi1*
  Wei-Yin Chen1
  Daniell L. Mattern2
  Nathan Hammer2
  Vijayasankar Raman3 Austin Dorris2
- 1Department of Chemical Engineering, School of Engineering, University of Mississippi, Oxford, MS, United States
- 2Department of Chemistry and Biochemistry, University of Mississippi, Oxford, MS, United States
- 3National Centre for Natural Products, School of Pharmacy, University of Mississippi, Oxford, MS, United States
The present study examined the effect of pyrolysis temperature on the physicochemical properties of biochar, activation process and carbon capture. Two different categories of biochars were synthesized from herbaceous (miscanthus and switchgrass) and agro-industrial (corn stover and sugarcane bagasse) feedstock under four different pyrolysis temperatures −500, 600, 700, and 800°C. The synthesized biochars underwent sono-amination activation comprising low-frequency acoustic treatment followed by amine functionalization to prepare adsorbents for CO2 capture. The highest increment (200%) of CO2 capture capacity was observed for sono-aminated samples prepared at 600 and 700°C (maximum improvement for miscanthus), while biochars synthesized at 500 and 800°C demonstrated comparatively lesser increment in adsorption capacities that falls in the range of 115–151 and 127–159%, respectively compared to 600 and 700°C. The elevated pyrolysis temperature (particularly 600 and 700°C) resulted in increased %C and %ash contents and reduced %N contents with enhancement of micro surface area and pore volume. Thus, the superior adsorption capacity of miscanthus (at 600 and 700°C) can be attributed to their large surface areas (303–325 m2/g), high carbon contents (82–84%), and low ash contents (4–5%), as well as %N contents after sono-amination that was twice that of raw char.
Introduction
One of the most critical issues of this century is to accommodate the global energy demand which is increasing as a result of increased population and higher standards of living. Fossil fuels are the major source to meet this energy demand, but they contribute to greenhouse gases and global warming (Popp et al., 2014). In order to reduce the concentration of greenhouse gases such as CO2 from the atmosphere, technologies need to be implemented that would (1) consume greenhouse gas emissions and (2) use bioenergy as an alternate energy source (Haszeldine, 2009). The sources of biofuels are living things or their waste products such as solid biomass (such as wood or charcoal), liquids (such as bioethanol and biodiesel) and biogas (such as methane produced from sewage). The use of biomass has another advantage in that plants absorb carbon dioxide as they grow, reducing net CO2 emissions. Among the biomass to bioenergy conversion processes, pyrolysis has attracted interest because of its advantages in storage, transport and versatility in application such as combustion engines, boilers, turbines, etc. (Jahirul et al., 2012). During pyrolysis, the biomass is heated to produce a gas that can be used to generate power while also producing a solid by-product called biochar. This biochar can be effectively used for preparing adsorbent materials for carbon sequestration. Integrating bioenergy production with carbon sequestration would provide a viable way to mitigate the issue associated with global warming.
Another way to mitigate the emission of greenhouse gases into atmosphere is to apply proper carbon capture and storage technology (CCS). The CCS technology can be divided into (i) solvent based process (absorption), (ii) sorbent based process (adsorption), and (iii) membrane based process (Ünveren et al., 2017). The choice of an appropriate technique involves several factors, such as source and composition of the gas stream and CO2 capture procedure, that is, whether it is pre- or post-combustion. Absorption processes involving aqueous amines are energy intensive due to the high energy requirement of the solvents. Other major drawbacks include corrosion and solvent degradation. As a viable alternate to the liquid solvent-based technique, solid adsorption processes are currently being developed that mostly incorporate carbonaceous materials such as biochars. The most significant advantage of these processes is very low regeneration energy of the solid adsorbents (Dawson et al., 2013). Adsorption by carbonaceous materials is useful since it involves adsorbents with highly porous structure and high surface area; besides, the adsorbents are very inexpensive since these are produced from naturally available materials such as biomasses. Thus, adsorption technique is very popular for CO2 capture applications because it provides high adsorption capacities, fast CO2 adsorption rates, and easy regeneration of the adsorbents (Lee et al., 2008).
Pyrolysis is the most popular technique for converting biomasses to biochar through thermo-chemical decomposition process under oxygen-deprived environment at elevated temperature (Antonakou et al., 2006; Lewis and Fletcher, 2013; Dhyani and Bhaskar, 2018; Amini et al., 2019). The solid carbon-rich product of this process is known as biochar or char, and the volatile fraction of pyrolysis is partly condensed to a liquid fraction called tar or bio-oil along with the formation of a mixture of non-condensable and volatile condensable organic products into low-molecular-weight gases, secondary tar and char via secondary reactions of the primary pyrolysis products (Vizzini et al., 2008; Patwardhan et al., 2011). Depending on the conditions, pyrolysis processes can be classified into three main categories: slow pyrolysis (slow heating rates for a long time, temperatures <300°C), moderate pyrolysis (temperatures of 300–500°C) and fast pyrolysis (fast heat transfer rates over a short time, temperatures greater than 500°C) (Dhyani and Bhaskar, 2018). Literature shows that, during biomass pyrolysis, primary cracking and secondary decomposition along with the formation of oxygen functional groups start around 400–500°C (Liang et al., 2016; Tag et al., 2016; Zhao et al., 2017). Thus, 500°C is considered to be a suitable temperature for the initiation of pyrolysis and production of char (Liang et al., 2016).
Pyrolysis temperature affects the structural and physicochemical properties of biochar such as surface area, pore structures, surface functional groups and elemental compositions (Tag et al., 2016). The effect of pyrolysis temperature on such properties can be ascribed to the release of volatiles at high temperature (Sun et al., 2014). Numerous studies reported that high pyrolysis temperature led to increased biochar surface area (Ahmad et al., 2012; Zhang et al., 2015), higher pH (Hossain et al., 2011), %C content but lower %N content (Zhang et al., 2017). Thus, the selection of suitable pyrolysis temperature is a compromise between the surface and chemical properties as described. Generally, 500–800°C is considered as the optimum range for pyrolysis temperature in the endeavor of producing biochars. Table 1 summarizes the impact of pyrolysis temperature on various physicochemical properties of biochars. These characteristics cumulatively drive the sorption ability of biochar.
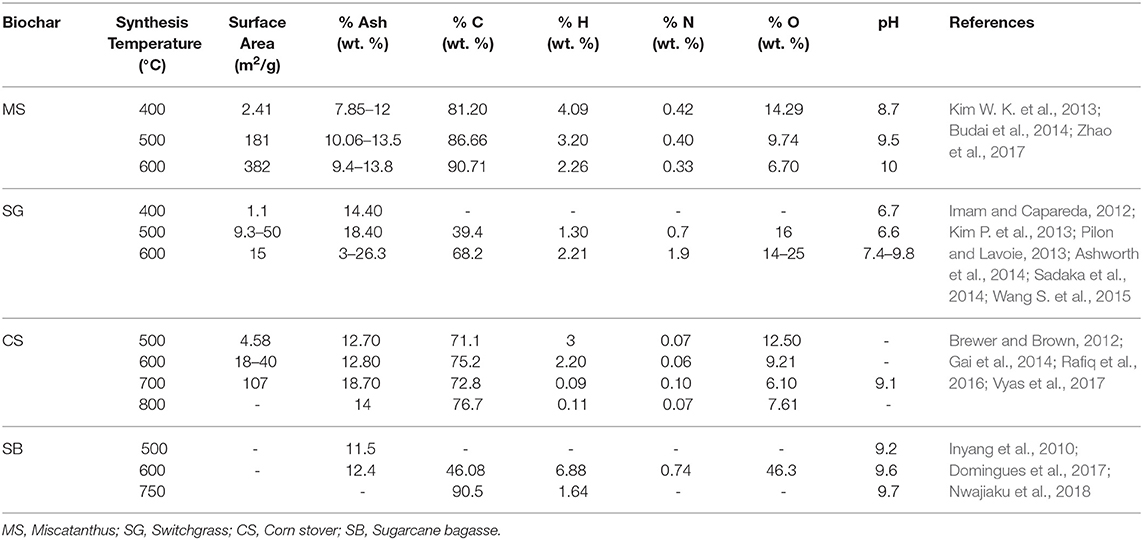
Table 1. Literature review on physico-chemical properties of biochars synthesized at different pyrolysis temperatures.
Adsorption is primarily a surface phenomenon and greatly depends on the surface area and surface functional groups of biochar (Li et al., 2017). Thus, attempts have been made on improving the textural properties and chemical functionality through physical and chemical modifications (Sajjadi et al., 2019b). Physical modification of biochar is aimed at improving surface properties whereas chemical activation with heteroatoms facilitates the addition of functionality (Sajjadi et al., 2018, 2019b). Ultrasonic treatment has recently been introduced as a physical activation technique which is an alternative to high-temperature steam or air oxidation (Hagemann et al., 2018). Ultrasound irradiation results in the formation and collapse of vapor filled microbubbles during the alternate compression and rarefication cycles of ultrasound, which leads to the exfoliation of the layered structure of graphitic clusters (Sajjadi et al., 2018). The interaction of ultrasound waves with graphitic structure was first demonstrated by Stankovich et al. where they found that a mild ultrasonic treatment (fc = 78.6 kHz, 150 W) of graphite oxides in water for 1 h exfoliates its layers and forms stable aqueous dispersions (Stankovich et al., 2006). In addition to exfoliation of graphitic structure, ultrasound treatment opens up the clogged pores, cleans the surface, and facilitates the leaching of ash content of biochar, resulting in increased surface area and porosity (Guittonneau et al., 2010). The similar phenomena were also observed by our research group while studying the sonolysis of biochars under aqueous environment with CO2 bubbling which showed attachment of carbon and increment of heating value of biochar (Chen et al., 2014; Sajjadi et al., 2019a). The above mentioned structural alterations promote chemical activation by providing active sites that can be effectively tuned by chemical modification; e.g., amination that introduces the amino group to the biochar (Guittonneau et al., 2010). Most importantly, acoustic activation through ultrasonic treatment is conducted at near room temperature within a very short duration of time that could significantly reduce energy consumption (Sajjadi et al., 2018) and has advantages over traditional physical activation conducted at very high temperatures (>750°C) (Guittonneau et al., 2010). In addition, the chemical functionalization can be conducted with easy separation of the product from unreacted reagents. Thus, the applied ultrasonic-amination technique provided an energy-efficient and easy route to prepare effective CO2 adsorbent.
In continuation of our pioneering works (Chen et al., 2014; Sajjadi et al., 2019a) the subsequent work revealed that acoustic treatment followed by amine modification using tetraethylenepentamine could intensify the CO2 adsorption capacity of pine wood-based commercial biochar up to 7 times compared to raw char (Chatterjee et al., 2018). To establish the mechanism, the next work studied the role of sonochemical activation incorporating different 1°, 2° and 3° amines (monoethanolAmine- MEA, diethanolAmine- DEA, tetraethylenepentamime- TEPA, polyethylenImine- PEI, and piperazine- PZ), with focus on determining the key role of each parameter, particularly the activation of carboxyl groups as the potential sites for amination to drive the correct mechanism of the activation process (Chatterjee et al., 2019). In the next step, the impact of the carbonaceous structure of biochar on sono-amination and CO2 adsorption was assessed. Thus, eight different biochars were synthesized from three different classes of biomasses, namely herbaceous residue (Miscanthus- MS; Switchgrass- SG); agro-industrial residue (Corn Stover- CS; Sugarcane Bagasse- SB) and crop residue (Sorghum- SR; Wheat Straw- WS; Rice Husk- RH and Rice Straw- RS). The study indicated that biochars with high carbon contents, low ash contents and high surface areas can be tuned effectively through the combined sono-amination technique and had significant improvement in adsorption capacity with the following trend: herbaceous residue (MS>SG) > agro-industrial residue (CS>SB) > crop residue (SR>WS>RH>RS) (Chatterjee et al., 2019).
The last step of this series of our project is dedicated to investigate the synergistic and antagonistic impact of pyrolysis temperature on ultrasound activation and the subsequent adsorption capacity of biochar. The pyrolysis temperature has significant impacts on biochar characteristics (Zhang et al., 2017). Higher temperature results in higher carbon content while losing nitrogen, hydrogen and oxygen contents of biochar structure (Brassard et al., 2017) with increase in the ash content and a reduction of volatile materials (Imam and Capareda, 2012; Kim W. K. et al., 2013; Budai et al., 2014; Zambon et al., 2016; Zhao et al., 2017). However, each pyrolysis system possesses its own thermal properties and thereby confers differential physical and chemical properties. Thus, it is difficult to discern the importance of each activation condition on individual physicochemical properties of biochars, and thereby on the biochars' performance in CO2 capture. The few literatures reporting the implications of high-temperature physical and chemical activation on biochar properties have been limited to pyrolysis temperatures of 350–550°C (Mia et al., 2017; Gámiz et al., 2019). Thus, the present study aimed to assess the importance of a wide range of higher pyrolysis temperatures (500–800°C) on biochar properties and its effect on subsequent low-temperature ultrasound-assisted physicochemical activation. To our best knowledge, there is hardly any previous study that combines the impact of pyrolysis temperatures on the following parameters: structural and chemical properties of chars, effectiveness of subsequent activation conditions, and the integrated effect on CO2 adsorption behavior. Thus, the present study completes the gap and provides comprehensiveness to the field of biochar research by amalgamating four different concepts: pyrolysis parameters, biochars properties, activation conditions and impact of all of the above mentioned parameters on adsorption capacities. Thus, to achieve this, four biochars which have already shown the maximum CO2 adsorption potential in our previous project (i.e., MS, SG, CS, SB) were selected for this work to obtain: (I) the effect of different pyrolysis conditions (500, 600, 700, and 800°C) on physicochemical properties of the raw biochars, (II) the interaction between the pyrolysis temperature and the sonochemical activation, and (III) the key role of the pyrolysis temperature on the CO2 adsorption ability of the activated biochars.
Materials and Methods
Materials
Four common agro-based biomasses from the Idaho National Laboratory were chosen for the study, namely miscanthus, switchgrass, corn stover and sugarcane bagasse. The following reagents for chemical functionalization were purchased from Sigma Aldrich: EDC (98% purity) [N-(3-dimethylaminopropyl-N'-ethylcarbodiimide hydrochloride], HOBt (97% purity) [hydroxybenzotriazole], TEPA [tetraethylenepentamime], hydrochloric acid-37%, and acetone. Sodium hydroxide was purchased from Fisher Scientific and deionized water was obtained from Milli-Q ultrapure water tap (Millipore Sigma). All chemicals used in this work were of analytical grade.
Experimental Method
Pyrolysis of Biochar Under Different Temperature Ranges
The initial grinding and drying procedure has been described in our previous work (Chatterjee et al., 2019). The biomass samples were ground and sieved in the size range 75–250 μm and were dried under vacuum at 60°C overnight prior to pyrolysis. Then the dried biomasses were filled into crucibles (made of Nickel-Chromium-Iron Alloy), covered with lids and placed in the muffle furnace with 3 crucibles of the same biomass at a time to avoid any non-homogeneous behavior during pyrolysis. To produce biochar, the furnace was heated up to the desired temperature (with 20°C/min heating ramp) under continuous nitrogen gas flow and was held there for 2 h. Then the furnace was switched off and the crucibles were allowed to cool to room temperature before taking them out under continuous nitrogen gas flow. The process was repeated for each pyrolysis temperature (500, 600, 700, and 800°C). Upon cooling to room temperature, the biochars were transferred into glass vials and sealed with parafilm and stored for further treatments and characterizations.
Physical Activation of Biochar Under Acoustic Treatment
The synthesized biochars underwent a two-step activation technique—physical activation using low-frequency ultrasound and then chemical activation in the presence of TEPA. The physical activation was carried out with 3 g of biochar in 250 ml of water for 30 s using an ultrasound sonicator equipped with controller and horn (QSonica model no. Q700). Our previous study elucidated that 30 s of sonication provided optimum adsorption capacity that was further justified based on the literature (Hamdaoui et al., 2003; Verma et al., 2012). However, increasing the duration beyond that leads to the disarrangement of the layered graphene clusters of biochars and tends to block the porous structure. This negatively affects the textural properties and adsorption capacity of biochar. After physical activation, the biochar was subjected to the following chemical activation steps.
Chemical Functionalization of Biochar With TEPA
Chemical activation followed two steps. At first, the ultrasonicated biochar-water suspension was mixed with the activating agents EDC and HOBt (3.375 g of each reagent with 3 g of biochar) followed by stirring for 24 h with slight heating (at 35°C) (Chatterjee et al., 2018). The mixture was then filtered and dried at 60°C under vacuum overnight. In the next step, the dried sample was suspended in methanol and TEPA was added to the solution with a 2.5 times weight ratio with respect to dried biochar sample. The mixture was subjected to stirring with heating at 35°C for 24 h, filtered and washed with 200 mL of 1N NaOH, 200 mL 1N HCl and 200 mL of acetone and dried as before. EDC is preferred over other carbodiimides such as DCC (dicyclohexylcarbodimide) because it is soluble in water which results in the easy separation of the product and unreacted reagent. HOBt is usually applied as an additive to prevent undesirable side reactions which may reduce the yield of the product. Further explanations and detailed mechanism of the activation process have been demonstrated in our previous works (Chatterjee et al., 2018, 2019).
Characterizations of the Adsorbent
The biochars, both raw and functionalized, were characterized using Scanning Electron Microscopy for the determination of surface morphology using JEOL JSM-7200 FLV SEM instrument. Surface area and porosity (textural properties) were measured using Micromeritics 3-Flex Surface Area Analyzer.
The adsorption isotherm study was conducted under liquid nitrogen environment at 77 K and the technique measures volume adsorbed by the sample as the relative pressure is gradually increased from 0 to 1. Then, the mesopore area and pore volume were calculated by the BET (Brunauer, Emmett, and Teller) equation:
Where p, p0, v, vm, and c, respectively represent equilibrium pressure of adsorbate at the temperature of adsorption, saturation pressure of adsorbate at the temperature of adsorption, adsorbed gas quantity, monolayer adsorbed gas quantity, and BET constant.
The t-plot based on the de-Boer equation was also used to calculate micropore surface area and pore volume.
Where p, v, vm, K2, and K1 respectively represent equilibrium pressure of adsorbate at the temperature of adsorption, adsorbed gas quantity, monolayer adsorbed gas quantity, parameter related to the gas-solid interaction which are function of temperature and the properties of the adsorbate.
Mesopore area was calculated by subtracting t-plot area from the BET surface area. In a similar way, t-plot micropore volume was subtracted from total pore volume to get mesopore volume.
Elemental constituents were determined using Perkin Elmer Series II CHNS/O Analyzer. The spectroscopic studies were conducted using Agilent Cary 660 Fourier Transform Infrared (FTIR) instrument to evaluate the change of surface functional groups, and degree of graphitization and defects were measured using LabRam HR Evolution Raman Spectroscopy technique.
The thermal stability evaluation of the biochars was performed by thermogravimetric analysis (TGA Q500, V20.13 Build 39, TA Instrument). Approximately 7–8 mg of raw and ultrasound-amine functionalized miscanthus biochars synthesized at 500, 600, 700, and 800°C were weighed into platinum crucible and was subjected to thermogravimetric analysis in a nitrogen flow (gas flow of 60 mL·min−1) at a heating rate of 5°C min−1, from 21 to 700°C. The surface crystallinity of the biochar samples were determined from the XRD analysis in a Rigaku powder diffractometer (Rigaku, Japan) with Cu Kα radiation (λ = 0.15406 nm). The tube voltage was 45 kV, and the current was 40 mA. The XRD diffraction patterns were taken in the 2θ range of 10–80° for raw and ultrasound amine activated of miscanthus biochars synthesized at 500, 600, 700, and 800°C.
CO2 Adsorption Experiments
The experimental set-up and detailed procedures of the tests were reported in our previous studies (Chatterjee et al., 2018, 2019). In brief, adsorption experiments were conducted in a temperature-controlled tubular reactor (alumina oxide, Al2O3). For each experimental run, a biochar sample of 2 g was put inside the tube and heated under helium (99.99%) gas flow (500 cm3 min−1) at 378 K for 1 h to remove moistures from the adsorbent. Then, the reactor was cooled to 333 K and the helium gas was switched to a simulated flue gas consisting of 10 vol. % CO2 balanced with He. A CO-CO2 analyzer (ZRH Infrared Gas Analyzer, CAI) connected to the set-up was used to detect the concentration of CO2 before and after the experiment. The calculation of adsorption capacity was based on the change in concentration of CO2 after adsorption (Chatterjee et al., 2018).
Results and Discussions
Surface Morphology Analysis
Effect of Pyrolysis Temperature on Surface Morphology of Raw Chars
The SEM images of raw and activated biochars, pyrolyzed at 700°C temperature are presented in Figures 1–4. As observed, the char particles show different sizes and shapes that may be attributed to the sample preparation such as grinding, sieving and treatment. The raw samples show overall similarity in their surface morphology, having rough and non-porous structure. Images obtained revealed two main morphological features for all biochar samples: fiber structures and pith. The fibrous surface is formed by parallel stripes and is partially covered with residual material, and pith is a more fragile and fragmented structure which is primarily cracks that connect neighboring cells on the surface of the walls. As observed from Figure 1A, raw MS sample is characterized by jagged particles of varying size with vascular elements packed in bundles and possess a relatively flat surface which is also consistent to the literature (Zhang et al., 2014; Wang X. et al., 2015). SEM micrographs of raw SG samples (Figure 2A) exhibit rough surface with long ridges, resembling a series of parallel lines. Similar structural features are also observed for CS (Figure 3A) and SB (Figure 4A), which exhibit rough, irregular and bundle like shapes. In addition to that, all samples exhibit fracture and cracks attributed to release of volatile matters during pyrolysis. These morphological observations were further substantiated based on the surface area analysis data using BET technique as described in the subsequent section.
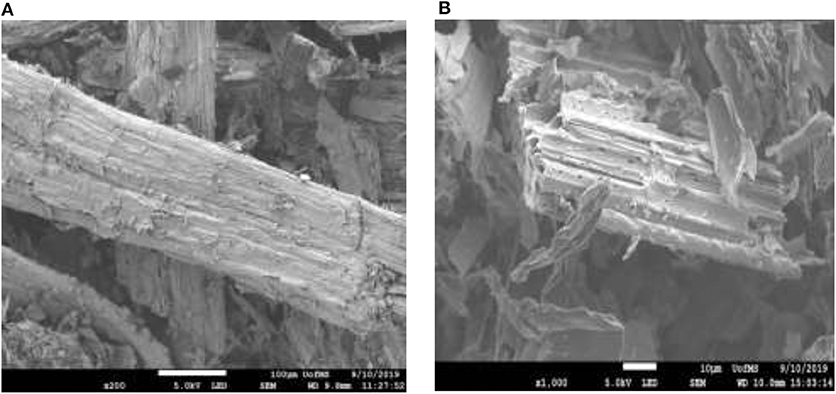
Figure 1. SEM images of (A) R-MS 700; (B) US-MS 700.
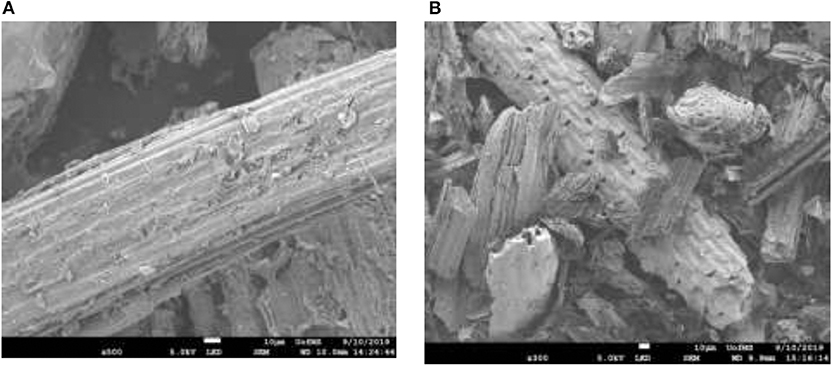
Figure 2. SEM images of (A) R-SG 700; (B) US-SG 700.
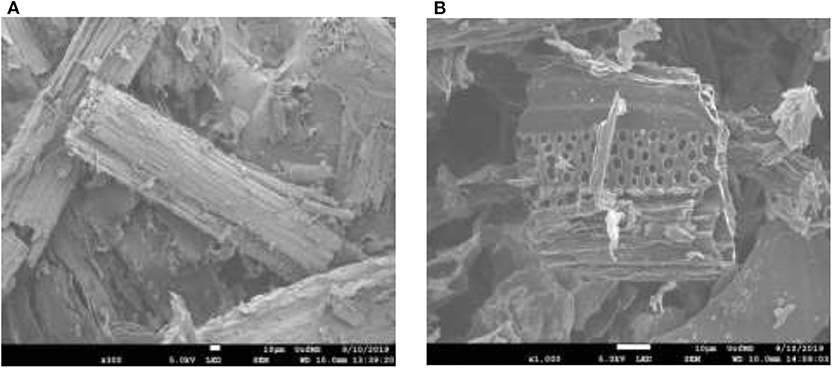
Figure 3. SEM images of (A) R-CS 700 and (B) US- CS 700.
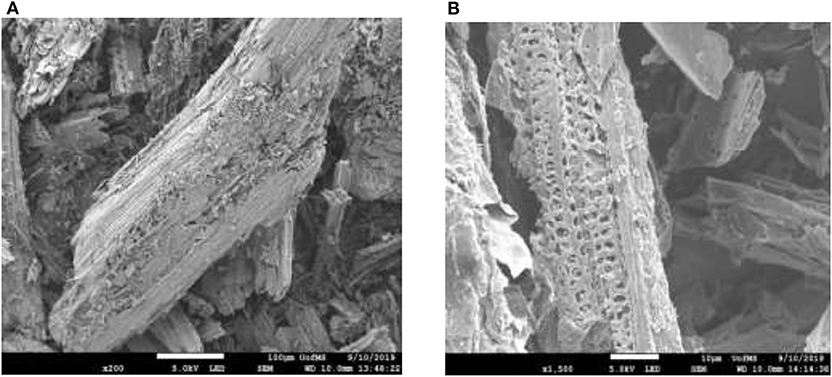
Figure 4. SEM images of (A) R-SB 700 and (B) US- SB 700. MS, Miscatanthus; SG, Switchgrass; CS, Corn stover; SB, Sugarcane bagasse; R, Raw; US, Ultrasound Activated.
Effect of Pyrolysis Temperature on Surface Morphology of Ultrasound Activated Chars
Pyrolysis temperature has a prominent role in promoting the ultrasound effect. Macroscopically, the samples become very fine powders under ultrasound irradiation and microscopically, acoustic activation causes a structural degradation by opening/creation of new micro-pores as observed from the Figures 1B, 2B, 3B, 4B. The maximum pore generation was observed for 700°C, accordingly SEM images of sonicated chars pyrolyzed at 700°C have been presented. As observed from the figures the effect of sonication is more observable for agro-industrial (CS, SB) chars than herbaceous biochars (MS, SG). For example, US-MS 700 sample (Figure 1B) shows the least alteration to their structure. Similarly, For US-SG 700, SEM image (Figure 2B) depicts that acoustic treatment slightly affected the structures. In contrast to herbaceous biochars, US-CS 700 (Figure 3B) and US-SB 700 (Figure 4B) show significant increased porosity and greater structural deformations upon sonication. This structural deformation can be explained because of the thinner walls of CS and SB than MS and SG. This leads to the generation of porosity more in the agro-industrial residues (CS and SB) than herbaceous residues (MS and SG).
Surface Area Analysis
Effect of Pyrolysis Temperature on Surface Are of Raw Chars
The surface area and pore volume (both micro and micro-meso porosity) of raw and ultrasound activated samples pyrolyzed under different temperatures are reported in Table 2. As observed, maximum surface area values for both the microporosity (R-SG-700 with surface area 325 m2/g) and micro-mesoporosity (R-SG-800 with surface area 351 m2/g) are observed for herbaceous residues, whereas the minimum values for the microporosity (R-SB-500 with surface area 83 m2/g) and micro-mesoporosity (R-SB-500 with surface area 138 m2/g) are observed for agro-industrial based chars. This shows that surface area is significantly affected by the biochar feedstock and pyrolysis temperature.
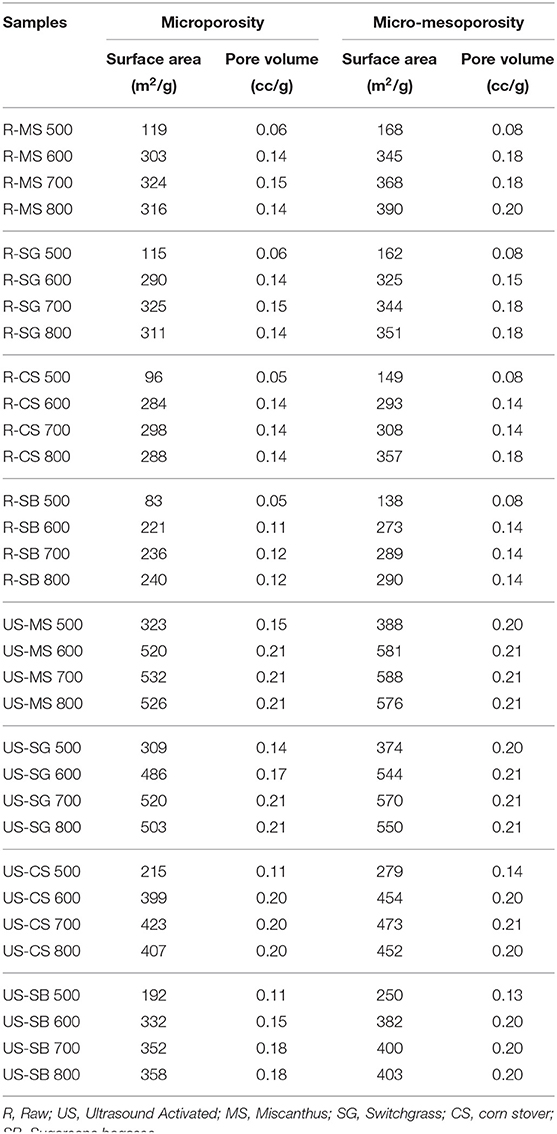
Table 2. Surface area analysis of raw and sono-chemically activated biochars samples synthesized at different pyrolysis temperatures.
Surface area and pore volume for herbaceous chars (MS and SG) are higher than agro-industrial chars (CS and SB). Accordingly, the microsurface area and pore volumes for MS and SG ranged between 115–325 m2/g and 0.06–0.16 cc/g over the temperature of 500–800°C. The increase of pyrolysis temperature from 500 to 600°C resulted in a significant and sudden jump in the surface area (from 119 to 303 m2/g for MS and from 115 to 290 m2/g for SG) and the pore volume of 0.06–0.14 cc/g for both the herbaceous biochars. This trend is similar to what is reported in the literature for MS (Suliman et al., 2016; Zhao et al., 2017) and SG (Zanzi et al., 2002; Cetin et al., 2005; Guerrero et al., 2005). The enhancement of surface area and pore volumes was caused by the degradation of the organic materials (hemicelluloses, cellulose, and lignin) and the formation of vascular bundles or channel structures during pyrolysis (Kim W. K. et al., 2013; Li et al., 2013). Lee et al. reported that cellulose and hemicellulose in the MS decompose at 500°C (Lee et al., 2013). When the applied pyrolysis temperature is increased beyond 500°C, the rupture of the hemicellulose along with other organic compounds generates more micropores within biochar (Jeong et al., 2016). The decomposition of lignin and the quick release of H2 and CH4 contribute to a sharp increase of the surface area and pore volumes from 500 to 600°C. Further increase of the temperature to 700°C magnifies surface area and pore volume, especially for the micropores. This is mostly attributed to the further degradation of lignin and the reaction of aromatic condensation (Chen et al., 2012), which increases the release of volatile matter and creates more pores. However, increasing the pyrolysis temperature beyond 700, (up to 800°C) resulted in decreased surface area and pore volume. This can be described as a result of elevated temperatures that cause structural ordering and merging of pores, thus reducing the char surface area (Kumar et al., 2017).
Although surface areas for agro-industrial chars are lower than herbaceous ones, they follow a similar trend. For instance, CS and SB exhibited a significant increase in surface area (96–284 and 83–221 m2/g for CS and SB, respectively) and pore volumes (0.05–0.14 and 0.05–0.11 cc/g) upon increasing the temperature from 500 to 600°C. Higher pyrolysis temperature caused higher devolatilization, resulting in more pore volume in the samples and, in turn, a greater surface area up to 700°C (Zanzi et al., 2002; Onay, 2007). However, the temperature increase to 800°C resulted in reduced micro surface area for CS. The reactivity of the biochar samples is strongly affected by the surface area (Onay, 2007). Thus, biochar samples produced within the temperature range of 500–700°C showed better reactivity and adsorption behavior than biochar samples produced at 800°C.
Effect of Pyrolysis Temperature on Surface Area of Ultrasound Activated Chars
As found from Table 2, upon sonication the microporous surface area and pore volumes for all the biochars increased. Additionally, as for raw chars, ultrasonicated herbaceous biochars possessed higher surface areas and pore volumes than agro-industrial chars. The sonicated samples also showed significant increases in surface area (323 to 520 m2/g for MS, from 309 to 486 m2/g for SG, from 215 to 399 m2/g for CS, and 192–332 m2/g for SB) with increasing the pyrolysis temperature from 500 to 600°C. Further elevation of temperature to 700°C exhibited enhancement in surface areas followed by reduction at 800°C for all the US-treated samples except SB which showed slight increment from 352 to 358 m2/g. US-MS 700 showed the maximum surface areas with the values of 532 and 588 m2/g for micro and micro-meso porosity, respectively, whereas US-SB 500 showed minimum values for the micro and micro-mesoporous surface areas (192 and 250 m2/g). Biochars pyrolyzed at 700°C demonstrated the highest surface areas, indicating the most effective interaction with ultrasound waves. It is worth noting that the micro surface area of all biochars increased by almost 200 m2/g (on average) with a pyrolysis temperature increase of 500 to 700°C. However, the same increment was observed by 30 s of ultrasound activation at ambient conditions. Ultrasound cavitation results in the exfoliation of the graphitic clusters of the biochar structure, removal of mineral matter, and opening of the pores, thereby increasing microporous surface area. Similar observations are found in the literature and in our previous studies (Stankovich et al., 2006; Chen et al., 2014; Chatterjee et al., 2018, 2019; Sajjadi et al., 2019a). Similar to the surface areas, the pore volumes also exhibit a trend where maximum and minimum pore volumes can be obtained for US-MS 700 and US-SB 500 with the values of 0.21 and 0.11 cc/g, respectively. The surface area data can be also verified using the SEM analysis results as observed from Figures 1–4. For instance, among the ultrasound treated samples, US-MS 700 and US-SG 700 showed improved pore generation that corresponds to their high micropore surface area (532 and 520 m2/g) and pore volume (0.21 cc/g) values. Hence, based on the surface area analysis results it can be emphasized that miscanthus biomass pyrolyzed at 700°C and sonicated had the highest possible microporous surface area that would provide more active sites for amine activation to improve the CO2 adsorption capacity.
The surface area of the samples can be further justified based on the adsorption isotherm plots as observed in the Figures S2, S3. The plots correspond to the volume of adsorbed gas with respect to the relative pressure, indicating adsorption ability of the chars. In addition to that, the isotherms also characterize the adsorbent materials in terms of their porosity. For instance, the shape of the above described isotherms are similar to Type I isotherms (as per IUPAC classification) which are common for microporous solids (Brunauer et al., 1940). A Type I isotherm is usually observed when the attractive forces between adsorbed gas and adsorbent are greater than those between the molecules of the gas (Brunauer et al., 1940). Hence, the isotherms further provide a confirmation of the porous nature of the adsorbent materials.
Elemental Analysis
Carbon (C), nitrogen (N) and hydrogen (H), oxygen (O), sulfur (S), and the ash content of raw and activated biochars synthesized under different temperatures are summarized in Table 3 and the corresponding organic analysis on a dry ash-free basis are reported in Table S1. Oxygen (O) content was calculated by difference (100%–%C+%H+%N+%S+%ash).
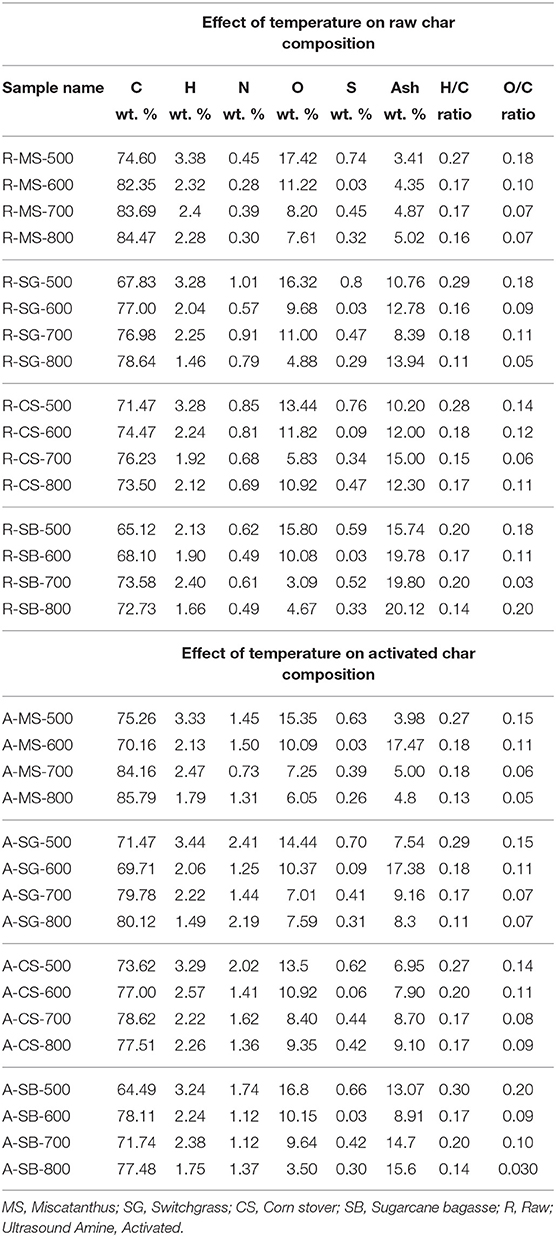
Table 3. Elemental compositions (dry basis) of raw and activated biochar samples synthesized at different pyrolysis temperatures.
Effect of Pyrolysis Temperature on the Elemental Composition of Raw Chars
Increasing pyrolysis temperature had a significant effect on the elemental constituents and H/C (the degree of aromaticity) (Al-Wabel et al., 2013) and O/C (the degree of polarity) ratios (Mimmo et al., 2014) of raw biochars. The following notable changes are observed for MS in the temperature range 500–600°C: %C increment from 75 to 82%; reduction in H/C and O/C ratios from 0.27 to 0.17 and 0.18 to 0.07, respectively, and %N content reduced by half. SG behaved in a similar manner: %C content showed significant increase from 68 to 77% with lowering of H/C and O/C ratios in the range of 0.29 to 0.16 and 0.18 to 0.09, respectively, and the increment of ash from 10.8 to 12.8%. Further increases in pyrolysis temperature exhibited small changes in %C and ash content (although there was wider variation in ash content for SG) and almost no changes in both H/C and O/C ratios (although there was wider variation in O/C for SG). The increase in carbon content at higher temperature reflects the increasing degree of carbonization (Zhou et al., 2013) and the decrease in H and O contents is likely due to dehydration reactions, the decomposition of the oxygenated bonds, and the release of low molecular weight byproducts containing H and O. In terms of structural transformation, the higher extent of carbonization indicates a more aromatic structure (Al-Wabel et al., 2013), and loss of O and H functional groups (such as hydroxyl, carboxyl, etc.) indicates a more hydrophobic structure (Peterson et al., 2013). Reduction in %N and %S contents can be attributed to the volatilization of nutrients at a high temperature which were resistant at low temperature and not easily volatilized. The observation is consistent with the literature, too (Zhou et al., 2013; Yuan et al., 2014). The results of the present study also generally exhibited enhancement of ash content with pyrolysis temperature, mainly due to the increase in the concentration of minerals (such as Na, Mg, Ca, K, etc.) in biochar samples with temperature since these elements are not lost by volatilization (Zhou et al., 2013).
The two agro-industrial-based biochars (CS and SB) showed similar trends. For instance, CS follows an increasing trend of %C content up to 700°C with a gradual rise of ash content and reduction of H/C and O/C ratios and %N contents. But a further increase in pyrolysis temperature (to 800°C) resulted in a reduction in %C content and similarly follows a reverse trend for other elemental constituents. Similar to herbaceous chars, the trend for elemental analysis of agro-industrials is similar to the trend for surface area analysis data (Table 2) that showed a substantial change in surface area and pore volumes up to 700°C with a reduction at 800°C. Although %N content was maximum at 500°C, maximum %C content was achieved at 700°C. In comparison to other biochars, SB has comparatively lower %C content that ranged between 65 and 74% in the temperature interval of 500–800°C which is also reflected in Table 2 that showed the lowest values of surface area for SB than any other raw biochar samples. Similar to CS, it generally showed increased %C and ash content, and reduced H/C-O/C ratios and %N content, for the temperature range of 500–800°C, although values at 700°C were often the most extreme. Based on the above discussion it can be suggested that herbaceous biochars showed greater variations in elemental compositions compared to agro-industrial chars for the pyrolysis temperature range of 500–800°C.
Effect of Pyrolysis Temperature on Elemental Composition of Ultrasound Amine Activated Chars
As per our previous studies, amination usually caused a reduction in ash content. Removal of ash from the biochar structure could be attributed to the washing away of mineral contents of the biochars during aqueous modifications (Kim W. K. et al., 2013). On the other hand, ash content increases with temperature, as organic components are volatilized. These two contradictory effects caused some irregular alterations in ash content of biochars (particularly in herbaceous chars). However, an increasing trend was observed in the ash content of agro-industrial-based biochars with temperature, indicating the domination of temperature effect over amination impact. In order to prevent misinterpretation concerning organic content, elemental analysis of aminated samples is discussed by eliminating the impact of ash alteration.
Table S1 (organic analysis) depicts gradual increment in %C contents of aminated MS samples with temperature, which is consistent to what was obtained for raw chars. Similar to MS, pyrolysis temperature caused increment of (ash-excluded) %C contents from 76 to 91% in raw SG chars to 77–88% in activated chars. Consistent with these observations, the C content of agro-industrial-based biochars (CS and SB) increased with temperature and also with respect to the %C content of their corresponding raw chars. As a general trend and by eliminating some minor fluctuations, %O contents for aminated samples were reduced with temperature, and were lower than the corresponding raw chars, since TEPA has no oxygen. The activated samples did not show any significant change in H/C and O/C ratios compared to the raw samples, despite substantial differences for C or O (Table 3) in sono-aminated vs. raw chars for some samples (MS600, SG600, SB600, and SB800 for %C; SB700 for % O). This can be explained as a result of changes of both numerator and denominator for H/C and O/C ratios, making the entire ratio almost equal.
As expected, the %N content of the activated biochar significantly increased, in the range of 2–6 times in MS and 1.6–2.6 times in SG samples, compared to the corresponding raw chars, since the aminated chars incorporated N-containing TEPA. In terms of temperature effects, the maximum of N content was observed in the lower temperatures (600°C for MS and 500°C for SG), the N content was reduced for middle-ranged temperatures (600 or 700°C) and enhanced by further increase of temperature (to 800°C). Similar behavior was observed in the two agro-industrial-based biochars (CS and SB). It can be concluded that elevated pyrolysis temperature showed overall reduction in elemental %N contents of both raw and aminated chars (Table S1), though a sudden jump in N content of almost all samples was observed at 800°C. In addition, the changes of N content were more prominent in herbaceous chars compared with agro-industrial-based biochars. Thus, the above analysis show that pyrolysis temperature show overall increase in %C and %ash contents whereas %H, %O, and %N show reduction.
FTIR Analysis
FTIR spectra of the raw and aminated biochars derived under different temperatures are depicted in Figures 5A–D. The baselines of the graphs were revised in Origin lab (Version 2019b) to allow a correct comparison of the intensity of the peaks. The original IR plots are shown in Figure S1. As found from the figures, the spectra include O-H stretching vibrations of hydrogen bonded hydroxyl groups at 3,300–3,600 cm−1, and CO2 absorption peak at 2,300 cm−1. The peak at 1,600 cm−1 is ascribed to carboxylate (COO-) and 1° amine N-H bending, (Liu et al., 2015) and aromatic C=C stretch is ~1,400 cm−1 (Zhao et al., 2017). The peak around 1,026 cm−1 is attributed to C-O stretching vibrations or the C-N stretch of an aliphatic primary amine (Coates, 2006).
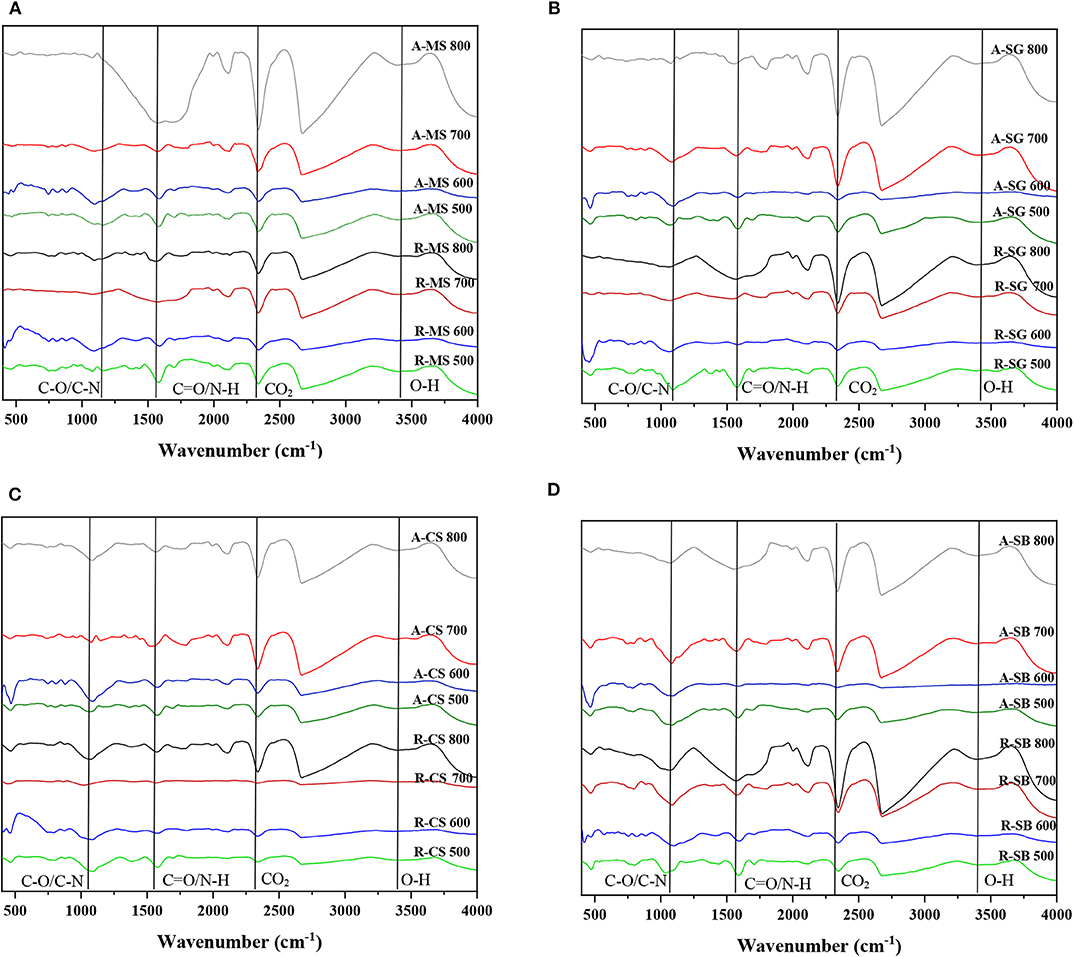
Figure 5. FTIR spectra of raw and activated samples (A) miscanthus, (B) switchgrass, (C) corn stover, and (D) sugarcane bagasse synthesized at different pyrolysis temperatures.
Effect of Pyrolysis Temperature on Surface Functional Groups of Raw Chars
As observed from the figures biochars began to increase aromatic deformation at higher pyrolysis temperature particularly at 800°C. Most of the biochars showed intensified peak at 1,400–1,600 cm−1 attributed to aromatic C=C stretching except for MS. This result is likely due to the degradation and depolymerization of lignocellulosic structure. This further indicates the decrease of aliphatic hydrocarbon and development of aromatic structure of biochar with increasing pyrolysis temperature (Major et al., 2018) as found from elemental analysis results that showed increased %C content at elevated temperature (Table 3 and Table S1). The other notable change is the reduction of the peak at 1,600 cm−1, the highest intensity of which is observed in pyrolysis temperature of 500°C; this can be explained as a result of removal of oxygen functional groups at elevated temperature which is otherwise observed at lower temperature such as 500°C and consistent with the elemental analysis results (Table 3). However, its intensity was typically reduced at higher temperatures. This behavior is observed for all the four biochars.
Effect of Pyrolysis Temperature on Surface Functional Groups of Ultrasound Amine Activated Chars
The ultrasonic-amine functionalized spectra show shifts in peaks due to interaction between surface functional groups and amino groups and the subsequent amine attachment. Ultrasonic treatment resulted in cleaning the surface which was also observed in the SEM images Figures 3, 4. The FTIR results for aminated samples showed amino or nitrogen containing functionality such as C-N at 1,000–1,250 cm−1, which is attributed to the attachment of aliphatic amine. For instance, aminated MS samples showed strong C-N peak at 600°C compared to raw char which is also in accordance with %N content of A-MS-600 exhibiting 5 times increased value than R-MS-600 along with intense amine peak for A-MS-500 and A-MS-700 over the R-MS 500 and R-MS 700. Similarly, A-SG 600 and A-SG-700 showed improved amination than R-SG 600 and R-SG 700. A-CS 600, A-CS-700, A-CS 800 exhibited stronger C-N peak over R-CS 600, R-CS 700, and R-CS 800. Also aminated SB samples such as A-SB 500 and A-SB 700 have enhanced C-N peak than R-SB 500 and R-SB 700.
Raman Analysis
Raman spectroscopy combines a prominent surface selectivity and an exceptional sensitivity to the degree of structural order (Ashworth et al., 2014). It is considered to be one of the most informative methods for investigation of the structural perfection of carbonaceous material (such as biochar). Figures 6A–D show the Raman spectra of all raw and activated biochar samples synthesized under different temperature ranges- 500, 600, 700, and 800°C. The spectra exhibit two prominent peaks at 1,400 and 1,600 cm−1 designated as D and G peaks. The D-band is attributed to in-plane vibrations of sp2 bonded carbon (intramolecular C–C vibration of aromatic carbon layers) within structural defects (Pilon and Lavoie, 2013). The G-band arises from the in-plane vibrations of the sp2-bonded crystallite carbon (intermolecular shear vibration between individual C-layers) (Sadaka et al., 2014). The ratio of the disorder-induced band (D band) to the Raman-allowed band (G band) is termed the intensity ratio (ID/IG). This describes the amount of disorganized material present (Wang S. et al., 2015). The lower the ID/IG ratio, the higher the degree of graphitization of the carbonaceous structure. The intensity ratio values of all the samples have been reported in Table S2.
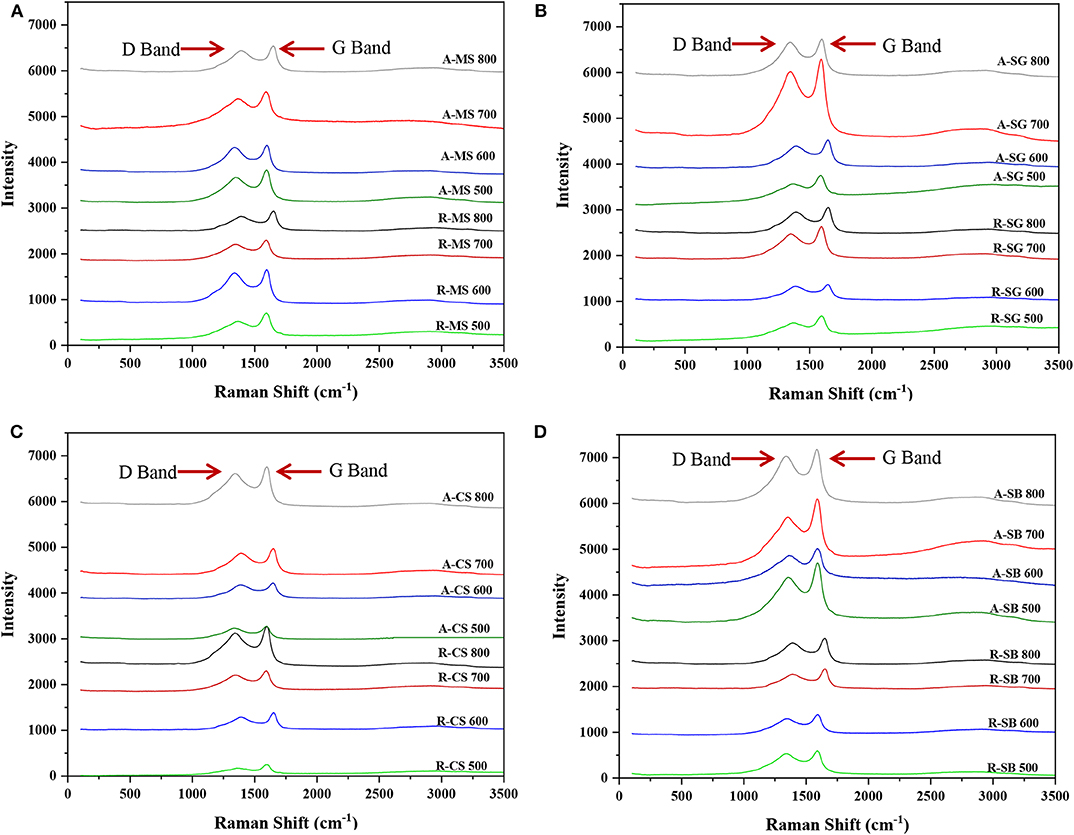
Figure 6. Raman spectra of raw and activated samples (A) miscanthus, (B) switchgrass, (C) corn stover, and (D) sugarcane bagasse synthesized at different pyrolysis temperatures.
Effect of Pyrolysis Temperature on Graphitic Structure of Raw Chars
The ID/IG ratio for this category falls in the following range- 0.65–0.88 for MS, 0.70–0.88 for SG, 0.58–0.83 for CS and 0.59–1.01 for SB. For all of the biochar samples, an increment in the ID/IG ratio was observed with increasing pyrolysis temperature, indicating that the structure of the biochar becomes more and more disordered. A similar observation has been reported by Major and Jones et al. where the authors explained this increasing trend of the disorder as the evolvement of gas species including CH4, CO2, CO, and H2O forming throughout pyrolysis (Brewer, 2012; Vyas et al., 2017). These gasses emanate throughout the structure, promoting disorder until >1,000°C. In addition, the most notable change in the ID/IG intensity ratio of both herbaceous and agro-industrial chars was observed when the temperature was raised from 500 to 600°C followed by a slight increment from 600 to 800°C. This trend can be correlated to Tables 2, 3 that showed significant changes in surface areas and elemental compositions, respectively, when pyrolysis temperature was increased from 500 to 600°C, irrespective of the biochar type.
Effect of Pyrolysis Temperature on Graphitic Structure of Ultrasound Amine Activated Chars
As a result of the addition of disordered functional groups, the ID/IG intensity ratio is expected to be greater for sono-aminated chars compared with raw samples. Consistent with this, almost all activated biochars (except A-SG-600/700 and A-SB-700/800) demonstrated a significant increase in the ID/IG ratio compared with their pristine condition (Table S2). The maximum values were observed for MS, ranging from 0.78 to 0.96 for 500 to 800°C, respectively, consistent with their surface area data (Table 2). SG and CS showed similar behavior in terms of intensity ratio, but exhibited slightly lower values than MS. Compared to other activated biochar samples, SB showed the least ID/IG changes for 500, 600 and 700°C, though the value increased to 0.89 by a further increase of temperature to 800°C.
Thermal Stability Analysis
Thermogravimetric analysis and differential thermogravimetry curves for all the biochars are presented in Figures 7A,B. The mass loss occurred slowly around 60–70°C, which is associated with the loss of the initial moisture of the raw sample observed in Figure 7A (Santos et al., 2015). Beyond this, the main mass losses started at around 310–320°C for R-MS-500 and 350–390°C for R-MS-600 and R-MS-700, respectively and followed the trend as observed in the literature (Zhao et al., 2017). For MS-800 the curve is mostly flat indicating the negligible loss due to its high synthesis temperature. The above mentioned weight loss can be attributed to the degradation and decomposition of organic materials (Sun et al., 2014). Above 600°C, decomposition for all the biochars completed and the curves became stable. It was interesting to note that the total weight losses resulting from thermal degradation were 34.3, 24.9, 22.3, and 6.6% for MS-500, MS-600, MS-700, and MS-800, respectively. This furthermore proves that the lower temperature derived biochars were less thermally stable than the higher temperature derived ones, probably because they were not fully carbonized (Sun et al., 2014; Zhao et al., 2017).
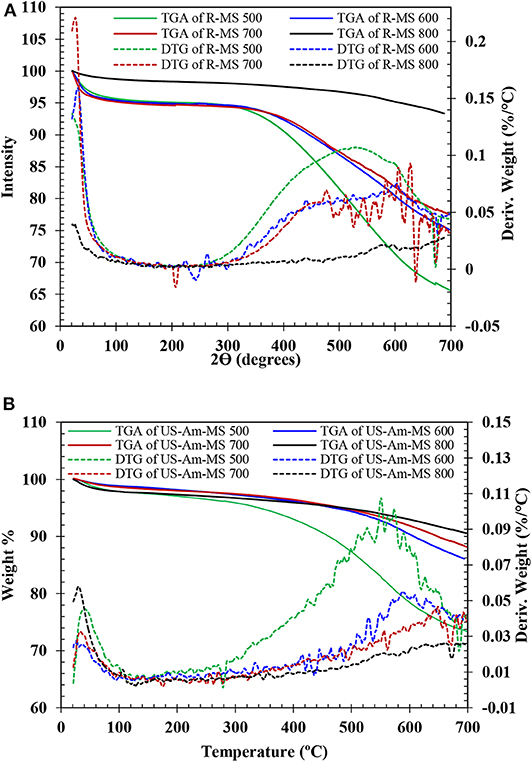
Figure 7. TGA-DTG curves of (A) raw and (B) activated miscanthus samples synthesized at 500, 600, 700, and 800°C.
The TGA curve for aminated samples (7B) have similar trend as observed for raw samples where the samples showed reduction in mass around 60–70°C attributed to the desorption of moisture. The mass loss around 450–460°C (TGA curve of Figure 7B) corresponds to the decomposition of the immobilized amine groups (Plaza et al., 2008). This higher decomposition temperatures of the amine activated samples (in comparison to the raw samples) revealed that the amine groups were effectively stabilized on the biochar (Plaza et al., 2008). The total weight loss for these samples can be listed as 26.7, 13.9, 11.8, and 9.5%, respectively for US-Am-MS 500, US-Am-MS 600, US-Am-MS 700 and US-Am-MS 800, respectively. This indicates the stability of the aminated samples.
XRD Analysis
The X-ray diffraction plots of raw and aminated samples are shown in Figures 8A,B. The presence of cellulose or other similar organic compounds is highlighted by the increase of the background level and by a large hump between 11 and 13° (Fancello et al., 2019). The sharp peak at the 2θ values around 23° associated with the crystalline cellulose for amorphous regions (Figure 8A) (Jiang et al., 2007; Osman et al., 2018). Notably, higher pyrolysis temperatures gave rise to the peak at 23° consistent to the literature (Kim et al., 2012). A narrow peak at around 30° was found and identified as amorphous carbon (Fu et al., 2016; Zhao et al., 2019). A new peak at 43° appeared for samples pyrolyzed at 600 and 700°C that indicated the development of atomic order in the increasingly carbonized material (Keiluweit et al., 2010). This peak comes from the formation and successive ordering of aromatic carbon (Paris et al., 2005) indicating crystallization (Tushar et al., 2012). The formation of aromatic structures began after the complete decomposition of the wood nanocomposite structure during the charring process (Paris et al., 2005).
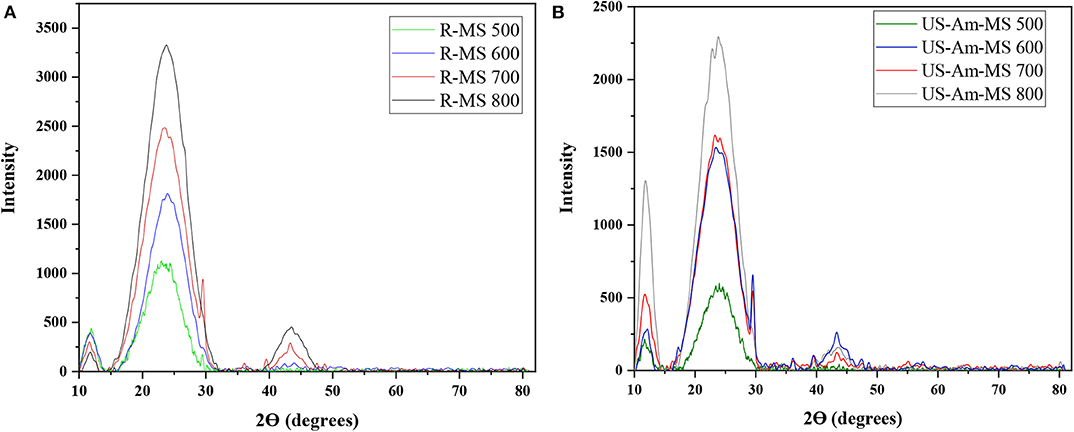
Figure 8. XRD plots of (A) raw and (B) activated miscanthus samples synthesized at 500, 600, 700, and 800°C.
Interestingly, the peak at 11–13° for aminated samples (Figure 8B) showed relative intensity higher than the raw char. This is due to largely exposed facets of the crystal lattice that show a few peaks with high relative intensity (Zhang et al., 2020). However, the peaks around 23°, 30°, and 43° showed reduction in intensity indicates the loss of crystallinity due to TEPA treatment.
CO2 Adsorption Study
Effect of Pyrolysis Temperature on Adsorption Capacities of Raw Chars
Adsorption capacities of raw and sono-aminated biochars synthesized under different temperature conditions are presented in Figure 9. As observed, raw MS shows maximum adsorption capacities in comparison to all other raw chars (MS>SG>CS>SB) under all temperature ranges, although the differences are small. All raw biochars exhibited a gradual increase in adsorption capacity in the range of 67–88% while increasing the temperature from 500 to 600°C. Although %N content decreased with temperature, the carbon content increased significantly, thus facilitating the increase in adsorption capacities. This is consistent with Raman and textural analysis that showed substantial increment in intensity ratio and surface area values, respectively, upon increasing the temperature from 500 to 600°C. All the raw samples demonstrated a slight increase (4–13%) in CO2 capture capacity at 700°C compared with 600°C, which can be substantiated as per the elemental analysis data (C and N contents) (Table 3). However, further increasing the pyrolysis temperature to 800°C reduced the adsorption capacity values by 70–76% compared to 700°C. This could be due to the reduction in surface area at elevated temperature (800°C) caused by the destruction of surface porosity, in addition to the reduction in %N contents at 800°C (Tables 2, 3).
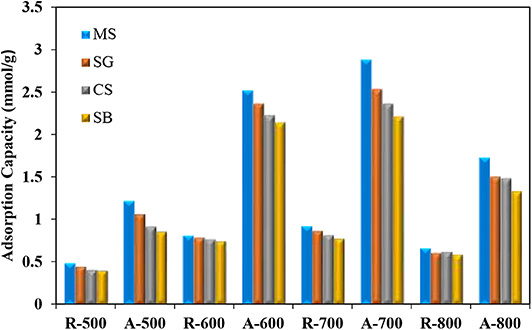
Figure 9. CO2 adsorption capacities of both raw and sono-chemically activated biochar samples synthesized at different pyrolysis temperatures. MS, Miscatanthus; SG, Switchgrass; CS, Corn stover; SB, Sugarcane bagasse; R, Raw; A, Ultrasound Amine Activated.
Effect of Pyrolysis Temperature on Adsorption Capacities of Ultrasound Amine Activated Chars
Although the pyrolysis temperature showed a slight effect on adsorption capacity of the raw biochars, it demonstrated a significant interaction with the acoustic-based amination process and the subsequent adsorption capacity of activated biochars. Based on Figure 9, adsorption capacities for activated chars can be categorized as: 0.86–1.23, 2.15–2.53, 2.22–2.89, and 1.34–1.74 mmol/g for the temperature ranges of 500, 600, 700, and 800°C, respectively. These values are 215–251, 287–309, 285–310, and 227–259% higher compared to those of the raw biochar at the temperatures of 500, 600, 700, and 800°C, respectively. Similar to raw biochars, sono-chemically functionalized samples exhibited an increasing trend of adsorption capacities with temperature up to 700°C, followed by a reduction at 800°C; optimum adsorption capacities were obtained for temperatures 600–700°C, which is in accordance to the Table 3 that showed notable differences (>3% change) in %C contents of MS, SG and SB at 600°C temperature.
As observed from Figure 9, the sono-aminated chars have much higher adsorption capacities (almost 3 times) those of raw chars. The effect of ultrasound activation can be observed from the surface morphology analysis (Figures 1–4) where the activated char particles exhibited generation/opening of pores that resulted in increases of their surface area and porosity leading them to achieve higher amine loading. Among different sono-aminated samples, herbaceous biochars (MS and SG) showed greater adsorption capacity than agro-based chars (CS and SB). The results suggest that both surface area and functional groups play key roles in CO2 capture. For example, on one hand, aminated MS contained the least N content compared to the other biochars, but on the other hand, MS structure involved the maximum porosity and surface area. Yet, the aminated MS, particularly at 600 and 700°C, represented the maximum CO2 adsorption. This trend is also corroborated based on Raman analysis. Increasing temperature showed increasing trend of intensity ratios and more defects in forms of functionality which is also observed in IR spectra of aminated samples for A-MS-500, A-MS-600, and A-MS-700. SG also exhibit similar behavior where %C content showed gradual increment and %N content showed gradual reducing trend with temperature but C-N peak from IR showed improved intensity for aminated samples at 600 and 700°C than raw SG under same temperatures. Generally, the minimum CO2 capture was observed in agro-industrial category, particularly SB biochar. Aminated SB had the lowest carbon and highest ash contents that resulted in low adsorption capacity. As observed, the ash content even increased with temperature. Accordingly, like other aminated biochars, A-SB-700 and A-SB-600 demonstrated a much greater adsorption compared with A-SB-500 and A-SB-800.
In general the biochars synthesized at 600–700°C and sono-chemically modified showed improved adsorption capacities than 500 and 800°C. This trend is further verified from the following physicochemical characterizations data. For instance, elemental analysis results (Table 3) expressed intense %N contents for aminated biochars at 600°C. In addition to that the strong C-N peak for the TEPA activated samples (as observed from FTIR plots, Figures 5A–D) for the temperature range of 600–700°C also matches the adsorption capacity results. The intensity ratio values as observed from Table S1 exhibited the highest increment for 600–700°C corresponding to their maximum adsorption capacity.
The adsorption capacities for the sorbent materials can be explained using the adsorption isotherm plots as shown in Figures S2, S3. The plots correspond to the volume of adsorbed gas with respect to the relative pressure, indicating adsorption ability of the chars. The more the adsorbed volume, the higher will be the adsorption capacity. Comparing the figures, it can be observed that miscanthus samples (Figure S2A) showed the highest value for the adsorbed volume corresponding to their highest adsorption capacity than any other biochar samples. The figures also indicated that the volume adsorbed is higher for biochar samples synthesized at high temperature. For instance, as per the Figure S2A, the adsorbed volume increases for both raw and ultrasound aminated samples as temperature is increased from 500 to 700°C and then reduces for 800°C. The maximum adsorbed volume was observed for samples synthesized at 700°C, followed by 800, 600, and 500°C. A similar trend can be observed for other raw and aminated biochars samples too. This further suggests that biochars prepared at temperature 600–700°C are more active toward CO2 adsorption compared to biochars pyrolyzed at very low (500°C) or very high (800°C) temperature.
Additionally, the effectiveness of the developed activation technique has been assessed based on the comparison of the adsorption capacities of the sorbent materials from the present study with the literature data and presented in Table S3. It can be concluded from the table that the ultrasono-amine functionalized adsorbents which were prepared from miscanthus, switchgrass, cornstover and sugarcane bagasse under 700°C have comparatively higher adsorption capacities (2.22–2.89 mmol/g) than most of the reported data. Another thing needs to be pointed that the pyrolysis temperature for the reported values are ranged between 500 and 800°C which also in accordance with the present study. However, the adsorption capacity for sawdust biochar pyrolyzed at 500°C and activated under N2 environment exhibited higher value than the adsorption capacity data obtained in the present study (Bamdad et al., 2018). The use of pure CO2 environment for adsorption experiment with N2 activated- sawdust biochar resulted to show increased adsorption capacity than any other reported data.
Conclusions
The present study investigated the importance of pyrolysis temperature on biochar properties, acoustic-based amination of biochar, and CO2 adsorption. Herbaceous (MS and SG) and agro-industrial based biochars (CS and SB) were used for synthesizing biochars at four different pyrolysis temperatures that ranged from 500 to 800°C. The biochars underwent two-step sonochemical activation: low-frequency low-temperature ultrasound activation followed by TEPA functionalization. The effectiveness of the prepared sorbents was assessed based on characterizations and CO2 adsorption results. The increasing of pyrolysis temperature resulted in high %C and %ash contents with a reduction of %H, %O and %N contents for most of the samples with most prominent changes observed in the temperature range of 500–700°C. Additionally, surface area and pore volumes were also enhanced at elevated temperatures up to 700°C. All of these factors played a cumulative role in increasing adsorption capacity. Pyrolysis temperature had a lesser impact on enhancing CO2 capture capacity of raw chars. Notable changes were observed in the structural and chemical properties of activated chars with pyrolysis temperature. The maximum adsorption capacities and the highest level of adsorption increment upon acoustic-based amination were both observed at 600–700°C, which were 2.8–3.1 times greater than the adsorption capacity of the corresponding raw biochars. These intermediate temperatures are clearly the pyrolysis temperatures of choice for maximizing adsorption capacity. The highest CO2 capture was achieved for R-MS-700 among the raw chars, and A-MS-700 among the activated chars, with adsorption capacities of 0.93 and 2.89 mmol/g, respectively, at 70°C and 0.10 atm CO2 partial pressure. It must also be highlighted that the activating treatments of the biochars were conducted near room temperature, making the sonication and amination activation processes notably energy efficient, compared to thermal activation.
Data Availability Statement
All datasets generated for this study are included in the article/Supplementary Material.
Author Contributions
RC: conducting the experiments, interpretation of results, and writing the manuscript. BS: idea of the work, interpretation of results, and writing the manuscript. W-YC: idea of the work and revising the manuscript. DM: interpretation of results and revising the manuscript. NH and AD: conducting Raman analysis. VR: conducting SEM analysis.
Funding
National Science Foundation (NSF EPSCoR RII Grant No. OIA-1632899 and MRI Grant No. CHE-1532079).
Conflict of Interest
The authors declare that the research was conducted in the absence of any commercial or financial relationships that could be construed as a potential conflict of interest.
Acknowledgments
Various other support from the University of Mississippi is also gratefully acknowledged. Scanning electron microscopy analyses presented in this work were conducted at the Microscopy and Imaging Center (SEM Core) of the University of Mississippi. This facility was supported in part by grant 1726880, National Science Foundation. The authors are also thankful to Professor Sanjay Mishra of the University of Memphis and Mr. Rami Al-Sughayer of The University of Mississippi for their help to conduct XRD and TGA analyses, respectively.
Supplementary Material
The Supplementary Material for this article can be found online at: https://www.frontiersin.org/articles/10.3389/fenrg.2020.00085/full#supplementary-material
References
Ahmad, M., Lee, S. S., Dou, X., Mohan, D., Sung, J.-K., Yang, J. E., et al. (2012). Effects of pyrolysis temperature on soybean stover-and peanut shell-derived biochar properties and TCE adsorption in water. Bioresour. Technol. 118, 536–544. doi: 10.1016/j.biortech.2012.05.042
Al-Wabel, M. I., Al-Omran, A., El-Naggar, A. H., Nadeem, M., and Usman, A. R. (2013). Pyrolysis temperature induced changes in characteristics and chemical composition of biochar produced from conocarpus wastes. Bioresour. Technol. 131, 374–379. doi: 10.1016/j.biortech.2012.12.165
Amini, E., Safdari, M.-S., Deyoung, J. T., Weise, D. R., and Fletcher, T. H. (2019). Characterization of pyrolysis products from slow pyrolysis of live and dead vegetation native to the southern United States. Fuel 235, 1475–1491. doi: 10.1016/j.fuel.2018.08.112
Antonakou, E., Lappas, A., Nilsen, M. H., Bouzga, A., and Stöcker, M. (2006). Evaluation of various types of Al-MCM-41 materials as catalysts in biomass pyrolysis for the production of bio-fuels and chemicals. Fuel 85, 2202–2212. doi: 10.1016/j.fuel.2006.03.021
Ashworth, A. J., Sadaka, S. S., Allen, F. L., Sharara, M. A., and Keyser, P. D. (2014). Influence of pyrolysis temperature and production conditions on switchgrass biochar for use as a soil amendment. BioResources 9, 7622–7635. doi: 10.15376/biores.9.4.7622–7635
Bamdad, H., Hawboldt, K., and Macquarrie, S. (2018). Nitrogen functionalized biochar as a renewable adsorbent for efficient CO2 removal. Energy Fuels 32, 11742–11748. doi: 10.1021/acs.energyfuels.8b03056
Brassard, P., Godbout, S., Raghavan, V., Palacios, J., Grenier, M., and Zegan, D. (2017). The production of engineered biochars in a vertical auger pyrolysis reactor for carbon sequestration. Energies 10:288. doi: 10.3390/en10030288
Brewer, C., and Brown, R. E. (2012). Biochar characterization and engineering theses and dissertations. Ames, IA: Iowa State University Capstones.
Brewer, C. E. (2012). Biochar Characterization and Engineering Ames, IA. doi: 10.1016/B978–0-08–087872-0.00524–2
Brunauer, S., Deming, L. S., Deming, W. E., and Teller, E. (1940). On a theory of the van der waals adsorption of gases. J. Am. Chem. Soc. 62, 1723–1732. doi: 10.1021/ja01864a025
Budai, A., Wang, L., Gronli, M., Strand, L. T., Antal, M. J., Abiven, S., et al. (2014). Surface properties and chemical composition of corncob and miscanthus biochars: effects of production temperature and method. J. Agric. Food Chem. 62, 3791–3799. doi: 10.1021/jf501139f
Cetin, E., Gupta, R., and Moghtaderi, B. (2005). Effect of pyrolysis pressure and heating rate on radiata pine char structure and apparent gasification reactivity. Fuel 84, 1328–1334. doi: 10.1016/j.fuel.2004.07.016
Chatterjee, R., Sajjadi, B., Chen, W.-Y., Mattern, D. L., Egiebor, N. O., Hammer, N., et al. (2019). Low frequency ultrasound enhanced dual amination of biochar: a nitrogen-enriched sorbent for CO2 capture. Energy Fuels 33, 2366–2380. doi: 10.1021/acs.energyfuels.8b03583
Chatterjee, R., Sajjadi, B., Mattern, D. L., Chen, W.-Y., Zubatiuk, T., Leszczynska, D., et al. (2018). Ultrasound cavitation intensified amine functionalization: a feasible strategy for enhancing CO2 capture capacity of biochar. Fuel 225, 287–298. doi: 10.1016/j.fuel.2018.03.145
Chen, W. Y., Mattern, D. L., Okinedo, E., Senter, J. C., Mattei, A. A., and Redwine, C. W. (2014). Photochemical and acoustic interactions of biochar with CO2 and H2O: applications in power generation and CO2 capture. AIChE J. 60, 1054–1065. doi: 10.1002/aic.14347
Chen, Y., Yang, H., Wang, X., Zhang, S., and Chen, H. (2012). Biomass-based pyrolytic polygeneration system on cotton stalk pyrolysis: influence of temperature. Bioresour. Technol. 107, 411–418. doi: 10.1016/j.biortech.2011.10.074
Coates, J. (2006). “Encyclopedia of analytical chemistry: applications, theory and instrumentation” in Interpretation of Infrared Spectra, a Practical Approach, ed R. A. Meyers (Newtown: John Wiley and Sons). doi: 10.1002/9780470027318.a5606
Dawson, R., Cooper, A. I., and Adams, D. J. (2013). Chemical functionalization strategies for carbon dioxide capture in microporous organic polymers. Polym. Int. 62, 345–352. doi: 10.1002/pi.4407
Dhyani, V., and Bhaskar, T. (2018). A comprehensive review on the pyrolysis of lignocellulosic biomass. Renew. Energy 129, 695–716. doi: 10.1016/j.renene.2017.04.035
Domingues, R. R., Trugilho, P. F., Silva, C. A., De Melo, I. C. N., Melo, L. C., Magriotis, Z. M., et al. (2017). Properties of biochar derived from wood and high-nutrient biomasses with the aim of agronomic and environmental benefits. PLoS ONE 12:e0176884. doi: 10.1371/journal.pone.0176884
Fancello, D., Scalco, J., Medas, D., Rodeghero, E., Martucci, A., Meneghini, C., et al. (2019). XRD-thermal combined analyses: an approach to evaluate the potential of phytoremediation, phytomining, and biochar production. Int. J. Environ. Res. Public Health 16:1976. doi: 10.3390/ijerph16111976
Fu, R., Liu, Y., Lou, Z., Wang, Z., Baig, S. A., and Xu, X. (2016). Adsorptive removal of Pb (II) by magnetic activated carbon incorporated with amino groups from aqueous solutions. J. Taiwan Inst. Chem. Eng. 62, 247–258. doi: 10.1016/j.jtice.2016.02.012
Gai, X., Wang, H., Liu, J., Zhai, L., Liu, S., Ren, T., et al. (2014). Effects of feedstock and pyrolysis temperature on biochar adsorption of ammonium and nitrate. PLoS ONE 9:e113888. doi: 10.1371/journal.pone.0113888
Gámiz, B., Hall, K., Spokas, K. A., and Cox, L. (2019). Understanding activation effects on low-temperature biochar for optimization of herbicide sorption. Agronomy 9, 588–603. doi: 10.3390/agronomy9100588
Guerrero, M., Ruiz, M., Alzueta, M., Bilbao, R., and Millera, A. (2005). Pyrolysis of eucalyptus at different heating rates: studies of char characterization and oxidative reactivity. J. Anal. Appl. Pyrolysis 74, 307–314. doi: 10.1016/j.jaap.2004.12.008
Guittonneau, F., Abdelouas, A., Grambow, B., and Huclier, S. (2010). The effect of high power ultrasound on an aqueous suspension of graphite. Ultrason. Sonochem. 17, 391–398. doi: 10.1016/j.ultsonch.2009.08.011
Hagemann, N., Spokas, K., Schmidt, H.-P., Kägi, R., Böhler, M., and Bucheli, T. (2018). Activated carbon, biochar and charcoal: linkages and synergies across pyrogenic carbon's ABCs. Water 10:182. doi: 10.3390/w10020182
Hamdaoui, O., Naffrechoux, E., Tifouti, L., and Pétrier, C. (2003). Effects of ultrasound on adsorption–desorption of p-chlorophenol on granular activated carbon. Ultrason. Sonochem. 10, 109–114. doi: 10.1016/S1350–4177(02)00137–2
Haszeldine, R. S. (2009). Carbon capture and storage: how green can black be? Science 325, 1647–1652. doi: 10.1126/science.1172246
Hossain, M. K., Strezov, V., Chan, K. Y., Ziolkowski, A., and Nelson, P. F. (2011). Influence of pyrolysis temperature on production and nutrient properties of wastewater sludge biochar. J. Environ. Manag. 92, 223–228. doi: 10.1016/j.jenvman.2010.09.008
Imam, T., and Capareda, S. (2012). Characterization of bio-oil, syn-gas and bio-char from switchgrass pyrolysis at various temperatures. J. Anal. Appl. Pyrolysis 93, 170–177. doi: 10.1016/j.jaap.2011.11.010
Inyang, M., Gao, B., Pullammanappallil, P., Ding, W., and Zimmerman, A. R. (2010). Biochar from anaerobically digested sugarcane bagasse. Bioresource Technology 101, 8868–8872. doi: 10.1016/j.biortech.2010.06.088
Jahirul, M. I., Rasul, M. G., Chowdhury, A. A., and Ashwath, N. (2012). Biofuels production through biomass pyrolysis—a technological review. Energies 5, 4952–5001. doi: 10.3390/en5124952
Jeong, C. Y., Dodla, S. K., and Wang, J. J. (2016). Fundamental and molecular composition characteristics of biochars produced from sugarcane and rice crop residues and by-products. Chemosphere 142, 4–13. doi: 10.1016/j.chemosphere.2015.05.084
Jiang, Z.-H., Yang, Z., So, C.-L., and Hse, C.-Y. (2007). Rapid prediction of wood crystallinity in Pinus elliotii plantation wood by near-infrared spectroscopy. J. Wood Sci. 53, 449–453. doi: 10.1007/s10086–007-0883-y
Keiluweit, M., Nico, P. S., Johnson, M. G., and Kleber, M. (2010). Dynamic molecular structure of plant biomass-derived black carbon (biochar). Environ. Sci. Technol. 44, 1247–1253. doi: 10.1021/es9031419
Kim, K. H., Kim, J.-Y., Cho, T.-S., and Choi, J. W. (2012). Influence of pyrolysis temperature on physicochemical properties of biochar obtained from the fast pyrolysis of pitch pine (Pinus rigida). Bioresour. Technol. 118, 158–162. doi: 10.1016/j.biortech.2012.04.094
Kim, P., Johnson, A. M., Essington, M. E., Radosevich, M., Kwon, W.-T., Lee, S.-H., et al. (2013). Effect of pH on surface characteristics of switchgrass-derived biochars produced by fast pyrolysis. Chemosphere 90, 2623–2630. doi: 10.1016/j.chemosphere.2012.11.021
Kim, W.-K., Shim, T., Kim, Y.-S., Hyun, S., Ryu, C., Park, Y.-K., et al. (2013). Characterization of cadmium removal from aqueous solution by biochar produced from a giant miscanthus at different pyrolytic temperatures. Bioresour. Technol. 138, 266–270. doi: 10.1016/j.biortech.2013.03.186
Kumar, U., Maroufi, S., Rajarao, R., Mayyas, M., Mansuri, I., Joshi, R. K., et al. (2017). Cleaner production of iron by using waste macadamia biomass as a carbon resource. J. Clean. Prod. 158, 218–224. doi: 10.1016/j.jclepro.2017.04.115
Lee, S., Filburn, T. P., Gray, M., Park, J.-W., and Song, H.-J. (2008). Screening test of solid amine sorbents for CO2 capture. Ind. Eng. Chem. Res. 47, 7419–7423. doi: 10.1021/ie8006984
Lee, Y., Park, J., Ryu, C., Gang, K. S., Yang, W., Park, Y.-K., et al. (2013). Comparison of biochar properties from biomass residues produced by slow pyrolysis at 500°C. Bioresour. Technol. 148, 196–201. doi: 10.1016/j.biortech.2013.08.135
Lewis, A. D., and Fletcher, T. H. (2013). Prediction of sawdust pyrolysis yields from a flat-flame burner using the CPD model. Energy Fuels 27, 942–953. doi: 10.1021/ef3018783
Li, H., Dong, X., Da Silva, E. B., De Oliveira, L. M., Chen, Y., and Ma, L. Q. (2017). Mechanisms of metal sorption by biochars: biochar characteristics and modifications. Chemosphere 178, 466–478. doi: 10.1016/j.chemosphere.2017.03.072
Li, M., Liu, Q., Guo, L., Zhang, Y., Lou, Z., Wang, Y., et al. (2013). Cu (II) removal from aqueous solution by spartina alterniflora derived biochar. Bioresour. Technol. 141, 83–88. doi: 10.1016/j.biortech.2012.12.096
Liang, C., Gascó, G., Fu, S., Méndez, A., and Paz-Ferreiro, J. (2016). Biochar from pruning residues as a soil amendment: effects of pyrolysis temperature and particle size. Soil Tillage Res. 164, 3–10. doi: 10.1016/j.still.2015.10.002
Liu, Y., He, Z., and Uchimiya, M. (2015). Comparison of biochar formation from various agricultural by-products using FTIR spectroscopy. Mod. Appl. Sci. 9, 246–253. doi: 10.5539/mas.v9n4p246
Major, I., Pin, J.-M., Behazin, E., Rodriguez-Uribe, A., Misra, M., and Mohanty, A. (2018). Graphitization of miscanthus grass biocarbon enhanced by in situ generated FeCo nanoparticles. Green Chem. 20, 2269–2278. doi: 10.1039/C7GC03457A
Mia, S., Dijkstra, F. A., and Singh, B. (2017). Aging induced changes in biochar's functionality and adsorption behavior for phosphate and ammonium. Environ. Sci. Technol. 51, 8359–8367. doi: 10.1021/acs.est.7b00647
Mimmo, T., Panzacchi, P., Baratieri, M., Davies, C., and Tonon, G. (2014). Effect of pyrolysis temperature on miscanthus (Miscanthus × giganteus) biochar physical, chemical and functional properties. Biomass Bioenergy 62, 149–157. doi: 10.1016/j.biombioe.2014.01.004
Nwajiaku, I. M., Olanrewaju, J. S., Sato, K., Tokunari, T., Kitano, S., and Masunaga, T. (2018). Change in nutrient composition of biochar from rice husk and sugarcane bagasse at varying pyrolytic temperatures. Int. J. Recycl. Org. Waste Agric. 7, 269–276. doi: 10.1007/s40093–018-0213-y
Onay, O. (2007). Influence of pyrolysis temperature and heating rate on the production of bio-oil and char from safflower seed by pyrolysis, using a well-swept fixed-bed reactor. Fuel Process. Technol. 88, 523–531. doi: 10.1016/j.fuproc.2007.01.001
Osman, A. I., Ahmed, A. T., Johnston, C. R., and Rooney, D. W. (2018). Physicochemical characterization of miscanthus and its application in heavy metals removal from wastewaters. Environ. Progr. Sust. Energy 37, 1058–1067. doi: 10.1002/ep.12783
Paris, O., Zollfrank, C., and Zickler, G. A. (2005). Decomposition and carbonisation of wood biopolymers—a microstructural study of softwood pyrolysis. Carbon 43, 53–66. doi: 10.1016/j.carbon.2004.08.034
Patwardhan, P. R., Dalluge, D. L., Shanks, B. H., and Brown, R. C. (2011). Distinguishing primary and secondary reactions of cellulose pyrolysis. Bioresour. Technol. 102, 5265–5269. doi: 10.1016/j.biortech.2011.02.018
Peterson, S. C., Appell, M., Jackson, M. A., and Boateng, A. A. (2013). Comparing corn stover and switchgrass biochar: characterization and sorption properties. J. Agric. Sci. 5, 1–8. doi: 10.5539/jas.v5n1p1
Pilon, G., and Lavoie, J.-M. (2013). Pyrolysis of switchgrass (Panicum virgatum L.) at low temperatures within N2 and CO2 environments: product yield study. ACS Sust. Chem. Eng. 1, 198–204. doi: 10.1021/sc300098e
Plaza, M., Pevida, C., Arias, B., Fermoso, J., Arenillas, A., Rubiera, F., et al. (2008). Application of thermogravimetric analysis to the evaluation of aminated solid sorbents for CO2 capture. J. Therm. Anal. Calorim. 92, 601–606. doi: 10.1007/s10973–007-8493-x
Popp, J., Lakner, Z., Harangi-Rakos, M., and Fari, M. (2014). The effect of bioenergy expansion: food, energy, and environment. Renew. Sust. Energy Rev. 32, 559–578. doi: 10.1016/j.rser.2014.01.056
Rafiq, M. K., Bachmann, R. T., Rafiq, M. T., Shang, Z., Joseph, S., and Long, R. (2016). Influence of pyrolysis temperature on physico-chemical properties of corn stover (Zea mays L.) biochar and feasibility for carbon capture and energy balance. PLoS ONE 11:e0156894. doi: 10.1371/journal.pone.0156894
Sadaka, S., Sharara, M., Ashworth, A., Keyser, P., Allen, F., and Wright, A. (2014). Characterization of biochar from switchgrass carbonization. Energies 7, 548–567. doi: 10.3390/en7020548
Sajjadi, B., Chen, W.-Y., Adeniyi, A., Mattern, D. L., Mobley, J., Huang, C.-P., et al. (2019a). Variables governing the initial stages of the synergisms of ultrasonic treatment of biochar in water with dissolved CO2. Fuel 235, 1131–1145. doi: 10.1016/j.fuel.2018.08.077
Sajjadi, B., Chen, W.-Y., and Egiebor Nosa, O. (2018). A comprehensive review on physical activation of biochar for energy and environmental applications. Rev. Chem. Eng. 36, 1–42.
Sajjadi, B., Zubatiuk, T., Leszczynska, D., Leszczynski, J., and Chen, W. Y. (2019b). Chemical activation of biochar for energy and environmental applications: a comprehensive review. Rev. Chem. Eng. 35, 777–815. doi: 10.1515/revce-2018–0003
Santos, L. B., Striebeck, M. V., Crespi, M. S., Ribeiro, C. A., and De Julio, M. (2015). Characterization of biochar of pine pellet. J. Therm. Anal. Calorim. 122, 21–32. doi: 10.1007/s10973–015-4740–8
Stankovich, S., Dikin, D. A., Dommett, G. H. B., Kohlhaas, K. M., Zimney, E. J., Stach, E. A., et al. (2006). Graphene-based composite materials. Nature 442, 282–286. doi: 10.1038/nature04969
Suliman, W., Harsh, J. B., Abu-Lail, N. I., Fortuna, A.-M., Dallmeyer, I., and Garcia-Perez, M. (2016). Influence of feedstock source and pyrolysis temperature on biochar bulk and surface properties. Biomass Bioenergy 84, 37–48. doi: 10.1016/j.biombioe.2015.11.010
Sun, Y., Gao, B., Yao, Y., Fang, J., Zhang, M., Zhou, Y., et al. (2014). Effects of feedstock type, production method, and pyrolysis temperature on biochar and hydrochar properties. Chem. Eng. J. 240, 574–578. doi: 10.1016/j.cej.2013.10.081
Tag, A. T., Duman, G., Ucar, S., and Yanik, J. (2016). Effects of feedstock type and pyrolysis temperature on potential applications of biochar. J. Anal. Appl. Pyrolysis 120, 200–206. doi: 10.1016/j.jaap.2016.05.006
Tushar, M. S. H. K., Mahinpey, N., Khan, A., Ibrahim, H., Kumar, P., and Idem, R. (2012). Production, characterization and reactivity studies of chars produced by the isothermal pyrolysis of flax straw. Biomass Bioenergy 37, 97–105. doi: 10.1016/j.biombioe.2011.12.027
Ünveren, E. E., Monkul, B. Ö., Sarioglan, S., Karademir, N., and Alper, E. (2017). Solid amine sorbents for CO2 capture by chemical adsorption: a review. Petroleum 3, 37–50. doi: 10.1016/j.petlm.2016.11.001
Verma, Y. L., Singh, M. P., and Singh, R. K. (2012). Effect of ultrasonic irradiation on preparation and properties of ionogels. J. Nanomater. 2012:6. doi: 10.1155/2012/570719
Vizzini, G., Bardi, A., Biagini, E., Falcitelli, M., and Tognotti, L. (2008). Prediction of Rapid Biomass Devolatilization Yields With an Upgraded Version of the Bio-CPD Model. Pissa: Combustion Institute Italian section.
Vyas, A., Chellappa, T., and Goldfarb, J. L. (2017). Porosity development and reactivity changes of coal–biomass blends during co-pyrolysis at various temperatures. J. Anal. Appl. Pyrolysis 124, 79–88. doi: 10.1016/j.jaap.2017.02.018
Wang, S., Gao, B., Zimmerman, A. R., Li, Y., Ma, L., Harris, W. G., et al. (2015). Physicochemical and sorptive properties of biochars derived from woody and herbaceous biomass. Chemosphere 134, 257–262. doi: 10.1016/j.chemosphere.2015.04.062
Wang, X., Zhou, W., Liang, G., Song, D., and Zhang, X. (2015). Characteristics of maize biochar with different pyrolysis temperatures and its effects on organic carbon, nitrogen and enzymatic activities after addition to fluvo-aquic soil. Sci. Total Environ. 538, 137–144. doi: 10.1016/j.scitotenv.2015.08.026
Yuan, H., Lu, T., Wang, Y., Huang, H., and Chen, Y. (2014). Influence of pyrolysis temperature and holding time on properties of biochar derived from medicinal herb (radix isatidis) residue and its effect on soil CO2 emission. J. Anal. Appl. Pyrolysis 110, 277–284. doi: 10.1016/j.jaap.2014.09.016
Zambon, I., Colosimo, F., Monarca, D., Cecchini, M., Gallucci, F., Proto, A., et al. (2016). An innovative agro-forestry supply chain for residual biomass: physicochemical characterisation of biochar from olive and hazelnut pellets. Energies 9:526. doi: 10.3390/en9070526
Zanzi, R., Sjöström, K., and Björnbom, E. (2002). Rapid pyrolysis of agricultural residues at high temperature. Biomass Bioenergy 23, 357–366. doi: 10.1016/S0961–9534(02)00061–2
Zhang, H., Chen, C., Gray, E. M., and Boyd, S. E. (2017). Effect of feedstock and pyrolysis temperature on properties of biochar governing end use efficacy. Biomass Bioenergy 105, 136–146. doi: 10.1016/j.biombioe.2017.06.024
Zhang, J., Liu, J., and Liu, R. (2015). Effects of pyrolysis temperature and heating time on biochar obtained from the pyrolysis of straw and lignosulfonate. Bioresour. Technol. 176, 288–291. doi: 10.1016/j.biortech.2014.11.011
Zhang, J., Lü, F., Luo, C., Shao, L., and He, P. (2014). Humification characterization of biochar and its potential as a composting amendment. J. Environ. Sci. 26, 390–397. doi: 10.1016/S1001-0742(13)60421-0
Zhang, L., Gonçalves, A. A., and Jaroniec, M. (2020). Identification of preferentially exposed crystal facets by X-ray diffraction. RSC Adv. 10, 5585–5589. doi: 10.1039/D0RA00769B
Zhao, S.-X., Ta, N., and Wang, X.-D. (2017). Effect of temperature on the structural and physicochemical properties of biochar with apple tree branches as feedstock material. Energies 10:1293. doi: 10.3390/en10091293
Zhao, Y., Zhang, R., Liu, H., Li, M., Chen, T., Chen, D., et al. (2019). Green preparation of magnetic biochar for the effective accumulation of Pb(II): performance and mechanism. Chem. Eng. J. 375:122011. doi: 10.1016/j.cej.2019.122011
Keywords: various pyrolysis temperature, biochar, ultrasound, tetraethylenepentamine, CO2 adsorption
Citation: Chatterjee R, Sajjadi B, Chen W-Y, Mattern DL, Hammer N, Raman V and Dorris A (2020) Effect of Pyrolysis Temperature on PhysicoChemical Properties and Acoustic-Based Amination of Biochar for Efficient CO2 Adsorption. Front. Energy Res. 8:85. doi: 10.3389/fenrg.2020.00085
Received: 29 January 2020; Accepted: 24 April 2020;
Published: 28 May 2020.
Edited by:
Hu Li, Guizhou University, ChinaCopyright © 2020 Chatterjee, Sajjadi, Chen, Mattern, Hammer, Raman and Dorris. This is an open-access article distributed under the terms of the Creative Commons Attribution License (CC BY). The use, distribution or reproduction in other forums is permitted, provided the original author(s) and the copyright owner(s) are credited and that the original publication in this journal is cited, in accordance with accepted academic practice. No use, distribution or reproduction is permitted which does not comply with these terms.
*Correspondence: Baharak Sajjadi, bsajjadi@olemiss.edu