Forecast of total rural energy demand based on energy consumption intensity
 Wu Guilian
 Zhang Linyao1
  Liu Conghao
- 1State Grid Fujian Economic Research Institute, Fuzhou, Fujian, China
- 2Tianjin Tianda Qiushi Electric Power High Technology Co., Ltd., Tianjin, China
It is necessary to build a simulation calculation model that is more in line with the actual rural energy endowment and development needs. Prediction and analysis of the total rural energy demand in the context of energy transition. The rural energy demand is affected by many factors, and the traditional single model contains very limited amount of information, which easily leads to a large deviation between the prediction results and the actual situation, thereby reducing the prediction accuracy. In view of this, in view of the complex and difficult to predict the influencing factors of rural energy demand under the new economic normal, based on the back propagation neural network-particle swarm-genetic hybrid optimization algorithm, a total rural energy demand forecast based on energy consumption intensity was constructed method. Firstly, select the key influencing factors of the total rural energy demand forecast and conduct path analysis to compare the explanation strength of the influencing factors on energy demand; secondly, construct the energy consumption demand regression model, and calculate the parameters based on the back propagation neural network-particle swarm-genetic hybrid optimization algorithm. Estimation results; finally, the scenario is given, and the regional rural energy demand forecast results are obtained by using the regression model. Empirical analysis shows that four aspects of GDP, industrial structure, energy utilization efficiency, and rural energy consumption are strongly correlated with the total rural energy demand. At the same time, the prediction error of this study can reach about 1.35%, which can predict future rural energy demand. The total amount to guide the construction of the rural energy system.
1 Introduction
With the aggravation of environmental pollution and energy depletion, building a clean energy supply system has become a world trend (Xu et al., 2022), and rural areas will become the main battlefield for clean energy development with the advantages of abundant clean energy and sufficient space for clean energy development (Usman and Radulescu, 2022). Under the rural revitalization, the development and system construction of clean energy in China’s rural areas is of great significance to my country’s sustainable development and the realization of environmental protection goals (Shi et al., 2021). It can effectively improve the rural energy consumption structure (Shao et al., 2022) and improve the backward production and living conditions., to promote energy conservation and emission reduction and social harmony (Li et al., 2021a).
For energy demand forecasting, traditional methods are mainly to build equations or models to fit the coupling relationship between economic development and energy consumption, so as to analyze the impact of economic development on energy demand (Li et al., 2021b), for example: through cointegration theory and Kuznets The curve is organically combined to analyze the complex relationship between energy consumption and economic development (Fan and Hao, 2020); the coupling relationship between energy consumption and economic growth is studied through co-integration analysis, and a VAR error correction model is constructed to improve the analysis accuracy (Wang et al., 2021); Correlation analysis model to determine the stable relationship between energy consumption and economic growth and has the characteristics of persistence (Ma and Li, 2020). Most of these studies focus on analyzing the causal relationship between economic growth and energy consumption to achieve energy demand forecasting. However, it is difficult to achieve high forecasting accuracy by only considering economic factors.
Energy demand forecasting is a complex nonlinear system. With the help of more accurate software analysis and the emergence of artificial intelligence models, emerging forecasting methods have gradually replaced traditional forecasting models. Benjamin F. Hobbs (Hobbs et al., 1998), Coskun Hamazaceb (2007) used the neural network model to predict the daily demand of domestic electricity, natural gas and other energy sources and the total energy consumption of Turkey, compared with traditional statistical analysis methods and models. On the basis of analyzing the influencing factors of energy consumption, Wang Jue and Bao Qin established a wavelet neural network model to predict China’s energy consumption demand nonlinearly with high accuracy (Jnr et al., 2021). However, the above studies did not consider the correlation between the influencing factors in the selection of influencing factors, and under the complex influencing factors and trends, the total rural energy demand forecast is difficult to apply in practice.
Aiming at the problem that the influencing factors of rural energy demand are complex and difficult to predict under the new economic normal, this paper proposes a total rural energy demand forecast method based on energy consumption intensity. Firstly, select the key influencing factors of the total rural energy demand forecast and conduct path analysis to compare the explanatory power of the influencing factors to energy demand. BP neural network-particle swarm-genetic hybrid optimization algorithm is used to calculate the parameter estimation results; finally, the future trends of the four aspects of GDP, industrial structure, energy utilization efficiency, and rural energy consumption proportion are given scenarios, and the regression model is used. Calculate the regional rural energy demand forecast results. This paper standardizes the calculation process, strengthens the key influencing factors, can more accurately predict the total energy demand in rural areas, and provides support for the construction of rural energy system.
2 Research ideas on forecasting method of total energy demand in rural areas
Figure 1 shows the research thinking of the total rural energy demand forecast method based on energy consumption intensity.

FIGURE 1. Research thinking on forecasting method of total energy demand in rural areas.
3 Prediction method of total rural energy demand
3.1 Classification method of rural differentiated energy scenarios
The influencing factors of energy demand include location and transportation, economic development, and industrial structure. Energy production includes natural resource endowment. An evaluation standard system is constructed to classify rural areas.
3.1.1 Location traffic as a classification criterion
Under the rural development goals, locational transportation represents the connection between the geographical location of the village itself and the city, which greatly affects the driving effect of regional development, which in turn affects the regional energy demand and growth rate. When the village is closer to the city and the transportation is more convenient, it will be more affected by urban radiation, which will affect its economic development and energy demand. The city’s GDP and population size determine the strength of a city’s influence, that is, the classification criteria for location traffic are traffic and urban radiation influence, and the judgment is based on the GDP, population, and the distance between the evaluation area center and the city.
3.1.2 Economic development as a taxonomy
The economy is the main internal driving force of rural development and is directly related to energy consumption demand. The county per capita GDP and per capita GDP growth rate reflect the development status and driving force of the rural economy. It is easier to obtain data than the income of different industries. It reflects whether there is an industry in the rural area, which can be developed into an industrial rural area. That is, the classification standard of economic development is village per capita GDP and per capita GDP growth rate.
3.1.3 Industrial structure as a classification criterion
There is a big difference in the energy consumption intensity of different industries. In the energy consumption intensity, the secondary industry > the tertiary industry > the primary industry. Therefore, the regional energy structure is also an important factor affecting energy demand. The secondary industry accounts for a high proportion and the energy demand is stronger. Therefore, the proportion of GDP of the primary industry, the proportion of GDP of the secondary industry, and the proportion of GDP of the tertiary industry are used as the influencing factors of rural energy demand forecast.
3.1.4 Resource endowment as a taxonomy
Resource endowment is an influencing factor that directly affects the construction of the energy system. As the new power system is dominated by the development of new energy sources such as wind power and photovoltaics, this study focuses on solar energy, wind energy, biomass energy, and water energy, geothermal and other energy sources are classified as other.
As shown in Figure 2, energy demand constructs influencing factor indicators from three aspects: location transportation, economic development, and industrial structure, and energy production constructs influencing factor indicators from resource endowment to form secondary classification influencing factors.
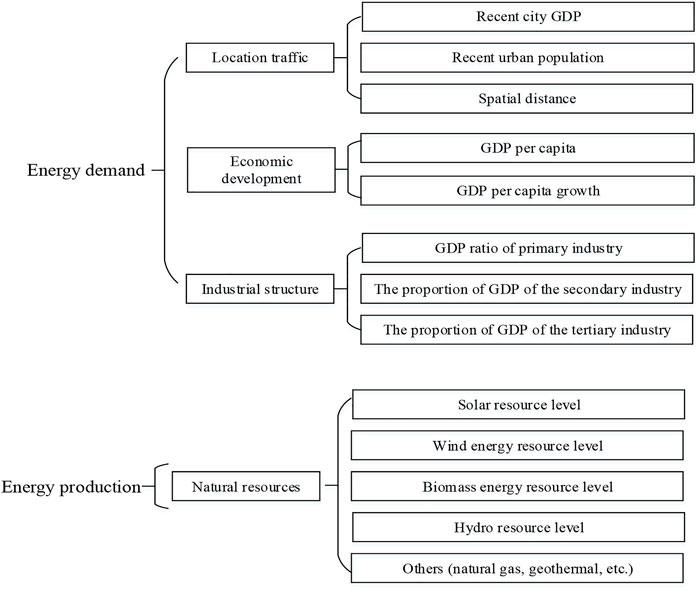
FIGURE 2. Classification index system of rural differentiated energy scenarios.
3.2 Introduction to path analysis methods
Path Analysis (Lu et al., 2019) is used to analyze the linear relationship between multiple independent variables and dependent variables. It can deal with more complex variable relationships and is mainly used to study the direct and indirect importance of independent variables to dependent variables. If
Among them,
3.3 BP neural network algorithm based on particle swarm optimization and genetic algorithm
In order to further improve the accuracy of the rural energy demand prediction model and avoid the disadvantage of the slow convergence speed of the Genetic Algorithm (GA) (Jiang et al., 2020), based on the BP-GA (Huang et al., 2022) model, a Particle Swarm optimization (PSO) with a fast convergence speed is introduced (Peng and Xiang, 2020), composed a back propagation neural network-particle swarm-genetic (BP-PSO-GA) hybrid algorithm, which can overcome the limitations of a single algorithm and achieve complementary advantages. The BP-PSO-GA algorithm has a better ability to search for the optimal solution globally, and has great advantages in fitness, convergence speed and prediction accuracy, thereby improving the overall performance of the algorithm.
PSO is a global random search algorithm that searches for the optimal solution through a group of particles that continuously adjust their position Xi and velocity Vi in space (Zhang et al., 2018). In this process, each particle can find an optimal solution, this solution is called the individual extreme value, which is represented by Pbest. Share Pbest with other particles, and take the best Pbest in the entire particle swarm as the global optimal solution, which is called the global extremum, and is represented by Gbest. The individual particles in the particle swarm then adjust Xi and Vi according to Pbest and Gbestto obtain the global optimal solution (Li et al., 2018). Where the adjustment formulas of Xi and Vi are:
Where Xi represents the rural energy demand, w represents the inertia weight factor, c1 and c2 represent the learning factor, taking the value [0, 2], r1 and r2 represent the random number, taking the value [0, 1].
The whole process of the PSO algorithm is: particle swarm initialization, particle fitness calculation, finding Pbest, finding Gbest, updating Xi and Vi of particles, and outputting the final global optimal solution.
The established BP-PSO-GA network flow steps are as follows:
1) First determine the BP network structure. In order to compare the prediction results with BP and GA-BP neural network models, the BP network structure selection of this prediction model is consistent with them, and is determined as 6-6-1 structure. That is, the 6 parameters of loudness, AI index, fluctuation, roughness, sharpness, and A sound pressure level are used as 6 nodes in the input layer, 6 nodes are selected in the hidden layer, and 1 node in the output layer is the sound quality prediction result as shown in the Figure 3.
2) Initialize the network and initialize the particle swarm, and determine the value of each parameter: the chromosome length is 49, the population size is 40, the maximum evolutionary generation is 200, the crossover probability is 0.8, the mutation probability is 0.07, the maximum inertia weight factor is 0.9, the minimum inertia weight The value factor is 0.4, the learning factor is 2.
3) By calculating the fitness function, search Pbest and Gbest, and update the Xi and Vi of the particle swarm according to the rules.
4) Carry out the crossover operation of the particle swarm.
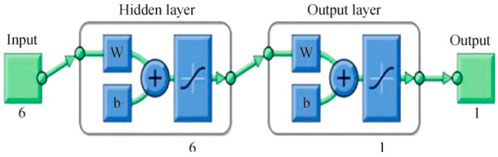
FIGURE 3. Schematic diagram of the structure of the BP neural network prediction model.
Select the particle with better fitness value, according to the set probability, use the position crossover operator and speed crossover operator of Eqs 5, 6 to compare the speed and position of the ith particle and the speed and position of the jth particle. Crossover is performed, and the particles with better fitness are put back into the particle swarm for the next step.
In the formula: α and β represent random numbers between [0, 1].
5) Carry out the mutation operation of the particle swarm.
Select the particle with poor fitness value according to the set probability, and perform mutation operation on the position and speed of the particle according to the position mutation and velocity mutation operators of Eqs 7, 8 respectively, and place the mutated particle again. Back to the particle swarm.
In the formula:
6) Update Pbest and Gbest.
7) Determine whether the PSO-GA iterative operation satisfies the end condition, and output the optimal weight and threshold, otherwise return to continue to initialize the population.
8) BP neural network weight threshold update.
9) Determine whether the BP neural network training has reached the end condition, if not, return to re-adjust the weight threshold and carry out training; if it is satisfied, the training ends. The BP-PSO-GA algorithm flow is shown in Figure 4.
FIGURE 4. BP-PSO-GA algorithm flow chart.
4 Establishment of rural energy demand forecasting model
The direct influencing factors of energy consumption demand include three aspects: GDP, industrial structure and energy utilization efficiency (Morikawa, 2012). Establish an energy demand forecast model:
Among them, α, β, γi, and δ are the influence coefficients, and ε is the residual error. The change in coal consumption for power generation (EFF) is used to represent the change in energy utilization efficiency; STRi is a variable to measure the change in industrial structure. Select the proportion of the secondary industry (
The particles in the BP-PSO-GA algorithm continue to find the optimal solution in the iterative process according to the size of the fitness value. In this paper, the reciprocal of the mean square error (MSE) is used as the fitness value function:
Where
5 Empirical analysis
5.1 Data selection
Based on historical data, judge the future trend of various influencing factors, and give the change scenarios of economic growth, industrial structure changes (the proportion of secondary industry, the proportion of tertiary industry, the proportion of heavy industry in industry), the improvement of energy utilization efficiency, and the proportion of rural energy consumption, and the relevant data value of the forecast year is obtained.
Based on the statistical yearbook data of a certain region, collect relevant data such as total energy demand, GDP, the proportion of secondary industry, the proportion of tertiary industry, and the proportion of heavy industry in industry from 1980 to 2020 in Table 1.
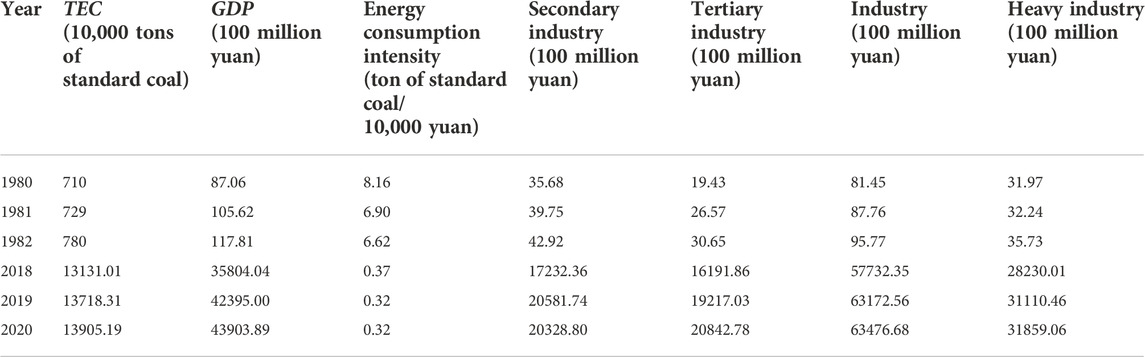
TABLE 1. Basic data of statistical yearbook.
Due to the different measurement units and large differences in the quantity level of each variable. In order to ensure the accuracy and stability of the prediction, the data are standardized. The formula is as follows:
Where x′ represents the processed data, and xmax and xmin represent the maximum and minimum values in the xi data, respectively.
5.2 Path analysis
Generally, path analysis is meaningful when there is a significant correlation and regression relationship between the explained variable and the explanatory variable. Therefore, taking TEC as the explained variable, GDP, energy consumption intensity (EFF), the proportion of the secondary industry (STR2), the proportion of the tertiary industry (STR3), the proportion of the secondary industry and the interaction term of the proportion of heavy industry in the industry (STR) as the explanatory variable for regression. The regression equation is as follows:
The linear regression results are shown in Table 2. The R2 is 0.9937, the F statistic is 6168.73, and the overall fit of the model is good. Therefore, it is meaningful to do the path analysis of GDP, EFF, STR2, STR3 and STR in TEC. According to Eqs 1, 2, the direct path coefficient of the error is:
TABLE 2. Linear regression results.
Through the formula, the direct path coefficient and indirect path coefficient of each variable and dependent variable can be calculated, as shown in Table 3. The path coefficient analysis shows that GDP, energy consumption intensity (EFF) and the proportion of the tertiary industry (STR3) have a greater impact on the total energy demand (TEC), and the correlation coefficients are 0.9345, 0.6545 and 0.5865, respectively. The proportion of the secondary industry (STR2) and the interaction term (STR) of the proportion of secondary industry and the proportion of heavy industry in the industry have relatively small effects on total energy demand (TEC), which are 0.1944 and 0.3765, respectively.
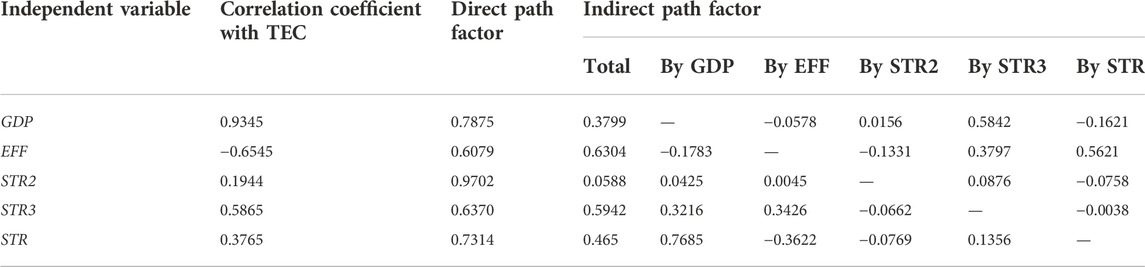
TABLE 3. Path analysis results.
5.3 Scenario given
Scenarios are given for the economic growth rate, industrial structure, energy utilization efficiency, and the proportion of rural energy, and the forecast results of the total rural energy consumption are calculated.
5.3.1 Economic growth rate
There are three scenarios for future economic growth:
1) The first scenario is the low growth scenario. The economic growth rates for the three periods of 2021–2025, 2026–2030, and 2031–2050 are set to be 5.0%, 4.0%, and 2.5%, respectively.
2) The second scenario is the baseline scenario. The economic growth rates for the three periods of 2021–2025, 2026–2030, and 2031–2050 are set to be 5.5%, 4.5%, and 3.0%, respectively.
3) The third scenario is the high-growth scenario. The economic growth rates for the three periods of 2021–2025, 2026–2030, and 2031–2050 are set to be 6.0%, 5.0%, and 3.5%, respectively.
5.3.2 Industrial structure
In general, China’s industrial process has entered the late stage. The continuous rise of the proportion of the tertiary industry and the continuous decline of the proportion of the primary and secondary industries are the characteristics of the industrial structure. It is assumed that the proportion of the tertiary industry will increase from 47.5% in 2020 to 54.7% in 2030, and then to 65.0% in 2050; the proportion of the secondary industry will decrease from 46.3% in 2020 to 37.6% in 2030, and then to 30.5% in 2050; the proportion of primary industry will drop from 6.2% in 2020 to 5.5% in 2030, and then to 4.5% in 2050; the proportion of the total output value of the regional heavy industry in the total industrial output value will remain at around 50% by 2030, and will gradually decrease to 45% by 2050.
5.3.3 Energy utilization efficiency
In the past, the space for energy resources and ecological environment was relatively large. Now the environmental bearing capacity has reached or approached the upper limit. The green and low-carbon cycle development of the economy has become a new requirement, and the cost of energy use will further increase. This has more incentives for the improvement of energy efficiency. In this paper, the coal consumption of power generation is used to represent the energy utilization efficiency, and the autoregressive value of this time series is used as a given scenario to represent the future trend of energy utilization efficiency improvement, as shown in Figure 5.
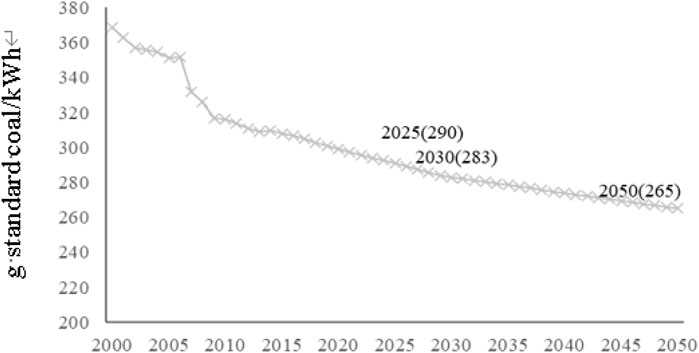
FIGURE 5. Energy efficiency given scenario.
5.3.4 Proportion of rural energy consumption
In 2020, regional rural energy consumption accounts for 50% of the total. With the accelerated development of rural urbanization and the gradual expansion of the tide of returning home from cities, the development of modern rural industries will change with each passing day. It is estimated that by 2025, the proportion of rural energy consumption will reach 53% of the province’s total energy consumption, 57% by 2030, and 65% by 2050, and the urban-rural equalization will reach a sustainable level.
5.4 Total rural energy consumption forecast
The algorithm was written and tested in MATLAB R2014a, and the standardized data of influencing factors and total energy consumption from 1980 to 2015 were used as model input. Combined with the previous research and trial and error results, the parameters of the model are set as: particle swarm size pop_size = 200, maximum number of iterations max_gen =500, max_k = 50, M = 50, learning factor C1 = C2 = 2.1, inertia weight
In the fitting stage, the mean absolute error (MAE) of the model is 1.3503%, which is ideal. In order to further test the effectiveness of the improved model, the data from 2016 to 2020 was used as the test sample for prediction and estimation, and the predicted values predicted by the PSO algorithm, the GA algorithm and the BP-PSO-GA algorithm were compared with the actual values, as shown in Table 4; Figure 6.

TABLE 4. Analysis of training sample prediction results.
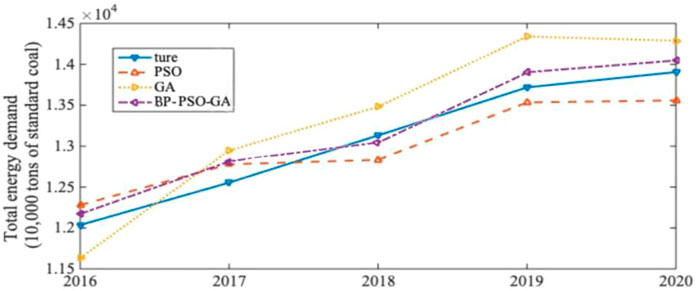
FIGURE 6. Comparison of training sample prediction results.
From the prediction results, it can be found that the average absolute error of prediction using the PSO algorithm is 1.98%, the average absolute error of using the GA algorithm is 3.29%, and the average absolute error of using the BP-PSO-GA algorithm is 1.35%. It can be seen that the improved BP-PSO-GA algorithm has higher prediction accuracy.
Based on the scenarios given in the previous section, the predicted results of regional rural energy demand are shown in Figures 7, 8.
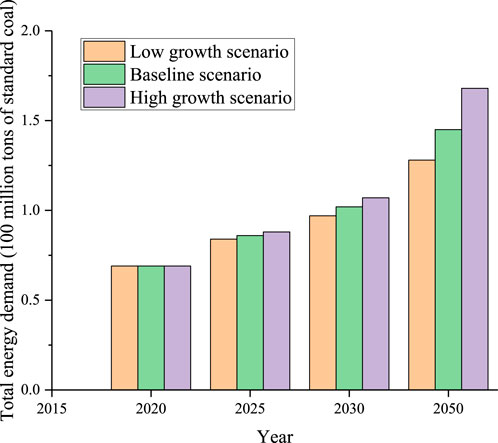
FIGURE 7. Prediction results of total regional rural energy demand.
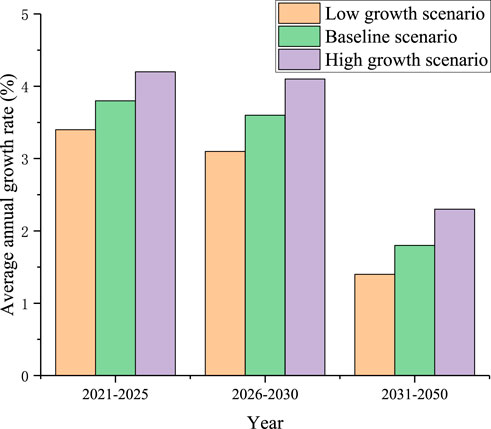
FIGURE 8. Forecast results of regional rural energy demand growth rate.
6 Conclusion
This paper proposes a forecasting method of total rural energy demand based on energy consumption intensity. First, select the key influencing factors of the total rural energy demand forecast and conduct path analysis to compare the explanatory power of the influencing factors to energy demand; Then, the parameter estimation results are calculated based on the BP-PSO-GA algorithm; finally, the scenario is given, and the regional rural energy demand forecast results are calculated by using the regression model. Through the simulation and verification of actual examples, the following conclusions are drawn:
I. From the perspective of the forecast model structure, economic growth is the main factor of energy consumption, and China’s energy demand will still experience a period of high growth.
II. The prediction error of this study can reach about 1.35%, which is better than using the PSO and GA algorithms alone. It can more accurately predict the future total rural energy demand and guide the construction of the rural energy system.
III. This study standardizes the calculation process, strengthens the key influencing factors, can more accurately predict the total energy demand in rural areas, and provides support for the construction of rural energy systems.
Data availability statement
The original contributions presented in the study are included in the article/Supplementary Material, further inquiries can be directed to the corresponding author.
Author contributions
WG was responsible for the specific work of this article. ZL and LT guided the work of this article. CH and WL did some calculations. WS, YJ, and LC collected data and calculated and compared the plans.
Acknowledgments
The corresponding author thanks Economic and Technology Institute, State Grid Fujian Electric Power Co., Ltd. and Tianjin Tianda Qiushi Electric Power High Technology Co., Ltd. for their selfless support. The authors acknowledge the funding of the State Grid Corporation of China’s Science and Technology Project (JSB17202000260).
Conflict of interest
Authors LW, WS, YJ, and LC were employed by Tianjin Tianda Qiushi Electric Power High Technology Co., Ltd.
The remaining authors declare that the research was conducted in the absence of any commercial or financial relationships that could be construed as a potential conflict of interest.
Publisher’s note
All claims expressed in this article are solely those of the authors and do not necessarily represent those of their affiliated organizations, or those of the publisher, the editors and the reviewers. Any product that may be evaluated in this article, or claim that may be made by its manufacturer, is not guaranteed or endorsed by the publisher.
References
Fan, W. Y., and Hao, Y. (2020). An empirical research on the relationship amongst renewable energy consumption, economic growth and foreign direct investment in China. Renew. energy 146, 598–609. doi:10.1016/j.renene.2019.06.170
Hamazaceb, C. (2007). Forecasting of Turkey’s net electricity energy consumption on sectoral bases. Energy Policy 35 (3), 2009–2016. doi:10.1016/j.enpol.2006.03.014
Hobbs, B. F., Helma, U., Jitprapaikulsarn, S., Konda, S., and Maratukulam, D. (1998). Artificial neural networks for short-term energy forecasting: Accuracy and economic value. Neurocomputing 23 (1-3), 71–84. doi:10.1016/S0925-2312(98)00072-1
Huang, H., Li, Q. F., Yang, Y. W., Zhang, L. T., and Dong, Z. W. (2022). Research on urban comprehensive energy planning system based on hierarchical framework and CAS theory. Energy Rep. 8, 73–83. doi:10.1016/j.egyr.2022.01.146
Jiang, W., Huang, Z., Peng, Y., Fang, Y., and Cao, Y. (2020). Factors affecting prefabricated construction promotion in China: A structural equation modeling approach. PLoS One 15 (1), e0227787. doi:10.1371/journal.pone.0227787
Jnr, E. O. N., Ziggah, Y. Y., and Relvas, S. (2021). Hybrid ensemble intelligent model based on wavelet transform, swarm intelligence and artificial neural network for electricity demand forecasting. Sustain. Cities Soc. 66, 102679. doi:10.1016/j.scs.2020.102679
Li, H. X., Zhang, X. C., Li, F., Zhang, H. N., Li, N., and Ma, X. (2021). Qinghai energy demand forecasting and development strategy research under the background of construction of clean energy demonstration province. Electr. Power 54 (07), 1–10+26. doi:10.11930/j.issn.1004-9649.202007277
Li, P., Zhang, Y. H., Li, S. R., Li, H. X., Wang, S. Q., and Zhang, L. H. (2021). Research on the demand structure of all categories of energy in my country's rural areas—based on the analysis of rural energy consumption data in henan province. Price Theory Pract. 41 (10), 172–176. doi:10.19851/j.cnki.CN11-1010/F.2021.10.359
Li, T., Wang, B., Zhang, L. M., and Zhao, X. (2018). “Short-term load forecasting using optimized LSTM networks based on EMD,” in 2018 10th international conference on communications, circuits and systems (ICCCAS) (IEEE), 84–88. doi:10.1109/ICCCAS.2018.8769255
Lu, L., Liu, L., Cheng, H. Z., Zhou, Q., and Jiang, L. (2019). The impact and forecast of economic transformation on energy demand in Southwest China. J. Electr. Power Syst. Automation 31 (07), 117–122. doi:10.19635/j.cnki.csu-epsa.000090
Ma, Q. L., and Li, Q. (2020). The dynamic relationship between energy efficiency, energy consumption and economic growth in Liaoning Province. J. Shenyang Univ. Technol. Soc. Sci. Ed. 13 (2), 145–152. doi:10.7688./j.issn.1674-0823.2020.02.08
Morikawa, M. (2012). Population density and efficiency in energy consumption: An empirical analysis of service establishments. Energy Econ. 34 (5), 1617–1622. doi:10.1016/j.eneco.2012.01.004
Peng, Y., and Xiang, W. (2020). Short-term traffic volume prediction using GA-BP based on wavelet denoising and phase space reconstruction. Phys. A Stat. Mech. its Appl. 549, 123913. doi:10.1016/j.physa.2019.123913
Shao, S., Fan, M. T., and Yang, L. L. (2022). Economic structural adjustment, green Technology progress and China’s low-carbon transformation and development: An empirical investigation based on the perspective of overall Technology frontier and spatial spillover effect. Manag. World 38 (02), 46–69. doi:10.19744/j.cnki.11-1235/f.2022.0031
Shi, F., Wu, H., and Chang, G. (2021). Research on China's energy security evaluation oriented by environmental monitoring in the dual carbon background. Int. Conf. Environ. Remote Sens. Big Data (ERSBD 2021) 12129, 239–247. doi:10.1117/12.2625570
Usman, M., and Radulescu, M. (2022). Examining the role of nuclear and renewable energy in reducing carbon footprint: Does the role of technological innovation really create some difference? Sci. Total Environ. 841, 156662. doi:10.1016/j.scitotenv.2022.156662
Wang, W. Z., Liu, L. C., Liao, H., and Wei, Y. M. (2021). Impacts of urbanization on carbon emissions: An empirical analysis from OECD countries. Energy Policy 151, 112171. doi:10.1016/j.enpol.2021.112171
Xu, X. Y., Yang, Y. Y., and Li, H. S. (2022). How can the global energy Internet achieve strategic synergy with the new development pattern of "dual circulation. Foreign Econ. Manag. 44 (02), 21–35. doi:10.16538/j.cnki.fem.20210923.101
Zhang, Y. S., Guo, L. D., Li, Q., and Li, J. H. (2018). “Electricity consumption forecasting method based on MPSO-BP neural network model,” in Proceedings of the 2016 4th International Conference On Electrical Electronics Engineering And Computer Science (ICEEECS 2016) 50, 674–678. doi:10.2991/iceeecs-16.2016.133
Keywords: energy consumption intensity, energy demand forecast, particle swarm-genetic hybrid optimization algorithm, clean and low-carbon energy transformation, energy demand regression model
Citation: Guilian W, Linyao Z, Tingting L, Hao C, Wenlong L, Shaofang W, Jun Y and Conghao L (2023) Forecast of total rural energy demand based on energy consumption intensity. Front. Energy Res. 10:1021164. doi: 10.3389/fenrg.2022.1021164
Received: 17 August 2022; Accepted: 15 September 2022;
Published: 10 January 2023.
Edited by:
Bin Zhou, Hunan University, ChinaReviewed by:
Fengzhang Luo, Tianjin University, ChinaZhang Bing, Henan University of Animal Husbandry and Economy, China
Copyright © 2023 Guilian, Linyao, Tingting, Hao, Wenlong, Shaofang, Jun and Conghao. This is an open-access article distributed under the terms of the Creative Commons Attribution License (CC BY). The use, distribution or reproduction in other forums is permitted, provided the original author(s) and the copyright owner(s) are credited and that the original publication in this journal is cited, in accordance with accepted academic practice. No use, distribution or reproduction is permitted which does not comply with these terms.
*Correspondence: Wu Guilian, wglgwfjjyy@126.com