Hybrid Data-Driven Modeling for an AC/DC Power System Considering Renewable Energy Uncertainty
 Jingsen Zhou
 Yongtao Chen1
 - 1Chongqing Electric Power Research Institute, State Grid Corporation of China, Chongqing, China
- 2State Key Laboratory of Power Transmission Equipment and System Security and New Technology, School of Electrical Engineering, Chongqing University, Chongqing, China
- 3Department of Electrical Engineering, Nanjing University of Science and Technology, Nanjing, China
The development of grid-connected renewable energy sources and the widespread use of power electronic devices have exacerbated the uncertain, time-varying, and non-linear characteristics of power systems, making accurate and real-time model design challenging. Modeling for unmodeled dynamics and random characteristics has inherent disadvantages in power system simulation. Conventional converter valve modeling ignores the high-frequency switching condition. This study aims to provide an effective modeling strategy that can accurately characterize the unmodeled dynamics and uncertainty of AC/DC hybrid interconnection systems with significant grid-connected renewable energy capacity. The model-data hybrid-driven modeling concept based on digital twin (DT) enhances the technique’s effectiveness. It models the proportional-integral control link of a voltage source converter (VSC). The time convolution neural network (TCN) algorithm can describe accurately the high-frequency switching state of the switching device and the operation state of renewable energy units that changes dynamically with weather conditions and other variables. The simulation experiments on a real-world power grid demonstrate the proposed modeling method’s efficiency and the hybrid-driven model’s performance.
1 Introduction
Environmental issues such as climate change and global warming are compelling all countries to pursue a clean, low-carbon development path (Gi et al., 2020). Amongst them, the growth of China’s renewable energy industry has garnered global interest. China has formally determined to achieve carbon neutrality by 2060 and peak carbon dioxide emissions by 2030 (Duan et al., 2021). The power system’s supply structure has changed dramatically as renewable energy’s grid-connected capacity grows. Many ultra-high-voltage direct current (UHVDC) transmission projects have been launched across China, strengthening the “strong DC and weak AC” characteristics of power system. Actually, China’s power system can be characterized by two essential properties: the high proportion of renewable energy sources (RES) and the AC/DC hybrid interconnection. The RES’ outputs are inherently variable and intermittent. Beyond that, the wide utilization of power electronic devices with high voltage and large capacity increases the time-varying complexity and uncertainty of the power system, resulting in considerable challenges to the secure and stable operation of the power system.
Therefore, it is extremely essential to construct an accurate model of the physical power system for evaluating its operating status to study the dynamic characteristics precisely and verify the corresponding control strategy effectively. Up until now, an immense amount of work has been carried out on the topic of power system model construction. Generally, the approaches to construct the power system model can be roughly grouped into two categories, that is, the model-driven method and data-driven method. Note that the model-driven method depends on the fundamental physical knowledge of the artificial system to obtain the differential–algebraic equations with accurate physical concepts and clear mathematical logic. For instance, Ding et al. (2017) proposed a practical method for modeling a VSC-HVDC system in large-scale electromechanical transient simulation. Since this method ignores the high-frequency switching status of power electronic devices, the dynamic characteristics of the model constructed by this method is different from the actual situation. Grdeni et al. (2020) introduced an AC network modeling method for the small-signal stability analysis of an AC system with VSC-HVDC converters, which combines the static and dynamic models of AC network together. Du et al. (2019) established the small-signal mathematical model of VSC converter including the phase-locked loop (PLL), voltage feed-forward control, and other links to analyze the key factors which affect the sub-synchronous oscillation stability. Similarly, Zhang and Chen (2018) established the global small-signal model of the power system for adjusting the controller parameters quantitatively and analyzing the effect of the external AC system on the controller parameter tuning. Except for the small-signal stability study mentioned previously, the model-driven method has been widely used in other application fields. Therein, the major scenarios include the energy management in energy Internet (Li et al., 2020; Li et al., 2021) and the economic environmental dispatch of microgrid (Liu and Yang, 2021).
Of note, the aforementioned research studies mainly focus on solving the model construction problem by the model-driven method based on the existing mature physical knowledge, which cannot effectively describe the unmodeled and uncertain dynamic characteristics of the power system with fluctuated renewable energy and large-scale power electronic devices (Xie et al., 2017; Xiao et al., 2018). To overcome these deficiencies, the data-driven methods mainly concentrate on depicting unmodeled and uncertain characteristics precisely and solving the dimension disaster problem faced by the model-driven method by utilizing power system massive operation data collected by a wide area measurement system (WAMS) (Cui et al., 2019). Nowadays, the data-driven method has become an important modeling method and can be seen as a promising alternative. Cai et al. (2020) proposed a data-driven equivalent modeling method for microgrid based on long short-term memory (LSTM) recurrent neural network, which simplifies the grid-connected model of microgrid in the power system stability study. Kong et al. (2019) also put forward an LSTM recurrent neural network-base framework to forecast the electric load of a single energy user, which plays an essential role in future grid planning and operation. Cai et al. (2016) presented an equivalent modeling method for power system analysis with a DC microgrid connected. The equivalent model was based on fuzzy clustering radial basis function (FRBF) and improved bacterial foraging algorithm. However, every data-driven method is generally appropriate for its own specific scenarios and domains, which needs to be further improved with its robustness and universality. Meanwhile, the interpretability of the data-driven method in terms of mathematical and physical principles has not been solved well, resulting in devastating consequences on the widespread use of the data-driven method. In conclusion, it is highly critical to investigate a new modeling method for describing the non-linear, uncertain, and time-varying characteristics of an AC/DC power system with fluctuated renewable energy.
As the next-generation simulation modeling technology, the digital twin (DT) has attracted extensive attention in recent years (Shen et al., 2020; Market Research Future, 2019). The DT concept was proposed in 2002 (Grieves and Vickers, 2017) to realize the simulation process of multi-fields, multi-measurements, multi-intervals, and multi-calculations. Compared with other conventional modeling methods, the core thought of DT is to construct a high-fidelity model of simulated objects in the virtual space by combining the differential–algebraic equation-based model with the statistical data-based model effectively, which just overcomes those intrinsic deficiencies of the model-driven and data-driven methods. Therefore, this study will utilize the DT technology to propose an effective modeling method for describing the unmodeled and uncertain characteristics of an AC/DC power system with random renewable energies accurately. Actually, the application scenarios of DT have included the manufacturing, automobile, and petrochemical fields (Enders and Hobbach, 2019). The DT can cover the full life cycle of physical objects, that is, from the design to maintenance (Zhuang et al., 2017). First of all, the DT could be used in the design stage to improve the product design level and validate the performance in the real world. A three-dimensional virtual representation of a physical object can be constructed, and the product’s performance and flexibility are tested in various contexts (Huang et al., 2018; Li K. et al., 2018; Liu et al., 2019; Xiong et al., 2019; Zhang et al., 2019; Zhao et al., 2019). Second, the manufacturing stage is the most collaborative. The DT model of the product is tightly coupled with the DT of the manufacturing equipment and process. Productivity can be improved by using simulation, key index monitoring, and process capability evaluation (Fei and Zhang, 2017; Tao et al., 2017; Chen et al., 2018; Guo et al., 2018; Zhu et al., 2018). Third, the maintenance stage collects device parameters with multiple sensors. Data analysis and optimization can perform remote monitoring, predictive maintenance, demand feedback, and other activities (Wang, 2018; Li B. S. et al., 2018).
Although the DT has already been used in some industries, it is still in the early application stage in the power system field. Zhou et al. (2019) used DT to analyze the electricity grid online. The electrical grid can be monitored and analyzed in real time, allowing for the early warning and proactive maintenance. Tao et al. (2018) utilized DT to build an intelligent health management system for power plants, realizing the realistic perspective monitoring, accurate fault warning, continuous iterative optimization of operation state, and accurate verification of the maintenance strategy. Christoph et al. (2018) presented a novel control center architecture based on DT to characterize the current and future operating status of the power system and to improve power grid monitoring. Except for these applications, DT has been effectively used in transmission channel planning, intelligent substation modeling, and other areas. However, DT has yet to be used and verified in the AC/DC power system with high-penetration renewable energy.
To address these challenges in model construction problems, this article proposes a new modeling method for the AC/DC power system with high-penetration renewable energy based on DT technology. The major contributions of this study are summarized as follows:
1) A model-data hybrid-driven modeling idea based on DT technology is proposed to accurately describe the unmodeled and uncertain dynamic characteristics of the AC/DC power system with high-penetration renewable energy
2) Taking the modeling process of the PWM loop and the high-frequency switching state of power electronic devices into account simultaneously, an equivalent model of MMC which combines the linearized model with the deep learning algorithm is constructed to further improve the accuracy and generalization of the MMC model.
3) In order to overcome the deficiencies of conventional modeling methods based on the physical mechanism, a data-driven model of the renewable energy grid-connected system is established and trained by the time convolution neural network algorithm, which can describe accurately the operation state of the renewable energy unit that changes dynamically with weather conditions and other random factors.
2 Theoretical Basis of Digital Twin Model Construction
According to the consensus of domestic and foreign research institutions, the DT model can be defined as a simulation model which makes full use of the physical model, sensor update, operation history, and other data to integrate the multi-disciplinary, multi-physical quantity, multi-scale, and multi-probability simulation process, completing mapping in virtual space so as to reflect the whole life cycle of the corresponding physical equipment. Actually, the DT model construction is to realize the digital modeling of properties, methods, and behaviors of physical entities and its processes in digital space. From the perspective of granularity or hierarchy of work, the digital twin model is not only the basic unit model construction but also needs to realize the model construction of more complex objects by model assembly from spatial dimension. Also, the model fusion from the perspective of multi-fields and multi-disciplines can realize the comprehensive characterization of various domain characteristics of complex physical objects (Tao et al., 2021).
Model construction refers to the basic unit model building of physical objects. The digital twin model building process can be carried out from two aspects: multi-domain model construction and multi-dimensional model construction of “geometry—physics—action—rule.” In detail, the “geometry—physics—action—rule” model can describe the geometric characteristics, physical characteristics, behavior coupling relation, and evolution law of physical objects; the multi-domain model can describe the thermal and mechanical characteristics of physical objects comprehensively by constructing the models of each domain involved in physical objects. Through multi-dimensional and multi-domain model constructions, the accurate construction of the digital twin model is realized. Ideally, the digital twin model should cover multi-dimensional and multi-domain models, so as to achieve a comprehensive and real description of physical objects. However, from the perspective of practical application, the digital twin model does not necessarily need to cover all dimensions and domains. Therefore, it can be adjusted according to the actual demand and actual objects, that is, to build a partial domain and partial dimension model (Tao et al., 2020).
Under the background of AC/DC hybrid interconnection and high-penetration renewable energy, the network topology and operation mode of the power system are becoming more and more complicated. The conventional model construction methods based on high-order differential–algebraic equations are only applicable to some standard or classical operation scenarios. Therefore, the accuracy of the model-driven method in a complex and dynamic external environment may be much different from the real operation state of the power system. In this study, the DT technology is utilized to construct a high-fidelity dynamic model of the real-world physical power system including the MMC-HVDC project and grid-connected system of renewable energy. Figure 1 shows a brief introduction for the theoretical foundation of DT model construction of the power system.
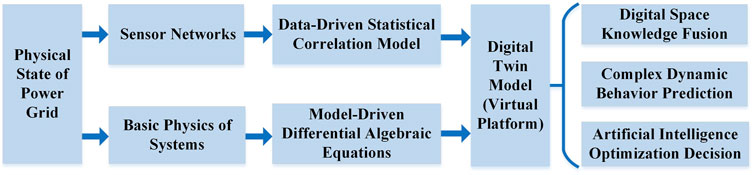
FIGURE 1. Principle of digital twin simulation modeling of the power system.
3 Modeling of the AC/DC Hybrid Interconnection System With High-Penetration Renewable Energy Based on Digital Twin
3.1 Construction Process of the Hybrid-Driven Model
Conventional power system modeling focuses on solving high-order differential–algebraic equations to build mathematical models and simulate full time domains. As the grid-connected scale of renewable energy and the transmission capacity of MMC-HVDC increase year by year, the conventional modeling methods are facing lots of difficulties, such as the random characteristics of renewable energy units, large-scale modeling of power electronic devices, and complex system control procedures. Due to the rapid expansion of the power system model, the “dimension disaster” problem is becoming more and more prominent. Moreover, the balancing between computation accuracy and efficiency should also be considered seriously.
Therefore, a hybrid-driven model which combines the model-driven theory with the data-driven method is proposed in this study. Figure 2 shows a DT model construction process of a real-world power system. Specifically, the model-data hybrid-driven model of a real power system is constructed by combining the linearized mathematical model of MMC’s PI control loop with the data-driven models of MMC’s PWM loop and grid-connected system of renewable energies.
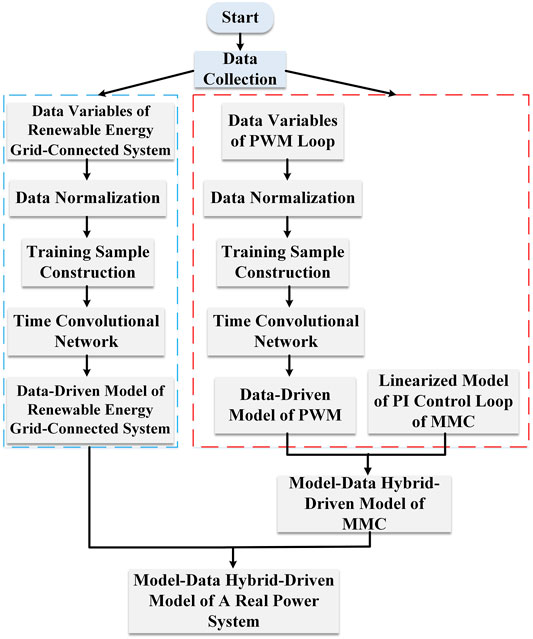
FIGURE 2. Construction process of the hybrid-driven model of a real power system.
3.2 Model-Data Hybrid-Driven Model of MMC
Modular multi-level converter (MMC) current vector control can be divided into inner loop control and outer loop control, respectively. The inner loop control is mainly current control, and the outer loop control is mainly power control (Fei and Zhang, 2017; Tao et al., 2017). The control principles are shown in Figure 3.
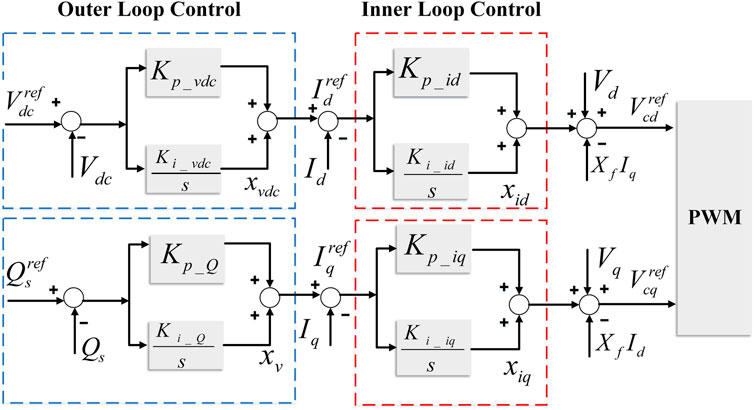
FIGURE 3. Schematic diagram of the MMC-HVDC outer and inner loop control principle.
The specific process of PWM is shown in Figure 4. The output signals [
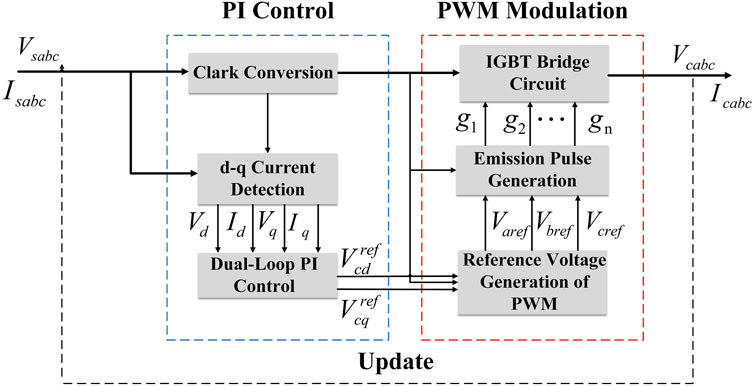
FIGURE 4. PWM loop of MMC.
On account of the complicated internal structure and the massive power electronic devices, MMC has to control hundreds of switching devices simultaneously with good accuracy and efficiency. Therefore, the modeling of its control system is more difficult than other types of converter models (Zhu et al., 2018). Actually, the conventional converter valve modeling generally ignores the PWM loop and the switching device’s high-frequency state. As a result, the modeling requirements for describing the switching characteristics of bridge arm sub-modules accurately are violated. This study presents a new MMC modeling method based on a hybrid-driven theory to improve the model’s accuracy and validity. In detail, the MMC hybrid-driven model combines the mechanism of linearized modeling with the deep learning method, describing the internal and exterior response features of MMC accurately.
As shown in Figure 4, those data variables enter the PI control loop and PWM loop, both of which have the reference tracking concerns. Based on Figure 3, the PI control loop’s linearized mathematical model can be expressed as follows:
where
The input signals of the PWM model are the reference voltages
where
The PWM generates the pulse control signal of each sub-module of MMC and finally generates the d–q-axis voltage components of three-phase AC signals on the grid side. By defining the mapping relationship between PWM input and output as
The data-driven PWM model
By synthesizing (Eqs 1–3), the equivalent mathematical model of MMC based on model-data hybrid drive can be obtained as follows:
where
In this study, the time convolution neural (TCN) network which features extended causal convolution and residual connection is more suitable for developing the data-driven model of PWM than back propagation (BP) networks and other approaches. Actually, the input and output signals can be obtained by using the historical and operational data of the power system. The hybrid-driven equivalent dynamic model of MMC can be constructed by building the linearized model of the PI control loop and utilizing TCN algorithm to learn the mapping relationship between PWM input and output signals.
3.3 Equivalent Model of Renewable Energy Grid-Connected System-Based Data Drive
The state analysis of the renewable energy grid-connected system is generally based on the model-driven method, and the full time-domain simulation is performed by solving high-order non-linear differential–algebraic equations. However, the order of the power system model has increased dramatically with the high penetration of renewable energy and massive power electronic devices in use. Furthermore, the conventional mathematical model is only applicable in some typical operational states and not able to accurately describe the dynamic characteristics of the renewable energy grid-connected system, which changes with the weather conditions and other random factors.
In addition, the high-frequency switching state of the semiconductor switch is hard to be described by the conventional modeling method of the renewable energy grid-connected system, and the PWM loop is also generally ignored. Therefore, the TCN algorithm is utilized in this study to match the non-linear mapping relationship between the input and output signals of the renewable energy grid-connected system, breaking through the limitations of the conventional model-driven modeling method.
Figure 5 shows the schematic diagram of the renewable energy grid-connected system. In detail,
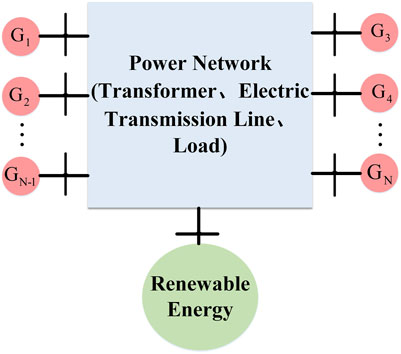
FIGURE 5. Schematic diagram of the renewable energy grid-connected system.
For the signal selection problem of the proposed data-driven model, the input signals of the data-driven model of a wind generator include the PCC voltage, capacitor voltage, and wind speed, while the light intensity and ambient temperature are chosen as the input signals of the photovoltaic generator equivalent model. Finally, no matter for wind or the photovoltaic power unit, the PCC active and reactive power are selected as the output signals of the renewable energy grid-connected system.
4 Data-Driven Model Based on Time Convolution Neural Network
In general, TCN algorithm outperforms other neural network algorithms for the physical simulation modeling with time series characteristics. For example, the long short-term memory (LSTM) (Chen and Sun, 2018; Kim et al., 2018), deep belief network (DBN) (Liang et al., 2018), recurrent neural network (RNN) (Yu et al., 2019), and other methods have the time series characteristics in the prediction process, resulting in the impossibility of massively parallel processing. On the contrary, TCN algorithm not only can realize the massively parallel processing but also get the upper hand in terms of running efficiency and accuracy. In essence, TCN algorithm can be regarded as a combination of one-dimensional full convolution network and causal convolution. Instead of the conventional convolution layer, the TCN network uses an extended causal convolution network (ECCN).
Actually, the most important feature of the ECCN is that the output at time
where
Although the causal convolution can effectively model the time series, the extracted features only consider the information of several adjacent moments, which has the problem of insufficient receptive field. By injecting “holes” into causal convolution, the data information can go back much further. Therefore, the extended causal convolution at
where
In order to avoid the gradient explosion or disappearance and reduce the learning complexity further in practical application processes, it is necessary to add a residual connection to the output of each TCN block. Also, the convolution network is used for connecting the input and output in Eq. 7. After adding the residual connection, the TCN module can be expressed as follows:
where
5 Experimental Verification of a Real Power System Hybrid-Driven Model
In the real-world power system used for simulation, the nominal voltage and transmission capacity of the back-to-back MMC-HVDC project are ±420 kV and 1,000 MW, respectively. There is a large number of power electronic devices used in the MMC converter stations.
According to actual project plan, the MMC-HVDC will build two back-to-back converter stations in the north and south separately. In Figure 6, the converter station in the north is located and built together with substation 4. The converter station with a capacity of 2 × 1,000 MW is connected with the line between substation 2 and substation 4 by the type of access of PI. There are four 500 kV AC outgoing lines, including two lines with a length of 226 km to substation 2 and two lines to substation 4. A brief diagram of the north channel of the MMC-HVDC project is shown in Figure 6.
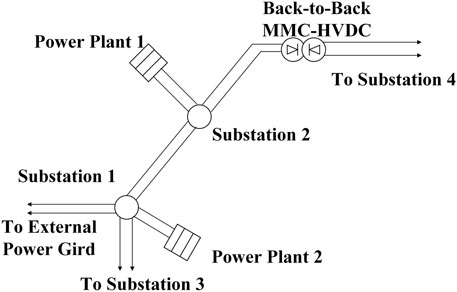
FIGURE 6. Brief diagram of the north channel of MMC-HVDC.
Actually, the renewable energies such as wind or photovoltaic power in the real-world power system mentioned above are characterized by “decentralized development and local consumption.” Until 2021, it is expected that the load power and renewable energy capacity will increase to 2,130 and 590 MW, respectively, making the penetration of renewable energy reach 27.7%. With the booming development of renewable energy and the commissioning of the MMC-HVDC project, the real-world power system shown in Figure 6 has preliminarily formed an AC/DC hybrid interconnection system with high-penetration renewable energy.
5.1 Real Power System Parameter
In this study, a model-data hybrid-driven model of the real-world power system in Figure 6 is constructed by DT technology. In order to verify the accuracy and effectiveness of the proposed modeling method, a conventional model-driven model based on physical mechanism is built in the PSCAD software. The main parameters of the AC power grid, MMC-HVDC, and wind/photovoltaic power generators are shown in Table 1, Table 2, and Table 3, respectively. The outlet of the AC bus side of the converter station adopts Thevenin’s equivalent circuit. The simulation model of the real-world power grid covers two critical 500 kV substations (i.e., substation 1 and substation 2).
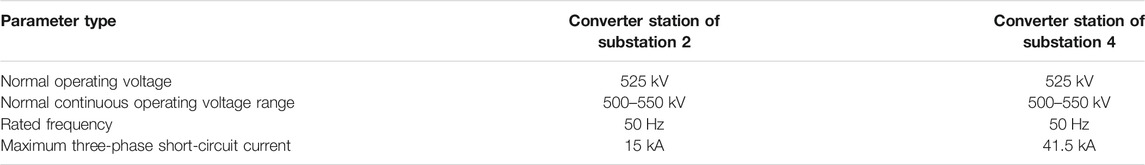
TABLE 1. Main parameters of the AC power grid.
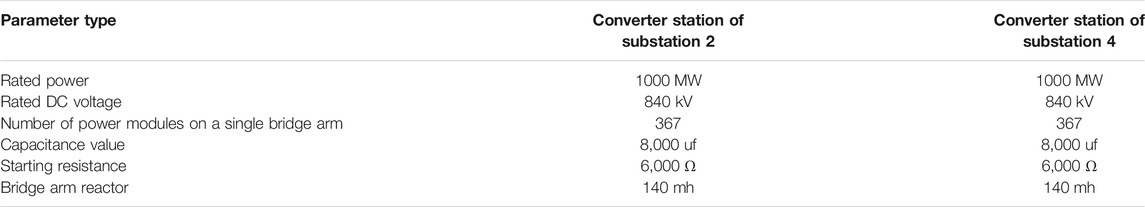
TABLE 2. Main parameters of MMC-HVDC.

TABLE 3. Key parameters of the wind power generator (DFIG) and photovoltaic power generator.
5.2 Signal Selection and Training Sample Acquisition of the Data-Driven Model
In the simulation experiment, the data-driven modeling idea is used for the modeling of a PWM loop and wind/photovoltaic power grid-connected system. For the PWM loop of MMC, the reference values of physical quantities
In the offline training of the data-driven model based on TCN algorithm, large amounts of system running data are needed for the iterative optimization of network parameters. Since the daily operation state of the power system is usually steady and the transient operation state under fault condition is generally few, there is a problem of insufficient training data and resources. Furthermore, the data collected in an actual operating environment of the power system are usually the raw data with noise and error signals, which causes great interference to the training of neural network.
Therefore, in order to obtain more abundant and high-quality training samples, the simulation data under the steady or transient operating state will be utilized to describe the dynamic characteristics of the power system. On one hand, in the steady operating state, the simulation sampling frequency is set as 1,000 kHz. The data will be recorded after the MMC operation state becomes stable.
On the other hand, different types of faults on the AC grid, such as the single-phase and three-phase short-circuit grounding, are set in the simulation. The fault starting and duration time are set as 1.0 and 0.25 s, respectively. In this study, it is assumed that the power system is still operating in the safe and stable region after the fault occurs, which means the fault current and voltage are both within the operating limits when the limiting measures are taken. In order to form a valid data sample set, the input and output signals will be recorded and all the electrical quantities collected will be standardized and the mean will be removed.
5.3 Verification Results of the Digital Twin Model
For the result comparison, a classical mathematical model of the power system is constructed based on the main running parameters and network topology information. In a steady-state simulation test, the parameters of power grid running, renewable energy generators, and critical substations under the heavy-load mode in the wet season are utilized. In order to verify the effectiveness of the modeling method proposed in this study, a hybrid-driven model based on DT technology is constructed by using the historical and simulated data according to the construction process in Figure 2.
5.3.1 Steady-State Analysis
In steady state, the actual transmission capacity of back-to-back MMC-HVDC is 2 × 1,000 MW. The positive and negative poles of the converter valve units transmit 500 MW electrical energy each, and the DC voltage is set as ±420 kV. The comparison results of the classical mathematical model (model 1) and hybrid-driven model (model 2) are shown in Figure 7. The simulation conclusions are summarized as follows:
(1) In detail, first, from Figure 7A, the DC voltage curves of model 2 (irrespective of the positive or negative poles) fluctuate almost close to the curve of model 1, which demonstrates the accurate tracking ability of the proposed modeling method for power system steady state
(2) In Figure 7B, although the curve of model 2 fluctuates a little bit compared with the curve of model 1, the fluctuation amplitude is within acceptable range and the variation tendency of these two curves is completely the same in the steady state; as shown in Figure 7C, the same conclusion can also be obtained
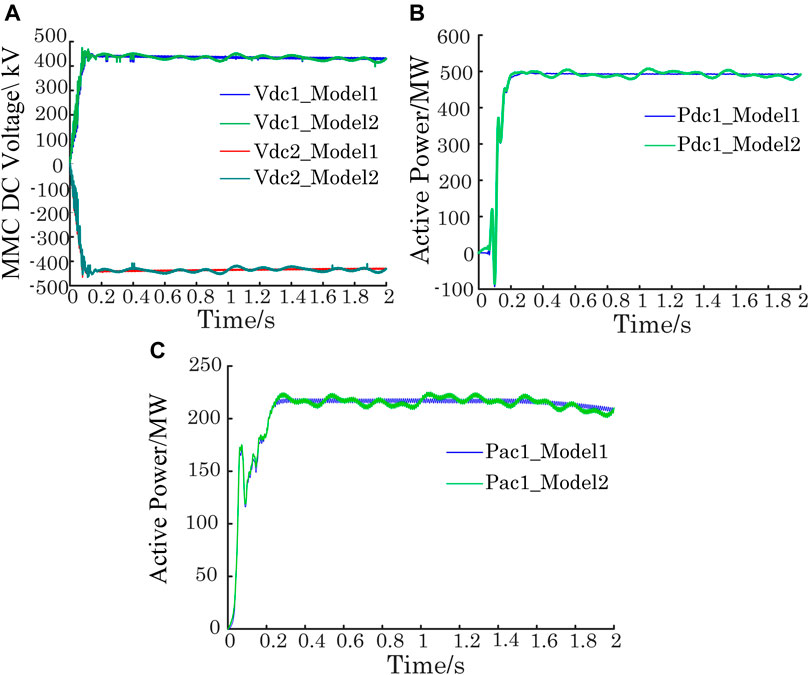
FIGURE 7. Steady-state comparison results of the classical mathematical model (model 1) and hybrid-driven model (model 2). (A) DC voltage of MMC in the heavy-load mode. (B) Active power of the unipolar DC line in the heavy-load mode. (C) Active power of the AC side of substation 3 in the heavy-load mode.
In conclusion, the hybrid-driven model proposed in this study can describe the steady state of the power grid represented by the classical mathematical model with high accuracy. Irrespective of the critical operational parameters on the DC side or those on AC side, the relative error between the hybrid-driven model and classical mathematical model is within acceptable limit, which proves the effectiveness and validity of the proposed method for describing the power system steady state.
5.3.2 Transient Stability Analysis
In the transient process, multiple types of faults such as renewable energy generator cutting off and bus short circuit are set up in this study. Specifically, the fault starting time and duration time are 1.0 and 0.25 s, respectively. The time-domain curves of DC current and active power under different fault types in the transient process are shown in Figure 8 and Figure 9. Relevant simulation results are summarized as follows:
(1) On one hand, for the renewable energy generator cutting off fault, Figure 8 (A) shows that the active power curves of model 1 and model 2 are almost coincident just with a small difference during the transient period between 1.0 and 1.25 s; the simulation results of Figures 8B,C also show the accurate tracking characteristic of the proposed modeling method.
(2) On the other hand, for the bus short-circuit fault, Figures 9 (A) and (B) demonstrate that the hybrid-driven model can follow the transient variation of the power system actual state represented by model 1 in the small fluctuation scenario. At the same time, the proposed modeling method can also describe the transient process of the active power curve of the AC side accurately in the large fluctuation scenario, which is shown in Figure 9C.
(3) Furthermore, comparing the results of Figure 8 with those of Figure 9, the renewable energy generator cutting off fault can induce bigger oscillations in the active power and DC current of a unipolar DC line than the bus short-circuit fault. On the contrary, the active power of the AC side of substation 3 is more affected by the bus short-circuit fault compared with the renewable energy generator cutting off fault.
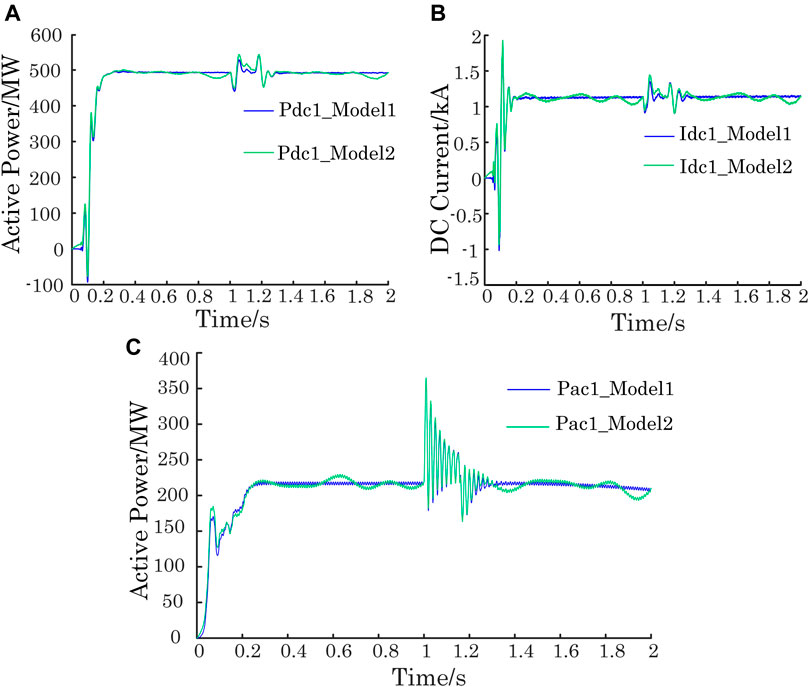
FIGURE 8. Time-domain curves under renewable energy generator cutting off fault in the transient process: (A) active power of the unipolar DC line; (B) DC current curves; and (C) active power of the AC side of substation 3.
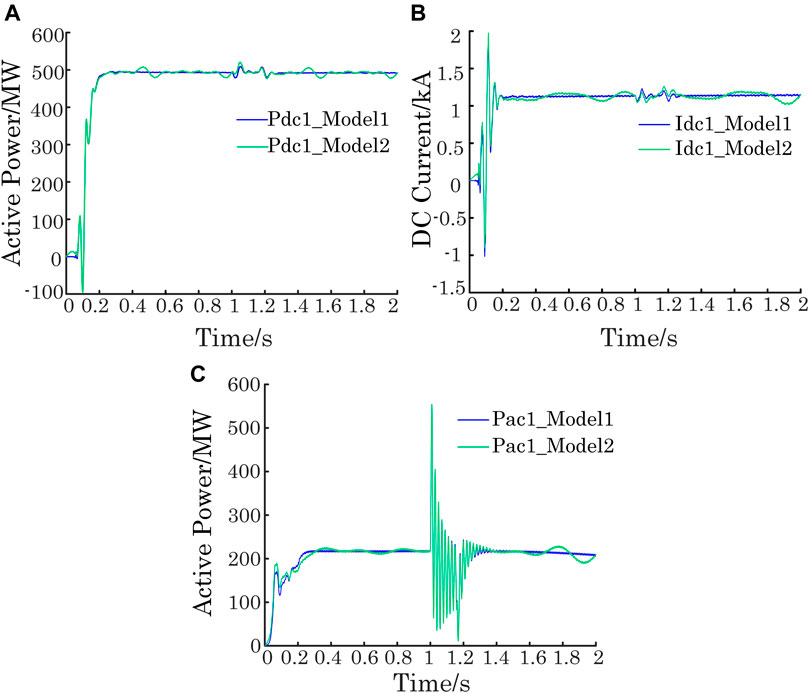
FIGURE 9. Time-domain curves under bus short-circuit fault in the transient process: (A) active power of the unipolar DC line; (B) DC current curve; and (C) active power of the AC side of substation 3.
Regardless of which type of faults mentioned above, the hybrid-driven model (i.e., model 1) is able to track the transient response curve of the power grid accurately and effectively, which demonstrates that the modeling method proposed in this study can describe the transient characteristics of the power system with high precision.
5.3.3 Model Robustness Verification
In order to verify the robustness of the proposed hybrid-driven model further, a validation sample set is formed by transient simulation at a new operating point (i.e., the low-load mode in the wet season) different from the training sample set. In order to simulate the transient process of the real power system after the fault occurs, three groups of different validation sample sets are obtained by setting fault types of single-phase grounding, two-phase, and three-phase short circuits whose fault starting time and duration time are 0.5 s and 450 ms, respectively. The hybrid-driven DT model after 500 training iterations is used for robustness testing. The comparative time-domain curves of the classical mathematical model (model 1) and hybrid-driven model (model 2) are shown in Figure 10. Some important conclusions can be drawn as follows:
(1) It can be concluded that, with the increase in fault severity, the fluctuation amplitude of the time-domain curve increases. Since the three-phase short circuit fault is the most serious fault, the corresponding curve of AC line active power has the largest fluctuation range. In the order of fluctuation amplitudes, the two-phase and single-phase short-circuit fault rank second and third, respectively.
(2) Another important conclusion is that the proposed hybrid-driven model can keep track with the transient process accurately within the acceptable error under all the three types of faults, which demonstrates that the hybrid-driven model trained by TCN has good robustness in face of different validation sample sets.
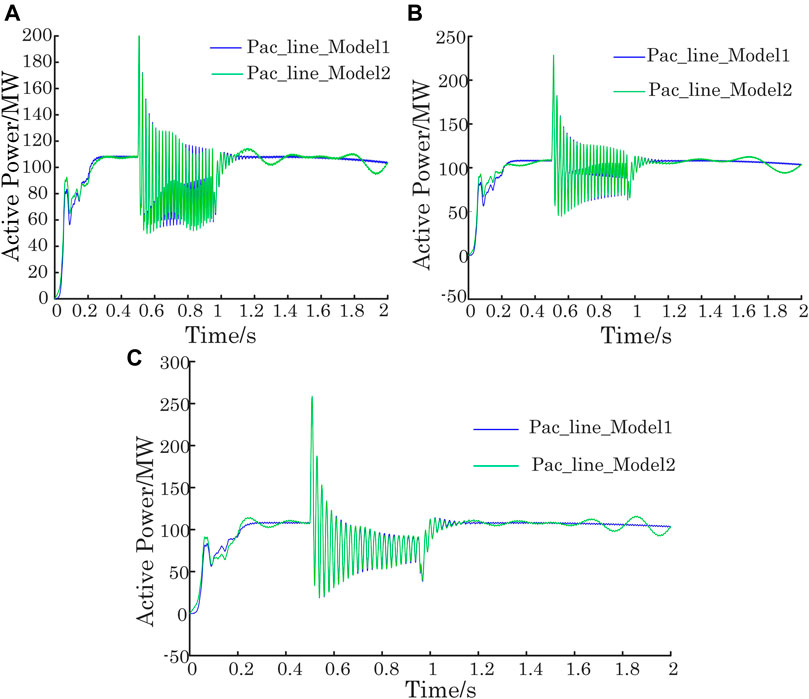
FIGURE 10. Simulation result of model 1 and model 2 robustness: (A) AC line active power curve under singe-phase grounding fault; (B) AC line active power with two-phase short circuit fault; and (C) AC line active power with three-phase short-circuit fault.
5.3.4 Algorithm Error Analysis
For testing the superiority of the proposed method in this study, the back propagation (BP) network, radial basis function (RBF) network, and long short-term memory (LSTM) network will be used to substitute the data-driven parts of the proposed hybrid-driven model, respectively. The aforementioned three kinds of neural network models are trained, respectively, by using the same sample set in Section 5.2. Table 4 shows the training and test errors of different neural networks, in which the training iterations of different neural networks are all 500 times. Based on the simulation results, the following conclusions can be obtained:
(1) From the results of error comparison in Table 4, it can be concluded that the data-driven model trained by TCN network has higher accuracy than the BP, RBF, and LSTM networks, which indicates that the TCN network owns more advantages in modeling the time series data.
(2) Sorted by error size, the LSTM network is more suitable for the time series data modeling than BP and RBF. The BP network has the worst accuracy in these four neural networks.
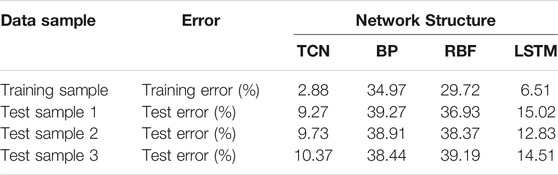
TABLE 4. Error comparison of different neural networks.
5.3.5 Analysis of Noise Test Results
The aforementioned historical and simulated data used in these models do not consider the actual measurement errors, which will affect the power system’s control effect directly through the feedback loop in the actual power system. In order to keep consistency with the measurement situation of the actual power system as much as possible, this study adds 10, 20, and 40 dB Gaussian white noise to all three groups of test sample sets, and the error results are shown in Table 5. Compared with the environment without noise, the reasons why the results do not change much are as follows:
(1) TCN network itself has the function of noise reduction.
(2) For the data sample set of time series, the increased noise has little influence on the overall characteristics of the data sample set, but may have a significant effect during the fault period.
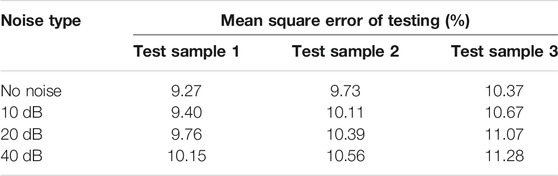
TABLE 5. Simulation results of noise testing.
6 Conclusion
In this study, an effective hybrid-driven modeling method based on DT is proposed to provide a high-fidelity description for the uncertain and non-linear characteristics of the AC/DC hybrid interconnection grid integrated with large capacity of the renewable energy source. Compared with conventional methods, it describes accurately the unmodeled dynamics and uncertain data of the AC/DC hybrid interconnection system with a high grid-connected capacity of renewable energy. Moreover, the validity of this method is enhanced by the model-data hybrid-driven modeling concept based on the DT, which combines the advantages of the linearized modeling theory with the characteristics of the data-driven model. In addition, an equivalent model of MMC that combines the linearized model with the framework of the deep learning algorithm was constructed to further improve the accuracy and generalization of the MMC model with a large amount of bridge arm sub-modules. Consequently, the effectiveness of the proposed modeling method and the expected performance of the hybrid-driven model are successfully verified in a real power system.
Data Availability Statement
The raw data supporting the conclusion of this article will be made available by the authors, without undue reservation.
Author Contributions
All authors listed have made a substantial, direct, and intellectual contribution to the work and approved it for publication.
Funding
This research was funded by the Postdoctoral Science Fund Project of the Chongqing Natural Science Foundation, Grant no. cstc2019jcyj-bshX0082.
Conflict of Interest
JZ, YC, HF, YZ, and XZ are employed by the Chongqing Electric Power Research Institute of the State Grid Corporation of China.
The remaining authors declare that the research was conducted in the absence of any commercial or financial relationships that could be construed as a potential conflict of interest.
Publisher’s Note
All claims expressed in this article are solely those of the authors and do not necessarily represent those of their affiliated organizations, or those of the publisher, the editors, and the reviewers. Any product that may be evaluated in this article, or claim that may be made by its manufacturer, is not guaranteed or endorsed by the publisher.
Acknowledgments
The authors would like to thank the Natural Science Postdoctoral Foundation of Chongqing (Grant No. cstc2019jcyj-bshX0082) for supporting this work.
References
Cai, C. C., Cheng, S. C., Deng, Z. X., and Jiang, B. (2016). DC Microgrid Equivalent Modeling Based on Fuzzy-RBF Artificial Neural Network. Power Syst. Technol. 40, 3446–3452. doi:10.13335/j.1000-3673.pst.2016.11.025
Cai, C., Liu, H., Tao, Y., Deng, Z., Dai, W., and Chen, J. (2020). Microgrid Equivalent Modeling Based on Long Short-Term Memory Neural Network. IEEE Access 8, 23120–23133. doi:10.1109/access.2020.2966238
Chen, Z., Ding, X., and Tang, J. J. (2018). Exploration on Production Control Mode of Aircraft Assembly Shop Based on Digital Twin. Aeronaut. Manufacturing Technol. 61, 46–50. doi:10.16080/j.issn1671-833x.2018.12.046
Chen, Z., and Sun, L. X. (2018). Short-Term Power Load Forecasting Method Based on Deep Learning LSTM Network. Electron. Technol. 47, 39–41. doi:10.3969/j.issn.1000-0755.2018.01.011
Christoph, B., Dirk, W., and Rainer, K. (2018). “Recent and Prospective Developments in Power System Control Centers: Adapting the Digital Twin Technology for Application in Power System Control Centers,” in 2018 IEEE International Energy Conference (Limassol), Limassol, Cyprus, 3-7 June 2018, 1745–1753.
Cui, M., Wang, J., Tan, J., Florita, A. R., and Zhang, Y. (2019). A Novel Event Detection Method Using PMU Data with High Precision. IEEE Trans. Power Syst. 34, 454–466. doi:10.1109/tpwrs.2018.2859323
Ding, P., An, N., and Zhao, M. (2017). A Practical Modeling Method of VSC-HVDC and DC-grid Electromechanical Transient. Trans. China Electrotechnical Soc. 32, 69–76. doi:10.19595/j.cnki.1000-6753.tces.2017.10.008
Du, P., Wan, Y. L., and Xiang, S. (2019). Study on Key Parameters of Sub-Synchronous Oscillation between VSC Converter and Weak Power Grid. Power Syst. Prot. Control. 47, 44–49. doi:10.19783/j.cnki.pspc.180250
Duan, H., Zhou, S., Jiang, K., Bertram, C., Harmsen, M., Kriegler, E., et al. (2021). Assessing China's Efforts to Pursue the 1.5°C Warming Limit. Science 372, 378–385. doi:10.1126/science.aba8767
Enders, M. R., and Hobbach, N. (2019). “Dimensions of Digital Twin Applications — a Literature Review,” in Twenty-Fifth Americas Conference on Information Systems (Cancun), Cancun, Mexico, August 15-17, 2019.
Fei, T., and Zhang, M. (2017). Digital Twin Shop-Floor: A New Shop-Floor Paradigm towards Smart Manufacturing. IEEE Access 5, 20418–20427. doi:10.1109/ACCESS.2017.2756069
Gi, K., Sano, F., Akimoto, K., Hiwatari, R., and Tobita, K. (2020). Potential Contribution of Fusion Power Generation to Low-Carbon Development under the Paris Agreement and Associated Uncertainties. Energ. Strategy Rev. 27, 100432. doi:10.1016/j.esr.2019.100432
Grdeni, A. G., Delimar, M., and Beerten, J. (2020). Assessment of AC Network Modeling Impact on Small-Signal Stability of AC Systems with VSC-HVDC Converters. Int. J. Electr. Power Energ. Syst. 119 (2), 105897. doi:10.1016/j.ijepes.2020.105897
Grieves, M., and Vickers, J. (2017). Digital Twin:mitigating Unpredictable, Undesirable Emergent Behavior in Complex Systems. Cham: Springer, 85–113. doi:10.1007/978-3-319-38756-7_4
Guo, D. S., Bao, J. S., and Shi, G. W. (2018). Modeling of Aerospace Structural Parts Manufacturing Shop Based on Digital Twin. J. Donghua Univ. 44, 578–585.
Huang, Y. J., Wang, R. C., and Ma, F. (2018). “Cloud Port Navigation” Digital Twin System Navigation AIDS Solution. Inf. Technol. informatization 2, 67–69. doi:10.3969/j.issn.1672-9528.2018.12.018
Kim, N., Kim, M., and Choi, J. K. (2018). “LSTM Based Short-Term Electricity Consumption Forecast with Daily Load Profile Sequences,” in 2018 IEEE 7th Global Conference on Consumer Electronics, Nara, Japan, 9-12 Oct. 2018.
Kong, W., Dong, Z. Y., Jia, Y., Hill, D. J., Xu, Y., and Zhang, Y. (2019). Short-Term Residential Load Forecasting Based on LSTM Recurrent Neural Network. IEEE Trans. Smart Grid 10, 841–851. doi:10.1109/tsg.2017.2753802
Li, B. S., Wang, X. L., and Wang, J. H. (2018). Digital Twinning and its Feasibility in Intelligent Pipe Network. Oil & Gas Storage and Transportation 37, 1081–1087. doi:10.6047/j.issn.1000-8241.2018.10.001
Li, K., Qian, H., and Gong, M. Y. (2018). Exploration of Digital Ship and its Application Based on Digital Twin Technology. Ship Boat 6, 101–108. doi:10.19423/j.cnki.31-1561/u.2018.06.101
Li, Y., Gao, D. W., Gao, W., Zhang, H., and Zhou, J. (2021). A Distributed Double-Newton Descent Algorithm for Cooperative Energy Management of Multiple Energy Bodies in Energy Internet. IEEE Trans. Ind. Inf. 17, 5993–6003. doi:10.1109/tii.2020.3029974
Li, Y., Gao, D. W., Gao, W., Zhang, H., and Zhou, J. (2020). Double-Mode Energy Management for Multi-Energy System via Distributed Dynamic Event-Triggered Newton-Raphson Algorithm. IEEE Trans. Smart Grid 11, 5339–5356. doi:10.1109/tsg.2020.3005179
Liang, Z., Sun, G. Q., and Li, H. C. (2018). Short-Term Load Prediction Based on VMD and PSO Optimization Deep Belief Network. Power Syst. Technol. 42, 598–606. doi:10.13335/j.1000-3673.pst.2017.0937
Liu, L.-N., and Yang, G.-H. (2021). Distributed Optimal Economic Environmental Dispatch for Microgrids Over Time-Varying Directed Communication Graph. IEEE Trans. Netw. Sci. Eng. 8, 1913–1924. doi:10.1109/tnse.2021.3076526
Liu, X. X., Tang, L., and Zeng, H. B. (2019). Intelligent Design Simulation of Space Control System Based on Digital Twin. J. Syst. Simulation 1, 1–8. doi:10.16182/j.issn1004731x.joss.18-FZ0524
Market Research Future (2019). Digital Twin Market Size: Digital Twin Market Size Expected to Grow at a CAGR over 42.54% from 2018 to 2025. Available at: Https://www.marketresearchfuture.com/press-release/digital-twin-market. (Accessed December 7, 2021).
Shen, C., Jia, M. S., and Chen, Y. (2020). Energy Internet Digital Twin and its Application. Glob. Energ. Interconnection 1, 1–13. doi:10.19705/j.cnki.issn2096-5125.2020.01.001
Tao, F., Liu, W. R., and Liu, J. H. (2018). Digital Twinning and its Application. Comput. Integrated Manufacturing Syst. 24, 1–18. doi:10.13196/j.cims.2018.01.001
Tao, F., Zhang, H., and Qi, Q. L. (2020). Ten Questions towards Digital Twin: Analysis and Thinking. Comput. Integrated Manufacturing Syst. 26, 1–17. doi:10.13196/j.cims.2020.01.001
Tao, F., Zhang, H., and Qi, Q. L. (2021). Theory of Digital Twin Modeling and its Application. Comput. Integrated Manufacturing Syst. 27, 1–15. doi:10.12688/digitaltwin.17471.1
Tao, F., Zhang, M., and Cheng, J. F. (2017). Digital Twin Workshop - a New Model for Future Workshop Operation. Comput. Integrated Manufacturing Syst. 23, 1–9. doi:10.13196/j.cims.2017.01.001
Wang, L. (2018). Research on Joint Technology of Aero Engine Low Pressure Turbine Unit Based on Digital Twin. Comput. Meas. Control. 26, 286–290. doi:10.16526/j.cnki.11-4762/tp.2018.10.061
Xiao, X. N., Liao, K. Y., and Tang, S. H. (2018). Development of Electric Power Electronization in Distribution Network and New Problems of Ultra-High Harmonic Wave. Trans. China Electrotechnical Soc. 33, 707–720. doi:10.19595/j.cnki.1000-6753.tces.171613
Xie, X. R., Liu, H. K., and He, J. B. (2017). Modeling Method of Small Signal Impedance/Admittance Network for Grid-Connected System of New Energy Generation. Power Syst. Automation 41, 26–32. doi:10.7500/aeps20170125005
Xiong, M., Gu, L., and Wu, Z. F. (2019). Construction and Application of Digital Twin of In-Service Oil and Gas Pipeline. Oil & Gas Storage and Transportation 38, 503–509.
Yu, H. M., Zhang, Z. S., Gong, W. J., and Duan, X. Y. (2019). Short-Term Load Forecasting Model of Power System Based on Deep Recursive Neural Network. Power Syst. Automation 31, 112–116. doi:10.3969/j.issn.1003-8930.2019.01.018
Zhang, F., and Chen, X. K. (2018). Research on Parameter Tuning of Second-Order LADRC for VSC-HVDC Converter Station. Power Syst. Technol. 42, 3744–3755. doi:10.13335/j.1000-3673.pst.2018.0541
Zhang, H., Liu, Q., and Chen, X. (2019). A Digital Twin-Based Approach for Designing and Multi-Objective Optimization of Hollow Glass Production Line. IEEE Access 5, 26901–26911. doi:10.1109/ACCESS.2017.2766453
Zhao, R., Yan, D., Liu, Q., Leng, J., Wan, J., Chen, X., et al. (2019). Digital Twin-Driven Cyber-Physical System for Autonomously Controlling of Micro Punching System. IEEE Access 7, 9459–9469. doi:10.1109/access.2019.2891060
Zhou, M., Yan, J. F., and Feng, D. H. (2019). Digital Twin Framework and its Application to Power Grid Online Analysis. CSEE J. Power Energ. Syst. 5, 391–398. doi:10.17775/CSEEJPES.2018.01460
Zhu, Z. M., Tao, Z. W., and Lu, J. N. (2018). Study on Digital Twin Workshop of Rail Transit Bogie. Machinery 56, 13–16.
Keywords: hybrid AC/DC, renewable energy, digital twin, hybrid-driven model, time convolution neural network (TCN)
Citation: Zhou J, Chen Y, Ran L, Fang H, Zhang Y, Zhu X and Jaidaa A (2022) Hybrid Data-Driven Modeling for an AC/DC Power System Considering Renewable Energy Uncertainty. Front. Energy Res. 10:830833. doi: 10.3389/fenrg.2022.830833
Received: 07 December 2021; Accepted: 07 February 2022;
Published: 24 March 2022.
Edited by:
Jun Liu, Xi’an Jiaotong University, ChinaCopyright © 2022 Zhou, Chen, Ran, Fang, Zhang, Zhu and Jaidaa. This is an open-access article distributed under the terms of the Creative Commons Attribution License (CC BY). The use, distribution or reproduction in other forums is permitted, provided the original author(s) and the copyright owner(s) are credited and that the original publication in this journal is cited, in accordance with accepted academic practice. No use, distribution or reproduction is permitted which does not comply with these terms.
*Correspondence: Jingsen Zhou, cqdkyzjs@163.com