Hydrochemical Characteristics and Groundwater Quality Assessment Using an Integrated Approach of the PCA, SOM, and Fuzzy c-Means Clustering: A Case Study in the Northern Sichuan Basin
 Rongwen Yao
 Yuting Yan
 Changli Wei2
  Yong Xiao
 Yunhui Zhang
- 1Faculty of Geosciences and Environmental Engineering, Southwest Jiaotong University, Chengdu, China
- 2Sichuan Institute of Geological Survey, Chengdu, China
- 3Yibin Research Institute, Southwest Jiaotong University, Yibin, China
Groundwater is a precious resource that is vital for human life. Widespread human activities occur in the Sichuan basin due to befitting climate and geological conditions, inducing a series of groundwater contamination. In this article, hydrochemical analysis, principal component analysis (PCA), self-organizing map (SOM), and fuzzy c-means clustering (FCM) were integrated to reveal the hydrochemical process and assess groundwater quality in the northern part of the Sichuan Basin based on a collection of 203 groundwater samples. The groundwater hydrochemical types were dominated by the HCO3-Ca type. The PCA results show both natural and anthropogenic factors contributed to the hydrochemical compositions. The combination of the SOM and FCM classifies neurons into two categories: the first category where NO2− and NH4+ are most similar, perhaps as anthropogenic sources of pollution, which pose serious threats to human health; and the second category, where the total dissolved solids, Ca2+, Na+, Cl−, SO42, Mg2+, and K+ are most similar, explained as the influence of natural factors. The ion source was determined by water–rock interactions: Na+ mainly comes from the dissolution of silicate rocks, while Ca2+, Mg2+, and HCO3− from the dissolution of calcite and dolomite. Cation exchange was recognized in the water–rock interactions. The achievements would provide a significant reference for groundwater protection in the Sichuan Basin.
Introduction
Water is the basic and significant resource for human survival and development (Li, 2020). As an important constituent of water resource, groundwater has the advantages of stable quantity and good quality and is thus the main source of drinking water worldwide (Xiao et al., 2022). However, with changes in the global natural environment and the intensification of human activities, water resources on earth have undergone profound changes. Meanwhile, the contradiction between water supply and demand has become increasingly prominent, with water shortages and water quality deteriorations becoming a global problem. The study of the hydrochemical evolution not only accurately determines the quality of the groundwater environment and the degree of pollution but also provides a scientific basis for the rational use of water resource and promotes the harmonious coexistence between human and nature by identifying the effects of natural and anthropogenic actions on groundwater quality (Li et al., 2021c; Xiao et al., 2021a; Xiao et al., 2021b).
A traditional study on the regional groundwater environment was carried out by multivariate statistical analysis (Piña et al., 2018; Zhang et al., 2018; Barzegar et al., 2020). The cluster analysis that is used to distinguish the categories of groundwater samples and the principal component analysis (PCA) are helpful in investigating the processes determining the hydrochemical compositions of different categories. The combination of cluster analysis and principal component analysis was used to reveal the formation mechanism of groundwater (Tziritis et al., 2017; Zhang et al., 2018). However, due to the complexity and numerosity of the regional hydrochemical data, multivariate statistical analysis is not suitable for verifying such complicated hydrochemical evolution. Recently, artificial intelligence (AI) has been employed in research on the geo-environment (He et al., 2017; Li et al., 2021a; Li et al., 2021b; Li et al., 2022; Cui et al., 2021; Zhou et al., 2021). Especially, the AI approach had been successfully applied in the evaluation and prediction of groundwater quality recently, namely random forest, extreme gradient boosting, artificial neural network, etc. The AI approach has the advantage of analyzing large amounts of hydrochemical data and has such an accurate prediction of groundwater quality. The AI and neural networks have been proved to be efficient for analyzing high dimensional data, such as the self-organizing map (SOM) and fuzzy c-means clustering. The SOM analysis has been successfully employed in the assessment of groundwater quality (Mao et al., 2021; Qu et al., 2021; Yu et al., 2021). Fuzzy c-means clustering (FCM) incorporates the essence of the fuzzy theory. Compared with the hard clustering of k-means, the FCM provides more flexible clustering results (Mohamed et al., 2019a; Lee et al., 2019; Benjumea et al., 2021). The combination of the SOM and fuzzy c-means clustering is particularly helpful in dealing with complicated hydrochemical data (Lee et al., 2019). Therefore, the SOM neurons grouped by the FCM algorithm provide more robust results.
The Sichuan Basin is an area where urbanization and agriculture are well and extensively developed. Since groundwater pollution has been reported recently, research in the local areas had been carried out, especially in the Chengdu Plain (Mohamed et al., 2019b; Yuan et al., 2018; Zhang et al., 2019a; Zhang et al., 2020; Zhang et al., 2021a; Zhang et al., 2021b; Zhang et al., 2021c). However, the groundwater resource in the Sichuan Basin had been seldom studied at a regional scale. Therefore, the aim of this study is to 1) investigate the general hydrochemical characteristics of the groundwater resource in the Sichuan Basin, 2) classify the groundwater samples by grouping the neurons using fuzzy c-means, and 3) constrain the controlling factors for hydrochemical compositions. Our achievements are expected to promote a better management policy of the groundwater resource in the Sichuan Basin.
Study Area
The Sichuan Basin is one of the four major basins in China and is located in the southwest of China. It includes the central-eastern part of the Sichuan Province and most of the Chongqing city, with a basin area of about 20 × 104 km2. The Sichuan Basin is surrounded by mountains on all sides, and the general trend of the internal terrain is higher in the north and west than in the south and east, with an elevation of about 300–500 m (Jiao et al., 2022). The Sichuan Basin has a humid subtropical southeast monsoon climate, with an average annual temperature of 16–18°C and precipitation of ∼1,000 mm. Most of the rainfall is concentrated in June and September. The rivers in the Sichuan Basin are all a part of the Yangtze River system, with the Jinsha River entering from the south of the basin and passing through the Yibin city before being called the Yangtze River.
Tectonically, the Sichuan Basin is located in the eastern margin of the Tibet Plateau (Liu et al., 2021; Zhang et al., 2019b; Zhang et al., 2019c). The strata of the Sichuan Basin are characterized by its complete stratigraphic system and large thickness in the longitudinal direction, as well as multiple layers and gyres in the process of deposition (Liu et al., 2021). The Proterozoic and Paleozoic strata are exposed at the edge of the basin and the magmatic rocks distributed around the Longmen Mountain and Micang Mountain. A few Paleozoic strata are exposed at the core of the Huaying Mountain anticline. The Mesozoic strata are widely distributed throughout the Sichuan Basin, while the Neogene strata are mainly exposed in the Chengdu Plain. The basement of the Sichuan Basin is composed of Precambrian metamorphic strata. The sedimentary cover of the basin is mainly composed of marine and terrestrial strata: marine strata of about 4,000–7,000 m thickness developed in the Middle Triassic; terrestrial sedimentary strata of about 2,000–6,000 m thickness developed in the Upper Triassic. Nowadays, the whole basin is covered by a huge thick Jurassic red layer. The stratigraphy in the area is mainly Jurassic red rocks deposited in the terrestrial phase (Zhang et al., 2022), consisting of siltstone, sandy mudstone, fine-grained sandstone interlayer, and lower gypsum masses, with a thickness of about 621–923 m. It is mainly developed in the shallow weathering zone, with fracture developed in the weathering zone. The aquifer is mainly a loose accumulation of weathering crust, sandstone, mudstone, or sand mudstone interlayer, and mudstone interlayer or interlayer with less developed joints.
The aquifer thickness is not large in the Sichuan Basin (Zhang et al., 2020; Zhang et al., 2021a; Zhang et al., 2021b; Zhang et al., 2021c). The groundwater depth is shallow. Spring flows range from 0.05 to 5 L/s. The groundwater dynamics such as recharge, runoff, and discharge are greatly influenced by rainfall and geomorphological conditions. According to the hydrogeological data and field investigation, the source of groundwater recharge in this region is mainly the vertical recharge infiltration of atmospheric precipitation. At the top of the mountains or slopes with high altitude, atmospheric precipitation recharges the fractured aquifer through the weathered pore or fracture channels. While at the half-slope and valley bottom, groundwater recharge is mainly from the infiltration of paddy field and ditch water. Due to the extensive distribution of groundwater in the red-layer-area aquifer, shallow burial, and controlled by the spatial and temporal changes of precipitation and the influence of topography and geomorphology, it often has the characteristics of local recharge and nearby drainage. The system of groundwater recharge, runoff, and discharge is usually relatively independent in the red-layer mountains or hills. The Sichuan Basin, with good natural conditions and a warm-humid climate, has developed in agriculture. Industrial and municipal activities are majorly located in the Chengdu plain.
Methodology
Sampling and Experiment
In this study, 203 groundwater samples were collected from 168 domestic tube wells and public water-supply wells (depths <100 m) (Figure 1) in the northern Sichuan basin during 2015–2016. The sampling was carried out by an electric submersion pump after half an hour of pumping. Each groundwater sample was bottled after a three-time rinsing by sampling water. The physicochemical parameters measured in this study include pH, total dissolved solids (TDSs), total hardness, anions, and cations. The pH and TDS were measured in the field by a portable device (WTW Multi 3400i). The concentrations of anions and cations were analyzed by ion chromatography (IC6100; Wayee, China) and an atomic absorption spectrophotometer (AA6100; Techcomp, China) in the Southwest Jiaotong University. First, the Al and Fe ions below the detection line were excluded, and the test of charge balance of groundwater samples was performed using Eq. 1, where each ion was calculated in milliequivalents per liter, and the limit was taken as 5%. After the test, the charge balance of the 203 groundwater samples was all within the 5% limit, which could ensure the accuracy of the calculation results.
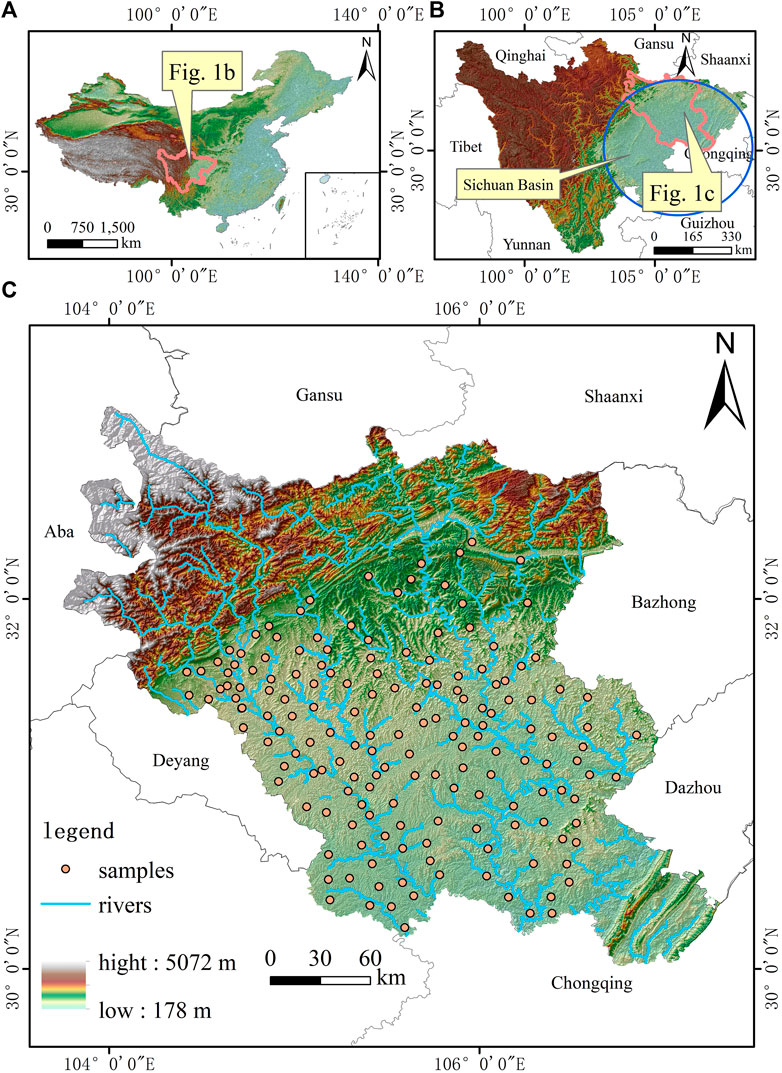
FIGURE 1. (A) Location of Sichuan Province in China, (B) Location of the study area in Sichuan, (C) Sample points on the study area.
Fuzzy c-Means Clustering
Fuzzy c-means clustering (FCM) is a soft clustering algorithm. Hierarchical clustering (HCA), K-means clustering algorithm (K-means), and other clustering algorithms belong to hard clustering algorithms, which are either subordinate to 0 or 1 when clustering. By contrast, the FCM is a soft clustering, which is subordinate to [0, 1] interval when clustering. When clustering, one may encounter clusters that do not have obvious clustering characteristics and may be right or wrong if hard clustering is done. Soft clustering, on the other hand, assigns a weight that specifies the degree to which an object belongs to that cluster, and thus FCM performs better in terms of clustering effectiveness and accuracy than hard clustering algorithms. In this study, fuzzy c-means, a tripartite library for Python software, was used to carry out the clustering of groundwater samples.
Principle Components Analysis
The principal component analysis (PCA) is a multivariate statistical method first introduced by Pearson (1901) and generalized by Hoteling (1933) for analyzing and simplifying data sets. Water chemistry data are numerous, and the related indicators are cumbersome. Hence, the analysis of a single indicator is difficult for obtaining reliable information. The PCA conducted by the SPSS software is efficient in analyzing the correlation among different indicators and combining indicators with certain relationships into linearly independent composite indicators. It can reduce indicators, achieve dimensionality reduction, and identify the sources of contaminants in groundwater (Sudheer Kumar et al., 2017; Zhang et al., 2016). However, its analysis dimension is single and cannot reflect the source characteristics and spatial distribution characteristics of pollutants well. The calculation steps of the PCA are shown as follows:
1) Normalize the data matrix Xm×n to the matrix Y = (Y1, …, Yn);
2) Calculate the covariance matrix Z according to Eq. 2:
3) Calculate the eigenvalues and eigenvectors of the covariance matrix Z. The cumulative percentages of the eigenvalues indicate their contribution to the principal components, and the eigenvectors present the loadings. The eigenvectors are multiplied with the original matrix to obtain the principal component scores.
Self-Organizing Map
The self-organizing map (SOM) proposed by Kohonen (1982) is an unsupervised neural network algorithm and a clustering algorithm that can analyze a large amount of nonlinear data. It can reduce data latitude and display neuro-structure. It has a significant advantage in analyzing complex classifications. The SOM, like PCA, can be used to reduce the dimensionality of the data and maintain the characteristics of the data to the maximum extent. Hence, it is suitable for spatial and temporal groundwater correlation analysis.
In this article, we use the Python tripartite library MiniSom for the calculation of SOM, and the steps are as follows:
1) Normalize the data matrix X.
2) Set the number of neurons, learning rate, initialization parameters, etc.
3) Set the number of iterations and start training.
4) Plot the U-matrix and the mapping of each index according to the training results.
Results and Discussion
General Characteristics of Hydrochemistry
The descriptive statistics of 203 data is shown in Table 1, where the mean, standard deviation, and minimum and maximum values of the water chemistry indicators are listed. The violin plot (Figure 2) is used to show the distribution state and probability density of the data, which combines the kernel density plot and the box line plot. The interior of the violin plot is a box plot, including the maximum value, mean, standard deviation, median, upper quartile, and lower quartile. The exterior of the violin plot is a kernel density plot, where the larger the area in a certain part, the more the data are distributed. The pH distribution mostly lies between 7 and 7.8. Except for one water sample with a TDS greater than 1,000 mg/L, all other water samples had a TDS of less than 1,000 mg/L. The Na+ concentration ranged from 8.0 to 121.0 mg/L, with a mean value of 30.5 mg/L. The K+ concentration ranged from 0.4 to 46.0 mg/L, with a mean value of 2.9 mg/L. The Ca2+ concentration ranged from 20.0 to 314.6 mg/L with a mean value of 108.62 mg/L. The Mg2+ concentration was distributed between 3.6 and 86.3 mg/L with a mean value of 26.9 mg/L. The Cl− concentration had a range of 3.5–209.9 mg/L with a mean value of 31.2 mg/L. The HCO3− concentration was distributed between 115.9 and 585.8 mg/L with a mean value of 364.7 mg/L. The SO42− concentration ranged from 9.6 to 760.0 mg/L with a mean value of 81.6 mg/L. The F− concentration was distributed between 0.0 and 7.2 mg/L, with an average value of 0.3 mg/L. The NO3− concentration ranged from 0.04 to 244.00 mg/L, with an average value of 41.22 mg/L, which is twice the limit value of 20 mg/L for Class III water of the groundwater quality standard (GB/T 14848-2017). The NO2− concentration was 0.0–13.9 mg/L with a mean value of 0.12 mg/L. The NH4+ concentration was 0.01–19.30 mg/L with a mean value of 0.30 mg/L.
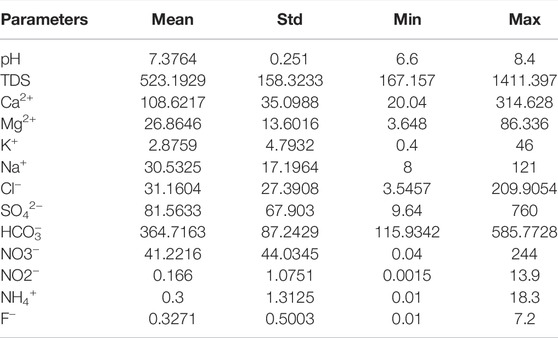
TABLE 1. Statistical results of hydrochemical parameters (unit: mg/L, except for pH)
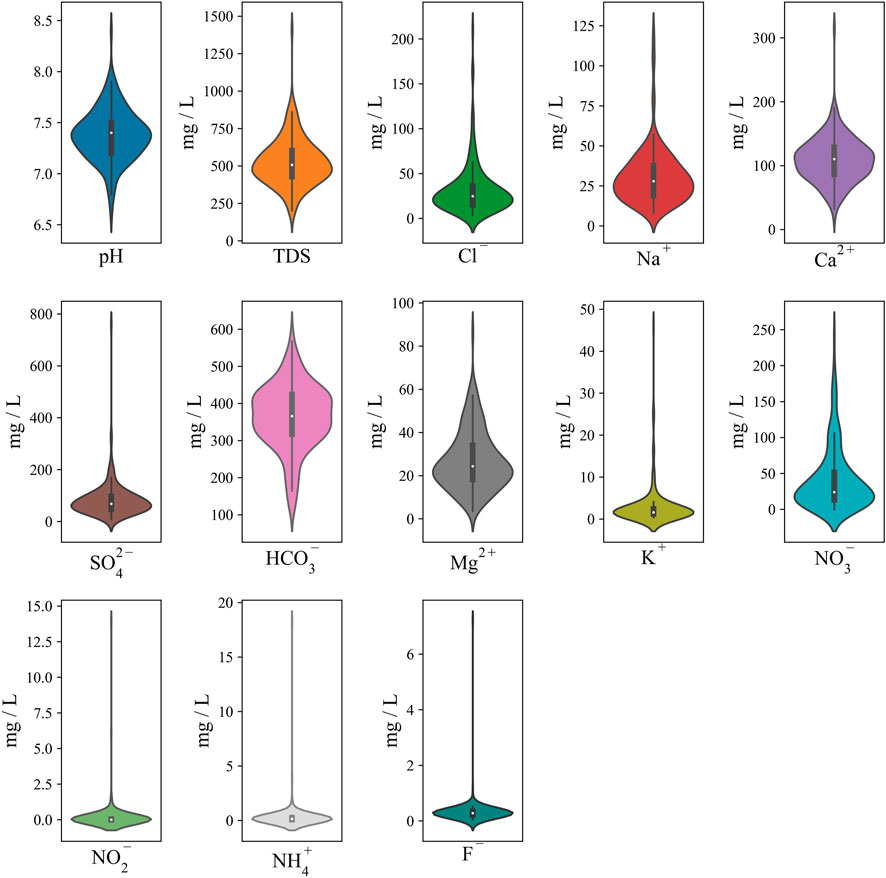
FIGURE 2. Violin plot of hydrochemical parameters (pH, TDS, anions, and cations).
Classification for Hydrochemical Type
The partition coefficient (partition coefficient) was selected as an indicator for determining the optimal number of clusters in FCM clustering, which has an interval of [0, 1], and the larger the value, the better the clustering effect. The optimal number of clusters was determined as 2 according to Figure 5B. The FCM was calculated using Python’s three-way library fuzzy c-means to cluster the water samples into two groups.
Piper trilinear diagrams were used to determine the types of groundwater chemistry controlled by major cations and anions (Piper, 1944). The Piper trilinear diagrams reflect the relative content of the major ions in groundwater and the general water chemistry characteristics. In this study, the hydrochemical type of groundwater was dominated by the HCO3-Ca type (Figure 3), which is mainly formed by the interaction between carbonate rocks and groundwater. The two types of FCM results are plotted in the Piper diagram, as shown in Figure 3. The first type of blue dots shows that the water chemistry type is mainly HCO3-Ca, and the main anions and cations are HCO3− and Ca2+, with some Mg2+ and SO42−, which are presumed to be mainly from limestone and dolomite. The second type of green dots shows that the water chemistry type is also dominated by the HCO3-Ca type, with some Mg2+, SO42−, Cl−, and Na+. Compared with the first category, Cl− concentration increases, and the rocks from the water–rock interaction in the second category of water samples are mainly limestone and dolomite.
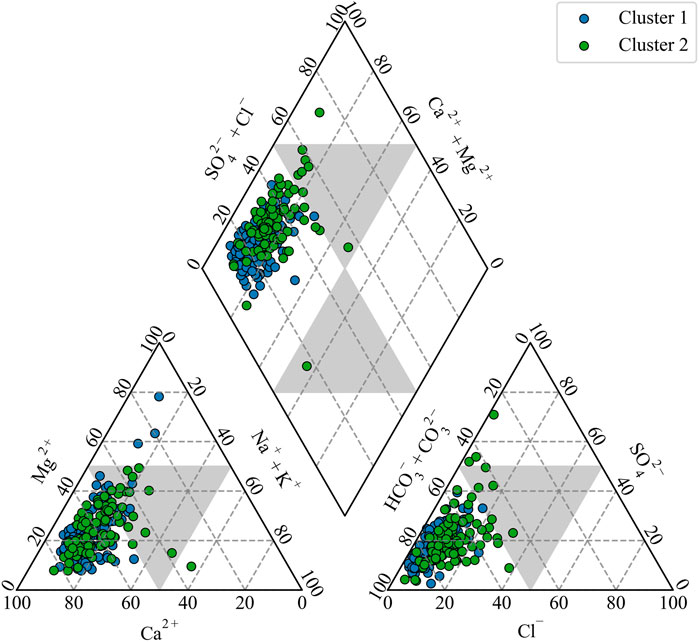
FIGURE 3. Piper plot of the groundwater samples. The points are divided into two clusters by FCM: the blue points are the first cluster and the red points are the second one.
Principal Component Analysis Results
The results of the two categories obtained from the FCM clustering were analyzed separately by the principal component analysis (Figure 4), and based on eigenvalues greater than 1, two principal components were selected for the first category of water samples (Figure 4A), contributing 51.29% of the variance cumulatively, and seven principal components were selected for the second category of water samples (Figure 4B), contributing 90.4% of the variance cumulatively.
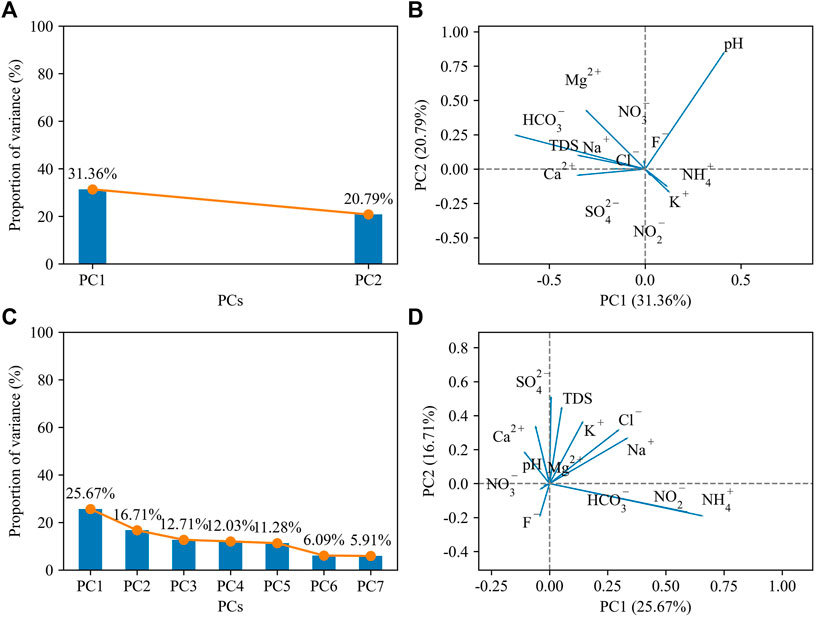
FIGURE 4. The results of the PCA. (A) The accumulated variance of the two principal components. (B) The biplot of cluster 1. (C) The accumulated variance of the seven principal components. (D) The biplot of cluster 2.
In the biplot (Figure 4B) of the first category of water samples, the contribution to the first principal component is dominated by HCO3−, and the second principal component has the largest contribution of pH value. The first principal component is related to the dissolution of carbonate rocks. HCO3− reveals such a water–rock interaction, and the change of HCO3− in groundwater causes the change of the pH value. Also, the influence of human activities can lead to changes in the pH of groundwater (Li et al., 2019). In the biplot of the second type of water samples (Figure 4D), the first principal component is dominated by NO2− and NH4+, which are defined as anthropogenic factors. Human activities caused an increase in the nitrogen content of groundwater, which led to the deterioration of groundwater quality. In particular, NO2− is toxic and poses a serious threat to human health. Six of the seven major ions, Ca2+, Na+, Cl−, SO42−, HCO3−, and Mg2+, contribute more to the second principal component and have a high correlation with TDS, which can be defined as a natural factor, that is, related to rock-forming minerals and water–rock interactions. The results of the above two types of water samples show that the factors affecting the water quality are both anthropogenic and natural factors.
Self-Organizing Map and Fuzzy c-Means Clustering Results
The selection of neurons in the SOM was suggested to be 5
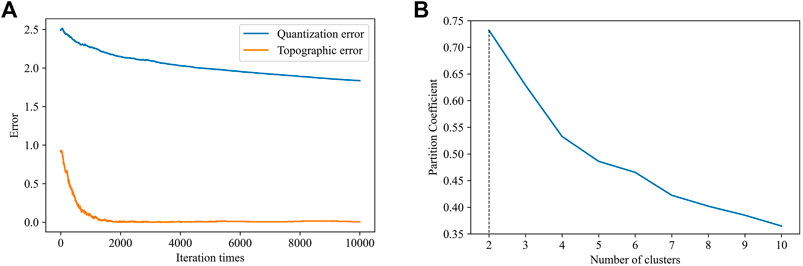
FIGURE 5. The train result of the SOM and the optimal cluster number of the FCM. (A) The quantization error and topographic error of the SOM with the iteration times. (B) The best cluster value of the FCM.
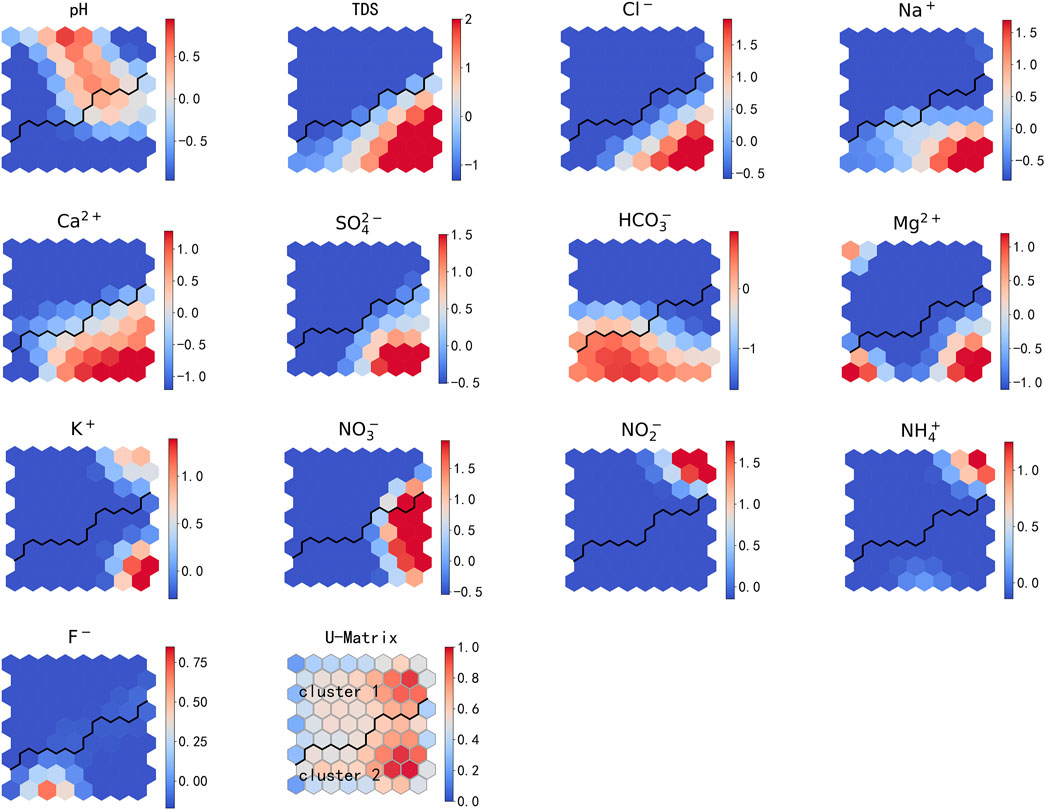
FIGURE 6. Visualization of the SOM. The first 11 graphs show the indicators. The last graph displays the U-matrix.
In the mapping diagram of each ion, NO2− is most similar to NH4+ in the first category, indicating a high correlation and having the same source, perhaps originating from human pollution sources. Nitrate in groundwater may come from excessive fertilizer application, domestic sewage, livestock manure, and industrial effluent, especially the presence of nitrite, which is a serious threat to human health. The highest similarity of the TDS, Ca2+, Na+, Cl−, SO42−, Mg2+, and K+ was found in the second category, indicating a high correlation of these ions. In addition to F− and HCO3− in the second category, their correlation with these seven indicators was low. The second category can be explained by natural factors, and the second category is mainly divided into seven ions that contribute most of the TDS. The natural source of these ions is due to the water–rock interactions.
Interpretation for Ion Source
The Gibbs diagram was used to analyze the evolutionary trends of surface water and groundwater (Gibbs, 1970). Based on the Gibbs diagram (Figure 7), it was basically determined that the groundwater chemistry is dominated by the water–rock interaction in this study.
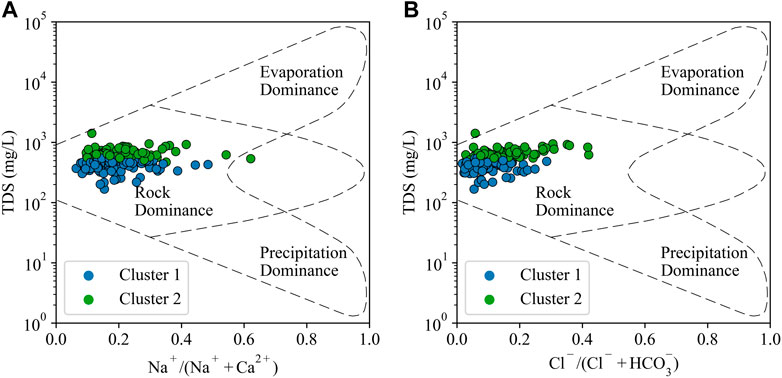
FIGURE 7. Gibbs diagrams demonstrating the mechanisms governing groundwater chemistry. (A) TDS vs. Na+/(Na++Ca2+), (B) TDS vs. Cl−/(Cl− + HCO3−).
The correlation plots of the seven ions are a powerful tool in the analysis of the water–rock interactions. In this article, we identify the main minerals of the water–rock interaction by plotting correlation diagrams, which have been verified with the results of the Piper diagram, PCA, and SOM. In Figure 8A, if the dissolved minerals are dominated by halite, the scatter should be distributed according to the y = x straight line. But, most of the scatters are located below the y = x straight line, and the content of Na+ is larger than that of Cl−, indicating that the weathering dissolution of the silicate minerals is the main source of Na+, and although it is involved, it is relatively small. Similarly, in Figure 8B, if the dissolved minerals are dominated by gypsum, the scatter should also be distributed according to y = x. However, most of the scatter is distributed below the y = x straight line, and the content of Ca2+ is greater than that of SO42−, indicating that the dissolution of carbonate rocks is predominant. Combined with Figure 8C, the scatter points are located in the middle of y = x and y = 2x, indicating that the main source of carbonate rock dissolution is calcite.
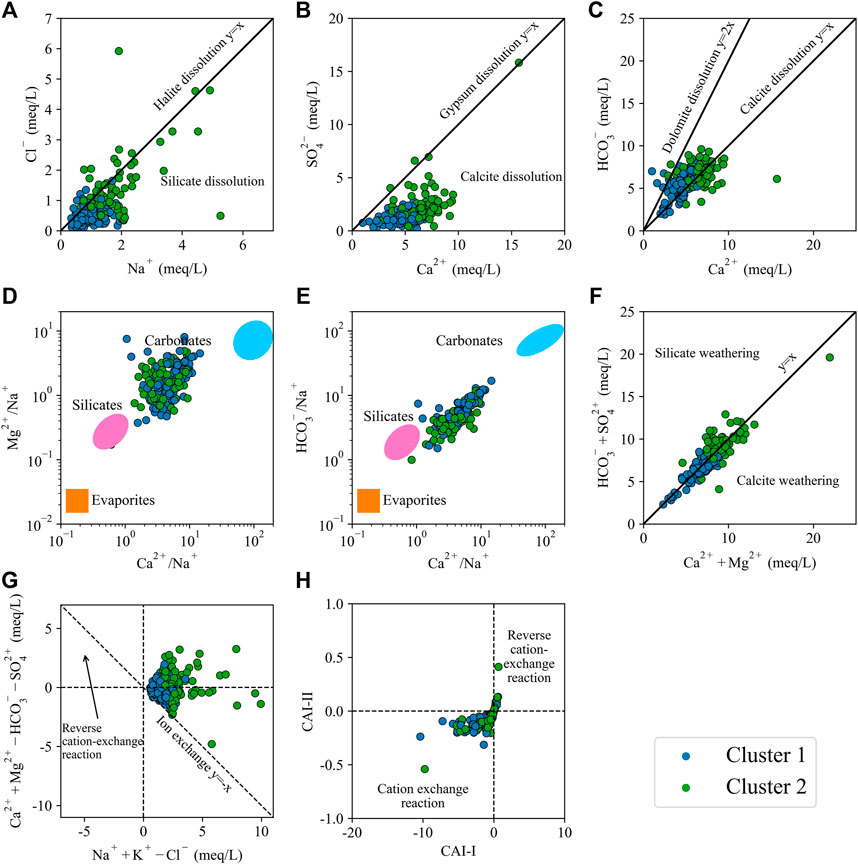
FIGURE 8. Correlation graph of ions. (A) Cl− vs. Na+. (B) SO42− vs. Ca2+. (C) HCO3− vs. Ca2+. (D) Mg2+/Na+ vs. Ca2+/Na+. (E) HCO3−/Na+ vs. Ca2+/Na+. (F) HCO3− + SO42− vs. Ca2+ + Mg2+. (G) [(Ca2+ + Mg2+ − HCO3− − SO42−) vs. (Na+ + K+ − Cl−)]. (H) CAI-II [(Cl− − Na+ K+)/(HCO3− + CO2−3 + SO42− + NO−3)] vs. CAI-I [(Cl− − Na+ − K+)/(Cl−)].
Gaillardet et al. (1999) plotted the log-off scatter plots of Mg2+/Na+, HCO3−/Na+, and Ca2+/Na+ for determining which of the silicate, evaporite, and carbonate rocks is the source of the water chemistry. The distribution of the scatter points in Figure 8F along y = x demonstrates the presence of significant cation exchange during the water–rock interaction. The sample plotting of Figures 8G, H both indicate the cation exchange process. The concentrations of Na+, Cl−, SO42−, Ca2+, and HCO3− in the second category of water samples are significantly larger than those in the first category. The second category of water samples in Figure 8G is scattered and not linear, and thus the cation exchange effect is weaker than that in the first category.
The saturation indices of calcite, dolomite, gypsum, and halite were calculated by PHREEQC. And the correlation between the saturation indices and TDS was plotted (Figures 9A,B). In the plots, halite and gypsum were not saturated in both types of water samples, and only calcite and dolomite were distributed near the zero scale line and reached saturation, revealing the dissolution of calcite and dolomite. This is consistent with the results of Piper’s trilinear plot.

FIGURE 9. Saturation index of calcite, dolomite, gypsum, and halite. (A) Cluster 1. (B) Cluster 2.
In summary, the water–rock interaction is the main factor determining the ion source in the study area. Ion correlation and saturation indices indicate that the water–rock interaction is dominated by the dissolution of calcite and dolomite with cation exchange.
Conclusion
In this article, the hydrogeochemical analysis of 203 groundwater samples from the northern part of the Sichuan Basin was carried out using the PCA, SOM, and FCM, and the main conclusions are summarized as follows:
1) The results of the first five principal components in the PCA indicate that there are both natural and anthropogenic influences on groundwater. For natural factors, it is expressed by TDS synthesis; for anthropogenic factors, it is expressed by NO2− and NH4+.
2) The combination of the SOM and FCM classifies neurons into two categories: the first category in which NO2− and NH4+ are the most similar, perhaps as anthropogenic sources of pollution, which pose serious threats to human health. In the second category, the TDS, Ca2+, Na+, Cl−, SO42, Mg2+, and K+ are the most similar, explained as the influence of natural factors, well consistent with the results derived from the PCA.
3) The hydrochemical types in the northern Sichuan Basin are dominated by the HCO3-Ca types. The groundwater evolution in the northern Sichuan Basin is mainly the water–rock interaction, Na+ mainly comes from the dissolution of silicate rocks, and Ca2+, Mg2+, and HCO3− from the dissolution of calcite and dolomite. There is an obvious cation exchange during the water–rock interaction.
4) Future research is proposed to concentrate on the management of NO3− contamination of groundwater in the Sichuan Basin. The measurements of source control and pollution remediation should be carried out to resolve the groundwater pollution.
Data Availability Statement
The original contributions presented in the study are included in the article/Supplementary Material; further inquiries can be directed to the corresponding author.
Author Contributions
RY: formal analysis and writing—original draft. YY: data curation, methodology, and formal analysis. CW: data curation, writing—review, and editing. ML: data curation. YX: writing—review and editing. YZ: conceptualization and writing—review and editing.
Funding
This study was financially supported by the National Natural Science Foundation of China (No. 42072313), the Natural Science Foundation of Chongqing (No. cstc2021jcyj-msxmX1137), the postdoctoral foundation of Sichuan Provincial and the Student Research Training Program of Southwest Jiaotong University (No. 202010613072).
Conflict of Interest
The authors declare that the research was conducted in the absence of any commercial or financial relationships that could be construed as a potential conflict of interest.
Publisher’s Note
All claims expressed in this article are solely those of the authors and do not necessarily represent those of their affiliated organizations, or those of the publisher, the editors, and the reviewers. Any product that may be evaluated in this article, or claim that may be made by its manufacturer, is not guaranteed or endorsed by the publisher.
References
Barzegar, R., Asghari Moghaddam, A., Tziritis, E., Adamowski, J., Bou Nassar, J., Noori, M., et al. (2020). Exploring the Hydrogeochemical Evolution of Cold and Thermal Waters in the Sarein-Nir Area, Iran Using Stable Isotopes (δ18O and δD), Geothermometry and Multivariate Statistical Approaches. Geothermics 85, 101815. doi:10.1016/j.geothermics.2020.101815
Benjumea, B., Gabàs, A., Macau, A., Ledo, J., Bellmunt, F., Figueras, S., et al. (2021). Undercover Karst Imaging Using a Fuzzy C-Means Data Clustering Approach (Costa Brava, NE Spain). Eng. Geol. 293, 106327. doi:10.1016/j.enggeo.2021.106327
Cui, S., Pei, X., Jiang, Y., Wang, G., Fan, X., Yang, Q., et al. (2021). Liquefaction within a Bedding Fault: Understanding the Initiation and Movement of the Daguangbao Landslide Triggered by the 2008 Wenchuan Earthquake (Ms = 8.0). Eng. Geol. 295, 106455. doi:10.1016/j.enggeo.2021.106455
Gaillardet, J., Dupré, B., Louvat, P., and Allègre, C. J. (1999). Global Silicate Weathering and CO2 Consumption Rates Deduced from the Chemistry of Large Rivers. Chem. Geol. 159, 3–30. doi:10.1016/s0009-2541(99)00031-5
Gibbs, R. J. (1970). Mechanisms Controlling World Water Chemistry. Science 170, 1088–1090. doi:10.1126/science.170.3962.1088
He, Y., and Kusiak, A. (2017). Performance Assessment of Wind Turbines: Data-Derived Quantitative Metrics. IEEE Trans. Sustain. Energy 9 (1), 65–73.
Hotelling, H. (1933). Analysis of a Complex of Statistical Variables into Principal Components. J. Educ. Psychol. 24, 498–520. doi:10.1037/h0070888
Jiao, R., Fox, M., and Yang, R. (2022). Late Cenozoic Erosion Pattern of the Eastern Margin of the Sichuan Basin: Implications for the Drainage Evolution of the Yangtze River. Geomorphology 398, 108025. doi:10.1016/j.geomorph.2021.108025
Kohonen, T. (1982). Self-organized Formation of Topologically Correct Feature Maps. Biol. Cybern. 43, 59–69. doi:10.1007/bf00337288
Lee, K.-J., Yun, S.-T., Yu, S., Kim, K.-H., Lee, J.-H., and Lee, S.-H. (2019). The Combined Use of Self-Organizing Map Technique and Fuzzy C-Means Clustering to Evaluate Urban Groundwater Quality in Seoul Metropolitan City, South Korea. J. Hydrology 569, 685–697. doi:10.1016/j.jhydrol.2018.12.031
Li, H., Deng, J., Feng, P., Pu, C., Arachchige, D. D. K., and Cheng, Q. (2021a). Short-Term Nacelle Orientation Forecasting Using Bilinear Transformation and ICEEMDAN Framework. Front. Energy Res. 9, 780928. doi:10.3389/fenrg.2021.780928
Li, H., Deng, J., Yuan, S., Feng, P., and Arachchige, D. D. K. (2021b). Monitoring and Identifying Wind Turbine Generator Bearing Faults Using Deep Belief Network and EWMA Control Charts. Front. Energy Res. 9, 799039. doi:10.3389/fenrg.2021.799039
Li, H., He, Y., Xu, Q., Deng, j., Li, W., and Wei, Y. (2022). Detection and Segmentation of Loess Landslides via Satellite Images: a Two-phase Framework. Landslides 19, 673–686. doi:10.1007/s10346-021-01789-0
Li, P., He, X., and Guo, W. (2019). Spatial Groundwater Quality and Potential Health Risks Due to Nitrate Ingestion through Drinking Water: A Case Study in Yan'an City on the Loess Plateau of Northwest China. Hum. Ecol. Risk Assess. Int. J. 25, 11–31. doi:10.1080/10807039.2018.1553612
Li, X., Huang, X., and Zhang, Y. Spatio-temporal Analysis of Groundwater Chemistry, Quality and Potential Human Health Risks in the Pinggu Basin of North China Plain: Evidence from High-Resolution Monitoring Dataset of 2015–2017. Sci. Total Environ. 2021c, 800: 149568.doi:10.1016/j.scitotenv.2021.149568
Liu, S., Yang, Y., Deng, B., Zhong, Y., Wen, L., Sun, W., et al. (2021). Tectonic Evolution of the Sichuan Basin, Southwest China. Earth-Science Rev. 213, 103470. doi:10.1016/j.earscirev.2020.103470
Mao, H., Wang, G., Rao, Z., Liao, F., Shi, Z., Huang, X., et al. (2021). Deciphering Spatial Pattern of Groundwater Chemistry and Nitrogen Pollution in Poyang Lake Basin (Eastern China) Using Self-Organizing Map and Multivariate Statistics. J. Clean. Prod. 329, 129697. doi:10.1016/j.jclepro.2021.129697
Mohamed, A., Dan, L., Kai, S., Mohamed, M., Aldaw, E., and Elubid, B. (2019a). Hydrochemical Analysis and Fuzzy Logic Method for Evaluation of Groundwater Quality in the North Chengdu Plain, China. Ijerph 16, 302–322. doi:10.3390/ijerph16030302
Mohamed, A. K., Dan, L., Kai, S., Mohamed, M. A. A., Aldaw, E., and Elubid, B. A. (2019b). Hydrochemical Analysis and Fuzzy Logic Method for Evaluation of Groundwater Quality in the North Chengdu Plain, China. Int. J. Environ. Res. Public Health 16. doi:10.3390/ijerph16030302
Pearson, K. (1901). LIII. On Lines and Planes of Closest Fit to Systems of Points in Space. Lond. Edinb. Dublin Philosophical Mag. J. Sci. 2, 559–572. doi:10.1080/14786440109462720
Piña, A., Donado, L. D., Blake, S., and Cramer, T. (2018). Compositional Multivariate Statistical Analysis of the Hydrogeochemical Processes in a Fractured Massif: La Línea Tunnel Project, Colombia. Appl. Geochem. 95, 1–18. doi:10.1016/j.apgeochem.2018.05.012
Piper, A. M. (1944). A Graphic Procedure in the Geochemical Interpretation of Water-Analyses. Trans. AGU 25, 914–928. doi:10.1029/tr025i006p00914
Qu, S., Shi, Z., Liang, X., Wang, G., and Han, J. (2021). Multiple Factors Control Groundwater Chemistry and Quality of Multi-Layer Groundwater System in Northwest China Coalfield - Using Self-Organizing Maps (SOM). J. Geochem. Explor. 227, 106795. doi:10.1016/j.gexplo.2021.106795
Sudheer Kumar, M., Dhakate, R., Yadagiri, G., and Srinivasa Reddy, K. (2017). Principal Component and Multivariate Statistical Approach for Evaluation of Hydrochemical Characterization of Fluoride-Rich Groundwater of Shaslar Vagu Watershed, Nalgonda District, India. Arabian J. Geosciences 10. doi:10.1007/s12517-017-2863-x
Tziritis, E. P., Datta, P. S., and Barzegar, R. (2017). Characterization and Assessment of Groundwater Resources in a Complex Hydrological Basin of Central Greece (Kopaida Basin) with the Joint Use of Hydrogeochemical Analysis, Multivariate Statistics and Stable Isotopes. Aquat. Geochem. doi:10.1007/s10498-017-9322-x
Xiao, Y., Liu, K., Hao, Q., Li, J., Zhang, Y., Cui, W., et al. (2021a). Hydrogeochemical Features and Genesis of Confined Groundwater and Health Perspectives for Sustainable Development in Urban Hengshui, North China Plain. J. Chem. 2021, 5578192. doi:10.1155/2021/5578192
Xiao, Y., Hao, Q., Zhang, Y., Zhu, Y., Yin, S., Qin, L., et al. (2022). Investigating Sources, Driving Forces and Potential Health Risks of Nitrate and Fluoride in Groundwater of a Typical Alluvial Fan Plain. Sci. Total Environ. 802, 149909. doi:10.1016/j.scitotenv.2021.149909
Xiao, Y., Liu, K., Yan, H., Zhou, B., Huang, X., Hao, Q., et al. (2021b). Hydrogeochemical Constraints on Groundwater Resource Sustainable Development in the Arid Golmud Alluvial Fan Plain on Tibetan Plateau. Environ. Earth Sci. 80, 750. doi:10.1007/s12665-021-10076-z
Yu, J., Tian, Y., Wang, X., and Zheng, C. (2021). Using Machine Learning to Reveal Spatiotemporal Complexity and Driving Forces of Water Quality Changes in Hong Kong Marine Water. J. Hydrology 603, 126841. doi:10.1016/j.jhydrol.2021.126841
Yuan, J., Xu, F., Deng, G., and Tang, Y. (2018). Using Stable Isotopes and Major Ions to Identify Hydrogeochemical Characteristics of Karst Groundwater in Xide Country, Sichuan Province. Carbonates Evaporites 33, 223–234. doi:10.1007/s13146-017-0333-x
Zhang, H., Xu, Y., Cheng, S., Li, Q., and Yu, H. (2020). Application of the Dual-Isotope Approach and Bayesian Isotope Mixing Model to Identify Nitrate in Groundwater of a Multiple Land-Use Area in Chengdu Plain, China. Sci. Total Environ. 717, 137134. doi:10.1016/j.scitotenv.2020.137134
Zhang, H., Yang, R., Wang, Y., and Ye, R. (2019a). The Evaluation and Prediction of Agriculture-Related Nitrate Contamination in Groundwater in Chengdu Plain, Southwestern China. Hydrogeol. J. 27, 785–799. doi:10.1007/s10040-018-1886-z
Zhang, L., Wang, Y., Cui, Y., Tian, N., Xie, X., Xie, A., et al. (2022). First Fossil Foliage Record in the Red Beds from the Upper Jurassic in the Sichuan Basin, Southern China. Geol. J. 57, 1628–1637. doi:10.1002/gj.4364
Zhang, X., Guo, Q., Liu, M., Luo, J., Yin, Z., Zhang, C., et al. (2016). Hydrogeochemical Processes Occurring in the Hydrothermal Systems of the Gonghe–Guide Basin, Northwestern China: Critical Insights from a Principal Components Analysis (PCA). Environ. Earth Sci. 75. doi:10.1007/s12665-016-5991-9
Zhang, Y., Cao, H., Hollis, S., Tang, L., Xu, M., Jiang, J., et al. (2019b). Geochronology, Geochemistry and Sr-Nd-Pb-Hf Isotopes of the Early Paleogene Gabbro and Granite from Central Lhasa, Southern Tibet: Petrogenesis and Tectonic Implications. Int. Geol. Rev., 1–27. doi:10.1080/00206814.2018.1476187
Zhang, Y., Li, X., Luo, M., Wei, C., Huang, X., Xiao, Y., et al. (2021c). Hydrochemistry and Entropy-Based Groundwater Quality Assessment in the Suining Area, Southwestern China. J. Chem. 2021, 5591892. doi:10.1155/2021/5591892
Zhang, Y.-h., Wang, Y.-s., Wang, W.-s., Liu, J., and Yuan, L.-l. (2019c). Zircon U-Pb-Hf Isotopes and Mineral Chemistry of Early Cretaceous Granodiorite in the Lunggar Iron Deposit in Central Lhasa, Tibet Y, China, J. Cent. South Univ. 26. 3457–3469. doi:10.1007/s11771-019-4266-5
Zhang, Y., Dai, Y., Wang, Y., Huang, X., Xiao, Y., and Pei, Q. (2021a). Hydrochemistry, Quality and Potential Health Risk Appraisal of Nitrate Enriched Groundwater in the Nanchong Area, Southwestern China. Sci. Total Environ. 784, 147186. doi:10.1016/j.scitotenv.2021.147186
Zhang, Y., He, Z., Tian, H., Huang, X., Zhang, Z., Liu, Y., et al. (2021b). Hydrochemistry Appraisal, Quality Assessment and Health Risk Evaluation of Shallow Groundwater in the Mianyang Area of Sichuan Basin, Southwestern China. Environ. Earth Sci. 80, 576. doi:10.1007/s12665-021-09894-y
Zhang, Y., Xu, M., Li, X., Qi, J., Zhang, Q., Guo, J., et al. (2018). Hydrochemical Characteristics and Multivariate Statistical Analysis of Natural Water System: A Case Study in Kangding County, Southwestern China. Water 10, 80–96. doi:10.3390/w10010080
Keywords: groundwater, principal component analysis, self-organizing map, fuzzy c-means clustering, Sichuan Basin
Citation: Yao R, Yan Y, Wei C, Luo M, Xiao Y and Zhang Y (2022) Hydrochemical Characteristics and Groundwater Quality Assessment Using an Integrated Approach of the PCA, SOM, and Fuzzy c-Means Clustering: A Case Study in the Northern Sichuan Basin. Front. Environ. Sci. 10:907872. doi: 10.3389/fenvs.2022.907872
Received: 30 March 2022; Accepted: 27 April 2022;
Published: 02 June 2022.
Edited by:
Huajin Li, Chengdu University, ChinaReviewed by:
Qili Hu, Chengdu University of Technology, ChinaXiangrui Meng, Sichuan University, China
Copyright © 2022 Yao, Yan, Wei, Luo, Xiao and Zhang. This is an open-access article distributed under the terms of the Creative Commons Attribution License (CC BY). The use, distribution or reproduction in other forums is permitted, provided the original author(s) and the copyright owner(s) are credited and that the original publication in this journal is cited, in accordance with accepted academic practice. No use, distribution or reproduction is permitted which does not comply with these terms.
*Correspondence: Yunhui Zhang, zhangyunhui@swjtu.edu.cn