How the driving behaviors and customer handling of public transportation operators have been impacted by the COVID-19 pandemic in Addis Ababa, Ethiopia: the perspective of protection motivation theory?
 Kassa Moges Tareke
- Urban Infrastructure, Transport Planning and Management, College of Urban Development and Engineering, Addis Ababa, Ethiopia
The COVID-19 pandemic has had an impact on every aspect of human life and economic sectors such as transportation operations around the world. This paper tries to investigate how COVID-19 pandemic factors influenced the driving and customer handling behaviors of urban public transportation operators in Addis Ababa city, Ethiopia. To that end, a framework of mixed research, pre/post study design, and protection motivation theory (PMT) was used to guide the development, quantification, and analysis of the causal relationships of pandemic-related constructs on driving and customer handling behaviors. The examined driving behavior variables included harsh speeding, harsh braking, and drink-drive events concerning the time period before and during the COVID-19 pandemic outbreak. Customer handling was also operationalized in terms of the level of friendly handling and care provided to customers. As a result, primary data were collected through transport surveys on 143 randomly selected public transit operators, including city buses, midsize buses, minibuses, bajajs, and light rail transits. Furthermore, contingency indexes, likert scales, and binary logistic regression models were used to estimate and predict the most significant factors that affected driving and customer handling behavior. Findings showed that the new COVID-19 pandemic and response measure-related factors were the most significant factors impacting driving behavior during the pandemic. Driving frequencies and intentions, as well as driving decisions or choices, were significantly influenced and reduced. Due to the pandemic-related factors, harsh driving behaviors such as harsh speeding and braking became more frequent during the pandemic compared to the pre-COVID period. Additionally, the correlation between harsh driving behavior and other factors, mainly trip distance traveled, driving during risky nighttime hours, and driving requests, was significant. Furthermore, due to the impacts of COVID-19, government measures, and changes in driving behavior, customer handling and care behaviors were predominantly unfriendly. Findings revealed that the performance of PMT was relevant, and it could inform and guide studies to understand such an impact analysis. Thus, policymakers must learn from the harsh lessons of COVID-19 and make bold investments in preparedness, prevention, and response, including pandemic-sensitive strategies and customer-oriented strategies.
1. Introduction
According to world health organization (WHO) coronavirus disease or COVID-19 is an infectious disease and global pandemic caused by newly discovered coronavirus. United Nations Development Program (UNDP) reported that COVID-19 was a global health crisis of our time and the greatest challenges we faced since the Second World War COVID-19 pandemic disease is also one of our current pressing issues that affect the social, economic, political situation all over the world (UNDP, 2020; WHO, 2020).
The COVID-19 pandemic has affected transportation operations and mobility patterns since December 2019 and will continue relentlessly for >2 years (Zhu et al., 2020; Tareke and Ashebir, 2023). Right from the beginning, many countries around the world imposed strict measures, such as lockdowns and the suspension of all non-essential movements, in order to reduce human activity, which contributes to the spread of the pandemic.
In this direction, existing literature seeks to explore the dynamics of the pandemic in several countries around the world to understand the impact that COVID-19 had on the transport sector (Sharif and Reza Khavarian-Garmsir, 2020). As expected, the restriction measures affected typical patterns of travel activities and mobility in urban regions across the world (Tirachini and Cats, 2020; Kim, 2021). It has been demonstrated that following the restrictive measures taken by governments to restrict the spread of the disease, an unprecedented decline in traffic volumes has been identified (Aletta et al., 2020; Katrakazas et al., 2020). For example, in the Netherlands, people reduced their outdoor activities due to the pandemic, leading to a decrease in the total number of trips and a reduction in distance traveled, with an increase in the proportion of people working from home (de Haas et al., 2020). Existing studies have also shown that there was a major change in the choice of transport mode, especially during the first pandemic wave, and consequently a change in the number of car-driven volumes was observed (Abdullah et al., 2020; Bucsky, 2020; Hale et al., 2020).
In the context of road safety, during the COVID-19 lockdown measures, the number of road collisions, injuries, and fatalities has significantly decreased, especially during the first lockdown period. This has been documented, for example, in Spanish province of Tarragona, where a sharp decrease in traffic crashes was revealed (Saladié et al., 2020). Similarly, Carter (2020) showed that during the first COVID−19 period, the total number of crashes in North Carolina decreased by half, fatalities decreased by 10%, and serious injuries increased by 6%, compared to the pre-closure baseline. Similar studies by Shilling and Waetjen (2020) showed that all injury and fatal traffic crashes decreased on state highways and rural roads in California. However, another study confirmed that the reduction in fatalities and injuries was disproportionate when taking into account the reduction in traffic volumes (Huang and Meng, 2019; Apple, 2020; Sekadakis et al., 2021).
Recent studies have indicated that driving behavior has also changed during the pandemic period. For example, a 6–11% increase in driving speed was observed, along with more frequent harsh accelerations and brakings per distance, during the first lockdown period in Greece and Saudi Arabia (Katrakazas et al., 2020, 2021; Michelaraki et al., 2021). However, very few studies used the PMT model to investigate driving and customer handling behaviors in greater depth, particularly in the context of urban transit operators in developing countries. For example, Tareke and Ashebir (2023) applied PMT model to explore the effects of the pandemic in Ethiopia but from the perspective of passengers' travel and mode choice behavior.
A study by Katrakazas et al. (2021) quantified the impact of the pandemic COVID-19 on driving behavior using SARIMA time series modeling in Greece. This study found that the observed values of three indicators of driving behavior, such as average speed, speeding, and harsh braking events per 100 km, were greater than the predicted values based on the corresponding observations before the first lockdown period.
However, the prior studies did not examine the impacts of COVID-19 pandemic on the public transportation operation, driving behavior and customer handling behavior changes particularly from the perspective of protection motivation theory (PMT) and developing countries. The impacts of the pandemic on the public transportation operation mainly on the operators' driving and customer care and treatment behaviors are still questionable in the developing countries. Further investigations are required to explore how and to what extent the driving and customer handling behaviors are impacted and changed during the pandemic using up-to-date and valid models.
In this direction, the current study aims to investigate the most significant COVID-19 pandemic related factors that have impacted the driving behavior and customer treatment by operators of public transportation modes in Addis Ababa, Ethiopia using PMT. Accordingly, it could assess the relationship between the COVID-19 pandemic related attributes (i.e., COVID-19 cases, fatalities and reproduction rate, vulnerability of modes, infection risk fears and associated motivations to protective measures) and driving and customer handling behavior of public transportation operators. For this purpose, relevant variables and data regarding pandemic-related constructs, driving and customer handling were exploited, quantified and analyzed based on PMT.
The examined driving behavior variables were harsh speeding, braking and drink-drive events concerning a time period before and during the pandemic in Addis Ababa, Ethiopia. This study is thus motivated to cover the knowledge and literature gap by giving insights on the basic pandemic-related constructs and how they influenced the driving and customer handling behavior of public transportation operators (including owner drivers, employed drivers and other crews) from the context of PMT and urban areas of developing nations.
A cross-pandemic outbreak comparison provided insights into how the variables and indicators varied across the examined conditions (i.e., a scenario of with and without pandemic outbreak and transport restrictions). It could also contribute to policy inputs so as to learn from the harsh lessons of COVID-19 and make bold investments in preparedness, prevention and response. For example, they devise more resilient and sustainable strategies that boost the public transportation market during the pandemic periods. In addition to the introduction, the structure of this paper is composed of literature review and materials and methods that described the overview of the dataset, the examined variables and analysis models. Then, the study findings and discussions are provided. Finally, the conclusions are presented along with recommendations for policy and further research.
2. Public transport and COVID-19 pandemic in Addis Ababa city, Ethiopia
Addis Ababa is the national capital city of Ethiopia. It holds about 527 square kilometers of area and is currently subdivided into 11 administrative sub-cities. It is one of the most rapidly urbanizing cities in Africa, mainly due to internal migration from rural areas. For example, the population in 2021 was 5,006,000, a 4.42% increase from 2020. Though a recent phenomenon, this internal migration is expected to increase significantly during the years to come due to the fact that Addis Ababa is not only a financial and political center but also a diplomatic capital. Accordingly, the city is burdened by about four basic transport-related multi-dimensional problems and challenges. Among these problems, the huge gap between transport demand and supply is the primary challenge. The other challenges include problems with road traffic safety, traffic congestion, and air pollution. Regarding the demand-supply gaps, the daily transport trip demand of the city is about 4.5 million, but only about 3.2 million can be supplied so far (Wubneh, 2013; Central Statistical Agency [Ethiopia] and ICF International, 2017).
World Bank (2015) also showed that 54% of the population in the city still relies on walking as a major means of transportation. Whereas, the overall share of the public transportation system is about 31%, and the remaining 15% goes to autos and taxis. At present, the public transportation network is composed of formal and publicly owned modes, including city buses (such as Sheger and Anbessa buses), the public service employees transport service enterprise (PSETSE), and the light rail transit service, as well as informal and privately owned modes such as Midibuses (with a loading capacity of about 24–30 persons), minibus taxis (with a loading capacity of 11–16 persons), and Bajajs, a kind of three-wheeled motorized rickshaw vehicle with a loading capacity of 3–6 persons.
Particularly, Addis Ababa light rail transit (AA-LRT) is another new and electrified public transport mode operating on a total of 34 km of two lines using 39 stations, of which five are common stations between these two lines. Currently, this LRT network is providing passenger services for over 125,000 people per day on the two corridors, namely the north-south and east-west corridors.
According to the Institute for Transportation and Development Policy (2022), the composition of the public transportation network covering all the eleven administrative sub-cities of the city and the surrounding suburbs shows that minibus taxis account for the largest share with 86%, followed by Anbesa city buses with 5%, both Minibusses, and PSETSE have 3% each, AALRT has 2%, and the remaining 1% is covered by sheer city bus [Global Road Safety Partnership (GRSP), 2023].
In the public transportation network of the city, around 8,911 Minibus taxis are operating on 1,265 routes in all sub-cities, mostly with blue and white vehicles, and the routes of their network are permitted by the Addis Ababa City Transport Authority. In addition, around 687 Anbessa city buses are operating on 124 routes in the city. Based on data from 2018 to 2019, the service carries an average of 309,888 passenger trips per day. Given the extensive route network operated by the Anbesa buses, headways are sometimes as long as 90 min.
Additionally, Sheger city buses are also operating, using about 217 vehicles on 48 corridors and serving about 198,000 passengers per day. Even though Sheger buses operate along many of the same corridors served by Anbessa buses, the routes and network are predominantly concentrated in the inner parts of the city.
Addis Ababa, one of the most rapidly urbanizing cities, is also experiencing similar problems like others in developing countries. Overcrowding and congestion of the public transportation demands were widely observed every year in the city (Shiferaw et al., 2015 cited in United Nations Human Settlements Programme, 2020; Gebre, 2021).
World Bank and the transport policy of the country (2015) indicated that achieving modal shifts into public transportation, mainly in the major urban areas, is the priority goal to tackle the multi-dimensional transport problems and challenges. Even though these cities have a diverse range of public transportation options and the government's investment in them is growing, there are still significant limitations in the provision of public transport services.
Inadequate supply of public transport services is a significant challenge. For example, the interview with the head of the Addis Ababa Transport Bureau in February 2023 revealed that, including the minibus taxis, the total number of public transportation modes is about 2,000 in Addis Ababa. Of these, the number of city buses is not more than 1,250, and this means the amount of demand-supply gaps in terms of the city buses is about 3,000–3,500 buses, which is a huge gap. The long waits, queues of passengers, and overcrowded vehicles being seen every day, mainly during peak hours in many parts of the city, are manifestations of shortages of public transportation services.
Even the new AA-LRT system is characterized by very long intervals of 10–15 min between trains. In addition to the limited network coverage, particularly in outlying areas, the quality and comfort of public transportation vehicles are poor (World Bank, 2015; Gebre, 2021).
The COVID-19 pandemic has disrupted economic activities and livelihoods all around the world. Despite increasing levels of vaccination, the pandemic continues to spread, having an unprecedented impact on people's lives. Ethiopia is no exception, and the first case of COVID-19 in country was reported on March 13, 2020. Followed by early preventative measures such as mandatory quarantine for travelers, mask mandates, and communication efforts, the government of Ethiopia declared a national state of emergency on April 8, 2020. In addition, the government decided on restrictions on movement and limited access to transportation, the banning of public meetings, and school closures mainly in urban areas. The Ethiopian Federal Ministry of Health swiftly implemented a series of national COVID-19 response policies, including national guidelines to sustain essential health services (WHO, 2020; Zikargae, 2020).
COVID-19 Map-Johns Hopkins Coronavirus Resource Center (2021) revealed the situation and corresponding stage of the pandemic in Ethiopia have evolved rapidly in the last about 18 months. While the initial wave in the first half of 2020 progressed more slowly all over Africa relative to other continents, like other African countries, Ethiopia was smashed much harder by the second wave (mainly February–June 2021). At this stage, the highest number of cases and frequency were recorded, and since then there has been no sign of slowing down, especially given the arrival of the Delta variant (Our World in Data, 2020).
Ethiopia entered the third wave mainly at the time of the survey collection for this study (i.e., October to December of 2021), and the negative impacts of the pandemic were being further aggravated by other crises, the outbreak of desert locusts, and armed conflict in several regions. At the time when the surveys were conducted, about 365,776 confirmed cases and 6,486 deaths from COVID-19 were reported in the country. However, with a total number of about 500,014 cases and 7,572 deaths up to March 2023, Ethiopia currently ranks the 4th highest in Africa. Regardless of the slight increase seen recently, a lower fatality rate is recorded in Ethiopia compared to the regional average throughout the pandemic. Next to the second stage, the infection rate reached its highest level during the third stage. This is due to the fact that the actual case and death count is estimated to be much higher than the reported ones [Ethiopia: WHO Coronavirus Disease (COVID-19) Dashboard With Vaccination Data, n.d.].
Despite the gradual re-opening of schools, the return of children to education, and the overall recovery in employment during the time of this survey in 2021, the economic and social costs of the pandemic continue to be substantial. The COVID-19 situation continues to be precarious and has varying impacts to date across different regions of the country, with remarkable disparities between urban and rural areas and different sectors and socioeconomic groups.
Overall, urban areas and public transportation throughout the world are both the sources and the primary victims of the multidimensional impacts of the COVID-19 pandemic. Consequently, the current study carefully had chosen Addis Ababa city in Ethiopia to examine the implications of the pandemic on the operation of public transportation in urban areas of developing countries. In addition to the recency of the issue, the research problems and the model used indicate the novelty of this research. Unlike the previous studies, the application of PMT model to investigate the impacts of the pandemic mainly from the perspective of developing nations, the focus on transport sector, on both public transportation operators and customers together, and using mixed research method makes the study novel.
3. Literature review
3.1. Protection motivation theory: theoretical framework
To identify the major determinants of driving behavior and customer care and treatment of urban public transportation operators during the COVID-19 pandemic, an array of new variables or pandemic-related variables were used. These are perceptions of COVID-19 pandemic infection risks (severity, vulnerability and fear of driving public transits and subsequent new behaviors developed as protective measures) which affect the decision whether to continue operating public transportation modes.
For this purpose the protection motivation theory (PMT) was chosen as a theoretical framework of this study. The new variables and indicators that may affect the public transportation operators' driving behavior and customer handling are developed from the principles of this up-to-date theory. As PMT is nowadays gaining wider support due to its better relevance to the studies focusing on the health impacts of pandemics and risks such as COVID-19 pandemic, it is found to be more suitable for the evaluation of COVID-19 pandemic impacts particularly on public transport modes operators in the urban transport sector.
According to Rogers (1983) and Cox et al. (2004) protection motivation theory is a model initially designed in 1970s and improved by Ronald Rogers. It explains how individuals cognitively perceive or assess any risk that threatens their lives and how they adopt self-protective behaviors or measures. Attitude or perception change, cognitive mediating processes, and fear appeal are the three basic components of PMT. In order to influence people to change their behavior, the fear appeals the harmful implications of a certain issue. Risk appraisal and risk coping appraisal are the two different cognitive processes that make up the cognitive mediating processes. People assess their risk of suffering from the threat and the threat's severity and seriousness during the risk appraisal process.
PMT explains and informs how seriously people perceive the threat affects their cognition, behavior and actions. In the risk coping appraisal, individuals take preventive strategies that remove or diminish the recurrence of threats and develop confidence in their ability to adhere to preventive measures through three cognitive processes, including response efficacy, self-efficacy, and response-cost. Therefore, risk and coping appraisals as mediators could influence the relationship between risk information and protective behavior (Rogers, 1975; Boer and Seydel, 2005).
With regard to the application of PMT (Wang et al., 2021; Zheng et al., 2021), in their tourism-related research, showed that in response to a public health threat, individuals may develop perceptions of the risks and turn to adaptive coping mechanisms that aim to protect against threats based on PMT. There are some studies that applied PMT in transport fields such as Mashrur et al. (2022) and Tareke and Ashebir (2023) to analyze the impact of the Pandemic on the anticipated transit usage in Post-pandemic period particularly in Canada and by Harbeck et al. (2018) to investigate young drivers' perceived risk and risky driving. Chen and Lu (2021) also applied it to explore the mechanisms of passengers' protective behavior in ride-sharing.
Studies such as those by De Vos (2020) and Ozbilen et al. (2021) have revealed that people's pandemic travel fear and risk perception of public transit were greater than that of private modes during the pandemic, potentially affecting their transit choice and usage behavior. Similar studies that specifically studied transit demand for example, Hotle et al. (2020) and Parady et al. (2020) found that passengers perceiving a higher risk of influenza infection in public transit were more likely to avoid transit trips but shift to other options such as private transport.
The perceived fear and the resulting motivation to adopt protective measures could potentially alter transit operating behavior in the post-pandemic era. Protective measures undertaken in response to the pandemic are likely to be maintained for an extended period as a precaution after the pandemic. Consequently, some individuals may exhibit inertia, that is, a delayed return to transit as long as these measures are in place (Li et al., 2021; Zheng et al., 2021).
There are many studies (such as Tenenhaus et al., 2005; Yadegaridehkordi et al., 2018; Lisheng et al., 2021) that have used a theory of planned behavior (TPB) to explain driving behaviors in the aspect of psychology and driver's psychology on driving behavior.
Furthermore, to the authors' knowledge, even though these all impacts mentioned in PMT are at least theoretically acceptable, only a small number of studies have explored the potential for public transportation operators' psychological factors (i.e., fear of pandemic and travel risks) and consequent motivation to adopt protective measures or behavioral intentions (i.e., inclination to completely avoid driving, continue or reduce driving frequencies, the friendly customer care and treatments) to alter their transit operating behavior and practices during the pandemic. Thus, the current study was highly motivated to apply it to this transport topic, particularly to determine the factors related to the threats of the pandemic that could affect public transport choice decisions during the pandemic era in developing nations like Ethiopia, considering the given potential for COVID-19 pandemic-related perceptions of risk, fear, and protective measures to affect the choice of public transit.
Even though a small number of researches have been studied the impact of employees wearing facemasks on customer service experience, wearing facemasks has become a common practice for workers engaged in customer–employee interaction in China to deal with the perceived risk from human contact and reduce concerns over service interactions.
As it is revealed by literatures including (Rogers, 1983; Cox et al., 2004; Rivera, 2004), the theory has been successfully applied to several health promotion activities and healthy lifestyles. That is why the modified PMT model was thus applied in this health and transport related study as framework to assess the public transportation operators' driving and customer handling behavior and intention with regard to COVID-19 pandemic-related attributes. By doing so, this paper tries to fill the gap in existing knowledge, research and literature concerning a PMT model for the study on the COVID-19 pandemic impacts and transportation related study particularly on public transportation operators' driving and customer handling behavior from the perspective of developing countries including Ethiopia.
The application of PMT in the current study was to quantify, estimate, and understand the impact of COVID-19-related factors (example, the perceived infection fear, travel risks, and safety) on the driving and customer handling behavior during the pandemic period. The major task of PMT was to serve as a framework to explore the relationships among pandemic fear, travel risks, protective responses, and changes in transit driving and customers handling practices. Thus, it was applied to examine the behavioral consequences of COVID-19 pandemic fear, travel risks, and protective measures taken by public transportation operators on their driving behavior.
The study considered the impacts of COVID-19-related factors and the subsequent response strategies on the public transportation operators' behavior changes, including the likelihood to continue, reduce, or avoid transit operation, customer care and treatment during the pandemic. The relationships between these factors were investigated using a relevant theoretical framework, namely PMT. As indicated in previous studies, bearing in mind the given potential for COVID-19 pandemic-related perceptions of risk, fear, and protective measures to affect people's behavioral intentions, PMT has a good fit for this study.
The Wilcoxon signed-rank and binary logistic regression models were estimated considering attitudes toward the pandemic and public transportation operations under different travel contexts such as before and during-COVID scenarios and in situations where government safety measures have been implemented or not as responses against the pandemic. Based on this, the study model could shed light on the fitness and performance of PMT to explore the implications of the COVID-19 pandemic on the driving and customer handling behavior as well as to the better implementation of safety policies and strategies so as to improve public transportation operations during the pandemic.
3.2. Conceptual framework
As a theoretical framework of the present research, the role of the modified PMT was to design conceptual framework as well as to quantify and examine the perceived impacts and types of correlations that exist between the pandemic-related attributes and the urban PT mode operators' intentions and behavior changes. As indicated in Table 1, constructs and variables of interest regarding the perception of pandemic severity and fear, vulnerability of travel risks, and protective measures were identified, revised, and quantified by items on the basis of PMT and earlier researches on protection behavior.
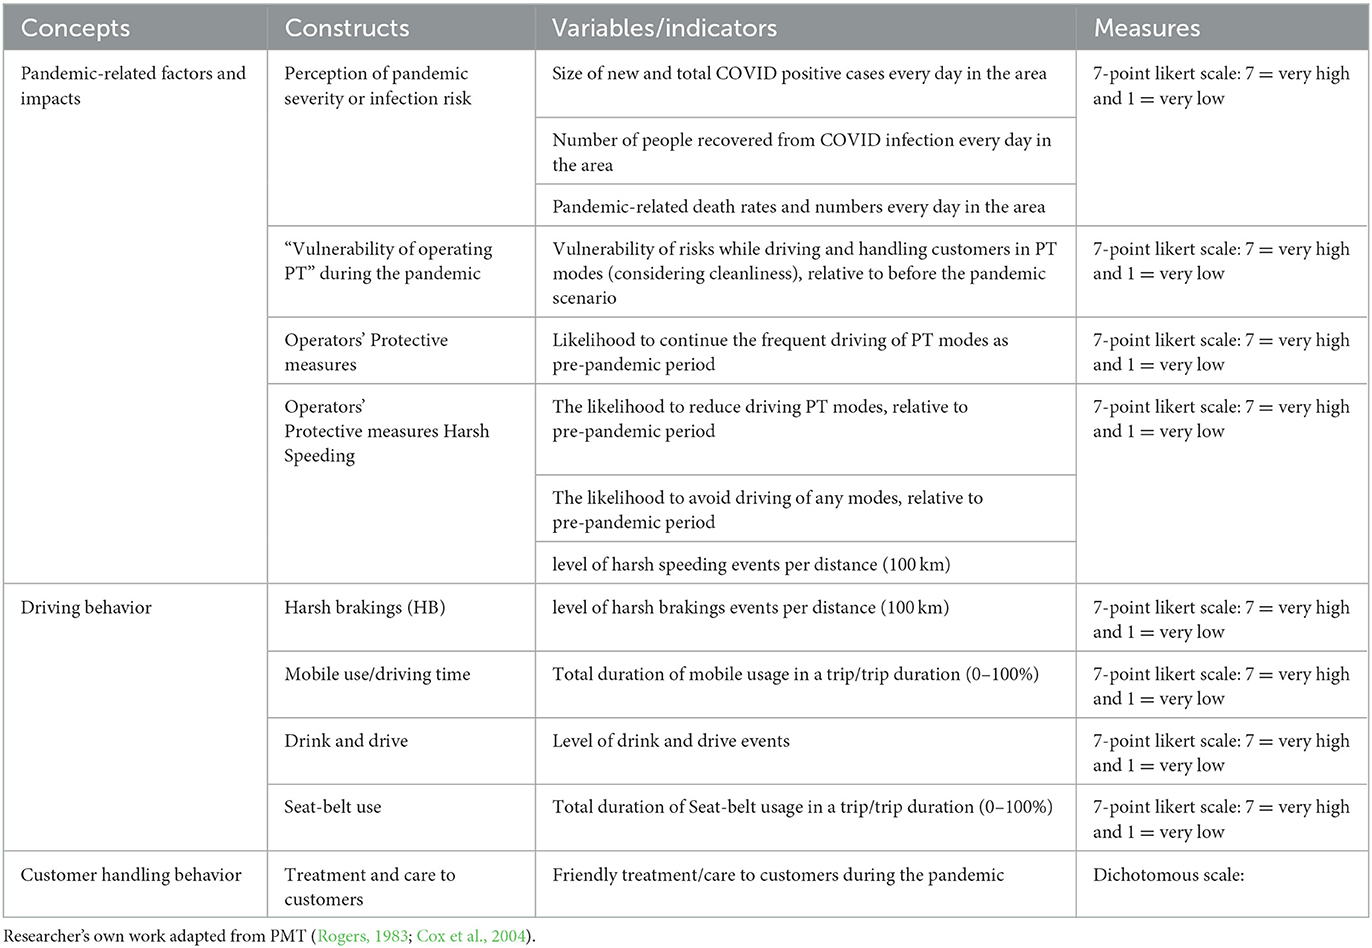
Table 1. Constructs, variables, and indicators of impacts of COVID-19 based on PMT.
To this end, four measurement models were used in the conceptual framework (Figure 1) to test the hypotheses and estimate the COVID-19-related factors and their impacts on changes in public transportation operation, driving and customer handling behavior during the pandemic. Survey participants were first asked to rate their level of concern about the number of new and total COVID-19 positive cases, infection rates, recovery and death rates every day in the area as indicators of their “perception of pandemic infection risk and fear”. These indicators were measured and rated by participants using a Likert or rating scale response format.
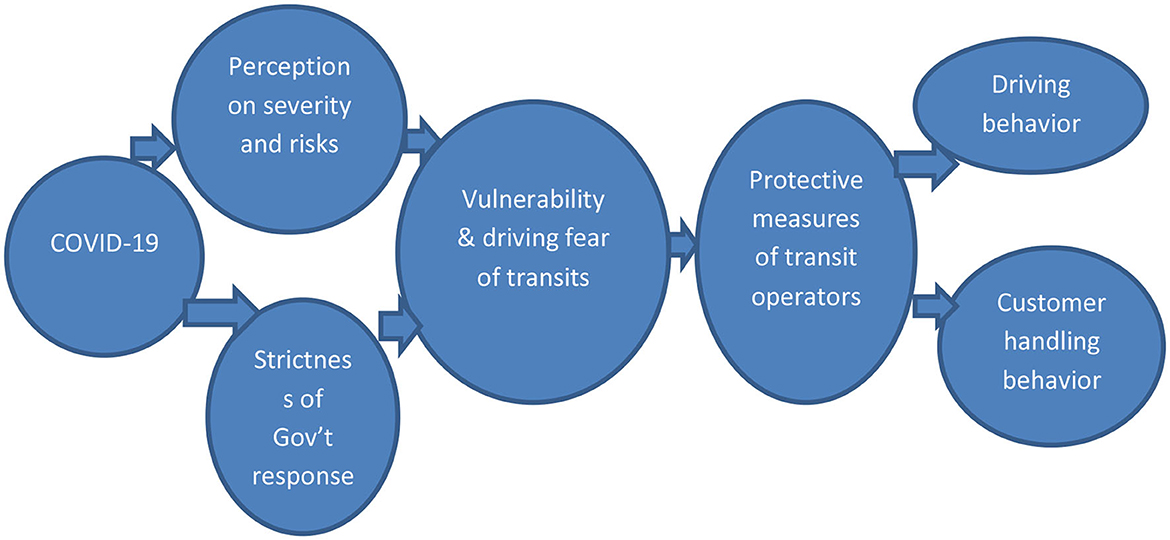
Figure 1. Conceptual framework of the study based on PMT. Researcher's own work adapted from PMT [Rogers (1983) and Cox et al. (2004)].
Secondly, in this model “vulnerability of operating risks” is defined in terms of vulnerability level of driving public transportation operation and handling customers (mainly measured by considering their cleanliness or disinfection). Thirdly, the level of implementation of government response measures in the transport system to control the pandemic. The safety strategies include social physical distancing, ventilation or airflow, reduced passenger loads of transits, mask-wearing, public information, cancel public events and gatherings. These indicators were measured and rated by participants using similar question and response format.
Finally, the construct “protective measures” was quantified and measured using the frequency of scores given by participants' responses to the selected indicators. These observed indicators are “the likelihood to continue the operation or driving of public transit modes, the likelihood to reduce public transit operation or driving”, and “avoid operation or driving of public transit modes” during the pandemic compared to the pre-COVID scenario. Out of these protective measures, the most frequently selected one is considered to be the most significant impact of pandemic-related aspects on public transit mode driving and customer handling behavior changes.
Based on the first two constructs or variables, the third one (protective measures of public transportation operators) were estimated for two operation environments i.e., before and after the pandemic period, taking into account their attitudes toward the pandemic and decisions to drive public transportation modes. The implications of pandemic-oriented government intervention measures as well as their level of implementation are also considered to justify their driving and customer handling decisions. These indicators of protective measures refer to how safe the operators felt and how willing they were to operate, drive and handle customers in the given environments.
In addition to the pandemic-related factors, the conventional determinant factors were together used to measure and compare the significant factors that influence driving decision making before and during the pandemic. Some of the conventional determinant factors include: external weather environment (temperature, rainfall, vision and hearing), road environment (traffic and road condition), internal vehicle conditions (maintenance, lighting and seating comfort), and driving experience related factors.
This PMT-based framework was generally used to guide the pipeline of the study data and methods of impact analysis. Its role in this transport study is that of an analysis tool that provides a framework for representing how driving and customer handling behavior of transit operators changed in response to different input assumptions such as COVID-19 infection risk perceptions (severity and vulnerability), travel fear, and protective measures of passengers. The framework could thus help to develop and test the following hypotheses:
⮚ Impacts of COVID-19-related factors are associated with travel risk perception (TRP) and health and safety perception (HSP), and positively correlated with driving and customer handling behavior of transit operators. TRP and HSP mediate between the COVID-19-related factors and reductions in the choices of driving public transportation modes.
⮚ The larger COVID-19 infection risk perceptions (severity and vulnerability) and driving fear of transit operators will produce larger motivation to take protective measures.
⮚ The larger the motivation to take protective measures, the larger the tendency of transit operators to avoid or reduce driving and friendly handling of customers.
⮚ The lower the likelihood of more frequent driving of public transportation and friendly customer handling during the pandemic, compared to the pre-COVID period.
4. Materials and methods
4.1. A pre-post design
Impacts of the pandemic on the driving and customer handling behavior of public transportation operators are best evaluated through comparative approaches and quantification of variables and impact indicators. Thus, to effectively describe and explain the phenomena in the current study a comparative study design particularly Pre-post comparative design was applied. The role of this design was to establish and explore whether there are statistically significant differences between dependent groups concerning some key outcome variables. The dependent groups are used for pre/post temporal comparison using responses and observations on the variables of driving behavior and customer handling before and after COVID-19 pandemic scenario from the same subjects i.e., public transportation operators in this study.
Klatt and Taylor-Powell (2005) revealed that pre/post analysis model specifically a retrospective pre-test evaluation design is better for situations that include measuring change over a very short period, capturing factual or routine information, attempting to gauge perceptions of change as a result of project implementation. It includes efforts to diminish response-shift bias, or to evaluate change without having collected baseline data before the start of project efforts (Howard, 1980; Sudman et al., 1996).
Thus, a pre-post comparative analysis approach was used based on before-after comparisons that assume that all impacts and changes in driving and customer handling behavior over time are due to the COVID-19 pandemic and not due to other trends or factors. This temporal comparison and impact evaluation methodology was predominantly based on before and after-COVID analyses. The impacts of COVID-19 and responses were compared with a scenario that would have existed had the COVID-19 and response measures not been undertaken. To this end, the temporal comparison technique was applied using pre and post-COVID outbreak scenarios i.e., before and after March 2020.
This date was used as a reference point, because in Ethiopia the report of the first confirmed case of COVID-19 and response measures started in March 2020. Accordingly, the situation of 18 months after March 2020 was compared with the equivalent 18 months before March 2020. This temporal comparative design was used on the same intra-city public transportation operators by making two observations or measurements on their driving behavior for the pre and post-COVID outbreak scenarios on the defined outcome variables.
Literatures such as Heath et al. (2020) indicated that pre/post survey study participants memorize and report more easily and significantly when the reference period is shorter, because it requires shorter time memories. Since there are no similar “before” studies and the length of the reference period is shorter to easily memorize the past situations, the historical review for data about the pre-COVID period is based on the memories of respondents. This means that assumptions about the driving and customer handling behavior of public transportation operators in the pre-COVID period are often not directly tested. Detail discussions and agreements were also conducted with the study participants to avoid memory bias, carefully memorize and provide pertinent data regarding their driving behavior and customer handling experiences before the start of the pandemic. Based on this the study could make objective comparisons between before and after COVID-19 scenarios using the same constructs and variables.
4.2. Data type and collection instruments
Public transportation operation assessment methods must adapt and overcome barriers to maintain a steady and reliable flow of information, considering the pace of events surrounding the pandemic and the urgency of the situation, compounded by potential long-term negative impacts. Hence, the study used appropriate methods, considering the literature and information gaps as well as the influences of prevailing circumstances on data collection and research work.
This study employed mixed research approaches for the collection of various types of data and evidence materials through the combination of quantitative and qualitative methods, including a close-ended questionnaire, key informant interviews (KII), observations, and document reviews. For the collection of primary quantitative data from the randomly chosen 143 public transportation operators, questionnaire surveys were conducted at offices, stations, terminals, and on-board surveys in Addis Ababa, Ethiopia. These public transportation operators are composed of owner-drivers, employed-drivers and other crews or key workers in the customer handling of city buses, Midi-buses, Mini-buses, Light rail, and Bajaj (three-wheeled rickshaws) (Cochran, 1977).
The closed-ended questionnaire tool was composed of three sections, including socio-economic and demographic backgrounds, variables of driving behavior and customer handling behavior, and pandemic-related factors before and during the COVID-19 pandemic. A 7 point Likert or rating scale items (where 7 = very high/strongly agree and 1 = very low/strongly disagree) were used particularly to measure variables of the new pandemic-related attributes (example, severity, risk, vulnerability or cleanliness and participants' protective measures), driving and customer handling behaviors.
The driving behavior, customer handling practice, and new pandemic-related variables were identified and included in the questionnaire for the respondents to rate and place a priority on each factor or variable (Figure 1, Table 1). To quantify and measure the impacts of the COVID-19 pandemic on driving and customer handling behaviors and practices, relevant constructs and variables were identified and operationalized based on PMT and previous studies. In addition, data were collected about the driving and customer handling variables for both periods (before and after the COVID outbreak). The driving and customer handling variables examined in the current study are summarized in Table 1. It is worth noting that other variables such as driving period, location and road type are external and kept constant in this study.
To collect qualitative data, 16 semi-structured and key informant interviews were conducted with purposively chosen public transportation operators, transport experts and authorities in Addis Ababa, Ethiopia. The key informants were purposively chosen considering their lived driving experiences of public transportation before and after the pandemic period and the more relevant information they possess on the themes. These data were used to complement and explain the quantitative data.
4.3. Data analysis methods
Data collection tools were pretested in a similar setting and adjusted accordingly before data collection to ensure they yield the information required. Meetings were conducted at the end of each day to check for consistency, and completeness, and to ensure proper data collection through questionnaires. Accordingly, dataset were stored in password-protected SPSS version-24 computer software (IBM Corp, 2016).
Tables, figures, graphs, plates, maps, and textual narratives were employed to present data and results. The comparative impact evaluation methodologies were supported by relevant quantitative and qualitative data analysis approaches. Inferential statistical models were used to determine the statistical significance level of differences among various groups of transit operators. Driving and customer handling behavior questionnaire was built as an analyzing tool and survey data were also analyzed using descriptive statistics and other qualitative tools.
Based on the research questions, Wilcoxon signed-rank tests were used to analyze and compare the median differences between before and after-COVID outbreak observations on the same subjects (i.e., transit operators) for the selected variables of interest (i.e., determinants of driving decision-making and harsh driving behavior). Spearman rank correlation was also used to analyze the relationship between pandemic-related variables and harsh driving behaviors during the pandemic. The outputs of these tests were also used to identify the significant variables to be used as input or predictor variables in the Binary logistic regression to model the impacts of the pandemic and other factors on the friendliness of customer handling behavior of transit operators.
4.3.1. Model specification
Customers handling behaviors of public transportation operators were modeled using Binary logistic regression model. Since logistic regression calculates the probability of success over the probability of failure, the results of the analysis are in the form of an odds ratio. Logistic regression determines the impact of multiple independent variables presented simultaneously to predict membership of one or other of the two dependent variable categories. It was used to model the probability of choosing the presence or absence of friendly customer handling during the pandemic. For this model, the dependent variable is a dichotomous (binary) variable, coded 0 or 1. This was due to the fact that the outcome variable (i.e., friendliness of customer handling) was nominal and comprised two categories: presence and absence of friendly customer handling during the pandemic.
According to Team (2022) this model helps choice makers opt only one alternative from choice set. It was chosen for its robustness in modeling disaggregated data, simplicity in the mathematical framework, and adaptability to any data type. Unlike the probit model, this model does not also require a large sample size. Besides, for this model, the unobserved term of one alternative is assumed to be unrelated to the unobserved term of another alternative. The intercept coefficients are included to capture the average unobserved effects, and they have no interpretable meaning.
This model is more appropriate and robust because it provides the goodness of model fitting values and results in more meaningful interpretations. Logistic regression forms a best fitting equation or function using the maximum likelihood (ML) method, which maximizes the probability of classifying the observed data into the appropriate category given the regression coefficients. Binary logistic regression provides a coefficient “b”, which measures each independent variable's partial contribution to variations in the outcome variable.
The goal is to correctly predict the category of outcome for individual cases using the most parsimonious model. They are also capable of observing and modeling how and to what extent the sampled respondents of each predictor variable are likely to choose each outcome variable when compared to their counterparts, given the other independent variables in the model are held constant. This means it could compare the likelihood of choice of males to females, lower-income to middle and upper-income people, etc., as well as the likelihood of choosing the presence and absence of friendly customer handling.
This model was used to predict the probability of choosing the level of the friendliness of customer handling and the probability of an alternative being chosen by transit operators during the pandemic using equation-1, which is adapted from Team (2022):
Where:
Log: the probability that a case is in a particular category. This logistic transformation of the odds (referred to as logit) serves as the dependent variable or Y.
p: Probability that Y = 1 given X
X1, X2, …. Xk are the independent/predictor variables and
b0 = the constant of the equation and,
b1, b2, …. bk = parameters of model or the coefficient of predictor variables.
The predictor variables used as input in the binary logistic regression were composed of the underlying new pandemic related factors, demographic and socio-economic characteristics of transit operators. Out of the total variables (i.e., the conventional and new pandemic-related mode choice determinants) indicated in Table 2 those which were found to be statistically significant in the Wilcoxon signed-rank test were primarily chosen as input variable. These are the pandemic infection risk, Mask-wearing, social physical distancing, ventilation/airflow, and public transportation operation restrictions (such as reduced passenger loads of public transport, mask-wearing, public information, cancel public events and gatherings).
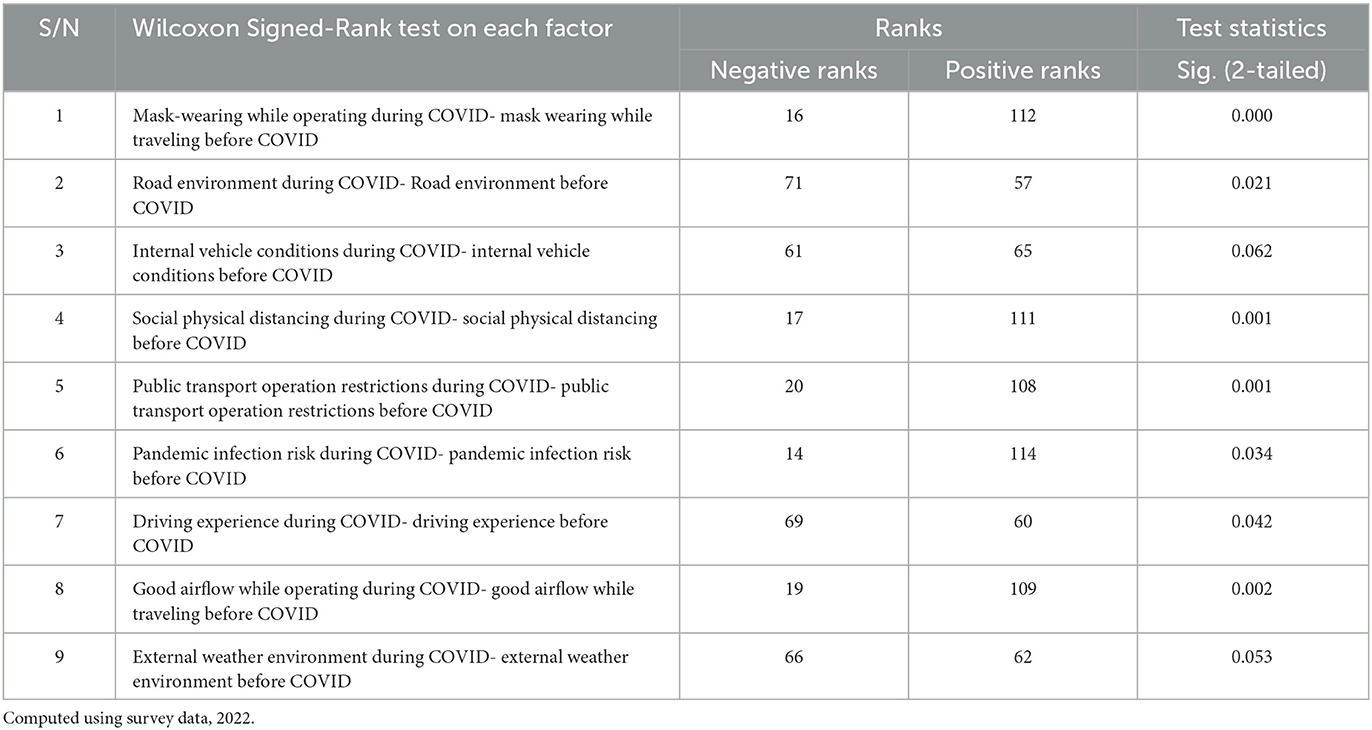
Table 2. Determinants of driving decision making before and during COVID-19 pandemic.
Moreover, the other input variables were gender, age, monthly income, educational and marital status. The actual data contained in these input variables were a mix of scale, binary, nominal, and ordinal data through the use of dummy variables. For example- gender was binary (male and female); for age and monthly income it was continuous/scale; for marital status it was nominal; and for educational status it was ordinal variable.
Re-coding these categorical variables into a new set of dummy variables with values of 1 and 0 was done to facilitate greater interpretation of the intercept in the model. For the dummy coded variables, one group was treated as a reference category, which is a baseline against which all other categories are compared. In this study the reference categories are: male for gender, illiterate for educational status, unmarried for marital status, and good airflow/ventilation for pandemic-related factors. All the descriptive and inferential statistics were achieved at a 95% confidence interval.
Finally, to assess the changes and effects faced and felt by public transportation operators, qualitative data analysis mainly thematic narrative analysis was utilized. Accordingly, the selected 16 key informants mainly operators, drivers, crew members and experts could freely express the driving behavior and customer handling practices before and during the COVID-19 outbreak. The qualitative data were transcribed and analyzed based on the relevant themes such as perception of the pandemic, travel risks, driving decision-making behavior and customer handling changes, and why and how public transportation operation is affected. These qualitative data analysis could explain the findings of questionnaire surveys.
5. Findings
Even though 143 survey questionnaires were conducted in Addis Ababa, Ethiopia, after data processing and editing, the valid datasets used in the analysis were only 129. The major findings of the quantitative and qualitative analyses are presented below.
5.1. Frequencies of driving public transportation modes before and during the pandemic
Concerning the public transportation driving frequency, respondents were asked how often they drove public transportation (PT) modes per week before and during the COVID-19 pandemic period. Figure 2 showed that out of 129 respondents in Addis Ababa, Ethiopia, the majority, i.e., 56 and 51, reported they drove public transportation modes “most of the time” and “all of the time,” respectively, before the COVID-19 period. Whereas, during the pandemic, the weekly frequency of driving was found to be “a little of the time,” “some of the time,” and “none of the time.” for limited respondents. These findings revealed that the weekly frequency of driving public transportation by transit operators significantly decreased during the pandemic, compared to the pre-COVID period.
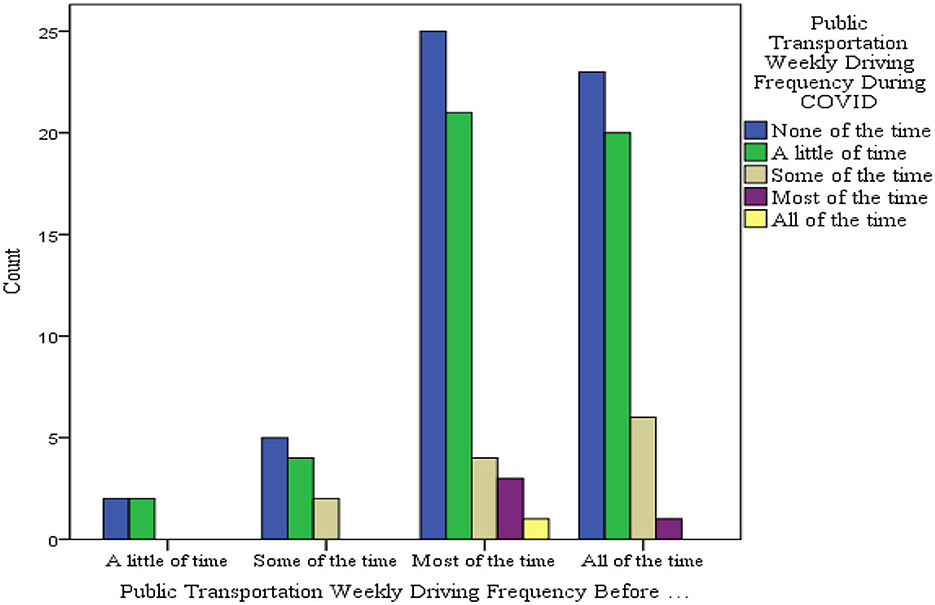
Figure 2. Frequency of driving public transportations per week before and during the pandemic. Computed using survey data, 2022.
5.2. Influencing factors of driving decision-making before and during the pandemic
This paper discusses the driving decision-making determining factors under the PMT, and focuses on COVID-related and conventional factors from the perspective of public transit operators. To make the research more clear and targeted an assumption is made to simplify the test, and the public transportation driver and the vehicles are considered as a unit. The reliability of the human-vehicle unit is assumed to be constant, and the factors other than those indicated in Table 2, such as a complex urban traffic environment and the preferences of the driver, are not considered in the study. On the basis of these assumptions and the conventional determinant factors combined with COVID-19 pandemic scenarios, the factors affecting the driving decision-making behavior are quantified and analyzed, as shown in Table 2.
Table 2 shows that a combination of traditional and new COVID-related factors were considered in order to conduct a comparative analysis and investigate the most significant determinant factors influencing public transportation modes driving decision making during the pandemic period compared to the pre-pandemic scenario. Among the COVID-related factors, pandemic infection risk, social distancing, good airflow, mask-wearing while driving, and public transport operation restrictions were used. Whereas the external weather environment (such as temperature, rainfall, vision, and hearing), the road environment (such as traffic and road condition), the internal vehicle conditions (such as maintenance, lighting, and seating comfort), and driving experience related factors were used as the usual or conventional determinant factors. Other than these factors, other external factors that could affect driving decision making are controlled in this study. Besides, out of the selected total determinants, using about 50% of them from the new COVID-related determinants is sufficient to measure their correlation and impacts.
Respondents were requested to rate (using scales from 1 = very low to 7 = very high) the level of priority they placed on each variable when making public transportation mode driving decisions during the pandemic period, compared to what they did before the pandemic period. The findings of the Wilcoxon Signed-Rank test in Table 2 revealed that the median differences between before and during the COVID-19 period concerning the driving decision-making determinant factors were found to be statistically significant.
Except for factors “internal vehicle conditions” and “external weather environment,” the seven determinant factors showed a statistically significant difference (i.e., with a sig. value below 0.05) between the two periods. Out of the 129 respondents, most of them for example, 114, 112, 110, 109, and 108 put more priority on factors such as “Pandemic infection risk,” “mask-wearing requirements,” “social physical distancing,” “good airflow while driving,” and “public transport operation restrictions” respectively during the pandemic than during the pre-COVID period. On the other hand, 70 and 69 respondents placed more priority on factors such as “road environment” and “driving experience” before the pandemic compared to during the COVID period. Factors such as “external internal vehicle conditions” and “external weather environment” are not significant, and this means the level of priority given for these variables as determinant factors during and before the pandemic is similar.
In comparison to conventional factors, the new and COVID-19-related factors are now found to be the most significant determinant factors influencing the decision to operate or drive public transportation since March 2020. Similarly, the qualitative results from the discussions with key informants (n = 14) aligned with the above statistical evidence. The pandemic-related factors, including the perception of pandemic-related risk fears, mask-wearing, and social distancing while driving, as well as the government restrictions on public transport service provisions, could negatively influence the driving decisions of transit operators. Accordingly, these variables are the major reasons and factors for the reduction of public transportation modes, driving behavior, and intentions during the pandemic.
Based on this evidence, the new COVID-19 related factors could be used as input in the subsequent analyses to examine their effects on the specific kinds of driving and customer handling behavior of public transportation operators in Addis Ababa, Ethiopia.
5.3. Harsh driving behaviors before and during the pandemic periods
Respondents were requested to rate the level of harsh driving events or occurrences on four variables when operating or driving public transportation modes before and during the pandemic period, using scales from 1 (very low) to 7 (very high). Accordingly, the findings in Table 3 showed that the median differences between before and during the COVID-19 period concerning the harsh driving behavior events were found to be statistically significant for only two variables, such as “Harsh braking events per distance (100 km)” and “Harsh speeding events per distance (100 km)”, with a sig. value of 0.010 and 0.000, respectively.
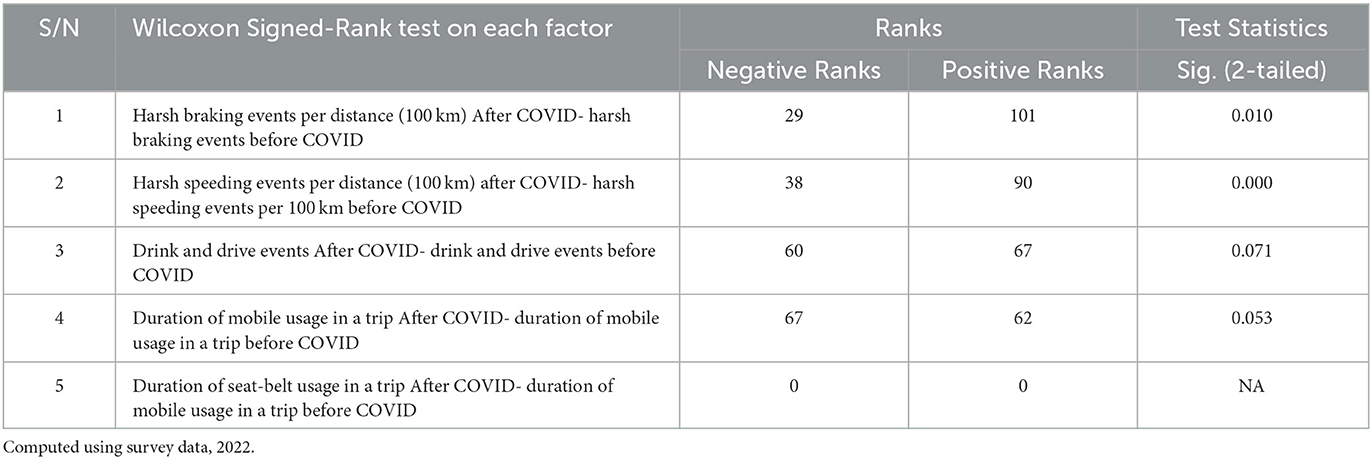
Table 3. Events of harsh driving behaviors before and during COVID-19 pandemic.
Except for factors “drink and drive events” and “duration of mobile usage in a trip,” the other two factors revealed a statistically significant median difference between the two periods. The majority of respondents (101 and 90, respectively) rate higher scores on factors like “Harsh braking events per distance of 100 km” and “Harsh speeding events per distance of 100 km” during the pandemic than before the COVID period. This finding showed that harsh braking and harsh speeding events increased during the pandemic compared to the pre-COVID scenario. On the other hand, the other factors, “drink and drive events” and “duration of mobile usage in a trip,” are not significant, and this means the level of these harsh behavior events had no significant differences during and before the pandemic.
Based on the findings and evidence shown in Tables 2, 3, the statistically significant COVID-related variables and harsh driving behaviors during the pandemic period were focused on to analyze the existence of a relationship between the impacts of the COVID-19 pandemic and driving behavior changes. In Table 4, statistically significant findings were found from Spearman correlation tests on each pair of variables.
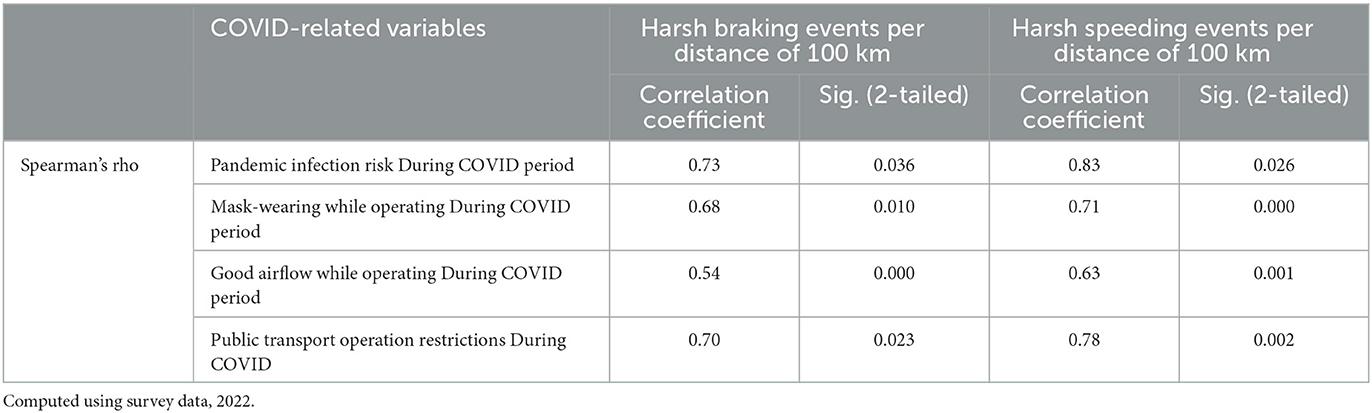
Table 4. Correlation between COVID-related variables and harsh driving behaviors.
More specifically, “the pandemic infection risk during COVID” variable is positively and strongly correlated with “Harsh braking events per distance of 100 km” (p = 0.036, r = 0.73) and “Harsh speeding events per distance of 100 km” (p = 0.026, r = 0.83). For the “public transport operation government restrictions during COVID,” a positive and strong correlation is found with “Harsh braking events per distance of 100 km” (p = 0.023, r = 0.70) and “Harsh speeding events per distance of 100 km” (p = 0.002, r = 0.78). Overall, these findings showed that all the COVID-19-related new factors are directly and significantly linked to the development of harsh driving behaviors or events during the pandemic period, i.e., since March 2020 in Addis Ababa, Ethiopia.
The qualitative results of discussions with key informants are also consistent with the statistical evidence. All of the key informants (n = 15) confirmed that, in spite of the reduction in the tendency and frequency of operating or driving public transportation, a higher level of harsh driving events were seen during the pandemic, compared to the pre-COVID period. More specifically, the relatively increased harsh speeding and braking behaviors were developed because of various reasons, mainly COVID-19 pandemic attributes and associated government response measures such as restrictions on transit operations, passenger loading capacity, public events, etc. The higher reproduction rate of the pandemic, the new COVID-19 cases, higher fatality rates due to COVID-19 per day, and the strictness of measures had also contributed to higher fear behaviors. This fear behavior resulted in lower travel demand, a lower number of vehicles or traffic on the road, and in turn, the development of these harsh behaviors.
Furthermore, qualitative results showed that longer trip distances traveled, driving during risky nighttime hours, and urgent driving requests (mainly for Bajajs) were additional factors that impacted and contributed to the harsh speeding and braking behaviors during the pandemic.
5.4. Factors influencing transit operators' customer handling behavior during the pandemic
A binary logistic regression model was applied to estimate the regression coefficients and model the relative influence of independent variables on the customers handling behaviors of public transportation operators during the pandemic period. As it is revealed in the preceding findings in Tables 2–4, among the determinant factors of public transportation operating or driving decisions and behavior changes during the pandemic period, the new COVID-19 related factors were the most dominant and significant, relative to others. Thus, the COVID-19 pandemic and associated factors were used as input predictors together with the dummy-coded demographic and socio-economic backgrounds of respondents to model the dependent/outcome variable. The outcome variable consisted of two categories, i.e., friendly customer handling (yes, coded 1) and unfriendly customer handling (no, coded 0).
One hundred and twenty nine valid questionnaire responses about the presence and absence of friendly customer handling behaviors were considered in this model analysis. According to the “Classification Table” statistics in Table 5, the majority of the questionnaire responses (or 93) showed that there was no practice of friendly customer handling, as opposed to those 36 responses for the presence of friendly customer handling during the pandemic. Thus, the predicted probability of unfriendly customer handling behavior by transit operators during the pandemic is high.
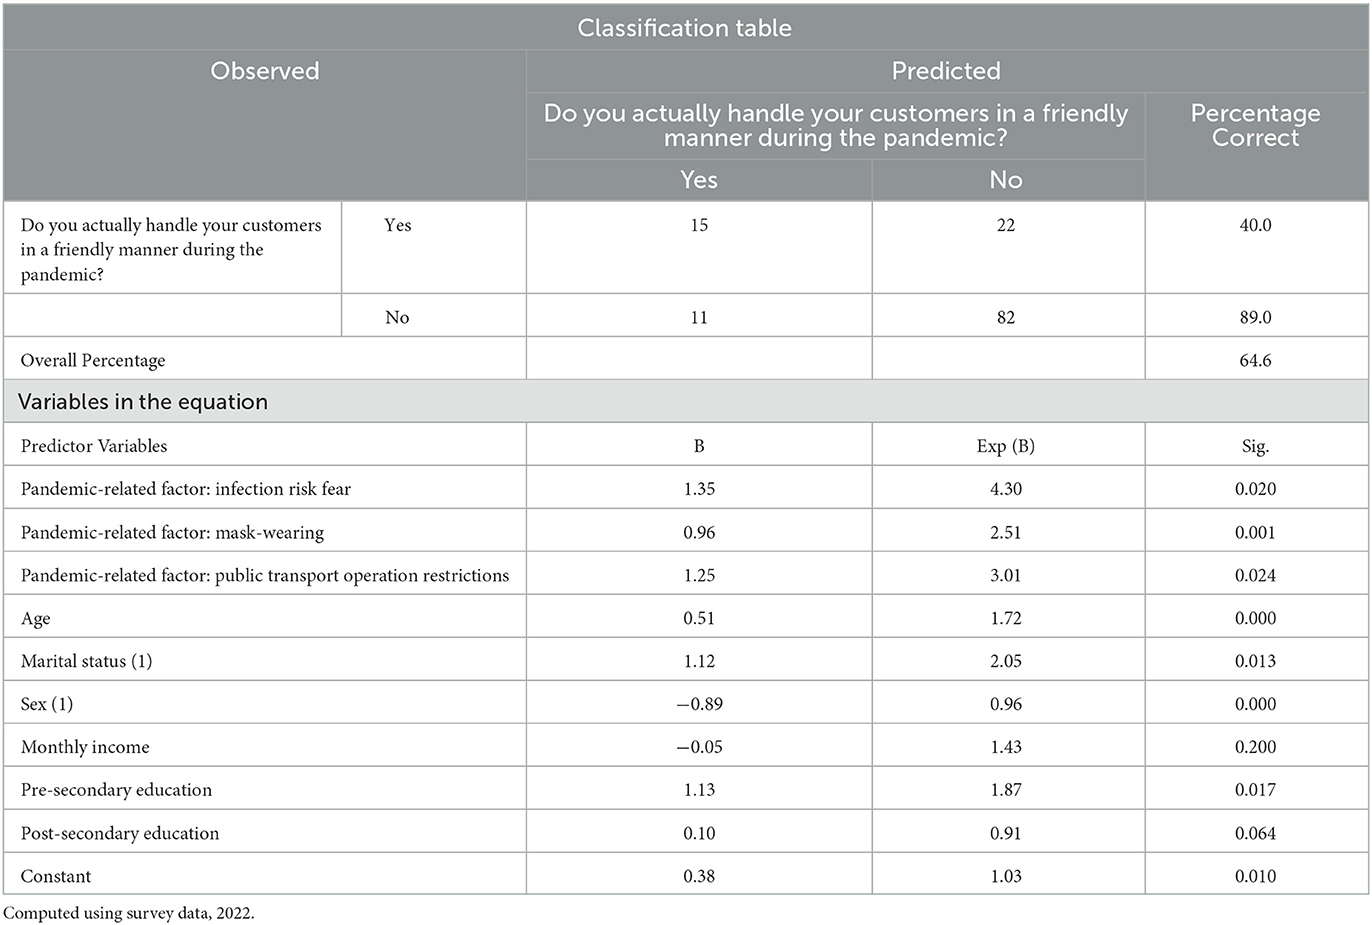
Table 5. Modeling customer handling behavior of transit operators during the COVID-19 period.
The statistically significant level (p-value) and regression estimation coefficients of the variables obtained from the analysis are shown in Table 5. In the analysis, the fitness of the selected model was checked against the set of data using omnibus tests of model coefficient statistics. As a result, the omnibus tests show that the model is significant and acceptable, or that it has a good fit to the data at [x2 (6, N = 129) = 57.14, p 0.001].
According to the model summary statistic, the model explains about 46–55 percent of the variance in the dependent variable (i.e., customer handling behavior) using the predictor variables, which is good. Furthermore, the overall percentage accuracy in classification (PAC) statistics showed that the predictive power of the developed model is good at PAC = 64.6%. This means, about 64.6% of the time that we make predictions using this model will be correct, but it will be incorrect for 35.4%.
The regression coefficient (B) of each statistically significant independent variable is estimated by measuring the change in the dependent variable for a one-unit change in each independent variable, ceteris paribus (i.e., other independent variables remaining constant in the model). Here, the positive signs of the regression coefficients indicate the positive correlation and effect of predictor variables on the corresponding outcome variable. This means a one-unit increase in the predictor variable is associated with a certain unit increase in the outcome variable, but vice versa for the negative sign. Whereas for the interpretation of odds ratios, i.e., Exp (B) values, we use the word “decrease” when the value is below 1 and “increase” when the value is below 1.
Those predictor variables that are correlated with the outcome variable and have a statistically significant p < 0.05 are discussed below based on the model output interpretation.
i. In Table 5, the statistics of “Variables in the Equation” reveal that the predictors such as infection risk fear, mask-wearing, and public transport operation restrictions (all are the pandemic-related underlying factors), sex-1 (female), marital status-1 (married), age, and pre-secondary education status were found to be statistically significant predictors (with a p-value of 0.05) of customer handling behaviors during the pandemic. Whereas, monthly income and post-secondary education status were insignificant at p = 0.200 and p = 0.064, respectively.
ii. The first pandemic-related factor or predictor, “infection risk fear,” is found to be significant (b = 35, p = 0.020), having controlled all other variables in the model. Furthermore, the log odds of respondents who prioritized “infection risk fear” choosing the unfriendly customer handling category (relative to the friendly customer handling category) are 4.3 times higher than those of respondents who prioritized “good airflow” (coded 0 and reference group). These findings indicate that respondents who placed more priority on “infection risk fear” are 4.3 times more inclined to show unfriendly customer handling behavior during the pandemic, than the respondents who placed a higher priority on pandemic-related factors, particularly good airflow.
iii. The second pandemic-related factor, “mask-wearing,” is a positive and significant predictor of unfriendly customer handling behavior (b = 96, p = 0.001). Compared to respondents who placed a priority on pandemic-related factors, particularly “good airflow,” those who placed more priority on “mask-wearing” have a 2.51 times higher inclination to show unfriendly customer handling behavior during the pandemic.
iv. The third pandemic-related factor, i.e., “public transport operation restrictions,” is also a positive and significant predictor of unfriendly customer handling behavior (b = 25, p = 0.024). The log odds of unfriendly customer handling behavior among respondents who placed a priority on the “public transport operation restrictions” predictor are 3.01 times higher, compared to respondents who placed a priority on a pandemic-related factor, particularly “good airflow,” during the pandemic.
v. After controlling for all other variables, age is found to be a significant positive predictor (b = 51, p = 0.001).For every one unit increase in age, the log odds of showing unfriendly customer handling behavior increased by 1.72 during the pandemic. This also means that for every one unit increase in age, the odds of showing unfriendly customer handling behavior increased by 72%, or (1.72–1)*100.
vi. During the pandemic, the log odds of respondents in the “married” category exhibiting unfriendly customer handling behavior were 05 points higher than those in the “unmarried” category (coded 0 and reference group).
vii. The predictor “Sex-Female” is also found to be significant (b = −0.89, p = 0.001).During the pandemic, the log odds of respondents in the “female” sex category displaying unfriendly customer handling behavior are 96 times lower than those in the “male” sex category (coded 0 and reference group).
viii. During the pandemic, the log odds of respondents exhibiting unfriendly customer handling behavior who are in the “pre-secondary education” education status category being unfriendly are 87 times lower than those respondents who are in the “illiterate” category (coded 0 and the reference group).
Similarly, most interview participants (n=14) were generally unsatisfied with the treatment they receive from the public transport operators including drivers, staff, coaches, hostesses and ticket sellers. These informants confirmed that customer care and handling behaviors or practices were predominantly unfriendly, unwelcoming, non-sociable, and unapproachable, particularly during the pandemic period. This was mainly because of the higher probability and vulnerability levels of COVID-19 infections in public transportation services and operations. It also resulted from the poor implementation of certain pandemic control and prevention practices, such as disinfection, mask wearing, and vaccination, by all parties involved. They complained about the genuineness of the smiles and treatment from the service staff, and when they sense unfriendly customer handlings they feel irritated. Even though the presence of these public transport operators by itself is considered important by participants to enhance the service, they should care and respect the passengers more. Otherwise customers would consider stop using the public transit services.
6. Discussion
This study aims to investigate how the COVID-19 pandemic and subsequent government response-related factors influenced the driving behavior and customer handling practices of public transport operators in Addis Ababa, Ethiopia during the pandemic, compared to the pre-pandemic period. The pre/post comparative design and regression model were chosen as the analysis method, and the results suggest a strong correlation between the COVID-19 pandemic and restriction measures with driving behavior, such as driving frequency and decision-making, harsh driving behaviors, and unfriendly customer handling. Public transportation driving frequencies were significantly reduced from most of the time and all of the time driving frequencies before the pandemic era to none of the time and a little of the time driving frequencies during the pandemic. This means the driving frequency changed and decreased from 42.6 to 45% in the pre-COVOD period to 3.3%−2.4% during the pandemic period.
The findings revealed that during the pandemic, public transportation drivers' decision-making or choices were significantly influenced and changed in Addis Ababa, Ethiopia. Pandemic infection risk, mask-wearing requirements, social physical distancing, “good airflow while driving,” and “public transportation operation restrictions” were the most significant determinant factors influencing driving decision-making or choice during the pandemic than before the COVID. This reveals that the new and pandemic-related attributes were the more dominant factors than the conventional factors in determining driving decision-making or the choice of transit operators during the pandemic period. The contribution of conventional factors such as road environment, internal vehicle, and weather conditions was insignificant, mainly during the pandemic period.
Accordingly, the reduction in driving decision-making and frequencies during the pandemic is mainly because of the COVID-19 pandemic factors and response measures. Findings are consistent with Tirachini and Cats (2020), Ozbilen et al. (2021), and Tareke and Ashebir (2023) which confirmed that urban settings, social behavior, economics, and urban transportation networks experienced unanticipated impacts and strains by the pandemic and the response actions. More specifically, these new and COVID-19 pandemic-related attributes are the higher reproduction rate of the pandemic, the new infection cases, higher mortality rates due to COVID-19 per day, and the restrictive response measures of the government.
The other driving behavior-related change seen during the pandemic was the development of harsh driving practices by transit operators. Findings indicated that the events involving harsh driving practices, particularly harsh speeding and braking, was higher during the pandemic compared to the pre-COVID scenario. Even though harsh braking and speeding events were common in the pre-pandemic period, they significantly increased during the pandemic.
The increased levels of events involving harsh driving practices during the pandemic were strongly associated with the aforementioned new and pandemic related factors and associated government response measures such as restrictions on transit operations, passenger loading capacity, public events, etc. This finding aligns with the results of existing studies including Lee et al. (2020), Vanlaar et al. (2021), and Dong et al. (2022) that showed that pandemic-related factors, mainly infection reproduction rate, new COVID-19 cases, and fatalities, as well as Greek government response measures, mainly restrictions, could negatively affect risky speeding and distracted driving behaviors.
During the pandemic, higher fear behaviors were seen among car owners and users, passengers, drivers, and others as a result of the daily higher reproduction rate of the pandemic, the new COVID-19 infection cases, the higher COVID-19-related fatality rates, and the strictness of government measures. Similarly, De Vos (2020) and Bouman et al. (2021) indicated that people are well aware of the imminent danger that COVID-19 poses to them personally. Personal standards and moral obligations are impacted by such a mental state since the results are absolute risk aversion and uncertainty. This fear behavior seen in the current study in turn contributed to the lower levels of travel demand, the lower number of vehicles on the road, and reduced traffic flows that finally resulted in the development of these harsh speeding and braking behaviors by transit drivers. Hence, with fewer vehicles ahead, the drivers could increase speed, accelerate and braking more easily during the pandemic as indicated by the findings. This finding is related partly to speeding, an increase was revealed in the spatial extent of speeding, and in the level of speeding as well as statistically significant differences in speeding before and after the COVID-19 outbreak (Lee et al., 2020).
Findings are also similar with Katrakazas et al. (2020) that states, as the traffic volume during the pandemic was lower than before and hence with fewer vehicles ahead, the drivers could maintain higher speeds. Evidence suggests that longer trip distances traveled, driving during risky night-time hours, and urgent driving requests (primarily for Bajajs) contributed to these harsh speeding and braking events during the pandemic.
Findings of the current study were consistent with past studies such as Katrakazas et al. (2021) that revealed the development of harsh acceleration and braking in Greek was due to the lighting conditions as well as the prohibitions imposed by the Greek government during the nighttime and basically decreased trips during risky hours (00:00–05:00).
The contribution of trip distance to harsh driving events is most likely related to the road type. The drivers' speeding and braking patterns with more or less frequent harsh events were due to the fact that the longer trips were driven on the relatively better highways and roads within an urban environment. A substantial contribution to these harsh driving behaviors was also provided by driving during risky nighttime hours, indicating that there was a change in events during nighttime driving ranging from about 00:00 AM to 06:00 AM. This was specifically because of the conditions of street lighting and also the travel bans imposed by the federal and city government during the nighttime, which essentially reduced trips during risky hours. These findings are consistent with Linares-Rendón and Garrido-Cumbrera (2021) that reveals with higher speeds, the drivers were more probable to be involved in a harsh braking event with potential traffic obstacles ahead (i.e., pedestrians, bikes, scooters and traffic control signs or signals), especially during the pandemic that the active transport was increased.
The results of the current study show a correlation of COVID-19 factors, metrics and restrictive measures with harsh speeding and brakings. This association was explained as COVID-19 attributes and restriction measures affected travelers and commuters by leading them to stay at home. Consequently, the stay at home restrictions led to a decreased volume of traffic, and thus the traffic volumes affected directly driving behavior. This phenomenon can verify why the driving requests are also a more significant factor in affecting driving behaviors.
Furthermore, in addition to the new and COVID-19-related factors, the sex, marital, and educational status of public transportation operators were also the most substantial factors for the change in customer handling behaviors during the pandemic. Overall, the customer care and handling behaviors of public transportation operators have been unfriendly, unwelcoming, and not social since March 2020 in Addis Ababa, Ethiopia.
The findings of current study are aligned with Betteley (2020) that showed that hearing-impaired customers have increased difficulty understanding employees with facemasks, as the facemasks limit their ability to read facial expressions and lip movements. However, against the findings of Wu et al. (2021) and Liang and Wu (2022) that found that employees wearing facemasks can improve their physical attractiveness and further enhance customer satisfaction evaluation.
The approaches to and friendliness of customer handling practices were not similar among transit operators. More specifically, when compared to their counterparts, public transportation operators who are married, male, illiterate, and have a pre-secondary education were more likely to provide unfriendly care and handle their customers. The concern for the health of one's love partners and family members by the married operators and the lower level of awareness and knowledge by the illiterate ones could contribute to the unfriendly care and handling of customers. Even though public transit operators and customers wearing facemasks reduce the spread of respiratory droplets during service interactions, which significantly improve the safety, hygiene, trust and reliability of service operations, the unfriendly treatment of customers was primarily due to the increased likelihood and vulnerability levels of COVID-19 infections in public transportation services and operations during the pandemic. It also resulted from the poor implementation of certain pandemic control and prevention practices, such as disinfection, mask wearing, and vaccination, by all parties involved.
Findings are consistent with the concepts of PMT (Rogers, 1983; Cox et al., 2004), hypotheses of the study as well as Abdullah et al. (2020), Oum and Wang (2020), Tsavdari et al. (2022), and Nikolaidou et al. (2023), which revealed that the transportation infrastructure, systems, and operations that once connected us on a global, national, and local level are being used less frequently nowadays, primarily in urban areas, due to COVID-19.
They are evidences to what extent the role and performance of PMT are highly significant for transport and health related studies and the hypotheses of the study are accepted. Coping and threat appraisal variables from this novel adaptation of PMT could help understand the COVID-19-related factors (ex. infection fear, perceived travel risks, safety) that contributed to the different kinds of responses and transit operating or driving decisions. This includes why operators avoided or reduced their transit driving choice and chose not to engage in unsafe or risky operation (a protective pathway), while others chose to operate or drive transit and engage in unsafe or risky operation (a maladaptive pathway).
Severity, vulnerability, and response efficacy were directly related to the perceived pandemic infection fear and travel risks during the pandemic period. Accordingly, the perceived pandemic infection fear, travel risks, and response efficacy were negatively related to the transit driving choice due to unsafe or risky operation for the majority of operators. This means that as infection fear and travel risks increased, severity, vulnerability, and response efficacy operated to increase the protective motivation or protective pathway toward the behavior (i.e., transit driving decision or choice in this study). They showed protective behavior and responses in transit driving choice through the lens of protection motivation theory. Due to the increased probability of driving risks, unsafe services, and poor enforcement of safety measures in place, the frequent transit drivers in the pre-COVID period were likely to reduce their decision of driving transit during and after the pandemic. As a result, public transportation driving behaviors are adversely affected by these precautions in particular and the COVID-19 pandemic factors in general. These results are similar with Kozak et al. (2007), Cahyanto et al. (2016), Li et al. (2021), and Ozbilen et al. (2021) which confirm that when a transport system's seriousness, vulnerability and severity levels are perceived to be higher, the travel risk perceptions are the main factor in discouraging certain transport uses and operating decisions in risky situations.
Overall, the awareness of transit operators and drivers regarding the real threat changed over the period under review. Before the outbreak of the pandemic, the type of awareness and real threat that most significantly influenced their driving decisions and behavior were road environments, internal vehicle conditions, driving experience, and the external weather environment, not COVID-19 pandemic-related factors such as infection severity and risk.
Even though the types of awareness and real threats that were most significant before the pandemic period still exist during the pandemic period, they are not the most significant ones. The COVID-19 pandemic-related factors, such as infection severity, risk, and fear, were found to be the most significant awareness and real threat that determined the driving decision-making and behavior during the pandemic period.
Consequently, the change in awareness regarding the real threat of the phenomenon seen since March 2020 was due to the outbreak of the COVID-19 pandemic. Thus, the pandemic infection's severity, risk, and fear impacted and changed the driving decisions, driving behavior, and customer handling of the transit operators.
Besides, these changes were also outcomes of the subsequent responses taken by governmental agencies, public transport, and shared mobility companies (mainly restriction on public transport operation, service supply, and mobility) and their poor implementation of measures to ensure the safety of operators and passengers, as well as a further spread of COVID-19.
Although the long-term implications and impacts of COVID-19 on the public transportation system and general mobility behavior cannot be fully assessed at the moment, the current study made clear that all possible efforts need to be made to ensure that measures taken by governmental agencies, public transport, and shared mobility companies in order to ensure the safety of operators, drivers, and customers, as well as a further spread of COVID-19, shall be based on comprehensive impact assessments. Unless other measures are also targeted specifically, and depending on the severity of the four phases of the pandemic, the legacy of the COVID-19 pandemic will harm public transportation operations and mobility systems in Addis Ababa, Ethiopia.
In line with the assumptions of the PMT model, new driving decisions, harsh driving behaviors, and customer handling practices were developed due to the COVID-19 pandemic and subsequent measures. Transit operators and drivers were forced to show more restraint in driving, harsh speeding and braking while driving and unfriendly customer treatment during the pandemic compared to what they did in the pre-COVID period.
7. Conclusions
The aim of this study was to understand how the driving and customer handling behavior of transit operators have been influenced by the COVID-19 pandemic and subsequent government responses in Addis Ababa city, Ethiopia, mainly from the perspective of protection motivation theory (PMT). The COVID-19 pandemic factors and response measures were the most important determinant factors affecting the public transportation operation and driving behavior during the pandemic period (or since March 2022).
Compared to the pre-COVID period, the frequency of driving public transportation modes per week decreased significantly during the pandemic period. The major transit driving decision-making determinant factors during the pandemic were the new and COVID-19-related factors and metrics such as perception of pandemic-related risk fears, mask-wearing, and social distancing while driving. However, the influences of conventional determinant factors, including the external weather environment, the road environment, the internal vehicle conditions, and driving experience-related factors, were less important during the pandemic.
New COVID-19-related factors, including fast virus reproduction, infection cases, fatalities, and government restrictions, led to harsh driving behaviors among transit operators. Other factors influenced such behaviors include trip distance, risky night hours, and pandemic requests. COVID-19 factors and restriction measures strongly correlate with harsh speeding and braking, causing travelers and car users to stay home and lower traffic volumes. Furthermore, harsh speeding and braking patterns were more frequent during the pandemic compared to trips with similar occurrences before the pandemic.
During the pandemic, customer handling or care behaviors were impacted by increased vulnerability to infection and inadequate control measures, resulting in unfriendly and unwelcoming interactions. Findings generally revealed that the role and performance of PMT are highly significant for transport operations and health-related studies. Reviving public transportation driving choices requires innovative actions and consideration of COVID-19 factors, including passengers' perceptions, infection likelihood, and preventive measures, as well as internal vehicle conditions and climate. Pandemic restricts travel, public transportation, driving, but essential workers, health, and shopping require travel. Understanding public transportation operations and customer behavior is crucial post-pandemic.
The study emphasizes on the need for the city- and country-level policies for safe, sustainable public transportation during and after COVID. These are pandemic-sensitive, public transportation-priority policies that include subsidies, high transit operation, and service provision levels, a focus on operators, drivers, and passengers' safety, and the promotion of innovation, digital solutions, and e-payment or ticketing. The Avoid-Shift-Improve approach needs to be applied and prioritized differently depending on the severity of the four phases of the pandemic.
Policies should also practically consider not only the dramatic one-sided reduction of public transport operation and service supply but also the demand for mobility, mainly for essential travel. Capacity-building and awareness-raising programs to avoid harsh driving behaviors and unfriendly customer handling need to be considered. Further studies should focus on the socio-economic and environmental effects; consider the impacts on the general mobility and subsidy requirements of public transportation companies or operators with advanced models, more diversified variables and a broader scope with more cities, mainly at the country level.
Data availability statement
The raw data supporting the conclusions of this article will be made available by the authors, without undue reservation.
Ethics statement
Ethical review and approval was not required for the study on human participants in accordance with the local legislation and institutional requirements. Written informed consent from the participants was not required to participate in this study in accordance with the national legislation and the institutional requirements.
Author contributions
The author confirms being the sole contributor of this work and has approved it for publication.
Acknowledgments
The author would like to acknowledge the operators and officials of public transportation modes in Addis Ababa for their data and cooperation. The author would like to thank Professor Samson Kassahun for the continuous advice to publish articles and develop professionally. Furthermore, Ethiopian Civil Service University's assistance through a staff development partial finance program is gratefully acknowledged.
Conflict of interest
The author declares that the research was conducted in the absence of any commercial or financial relationships that could be construed as a potential conflict of interest.
Publisher's note
All claims expressed in this article are solely those of the authors and do not necessarily represent those of their affiliated organizations, or those of the publisher, the editors and the reviewers. Any product that may be evaluated in this article, or claim that may be made by its manufacturer, is not guaranteed or endorsed by the publisher.
References
Abdullah, M., Dias, C., Muley, D., and Shahin, M. A. (2020). Exploring the impacts of COVID-19 on travel behavior and mode preferences. Transp. J. 8, 100255. doi: 10.1016/j.trip.2020.100255
Aletta, F., Brinchi, S., Carrese, S., Gemma, A., Guattari, C., Mannini, L., et al. (2020). Analysing urban trafc volumes and mapping noise emissions in Rome (Italy) in the context of containment measures for the COVID-19 disease. Noise Mapping. 7, 114–122. doi: 10.1515/noise-2020-0010
Apple. (2020). COVID-19–Mobility Trends Reports–Apple. Available online at: https://www.apple.com/covid19/mobility
Betteley, C. (2020). Coronavirus: Mask Wearing “Risks Isolating” Deaf People. BBC News. Available online at: https://www.bbc.com/news/uk-wales-52659083
Boer, H., and Seydel, E. R. (2005). “Protection motivation theory,” in Predicting Health Behavior, Conner, M., Norman, P., (eds). Maidenhead: Open University Press. p. 81–126.
Bouman, T., Steg, L., and Dietz, T. (2021). Insights from early COVID-19 responses about promoting sustainable action. Nat. Sustainab. 4, 194–200. doi: 10.1038/s41893-020-00626-x
Bucsky, P. (2020). Modal share changes due to COVID-19: the case of Budapest. Transp. Res. Interdiscip Perspect. 8, 100141. doi: 10.1016/j.trip.2020.100141
Cahyanto, I., Wiblishauser, M., Pennington-Gray, L., and Schroeder, A. (2016). The dynamics of travel avoidance: the case of Ebola in the U.S. Tour. Manag. Persp. 20, 195–203. doi: 10.1016/j.tmp.2016.09.004
Carter, D. (2020). Effects of COVID-19 Shutdown on Crashes and Travel in NC. North Carolina, NC: Department of Transportation. Available online at: http://www.trb.org/ElectronicSessions/Blurbs/180648.aspx (accessed June 21, 2022).
Central Statistical Agency [Ethiopia] ICF International (2017). Ethiopia Demographic and Health Survey 2016. Central Statistical Agency, The DHS Program and ICF International, Addis Ababa, Ethiopia and Rockville, Maryland, United States. Available online at: https://www.unicef.org/ethiopia/media/456/file/EDHS%202016.pdf (accessed April 22, 2022).
Chen, A., and Lu, Y. (2021). Protective behavior in ride-sharing through the lens of protection motivation theory and usage situation theory. Int. J. Info. Manag. 61, 102402. doi: 10.1016/j.ijinfomgt.2021.102402
Cochran, W. G. (1977). Sampling Techniques. 3rd Edition. New York: John Wiley and Sons. Available online at: https://www.scirp.org/(Si43dyn45teexjx455qlt3d2q)/reference/ReferencePapers.aspx?ReferenceID=1390266
COVID-19 Map-Johns Hopkins Coronavirus Resource Center (2021). Johns Hopkins Coronavirus Resource Center. Available online at: https://coronavirus.jhu.edu/map.html%E2%80%9D%20%E2%80%9C https://arcg.is/XvuSX
Cox, D. N., Koster, A., and Russell, C. G. (2004). Predicting intentions to consume functional foods and supplements to offset memory loss using an adaptation of protection motivation theory. Appetite. 43, 55–64. doi: 10.1016/j.appet.2004.02.003
de Haas, M., Faber, R., and Hamersma, M. (2020). How COVID-19 and the Dutch ‘intelligent lockdown' change activities, work and travel behaviour: evidence from longitudinal data in the Netherlands. Transp. Res. Interdiscip. Perspect. 6, 100150. doi: 10.1016/j.trip.2020.100150
De Vos, J. (2020). The effect of COVID-19 and subsequent social distancing on travel behavior. Transp. Res. Interdiscip. Perspect. 5, 1–8. doi: 10.1016/j.trip.2020.100121
Dong, X., Xie, K., and Yang, H. (2022). How did COVID-19 impact driving behaviors and crash Severity? A multi-group structural equation modeling. Accident Analy. Prevent. 172, 106687. doi: 10.1016/j.aap.2022.106687
Gebre, G. (2021). Modeling Public Transport Users' Trip Production in Hawassa City, Ethiopia. Hawassa: Unimas. My. doi: 10.31224/osf.io/cgy52
Global Road Safety Partnership (GRSP). (2023). Bloomberg Initiative for Global Road Safety | GRSP | Global Road Safety Partnership. GRSP | Global Road Safety Partnership | Working for a World Free of Road Crash Death and Injury. Available online at: https://www.grsproadsafety.org/programmes/bloomberg-initiative-global-road-safety/
Hale, T., Angrist, N., Cameron-Blake, E., Hallas, L., Kira, B., Majumdar, S., et al. (2020). “Variation in government responses to COVID-19,” in BSG Working Paper Series. Oxford: Blavatnik School of Government. University of Oxford.
Harbeck, E., Glendon, I., and Hine, T. (2018). Young driver perceived risk and risky driving: a theoretical approach to the “fatal five”. Transp. Res. Part F. 58, 392–404. doi: 10.1016/j.trf.2018.06.018
Heath, R., Mansuri, G., Rijkers, B., Seitz, W. H., and Sharma, D. (2020). Measuring Employment: Experimental Evidence from Urban Ghana. In World Bank, Washington, DC eBooks. doi: 10.1596/1813-9450-9263
Hotle, S., Murray-Tuite, P., and Singh, K. (2020). Influenza risk perception and travel-related health protection behavior in the US: insights for the aftermath of the COVID-19 outbreak. Transp. Res. Interdiscip. Perspect. 5, 100127. doi: 10.1016/j.trip.2020.100127
Howard, G. S. (1980). Response-shift bias: a problem in evaluating interventions with pre/post-self-reports. Eval. Rev. 4, 93–106. doi: 10.1177/0193841X8000400105
Huang, Y., and Meng, S. (2019). Automobile insurance classifcation ratemaking based on telematics driving data. Deci. Support Syst. 127, 113156. doi: 10.1016/j.dss.2019.113156
IBM Corp (2016). IBM SPSS Statistics for Windows (Version 24) [Computer software]. Armonk, NY: IBM Corp.
Institute for Transportation Development Policy. (2022). Digital Van Service for Addis Ababa. Institute for Transportation and Development Policy (ITDP). Available online at: https://africa.itdp.org/publication/digital-van-service-for-addis-ababa/ (accessed November 9, 2022).
Katrakazas, C., Michelaraki, E., Sekadakis, M., and Yannis, G. (2020). A descriptive analysis of the effect of the COVID-19 pandemic on driving behavior and road safety. Transp. Res. Interdiscip. Perspect. 7, 100186. doi: 10.1016/j.trip.2020.100186
Katrakazas, C., Michelaraki, E., Sekadakis, M., Ziakopoulos, A., Kontaxi, A., and Yannis, G. (2021). Identifying the impact of the COVID-19 pandemic on driving behavior using naturalistic driving data and time series forecasting. J. Safety Res. 78, 189–202. doi: 10.1016/j.jsr.2021.04.007
Kim, K. (2021). Impacts of COVID-19 on transportation: Summary and synthesis of interdisciplinary research. Transp. Res. Interdiscip. Perspect. 9, 100305. doi: 10.1016/j.trip.2021.100305
Klatt, J., and Taylor-Powell, E. (2005). Using the retrospective post-then-pre design. Quick tips, #27. Madison: University of Wisconsin-Extension.
Kozak, M., Crotts, J. C., and Law, R. (2007). The impact of the perception of risk on international travellers. Int. J. Tourism Res. 9, 233–242. doi: 10.1002/jtr.607
Lee, J., Porr, A., and Miller, H. (2020). Evidence of Increased Vehicle Speeding in Ohio ' s Major Cities during the COVID-19 Pandemic, (Columbus, OH: Findings Press) p. 1–6.
Li, Z., Zhang, X., Yang, K., Singer, R., and Cui, R. (2021). Urban and rural tourism under COVID-19 in China: research on the recovery measures and tourism development. Tourism Rev. 76, 718–736. doi: 10.1108/TR-08-2020-0357
Liang, L., and Wu, G. (2022). Effects of COVID-19 on customer service experience: Can employees wearing facemasks enhance customer-perceived service quality? J. Hospital. Tour. Manag. 50, 10–20, doi: 10.1016/j.jhtm.2021.12.004
Linares-Rendón, F., and Garrido-Cumbrera, M. (2021). Impact of the COVID-19 pandemic on urban mobility: a systematic review of the literature. J. Transp. Health. 22, 101089. doi: 10.1016/j.jth.2021.101225
Lisheng, J., Baicang, G., Yuying, J., and Qiang, H. (2021). Analysis on the influencing factors of driving behaviours based on theory of planned behaviour. Adv. Civil Eng. (2021) 6687674, 13. doi: 10.1155/2021/6687674
Mashrur, S.k. Md., Wang, K., Loa, P., Hossain, S., and HabibKh, N. (2022). Application of protection motivation theory to quantify the impact of pandemic fear on anticipated postpandemic transit usage. Transp. Res. Record. 2677, 267–286. doi: 10.1177/03611981211065439
Michelaraki, E., Sekadakis, M., Katrakazas, C., Ziakopoulos, A., and Yannis, G. (2021). “A four-country comparative overview of the impact of COVID-19 on traffic safety behavior,” in Proceedings of the 10th International Congress on Transportation Research (Rhodes). Available online at: https://www.nrso.ntua.gr/geyannis/pub/pc417-a-four-country-comparativeoverview-of-the-impact-of-covid-19-on-traffic-safety-behavior/
Nikolaidou, A., Kopsacheilis, A., Georgiadis, G., Noutsias, T., Politis, I., and Fyrogenis, I. (2023). Factors affecting public transport performance due to the COVID-19 outbreak: a worldwide analysis. Cities. 134, 104206. doi: 10.1016/j.cities.2023.104206
Oum, T. H., and Wang, K. (2020). Socially optimal lockdown and travel restrictions for fighting communicable virus including COVID-19. Transp. Policy. 96, 94–100. doi: 10.1016/j.tranpol.2020.07.003
Our World in Data (2020). Coronavirus Pandemic (COVID-19). Available online at: https://ourworldindata.org/coronavirus.
Ozbilen, B., Slagle, K. M., and Akar, G. (2021). Perceived risk of infection while traveling during the COVID-19 pandemic: insights from Columbus, OH. Transp. Res. Interdiscip. Perspect. 10, 100326. doi: 10.1016/j.trip.2021.100326
Parady, G., Taniguchi, A., and Takami, K. (2020). Travel behavior changes during the COVID-19 pandemic in Japan: analyzing the effects of risk perception and social influence on going-out self-restriction. Transp. Res. Interdiscip. Perspect. 7, 100181. doi: 10.1016/j.trip.2020.100181
Rivera, D. (2004). The use of a proposed modified model of planned behavior to predict the beef consumption of young adult college students. Texas Tech University, Lubbock, TX, United States. Available online at: https://ttu-ir.tdl.org/handle/2346/17973Oo (accessed July 9, 2021).
Rogers, R. W. (1975). A protection motivation theory of fear appeals and attitude change. J. Psychol. 91, 93–114. doi: 10.1080/00223980.1975.9915803
Rogers, R. W. (1983). “Cognitive and physiological processes in fear appeals and attitude change: a revised theory of protection motivation,” in Social Psychophysiology: A Sourcebook, Cacioppo, J. T., and Petty, R. E. (eds.). New York: Guilford Press. p. 153–176.
Saladié, Ò., Bustamante, E., and Gutiérrez, A. (2020). Transportation research interdisciplinary perspectives COVID-19 lockdown and reduction of traffic accidents in Tarragona province, Spain. Transp. Res. Interdiscip. Perspect. 8, 100218. doi: 10.1016/j.trip.2020.100218
Sekadakis, M., Katrakazas, C., Michelaraki, E., Kehagia, F., and Yannis, G. (2021). Analysis of the impact of COVID-19 on collisions, fatalities and injuries using time series forecasting: The case of Greece. Accident Analy. Prevent. 162, 106391. doi: 10.1016/j.aap.2021.106391
Sharif, A., and Reza Khavarian-Garmsir, A. (2020). The COVID-19 pandemic: impacts on cities and major lessons for urban planning, design, and management. Sci. Total Environ. 749, 1–3. doi: 10.1016/j.scitotenv.2020.142391
Shilling, F., and Waetjen, D. (2020). Special Report (Update): Impact of COVID19 mitigation on numbers and costs of California Trafc Crashes. Available online at: https://trid.trb.org/view/1701950
Sudman, S., Bradburn, N., and Schwarz, N. (1996). Thinking About Answers: The Application of Cognitive Processes to Survey Methodology. San Francisco, CA: Jossey-Bass.
Tareke, K. M., and Ashebir, G. M. (2023). Impact of COVID-19 pandemic on the people's choice of urban public transportation modes and mobility in Addis Ababa and Hawassa city, Ethiopia. Urban Plann. Transp. Res. 11, 1. doi: 10.1080/21650020.2023.2193233
Team, T. (2022). Binary Logistic Regression- a tutorial. Digital Schools. Available online at: https://digitaschools.com/binary-logistic-regression-introduction/
Tenenhaus, M., Vinzi, V. E., Chatelin, Y.-M., and Lauro, C. (2005). Pls path modeling. Comput. Stat. Data Anal. 48, 159–205. doi: 10.1016/j.csda.2004.03.005
Tirachini, A., and Cats, O. (2020). COVID-19 and public transportation: current assessment, prospects, and research needs. J. Public Transport. 22, 1. doi: 10.5038/2375-0901.22.1.1
Tsavdari, D., Klimi, V., Georgiadis, G., Fountas, G., and Basbas, S. (2022). The anticipated use of public transport in the post-pandemic era: insights from an academic community in Thessaloniki, Greece. Soc. Sci. 11, 400. doi: 10.3390/socsci11090400
United Nations Human Settlements Programme (2020). Sustainable Development of Hawassa City Cluster. Hawassa City Strategic Plan 2018–2020. Available online at: https://ourcityplans.unhabitat.org/planning-experiences/sustainable-development-hawassacity-cluster
Vanlaar, W. G. M., Woods-Fry, H., Barrett, H., Lyon, C., Brown, S., Wicklund, C., et al. (2021). The impact of COVID-19 on road safety in Canada and the United States. Accident Analy. Prevent. 160, 106324. doi: 10.1016/j.aap.2021.106324
Wang, K., Liu, Y., Mashrur, S. M., Loa, P., and Habib, K. N. (2021). COVID-19 influenced households' interrupted travel schedules (COVHITS) survey: lessons from the fall 2020 cycle. Transport Policy. 112, 43–62. doi: 10.1016/j.tranpol.2021.08.009
WHO (2020). WHO African Region COVID-19 Dashboard. Available online at: https://arcg.is/XvuSX
WHO Coronavirus Disease (COVID-19) Dashboard With Vaccination Data. (n.d.). World Health Organization. Available online at: https://covid19.who.int/region/afro/country/et (accessed June 19 2022)..
World Bank (2015). Enhancing Urban Resilience: Addis Ababa, Ethiopia. Available online at: https://documents1.worldbank.org/curated/en/559781468196153638/pdf/Addis-Ababa-Enhancing-Urban-Resilience-city-strength-resilient-cities-program.pdf (accessed December 20, 2020).
Wu, G., Liang, L., and Gursoy, D. (2021). Effects of the new COVID-19 normal on customer satisfaction: can facemasks level off the playing field between average-looking and attractive-looking employees? Int. J. Hospitality Manag. 97. doi: 10.1016/j.ijhm.2021.102996
Wubneh, M. (2013). Addis Ababa, Ethiopia – Africa's diplomatic capital. Cities. 35, 255–269. doi: 10.1016/j.cities.2013.08.002
Yadegaridehkordi, E., Nizam, M. H., Nasir, N., Fazmidar Binti Mohd, N.oor, Shuib, L., and Badie, N. (2018). “Predicting the adoption of cloud-based technology using fuzzy analytic hierarchy process and structural equation modelling approaches,” Applied Soft Computing, vol. 66, pp. 77–89. doi: 10.1016/j.asoc.2017.12.051
Zheng, D., Luo, Q., and Ritchie, B. W. (2021). Afraid to Travel after COVID-19? Self-Protection, Coping and Resilience against Pandemic ‘Travel Fear.' Tourism Management, Vol. 83, p. 104261. doi: 10.1016/j.tourman.2020.104261
Zhu, N., Zhang, D., Wang, W., Li, X., Yang, B., Song, J., et al. (2020). “A Novel Coronavirus from Patients with Pneumonia in China, 2019.” New England Journal of Medicine, 382(8), –No match found–727–733. doi: 10.1056/NEJMoa2001017
Keywords: COVID-19 pandemic, public transportation operators, driving behavior, customer handling, protection motivation theory, transport policy, urban planning
Citation: Tareke KM (2023) How the driving behaviors and customer handling of public transportation operators have been impacted by the COVID-19 pandemic in Addis Ababa, Ethiopia: the perspective of protection motivation theory? Front. Sustain. Cities 5:1140838. doi: 10.3389/frsc.2023.1140838
Received: 09 January 2023; Accepted: 06 June 2023;
Published: 26 June 2023.
Edited by:
Emanuele Crisostomi, University of Pisa, ItalyReviewed by:
Lucky Nugroho, Mercu Buana University, IndonesiaDastan Bamwesigye, Mendel University in Brno, Czechia
Copyright © 2023 Tareke. This is an open-access article distributed under the terms of the Creative Commons Attribution License (CC BY). The use, distribution or reproduction in other forums is permitted, provided the original author(s) and the copyright owner(s) are credited and that the original publication in this journal is cited, in accordance with accepted academic practice. No use, distribution or reproduction is permitted which does not comply with these terms.
*Correspondence: Kassa Moges Tareke, Kassamoges19@gmail.com