Temporal Evolution of Green Stormwater Infrastructure Strategies in Three US Cities
 Lauren E. McPhillips
 A. Marissa Matsler
- 1Global Institute of Sustainability, Arizona State University, Tempe, AZ, United States
- 2Cary Institute of Ecosystem Studies, Millbrook, NY, United States
Over the last several decades, interest in green stormwater infrastructure (GSI) has rapidly increased, particularly given its potential to provide stormwater management in conjunction with other ecosystem services and co-benefits such as urban heat island mitigation or habitat provision. Here we explore the implementation of GSI in three US cities – Baltimore (Maryland), Phoenix (Arizona), and Portland (Oregon). We examine the trends in GSI construction over several decades, highlighting changes in implementation rates and GSI types with concurrent regulatory and economic changes. Additionally, we discuss the implications of these GSI portfolios for ecosystem service delivery in urban areas. Results indicate that Portland's quantity of GSI is approximately ten times greater than the quantity of GSI in Phoenix or Baltimore. However, Baltimore has the most diverse portfolio of GSI types. In Phoenix, regional stormwater policies focused on flood control have led to retention basins being the dominant GSI type for decades. In contrast, Portland and Baltimore both have had substantial changes in their GSI portfolios over time, with transitions from detention or retention basins and underground facilities toward filters, infiltration facilities, and swales. These changes favor increased water quality function as well as provision of other ecosystem services. Additionally, we find evidence that each city followed a different GSI implementation pathway, with Portland's combined sewer overflow program influencing initial development of GSI, while state legislation and regional water quality pressures played a major role in Baltimore's GSI development. By studying the evolution of GSI in these different cities, we can see the variability in stormwater management trajectories and how they manifest in different suites of benefits. We hope that continued research of GSI implementation and performance will identify opportunities for future improvement of these infrastructures.
Introduction
Over the last century there has been an evolution in management of urban stormwater. Increased impervious surface area from growing cities has generated more and more runoff during storm events, leading to the development of extensive networks of underground pipes to efficiently route water away from buildings and other infrastructural systems (Kaushal et al., 2015; Hale, 2016). As these piped stormwater systems expanded, ecological research revealed the detrimental impacts of this strategy on downstream water bodies, including damaging erosion, increased flooding, and poor water quality (Walsh et al., 2005). To mitigate some of these negative environmental effects, local and federal regulations now require stormwater control measures (SCMs) that detain or retain stormwater [American Society of Civil Engineers Environmental and Water Resources, Institute and Water Environment Federation (ASCE EWRI/ WEF), 2012].
However, SCMs did not develop evenly across cities in the US and a wide range of different strategies have been employed. In this paper, we organize the variety of SCMs along an ecological to technological, or green to gray, gradient that we refer to as the eco-techno spectrum (Figure 1; adapted from Matsler, 2017). The highly technological or engineered strategies found on the right-hand side of the spectrum were initially common, such as sediment traps or drywells. These technologies are designed to provide a single service effectively and efficiently. They are usually built underground and urbanites do not interact directly with the facilities. In recent years there has been growing interest in SCMs that contain both ecological and technological components. The inclusion of ecological components recognizes the long-acknowledged social and ecological benefits of greenspaces in cities (Tzoulas et al., 2007; Melosi, 2008; Eisenman, 2013). Hybrid facilities therefore have potential to provide social benefits [including increased recreation (Nazir et al., 2014) and mental health improvements (Tzoulas et al., 2007)] along with environmental services beyond stormwater management [including protecting endangered species (McIntyre et al., 2015) and mitigating the urban heat island effect (Emmanuel and Loconsole, 2015)]. Cost-effectiveness of hybrid systems has been a primary factor in their current popularity (Montalto et al., 2007; American Rivers, 2012; Wang et al., 2013), especially as cash-strapped municipalities face demands to “green” and improve the resilience of their cities (Depietri and McPhearson, 2017; Grabowski et al., 2017). This growing interest in hybrid or ecological stormwater solutions parallels the wastewater treatment industry (Schneider, 2011). Features like constructed wetlands have been implemented in place of or in addition to traditional wastewater treatment systems (Kivaisi, 2001; Vymazal, 2010) in order to harness plant or microbially-mediated removal of various contaminants (Schröder et al., 2007). Opponents of hybrid ecological-technological approaches to stormwater management point to the expense of maintaining living systems, uncertainty in performance, and the lack of expertise in designing and constructing effective facilities with such nascent technologies (Carlet, 2015; Matsler, 2017). These issues must be addressed in order for GSI implementation to become mainstreamed.
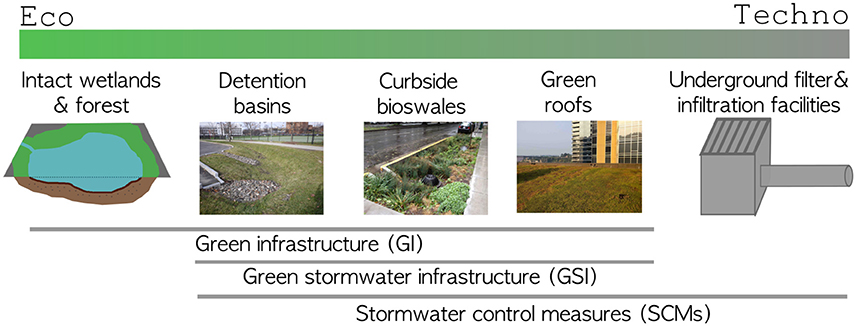
Figure 1. Eco-techno spectrum representing the range of different types of landscape features which play a role in urban stormwater management.
While there are multiple terms in use to describe hybrid ground-level SCMs (Mell, 2013; Young et al., 2014; Fletcher et al., 2015), here we refer to them as green stormwater infrastructure (GSI). As seen in Figure 1, GSI facilities are found across the eco-techno spectrum but are absent at the far “techno” extreme due to their inclusion of ecological components. In addition to an expansion of facilities across the eco-techno spectrum, there has also been a transition in landscape-level planning and spatial implementation of stormwater management in the US. This concept is often called Low Impact Development (LID) and has motivated a move from larger, more centralized SCMs to smaller, more decentralized SCMs located near where runoff is generated (Coffman et al., 1999; Davis, 2005; Shuster et al., 2008). LID additionally involves non-structural stormwater management strategies like downspout disconnection and impervious surface reduction.
While there is a general notion that GSI implementation has been increasing, there has been little systematic analysis of the quantity of different types of GSI that are being implemented or the factors are driving different implementation strategies. This paper builds on the few studies that have begun to do this work. There is a growing body of work examining the general motivations behind transitions to GSI. These studies have identified a complex mix of factors influencing GSI implementation in the US and elsewhere including funding availability, regulatory frameworks, establishment of specific goals related to GSI in planning documents, local leadership, and concerns about GSI performance and cost-effectiveness (Roy et al., 2008; Brown et al., 2013; Chaffin et al., 2016; Flynn and Davidson, 2016; Hopkins et al., 2018). However, few studies have examined the various influences behind these transitions in concert with detailed examination of the temporal changes in implementation of particular types of SCMs. Hale (2016) highlighted differing implementation trajectories of stormwater infrastructure among three Utah cities and increasing recent implementation of GSI such as retention basins but did not delve into particular types of GSI. Here we add a comparative temporal analysis of many specific types of GSI facilities that are increasingly popular across the US.
It is important to better understand what sort of GSI portfolios exist in various cities since type of GSI can have substantial impacts on the function and services provided. For example, bioretention basins are more effective at reducing the total quantity of stormwater entering downstream water bodies when compared with retention ponds (Driscoll et al., 2015). In the last 15 years, GSI facilities have been evaluated to understand their ability to meet regulatory requirements, such as water volumetric reduction and water quality improvement (Ahiablame et al., 2012; Vogel and Moore, 2016), as well as their ability to provide co-benefits beyond primary design goals, such as urban heat island mitigation or habitat provision (Oberndorfer et al., 2007; Heusinger and Weber, 2017). To build on existing GSI research, the objectives of this study are to characterize implementation of GSI in multiple cities with different climatic settings, sewer system types and development trajectories, in order to (1) understand some of the regulatory factors that influence GSI implementation, (2) ascertain what ratio of different GSI facility types have ultimately been implemented in different contexts, and (3) explore the potential implications of these GSI portfolios on environmental function and benefits.
Methods
Site Description
The cities included in this analysis are Baltimore, Maryland; Phoenix, Arizona; and Portland, Oregon, all located in the United States (Figure 2). These cities vary in their climatic and biophysical settings as well as in their storm sewer infrastructure (Table 1). Phoenix is located in a semi-arid landscape with precipitation concentrated in a summer monsoon season, while Baltimore and Portland both receive several times more precipitation. Additionally, Baltimore and Phoenix both have separated storm sewer systems, while much of Portland's storm sewers are combined with sanitary sewers.
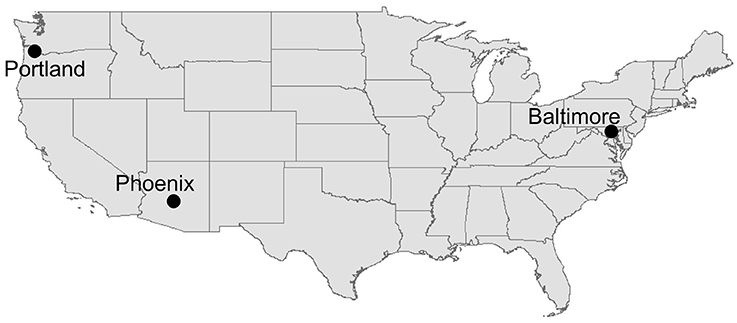
Figure 2. Map of study cities.
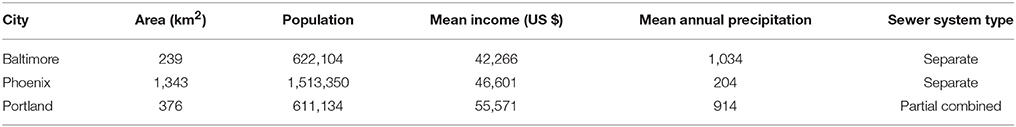
Table 1. Relevant city characteristics (as of 2017).
Data Acquisition
SCM Inventories
We obtained databases of SCMs from each city's water or environmental services staff in mid-2017. Rather than restricting only to GSI, we also kept records of other SCMs such as drywells and underground detention facilities, particularly to emphasize the transition between different types of SCMs over time across the entire eco-techno spectrum (Figure 1). Parameters in the databases included type of SCM (e.g., swale) and year of construction. Multiple types of SCM were condensed into more generalized classes such that structurally similar facility types in each of the three cities were similarly characterized (Table 2). For example, bioswales and grass swales were both classified as a “swale.” The classes used here include filters, green roofs, infiltration facilities, basins, porous pavement, swales, underground filters, and other (for SCMs that do not fall under any of the previous categories). These classes were inspired by a recently proposed taxonomy which aggregates SCMs based on similar functionality [American Society of Civil Engineers Environmental and Water Resources, Institute and Water Environment Federation (ASCE EWRI/ WEF), 2012]. We did choose to differentiate some similarly functioning facilities which are structurally different such as filters and green roofs. Year of construction was not available for all features in each city. For Baltimore and Phoenix, construction year is available for more than 95% of SCMs. Portland has data on construction year available for 60% of its SCMs, with missing years relatively evenly distributed across different types, except for vegetated ditches, which were classified here as “other SCM” (Table 2). Appropriate caveats are provided in the section on Portland's GSI timeline to address this larger data gap. Information on SCM area, capacity, or contributing runoff area was not uniformly available across all the cities. SCM area was available for Baltimore and Phoenix. We present this information to provide some insight into changes in SCM size.
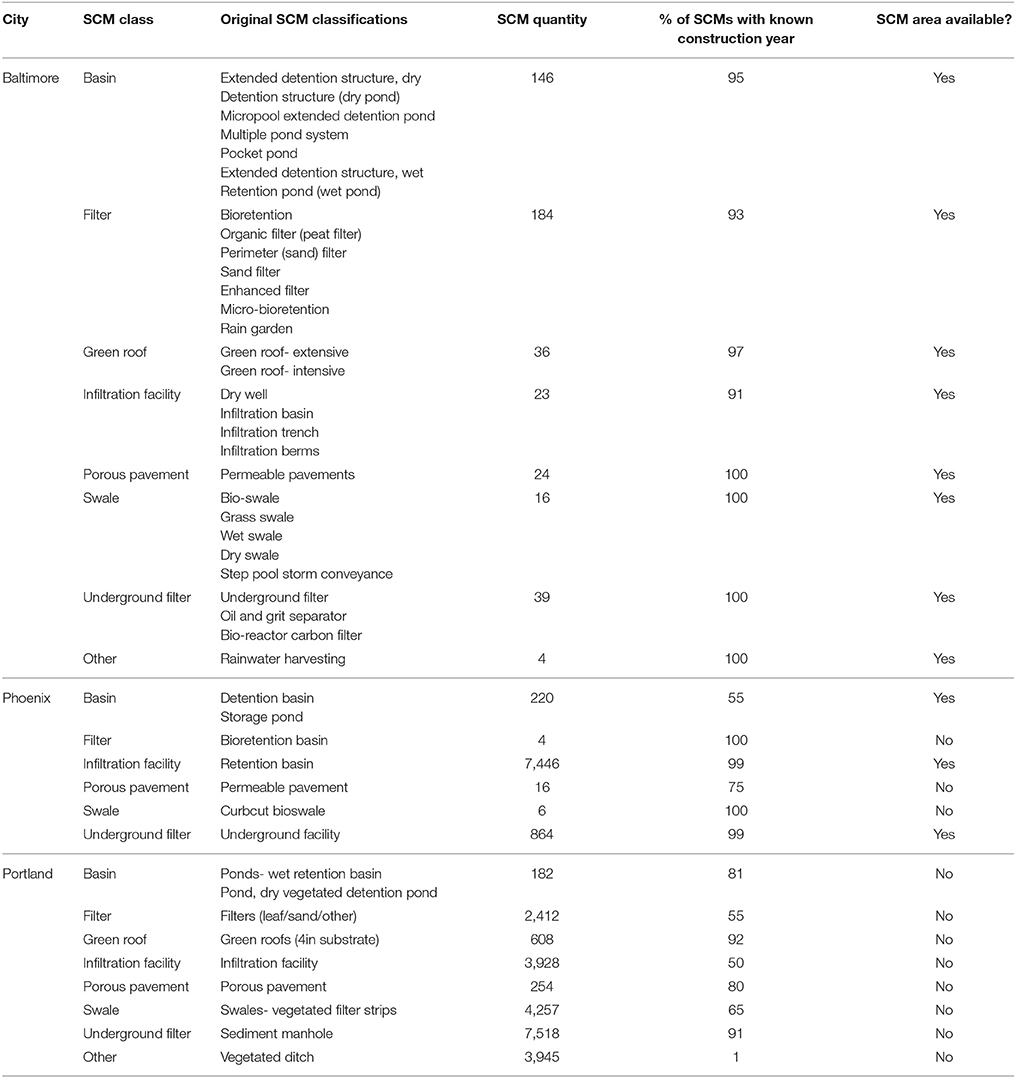
Table 2. Summary of Stormwater Control Measure (SCM) data, including the original SCM classifications according to each city, the new classification used in this analysis (which often aggregates multiple original classes), total quantity of SCMs, and availability of associated characteristics.
For each city, we generated a portfolio of SCMs by aggregating all installations of a given SCM type over time. Total number of SCM installations was normalized by the current official area of the city, in order to control for relative differences in city size, yielding a density of SCMs. Diversity of SCM portfolios was assessed using Shannon's index, which incorporates both richness (here, the number of SCM types) and evenness (relative numbers of facilities of each type) (Magurran, 1988). Additionally, we developed a temporal record of SCMs for each city using the provided installation years.
Contextual Data
Additional data were aggregated to provide context for observed differences in SCM trajectories. Since new development and addition of impervious surface may trigger regulatory requirements to implement SCMs, we derived temporal records of impervious surface using the 2011 National Land Cover Dataset (NLCD) along with cadastral data obtained from each city (Hale, 2016). The cadastral data notes the year in which each parcel was built. We assumed that impervious surface for a given parcel has not changed since initial construction and assigned the impervious surface derived for a given parcel to the built year. Thus for each year, change in impervious surface was calculated based on impervious surface in any parcels built that year. This method cannot account for changes in a parcel over time due to additional development or demolition, but these changes are expected to account for a small fraction of overall change in impervious surface.
In addition to impervious surface, we provide a timeseries of population density for each city. Population data were obtained from the United States Census for each city and data were normalized by city area in order to derive the density.
We also provide an exploratory look at potential regulatory influences on GSI evolution. To do this, we consulted municipal planning documents and reports as well as communicated directly with local practitioners to develop a timeline of major federal and local regulations or other important events that happened near some of the observed patterns in SCM implementation.
Results and Discussion
Temporal Trends
Baltimore
Baltimore's record of SCM implementation spans from 1985 to the present. It represents almost exclusively GSI, except for a small fraction of underground filters. When examining the change in GSI construction during this period, we see two key periods of GSI development (Figure 3). During the late 1980s and 1990s, there was implementation of more traditional centralized GSI strategies such as basins. Moving into the late 2000s and 2010s, there was another pulse of GSI implementation, with the most recent years having the greatest numbers of features built per year of any thus far for Baltimore. The types of GSI implemented during this period largely changed to more decentralized or Low Impact Development (LID) strategies, including filters, green roofs, porous pavement, and swales. These facilities tend to be smaller in area than those implemented in the late 1980s and 1990s (Figure 4A). The combination of smaller area but greater quantity of facilities led to similar total area of stormwater retention facilities implemented during these two major periods (Figure 4B).
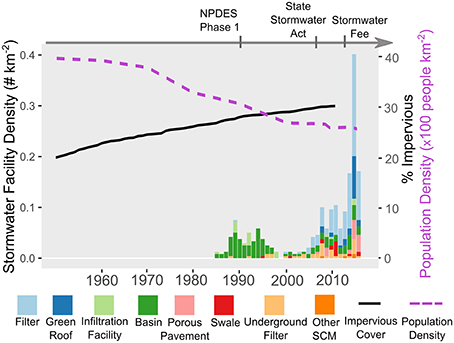
Figure 3. A timeseries of SCM construction in Baltimore, represented as the number of facilities built during a given year, normalized by the current area of the city. The arrow at the top denotes important events influencing stormwater management, the black line graph represents impervious surface change in Baltimore over several decades, and the dotted purple line graph indicates change in population density.
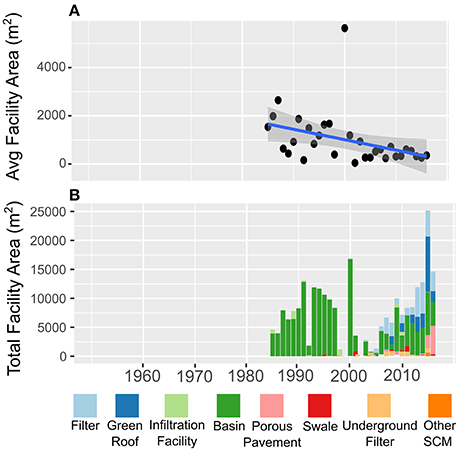
Figure 4. (A) Average area of constructed SCMs for each year of record in Baltimore, with a linear model and 95% confidence intervals indicated and (B) total area of constructed SCMs for each year.
The initial pulse of GSI implementation, which included basins and filters, was in part a response to the initiation of federal stormwater management requirements for large municipalities that emphasized consideration of stormwater as a non-point source of pollution. Beginning in 1990, Phase 1 of the stormwater program under the National Pollution Discharge Elimination System (NPDES) targeted municipal separate storm sewer systems (MS4s) in cities or certain counties with over 100,000 residents [US Environmental Protection Agency (US EPA), 2015]. It required development of stormwater management programs, and associated implementation of appropriate control measures, in each MS4. Prior to this federal rule, Maryland state code also motivated GSI implementation through broad acknowledgment that management of stormwater runoff was necessary to protect the integrity of the state's water resources (MD Department of the Environment, 2009), but the National Pollution Discharge Elimination System mandates increased the focus on managing stormwater specifically for water quality and drove retrofits of appropriate SCMs throughout the MS4 (Stack, email communications).
Several factors played a role in the more recent surge in GSI construction in Baltimore in which there was a transition in GSI types. In 2000, the Maryland Stormwater Management Manual was released, which provided design recommendations for a range of GSI, and required stormwater management with most new development and redevelopment. Passage of the Maryland Stormwater Management Act in 2007 mandated the implementation of newer decentralized GSI features, referred to as Environmental Site Design, a concept similar to LID, in all development to the maximum extent practicable (MD Department of the Environment, 2007). This means that developers are required to show that Environmental Site Design will not work on a proposed site before being able to implement any traditional SCMs. Environmental Site Design includes use of small-scale GSI and better site planning to mimic hydrology of natural systems and minimize the impacts of development on water resources. Given the minimal increases in impervious surface and thus new development (Figure 3), much of the documented GSI construction has occurred with redevelopment of parcels in Baltimore or as specific retrofits for stormwater management. Environmental Site Design requirements were prompted by Total Maximum Daily Loads (TMDLs) established for various pollutants for the Chesapeake Bay (Baltimore's ultimate receiving water body). Additionally, Environmental Site Design promoted “less obtrusive facilities that are more aesthetic and less burdensome on those responsible for long-term maintenance and performance” (MD Department of the Environment, 2009). This new emphasis on Environmental Site Design was incorporated into a 2009 update of the Maryland Stormwater Management Manual (MD Department of the Environment, 2009), and was an important driver of the exploration of GSI facilities on the “eco” end of the eco-techno spectrum (Figure 1) in Baltimore. In 2013, a stormwater remediation fee began which requires payment by property owners based on impervious cover of land parcels (Baltimore City Department of Public Works, 2017). Depopulation of Baltimore (Figure 3) and other “Rust Belt” cities in the US has motivated establishment of such stormwater fees to mitigate losses in the overall tax base and thus funds for maintaining and upgrading storm sewer infrastructure (Keeley et al., 2013). This provided additional revenue to fund maintenance of existing SCMs as well as support development of new features. GSI installation is also incentivized by a reduced fee for property owners who install GSI on their parcel.
Phoenix
Phoenix's record of SCM implementation spans from 1971 to the present. A strong increase in annual SCM construction began in the early 1990s (Figure 5). This was followed by a precipitous decline in the late 2000s, and a smaller pulse of SCM construction in the 2010s. In terms of types of SCMs, Phoenix is dominated by infiltration facilities (which are locally called retention basins). While there were some very large (in terms of area) SCMs implemented in the 1980s, average area of SCMs has not changed substantially over time (Figure 6A). Thus, total area of SCMs constructed per year (Figure 6B) largely mirrors patterns in SCM quantity constructed per year (Figure 5).
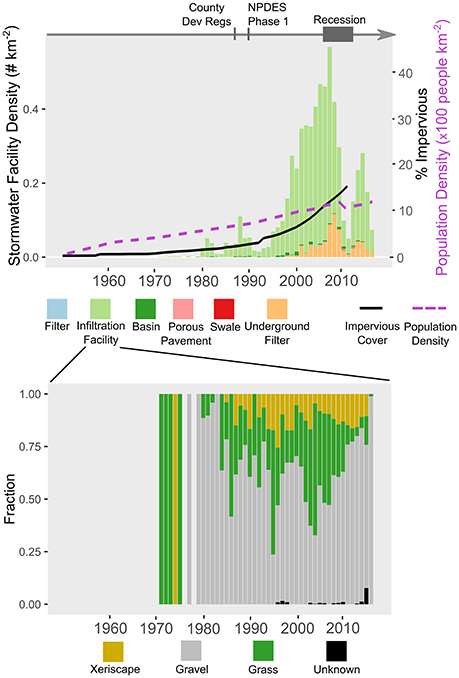
Figure 5. A timeseries of SCM construction in Phoenix, represented as the number of facilities built during a given year, normalized by the current area of the city. The arrow at the top denotes important events influencing stormwater management, the black line graph represents impervious surface change in Phoenix over several decades, and the dotted purple line graph indicates change in population density. An additional panel below depicts the fraction of different ground cover types for infiltration facilities (specifically retention basins). “Unknown” cover indicates facilities where data on the type of ground cover was not available.
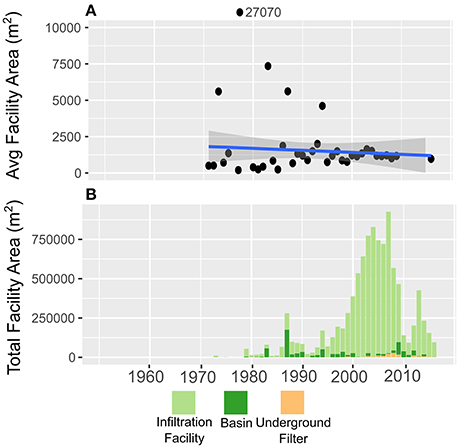
Figure 6. (A) Average area of constructed SCMs for each year of record in Phoenix, with a linear model and 95% confidence intervals indicated and (B) total area of constructed SCMs for each year. Filters, porous pavement, and swales are not represented as data on area was not available.
Several different types of ground cover are present on these infiltration facilities—grass, gravel, and xeriscape (utilizes low-water-demand, desert vegetation) (Figure 5). Though they are called retention basins in Phoenix, these features are designed to promote infiltration, and often contain a drywell within the basin. In the late 1990s and 2000s there was an increase in grassed infiltration facilities as well as an increase in underground filters, the primary non-GSI feature. However, the fraction of grassed infiltration facilities is much reduced during the 2010s SCM implementation. It is a small fraction relative to the infiltration facilities, but there also was an appearance of several new GSI types in the most recent years, including swales, filters, and porous pavement.
Two key events are responsible for the initial rapid increase in GSI implementation in Phoenix (Figure 5). In 1987, Uniform Drainage Standards were developed by a multi-jurisdictional task force in central Arizona, led by the Flood Control District of Maricopa County (FCDMC, 1987). These standards require detention of the 100 year, 2 h storm event for most new development. In 1990, further motivation came from the federal level as Phase 1 of the National Pollution Discharge Elimination System stormwater program began, which required development of a stormwater management program for the Phoenix MS4 [US Environmental Protection Agency (US EPA), 2015]. The regional standard requiring on-site stormwater retention combined with new development and the steadily increasing impervious cover in the region (Figure 5) starting in the 1990s appears to have driven a strong increase in SCM construction during this time. In terms of trends in SCM type, the increase in underground SCMs was driven by overall increases in impervious surface (Figure 5) and thus more pressure on aboveground space, while the increase in grassed infiltration facilities was likely driven by an overall preference for mesic turfgrass landscapes (Yabiku et al., 2008; Larson et al., 2009) joined with the desire of developers to create properties most likely to sell.
The recent decline and smaller pulse of SCM development can be linked to the economic recession from 2006 to 2012 and the subsequent rebound. Phoenix was hit particularly hard by this recession, with construction of new residential properties dropping by approximately two-thirds during this time (Kane et al., 2014). Given that most SCM construction in the region is driven by the regional stormwater retention requirements for new development, SCM construction also rapidly declined during this time, and then began to rebound as the economic conditions became more favorable for development. The relative reduction in construction of grassed basins during the recent period of SCM development has been driven by overall increasing awareness of water conservation and municipal initiatives to promote xeriscaping (McGlade, 2015). Likely influences on the recent additions of more diverse types of GSI include a city policy promoting environmentally sensitive design for city properties, and increasing area involvement of Watershed Management Group, a local organization devoted to implementing small-scale GSI demonstration projects. Another important influence on the lack of certain GSI such as swales are city-imposed restrictions on right-of-ways (Padgitt, email communications).
Portland
Portland's record of SCMs spans from 1951 to the present (Figure 7). The first notable trend is a rapid increase in construction of sedimentation manholes (here classified as “underground filter”), underground sediment retention features often coupled with infiltration sumps, in the 1990s. In the mid-1990s, there was a small steady increase in construction of GSI, with drastic increases occurring during the 2000s. Various types of vegetated swales have been implemented since 1964, though there was a strong relative increase in swales during the late 2000s. Construction years for the majority of vegetated ditches (here classified as “other SCM”) are unknown, though evaluation of construction years for adjoining properties in the city assessor database suggests that many of these ditches were built between the 1940s to 1990s. Infiltration facilities, filters, and porous pavement were all also implemented at relatively constant rates starting around 2000. Green roofs have comprised a small (2–3%) fraction of SCM construction since around 2004 and continuing into the present. It is important to note that most of these GSI types are missing construction years for approximately one-third of the facilities, and thus the pulse of GSI during the 2000s is likely even more elevated.
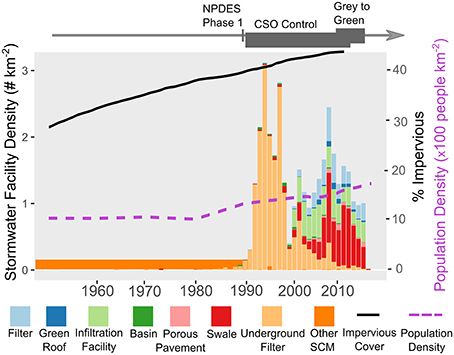
Figure 7. A timeseries of SCM construction in Portland, represented as the number of facilities built during a given year, normalized by the current area of the city. The arrow at the top denotes important events influencing stormwater management, the black line graph represents impervious surface change in Portland over several decades, and the dotted purple line graph indicates change in population density. This SCM timeseries is missing facilities which did not have known construction years, so is more representative of relative changes over time. Vegetated ditches are almost completely missing from the SCM database, but a bar has been added (under the type “Other”) to indicate that the majority were likely constructed prior to 1990.
The rapid construction of underground filters in conjunction with infiltration sumps occurred as part of a 20-year control plan for combined sewer overflows (CSOs) that began in 1991 (City of Portland, 2017a), and as part of the Mid-County Sewer Project in outer east Portland which ran from 1986 to 2001 (Mid-County Memo, 2005). The CSO control plan aimed to reduce stormwater inflows to the sewer system through downspout disconnections and implementation of underground filter/sump pairs and other SCMs, along with construction of large underground tunnels to contain CSOs and route them to treatment plants. Just prior to this control plan, there was also initiation of Phase 1 of the National Pollution Discharge Elimination System stormwater program, which required development of a stormwater management program for the Portland MS4 [US Environmental Protection Agency (US EPA), 2015]; the first permit under this program was issued in 1995 (City of Portland, 2017c). Both of these encouraged the implementation of multiple types of SCMs beyond underground filters and infiltration sumps, opening space for more ecologically-oriented surface GSI features to be considered, though particular GSI types varied by the prioritized hydrologic function; management of stormwater volume and peak flows has been prioritized in CSO control areas (City of Portland, 2017a) while water quality protection has been the priority under MS4 permits, and in regions of the city that are part of the Underground Injection Control program which was initiated in 2005 (Portland BES, 2011). Though GSI was not a major part of the original CSO control plan, rising costs from construction of large storage tunnels helped facilitate greater implementation of GSI as a more cost-effective stormwater management strategy (Law, 2014) and in 2007 the US Environmental Protection Agency (US EPA) released a memo officially supporting inclusion of GSI in CSO control plans and other stormwater permits [US Environmental Protection Agency (US EPA), 2007].
A rapid increase in GSI construction in the late 2000s was driven by large sewer capacity projects (referred to colloquially as the “Big Pipe Project” in Portland) that were complemented by the installation of large numbers of “Green Streets” (a type of curbside vegetated swale), and the Gray to Green Initiative which promoted LID and implementation of GSI types such as green roofs (locally called ecoroofs) and swales (City of Portland, 2017b). Portland's updated Stormwater Management Manual (SWMM) also encourages ongoing GSI development (City of Portland, 2016). First adopted city-wide in 1999 as part of the MS4 process, this manual provides standards for onsite stormwater management facilities and subsequent updates and iterations have included more and more GSI facility standards. Any development or redevelopment that produces 500 ft2 of impervious surface triggers the manual. Steady infill development throughout Portland has triggered this manual and its requirements, increasing the number of private GSI facilities substantially through the timeline analyzed here. Though Portland has experienced steady growth in new development and impervious surface (Figure 7), the rapid increases in GSI construction are clearly occurring in most cases as redevelopment of existing properties.
Cross-City Comparison of SCM Portfolios
Across the three cities examined in this study, SCM portfolios vary by both infrastructure type as well as allocation or density of SCMs (Figure 8). At 61.5 SCMs km−2, Portland boasts the greatest overall density of SCMs. If we remove underground filters from Portland's inventory and focus on GSI, there are still 41.5 SCMs km−2. Phoenix and Baltimore have an order of magnitude less, with 6.4 and 2.0 SCMs km−2, respectively.
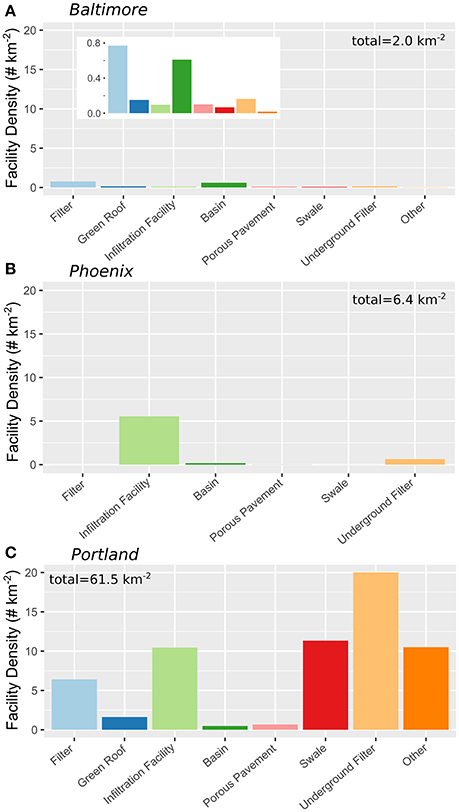
Figure 8. Density of various SCM types based on most recent data (2017), normalized by city area, in (A) Baltimore, (B) Phoenix, and (C) Portland. Total density of all SCMs for each city is indicated. Colors indicate similar types of SCMs. An inset graph in (A) has a re-scaled y-axis to better show the relative differences between SCM types in Baltimore.
With respect to SCM type, Baltimore has the most diverse portfolio (Figure 8A), with facilities that span the entire eco-techno spectrum. Dominated by GSI, its inventory spans all eight SCM classes- basins, infiltration facilities, swales, green roofs, porous pavement, bioretention or filtration facilities, underground filters, and rainwater harvesting (included as “other”). The two dominant types are filters and basins, and the specific dominant features comprising these were micro-bioretention facilities, sand filters, and dry detention ponds. The dominance of these particular types is due to these technologies being considered the best or optimal at the time (Stack, email communications). Phoenix has a SCM portfolio centered on infiltration facilities (Figure 8B). These facilities encompass 87% of all SCMs. Infiltration facilities dominate here due to the emphasis on groundwater recharge in this desert city. There are variations in the ground cover of these facilities (Figure 5), including turfgrass, gravel, or xeriscape vegetation, each of which has implications for ecohydrological function. Portland has a fairly diverse SCM portfolio which also spans all eight SCM classes, with “other” comprised by vegetated ditches (Figure 8C). Underground filters dominate, while ground-level filters, infiltration facilities, swales, and ditches are also abundant in similar quantities. Portland's density of swales is much higher than either Baltimore or Phoenix, reflecting its focus on utilization of Green Streets (curbside vegetated swales) for stormwater management, which are built in public right-of-ways.
Temporally, each of the three cities studied here began developing SCMs in different decades. Portland has the oldest record, beginning in 1951, followed by Phoenix in 1971 and Baltimore in 1985. These starting points all occurred in advance of official implementation of NPDES Phase 1 federal stormwater management guidelines and are more difficult to link to specific regulatory or socio-economic trends with the data at hand but do point to the varied nature of infrastructure development across the US. There are also striking transitions in SCM portfolios in the early 2000s in both Baltimore and Portland. In Baltimore, state guidelines were a major driver, while in Portland the federally-mandated CSO control plan and city GSI initiatives were important influences. Other influencing factors are harder to pinpoint from examination of planning and regulatory documents, such as changing technologies like development of bioretention and other small-scale LID stormwater management practices (Liu et al., 2014) and changing social demands for “greening” and sustainability of cities (Gottlieb, 2005; Newell et al., 2013) as well as changing visions of public space (Nir, 2017). An important observation across all three cities is that federal regulations do not appear as strong of an influence on GSI development as is often presumed. One potential reason for this is that two of the three cities (Baltimore and Phoenix) do not have combined sewer systems and thus are not under CSO control plans, removing the expensive regulatory hammer of a CSO consent decree. Separated or combined sewers aside though, all three of these cities had GSI development well before the US Environmental Protection Agency officially endorsed green infrastructure as a wet weather infrastructure solution in 2007 [US Environmental Protection Agency (US EPA), 2007], pointing to a need for further exploration of GSI drivers.
Looking at temporal trends across the cities, we also see the differential influence of new urban development on SCM implementation. The SCM trajectory in Phoenix most closely follows increases in impervious surface (Figure 5), since SCMs there are most often constructed along with new urban development. This linkage is also apparent in the strong decreases in SCM construction observed with the economic recession in the late 2000s. While Portland and Baltimore have both had some increases in impervious surface and new urban development which triggered SCM implementation, there were clearly other influences at play as well. Under the regional guidelines and initiatives noted above, their large increases in GSI came from implementation with infill development and retrofits onto existing private and public properties, including the public right-of-way.
Differences in population dynamics across the cities are also reflected in some of the observed SCM trends, further highlighting the connections between socio-political trends and stormwater management. Baltimore has seen substantial depopulation over the last several decades (Figure 3), though remains the most densely populated of the three cities. Despite this reduction in population and associated tax base, Baltimore has seen strong implementation of GSI in recent years, in part motivated by the co-benefits of GSI that can add value and attract new businesses and residents (Keeley et al., 2013). Portland and Phoenix have both had steady increases in population density in recent years (Figures 5, 7) but this has had different impacts on SCM development. In Phoenix, this has influenced SCM implementation by fueling new development, which has in turn driven private construction of new SCMs, per local regulations. In Portland however, this population increase, while fueling some private GSI construction through local regulations on infill development, has also fueled more public investment in GSI through programs like the Gray to Green Initiative (City of Portland, 2017).
Ultimately, the varied nature of green infrastructure development across the US shown empirically here can guide future studies of GSI. Comparisons of the unique trends in each city side-by-side reveal new research questions that should be perused to better understand GSI implementation and reveal barriers to, and opportunities for, mainstreaming green infrastructure more generally.
Implications for Ecosystem Function and Benefits
Different SCM and GSI facility types provide different hydrological, ecological and cultural benefits in different contexts; this means we must understand the varying portfolios of facility types in each city to evaluate or predict overall GSI performance. We review a variety of ecosystem services and other co-benefits of different facility types in each city's specific context in turn below.
In the Baltimore region, the early implementation of detention basins did reduce peak stormflows in receiving streams, as demonstrated by a modeling comparison of watersheds at the western edge of Baltimore City (Meierdiercks et al., 2010). Some of these basins also have demonstrated potential to remove nitrogen, which is regulated by a Total Maximum Daily Load to improve water quality in the Chesapeake Bay (Bettez and Groffman, 2012). More recent SCM types have demonstrated even more potential for water quality improvement in particular, as well as other co-benefits. Several of these newer SCMs (e.g., filters) are likely to have enhanced runoff reduction and removal of pollutants such as sediment or nitrogen, relative to the earlier implemented SCMs like basins, based on a review of SCM function across many geographic regions (Driscoll et al., 2015). Evaluation of bioretention basins in nearby College Park, Maryland supports this notion of effectiveness for multiple functions, finding overall runoff reduction (Davis, 2008) as well as retention of sediment, nutrients, metals, and hydrocarbons (Davis, 2007; Diblasi et al., 2009). There is also evidence from Baltimore County that underground filters, which have been implemented recently in Baltimore City where there are space constraints, may be providing co-benefits beyond primary design goals related to runoff volume and water quality mitigation. Specifically, they are helping to reduce stormwater temperatures and prevent thermal pollution in receiving streams, which can adversely affect biota (Poornima and Davis, 2010). Looking more broadly at co-benefits, a recent study in Baltimore County actually found decreased home values in close proximity to SCMs (Irwin et al., 2017); however, it is uncertain whether this trend also applies to Baltimore City and how trends might change with respect to newer GSI types, given that the evaluated housing sales were prior to 2007. This does highlight the fact that co-benefits are often assumed across all GSI facility types, but disservices are also an important consideration when accounting for ecosystem services in urban systems (Lyytimäki and Sipilä, 2009).
In Phoenix, the use of different land surface covers (grassed, gravel, xeriscaping) in infiltration facilities has strong implications for several ecosystem services. Unfortunately, there is a lack of data on the hydrological function of SCMs in this region. We would presume that infiltration rates are not substantially different between these different facilities, though the differences in vegetation and roots could manifest in differences in infiltration dynamics (Hart, 2017). There is likely to be a strong difference in evapotranspiration (ET) between the basin cover types. While this also has not been directly measured in these SCMs, research on ET focusing on different land covers in the Phoenix region demonstrates much higher ET and associated cooling in turfgrass vs. xeric landscapes (Templeton et al., 2017). Some of the turfgrass infiltration facilities also provide recreation benefits, as they are constructed within parks to be shallow and flat to allow for baseball or other activities. The turfgrass basins also have higher potential nitrogen retention than the gravel or xeriscaped basins, through the biological process of denitrification (Larson and Grimm, 2012). However, the turfgrass basins require periodic irrigation to sustain the grass, which is a major disservice in this this desert city where water is scarce. Another benefit of xeriscaped basins is that they likely provide habitat for more native desert wildlife, based on research in grassed vs. xeric landscapes in the region (e.g., Lerman and Warren, 2011; Ackley et al., 2015).
Portland's striking transition from underground SCMs to various types of GSI has major implications for several ecosystem services. The primary designed functions of the underground filters and their associated sumps is to improve water quality via sediment retention and retain stormwater runoff through infiltration (City of Portland, 2016). Given the fact that they are underground, there is little opportunity for other ecohydrological or cultural services to be provided by these features. Potential services have therefore expanded with the implementation of GSI, primarily Green Street swales, in the last 15 years. It's unclear how GSI facilities perform relative to more traditional SCMs, but newer infiltration facilities and all unlined swales show excellent effectiveness (>90%) at reducing peak storm flows and overall runoff volume [Portland Bureau of Environmental Services (BES), 2010]. Inclusion of vegetation in these various GSI facilities has enhanced infiltration rates, which then enhances these metrics of flow and volume reduction (Hart, 2017) and this vegetation also has potential to enhance other services such as habitat provision for certain biota (Oberndorfer et al., 2007). Green roofs provide some retention of runoff (~50%) and great reduction of peak flows, though are not as effective as the infiltration-focused facilities. A 2010 study found additional co-benefits of green roofs in Portland including improved air quality through the removal of 8.6 kg PM10 ha−1 yr−1 and greenhouse gas mitigation through 7.1 Mg carbon ha−1 yr−1 sequestered (Entrix Inc., 2010). Recent research has also highlighted cultural services enhanced by the Green Street curbside swales. Increases in housing prices near Green Street swales demonstrate an impact on the general desirability of living near certain types of GSI in Portland (Netusil et al., 2014) and Green Streets have also promoted environmental education and connection, particularly enhancing awareness of stormwater issues in the city when accompanied by informational signage (Church, 2015). Additionally, Green Streets provide access to nature generally at the street level in the city widening potential for mental health and well-being improvements to a large number of residents (Entrix Inc., 2010).
Challenges and Caveats
Inconsistencies in databases provides one challenge to comparative analysis. The primary metric used to compare the quantity of SCMs across the three cities examined in this study was the number of SCMs normalized by the city area. This is a useful first step toward understanding how various cities have developed their stormwater management strategies; however, a better metric would encompass the size of these SCMs as surface area or volumetric capacity, which can be more directly linked to potential benefits. In this analysis, SCM size data was not consistently available, though available data in Baltimore and Phoenix pointed to variable trends in SCM area. With respect to the comprehensiveness of the databases, we believe, based on conversations with municipal officials, that these databases are fairly representative of the actual installed SCMs. As previously noted, we are aware of some gaps, such as a lack of installation year for some facilities and that some private SCMs have not yet been added to the database in Phoenix. We are also aware of a difference between city databases in that Phoenix and Portland do not include all drywells or infiltration sumps in their SCM databases, as these features can be managed by state Departments of Environmental Quality which oversee underground injection controls.
A second challenge to cross-city comparative analysis is inconsistencies in the terminology used to describe the various SCM designs used. For example, an SCM called a retention basin in Phoenix is designed more similarly to what is called an infiltration basin in other locations and thus here it was classified as an infiltration facility. Some engineering references have attempted to develop a more standardized nomenclature [American Society of Civil Engineers Environmental and Water Resources, Institute and Water Environment Federation (ASCE EWRI/ WEF), 2012] but differences still abound. In most cases, the best means to understand the particular design specifications or considerations behind these names is to consult city or state stormwater management manuals. It may be difficult to ever achieve a consistent taxonomy given the rapid evolution of some of these technologies, the increasingly diverse disciplines interested in urban stormwater management, and the local or cultural connotations and preferences that may be associated with certain names (Fletcher et al., 2015). The nomenclature or classification may also depend on the function of interest; for example, there may be some cases in which it makes sense to aggregate wet and dry ponds or basins, and others when it is important to distinguish them [e.g., when considering certain nutrient cycling functions that vary considerably across these designs (McPhillips and Walter, 2015)]. In general, regulators, city officials, and researchers all have the responsibility to be as clear as possible about what the particular features, principles, or objectives are associated with a particular name.
In order to adequately understand the implications of different SCM choices on ecohydrologic and cultural services, we also need more comprehensive primary data on these benefits. As communities increasingly look to GSI to mitigate stormwater issues and provide additional co-benefits, we need to ensure that this GSI is actually meeting potential or assumed functions. Development of the International BMP Database (www.bmpdatabase.org) has been a critical means of beginning to constrain the expected functions of various SCMs and GSI, but it is limited to water quantity and quality-related metrics and spatial coverage is spotty. Hopefully academic researchers, municipalities, and others will continue to work toward documenting the diverse functions and services provided by these features.
Conclusions
This temporal analysis of SCM portfolios in three cities demonstrates a movement from large underground, centralized SCMs with narrowly-focused, single-purpose functions (i.e., mitigation of peak flows and volume retention) toward distributed, diverse GSI with a wider focus on multi-functionality. The extent of this transition varies across the cities examined in this study, with Baltimore and Portland demonstrating major changes in types of SCMs implemented, while Phoenix has continued to consistently implement similar types of SCMs through time, only recently adding a limited selection of new facility types. This sort of transition toward diverse, distributed GSI has been largely assumed, but this synthesis provides concrete evidence for how this transition has manifested in three major US cities.
We found that each city has a distinct SCM portfolio, which still have some striking similarities despite differences in the climatic setting and development history of these cities. It is clear why Portland is widely regarded as a GSI leader, as it has by far the greatest density of SCMs, and a large proportion is comprised of GSI facilities such as infiltration facilities or swales, driven by its desire to cost-effectively reduce combined sewer overflows. Though it has a relatively lower density of SCMs, Baltimore has developed the most diversity in SCM types, comprised almost exclusively by GSI, driven by a desire to improve water quality in the Chesapeake Bay. Phoenix, despite being a desert city, has a substantial quantity of GSI dominated by infiltration facilities, driven by a desire to combat urban flooding.
Across all three cities, we have identified some influences on these timelines of GSI development. Motivation from the federal level has affected overall increases in stormwater management along with prioritization of water quality as a function of SCMs. However, local level initiatives or policies have also been important factors behind the observed changes. Such policies included stormwater mitigation requirements for new development, municipal initiatives to promote GSI retrofits, and updated stormwater design guidance via municipal manuals emphasizing GSI. There are also other factors beyond regulatory elements which play pivotal roles in driving stormwater management trajectories, as we have seen in past urban infrastructural transitions (Melosi, 2008). These include changes in technologies (Schneider, 2011), social perceptions (Everett et al., 2016), institutional attitudes (Carlet, 2015), inequality and power (Finewood, 2016), financial management (Vanier and Danvlo, 1998; Weber et al., 2016), and global economics (Carse, 2017). Further exploring these socio-political influences as a part of an integrated social-ecological-technological systems (SETS) lens is an important avenue of future research (Redman and Miller, 2015; Grabowski et al., 2017).
These cities and their corresponding stormwater management strategies can provide insightful examples for other cities considering a move toward more GSI. We look forward to witnessing a continuing evolution of stormwater management around the world. While there is some solid initial evidence of the many co-benefits that can come from GSI beyond primary stormwater quantity or quality goals, we also hope to see increased engagement in documenting the ecosystem functions of GSI as it is increasingly implemented.
Data Availability
Given security concerns of city water utilities, the raw SCM data is not publicly available. Requests may be directed to the individual utilities.
Author Contributions
LM conceived the project, obtained, analyzed, and interpreted the SCM datasets, communicated with practitioners, and wrote the paper. AM interpreted the SCM datasets, communicated with practitioners, and wrote the paper.
Conflict of Interest Statement
The authors declare that the research was conducted in the absence of any commercial or financial relationships that could be construed as a potential conflict of interest.
Acknowledgments
We acknowledge financial support for this work from the Urban Resilience to Extreme Weather-Related Events Sustainability Research Network (URExSRN) under NSF grant no. SES-1444755. We are also grateful to many city practitioners for critical insight. From City of Baltimore, we thank the Department of Public Works (DPW) for providing SCM data via John Lagrosa of University of Maryland- Baltimore County and Rosanna La Plante (Baltimore DPW) and Bill Stack (Center for Watershed Protection) for reviewing portions of our paper. From City of Phoenix, we thank Kathy Groeger and Leigh Padgitt (City of Phoenix) for providing SCM data, Kelli Sertich (Flood Control District of Maricopa County) for clarifying important timepoints, and Hasan Mushtaq (City of Phoenix) and Leigh Padgitt for reviewing portions of our paper. From the City of Portland, we thank the Bureau of Environmental Services (BES) for providing SCM data and Tim Kurtz (Portland BES) and Jennifer Belknap Williamson (Port of Portland) for reviewing portions of our paper. Additionally we are appreciative of insightful feedback provided by Zbigniew Grabowski and two other reviewers.
Abbreviations
CSO, Combined Sewer Overflow; GSI, Green Stormwater Infrastructure; LID, Low Impact Development; NPDES, National Pollution Discharge Elimination System; SCM, Stormwater Control Measure.
References
Ackley, J. W., Wu, J., Angilletta, M. J., Myint, S. W., and Sullivan, B. (2015). Rich lizards: How affluence and land cover influence the diversity and abundance of desert reptiles persisting in an urban landscape. Biol. Conserv. 182, 87–92. doi: 10.1016/j.biocon.2014.11.009
Ahiablame, L. M., Engel, B. A., and Chaubey, I. (2012). Effectiveness of low impact development practices: literature review and suggestions for future research. Water. Air. Soil Pollut. 223, 4253–4273. doi: 10.1007/s11270-012-1189-2
American Rivers, American Society of Landscape Architects, ECONorthwest, Water Environment Federation (2012). Banking on Green: A Look at How Green Infrastructure Can Save Municipalities Money and Provide Economic Benefits Community-Wide. Available online at: https://www.americanrivers.org/conservation-resource/banking-on-green/
Bettez, N. D., and Groffman, P. M. (2012). Denitrification potential in stormwater control structures and natural riparian zones in an urban landscape. Environ. Sci. Technol. 46, 10909–10917. doi: 10.1021/es301409z
American Society of Civil Engineers Environmental and Water Resources, Institute and Water Environment Federation (ASCE EWRI/ WEF) (2012). Design of Urban Stormwater Controls. WEF Press; McGraw Hill.
Baltimore City Department of Public Works (2017). Stormwater Fee. Stormwater Fee. Available online at: https://publicworks.baltimorecity.gov/stormwater-fee (Accessed October 31, 2017).
Brown, R. R., Farrelly, M. A., and Loorbach, D. A. (2013). Actors working the institutions in sustainability transitions: the case of Melbourne's stormwater management. Glob. Environ. Change 23, 701–718. doi: 10.1016/j.gloenvcha.2013.02.013
Carlet, F. (2015). Understanding attitudes toward adoption of green infrastructure: a case study of US municipal officials. Environ. Sci. Policy 51, 65–76. doi: 10.1016/j.envsci.2015.03.007
Carse, A. (2017). An infrastructural event: making sense of Panama's drought. Water Altern. 10, 888–909.
Chaffin, B. C., Shuster, W. D., Garmestani, A. S., Furio, B., Albro, S. L., Gardiner, M., et al. (2016). A tale of two rain gardens: barriers and bridges to adaptive management of urban stormwater in Cleveland, Ohio. J. Environ. Manage. 183, 431–441. doi: 10.1016/j.jenvman.2016.06.025
Church, S. P. (2015). Exploring green streets and rain gardens as instances of small scale nature and environmental learning tools. Landsc. Urban Plan. 134, 229–240. doi: 10.1016/j.landurbplan.2014.10.021
City of Portland (2016). 2016 Stormwater Management Manual | The City of Portland, Oregon. Available online at: https://www.portlandoregon.gov/bes/64040 (Accessed December 4, 2017).
City of Portland (2017). Annual Financial Reports | The City of Portland, Oregon. Available online at: https://www.portlandoregon.gov/omf/26053 (Accessed April 6, 2018).
City of Portland (2017a). Combined Sewer Overflow Control | The City of Portland, Oregon. Available online at: https://www.portlandoregon.gov/bes/31030 (Accessed November 1, 2017).
City of Portland (2017b). Grey to Green Accomplishments | Grey to Green | The City of Portland, Oregon. Available online at: https://www.portlandoregon.gov/bes/article/321331 (Accessed November 1, 2017).
City of Portland (2017c). Portland's Municipal Stormwater Permit. Available online at: https://www.portlandoregon.gov/bes/37485 (Accessed December 27, 2017).
Coffman, C. L., Goo, R., and Frederick, R. (1999). “Low-impact development: an innovative alternative approach to stormwater management,” ASCE Water Resources Planning Management Conference Proceedings (Tempe, AZ).
Davis, A. P. (2005). Green engineering principles promote low-impact development. Environ. Sci. Technol. 39, 338A−344A. doi: 10.1021/es053327e
Davis, A. P. (2007). Field performance of bioretention: water quality. Environ. Eng. Sci. 24, 1048–1064. doi: 10.1089/ees.2006.0190
Davis, A. P. (2008). Field performance of bioretention: hydrology impacts. J. Hydrol. Eng. 13, 90–95. doi: 10.1061/(ASCE)1084-0699(2008)13:2(90)
Depietri, Y., and McPhearson, T. (2017). “Integrating the grey, green, and blue in cities: nature-based solutions for climate change adaptation and risk reduction,” in Nature-Based Solutions to Climate Change Adaptation in Urban Areas Theory and Practice of Urban Sustainability Transitions, eds N. Kabisch, H. Korn, J. Stadler, and A. Bonn (Cham: Springer), 91–109.
Diblasi, C. J., Li, H., Davis, A. P., and Ghosh, U. (2009). Removal and fate of polycyclic aromatic hydrocarbon pollutants in an urban stormwater bioretention facility. Environ. Sci. Technol. 43, 494–502. doi: 10.1021/es802090g
Driscoll, C. T., Eger, C. G., Chandler, D. G., Davidson, C. I., Roodsari, B. K., Flynn, C. D., et al. (2015). Green Infrastructure: Lessons From Science and Practice. Available online at: https://science-policy-exchange.org/resources/reports/green-infrastructure-lessons-science-and-practice
Eisenman, T. S. (2013). Frederick Law Olmsted, green infrastructure, and the evolving city. J. Plan. Hist. 12, 287–311. doi: 10.1177/1538513212474227
Emmanuel, R., and Loconsole, A. (2015). Green infrastructure as an adaptation approach to tackling urban overheating in the Glasgow Clyde valley region, UK. Landscape Urban Plann. 138, 71–86. doi: 10.1016/j.landurbplan.2015.02.012
Entrix Inc. (2010). Portland's Green Infrastructure: Quantifying the Health, Energy, and Community Livability Benefits. Available online at: https://www.portlandoregon.gov/bes/article/298042
Everett, G., Lamond, J. E., Morzillo, A. T., Matsler, A. M., and Chan, F. K. S. (2016). Delivering Green Streets: an exploration of changing perceptions and behaviours over time around bioswales in Portland, Oregon. J. Flood Risk Manag. 11, S973–S985. doi: 10.1111/jfr3.12225
FCDMC (1987). Uniform Drainage Policies and Standards for Maricopa County, Arizona. Available online at: http://apps.fcd.maricopa.gov/pub/docs/scanfcdlibrary/1303_001UniformDrainagePoliciesandStandardsforMaricopaCounty_Arizona.Pdf
Finewood, M. H. (2016). Green infrastructure, grey epistemologies, and the urban political ecology of Pittsburgh's water governance. Antipode 48, 1000–1021. doi: 10.1111/anti.12238
Fletcher, T. D., Shuster, W., Hunt, W. F., Ashley, R., Butler, D., Arthur, S., et al. (2015). SUDS, LID, BMPs, WSUD and more – The evolution and application of terminology surrounding urban drainage. Urban Water J. 12, 525–542. doi: 10.1080/1573062X.2014.916314
Flynn, C., and Davidson, C. (2016). Adapting the social-ecological system framework for urban stormwater management: the case of green infrastructure adoption. Ecol. Soc. 21:19. doi: 10.5751/ES-08756-210419
Gottlieb, R. (2005). Forcing the Spring: The Transformation of the American Environmental Movement. Revised edition. Washington, DC: Island Press.
Grabowski, Z. J., Matsler, A. M., Thiel, C., McPhillips, L., Hum, R., Bradshaw, A., et al. (2017). Infrastructures as socio-eco-technical systems: five considerations for interdisciplinary dialogue. J. Infrastruct. Syst. 23:02517002. doi: 10.1061/(ASCE)IS.1943-555X.0000383
Hale, R. L. (2016). Spatial and temporal variation in local stormwater infrastructure use and stormwater management paradigms over the 20th century. Water 8:310. doi: 10.3390/w8070310
Hart, T. D. (2017). Root-Enhanced Infiltration in Stormwater Bioretention Facilities in Portland, Oregon. Available online at: http://pdxscholar.library.pdx.edu/open_access_etds/3468/
Heusinger, J., and Weber, S. (2017). Surface energy balance of an extensive green roof as quantified by full year eddy-covariance measurements. Sci. Total Environ. 577, 220–230. doi: 10.1016/j.scitotenv.2016.10.168
Hopkins, K. G., Grimm, N. B., and York, A. M. (2018). Influence of governance structure on green stormwater infrastructure investment. Environ. Sci. Policy 84, 124–133. doi: 10.1016/j.envsci.2018.03.008
Irwin, N. B., Klaiber, H. A., and Irwin, E. G. (2017). Do Stormwater Basins Generate co-Benefits? Evidence from Baltimore County, Maryland. Ecol. Econ. 141, 202–212. doi: 10.1016/j.ecolecon.2017.05.030
Kane, K., York, A. M., Tuccillo, J., Gentile, L. E., and Ouyang, Y. (2014). Residential development during the great recession: a shifting focus in Phoenix, Arizona. Urban Geogr. 35, 486–507. doi: 10.1080/02723638.2014.910325
Kaushal, S. S., McDowell, W. H., Wollheim, W. M., Johnson, T. A. N., Mayer, P. M., Belt, K. T., et al. (2015). Urban evolution: the role of water. Water 7, 4063–4087. doi: 10.3390/w7084063
Keeley, M., Koburger, A., Dolowitz, D. P., Medearis, D., Nickel, D., and Shuster, W. (2013). Perspectives on the use of green infrastructure for stormwater management in cleveland and milwaukee. Environ. Manage. 51, 1093–1108. doi: 10.1007/s00267-013-0032-x
Kivaisi, A. K. (2001). The potential for constructed wetlands for wastewater treatment and reuse in developing countries: a review. Ecol. Eng. 16, 545–560. doi: 10.1016/S0925-8574(00)00113-0
Larson, E. K., and Grimm, N. B. (2012). Small-scale and extensive hydrogeomorphic modification and water redistribution in a desert city and implications for regional nitrogen removal. Urban Ecosyst. 15, 71–85. doi: 10.1007/s11252-011-0208-1
Larson, K. L., Casagrande, D., Harlan, S. L., and Yabiku, S. T. (2009). Residents' yard choices and rationales in a desert city: social priorities, ecological impacts, and decision tradeoffs. Environ. Manage. 44, 921–937. doi: 10.1007/s00267-009-9353-1
Law, S. (2014). Green Streets: Function or Frill? Portland Trib. Available online at: http://publications.pmgnews.com/epubs/portland-tribune-022714.pdf
Lerman, S. B., and Warren, P. S. (2011). The conservation value of residential yards: linking birds and people. Ecol. Appl. Publ. Ecol. Soc. Am. 21, 1327–1339. doi: 10.1890/10-0423.1
Liu, J., Sample, D., Bell, C., and Guan, Y. (2014). Review and research needs of bioretention used for the treatment of urban stormwater. Water 6, 1069–1099. doi: 10.3390/w6041069
Lyytimäki, J., and Sipilä, M. (2009). Hopping on one leg – The challenge of ecosystem disservices for urban green management. Urban For. Urban Green. 8, 309–315. doi: 10.1016/j.ufug.2009.09.003
Magurran, A. E. (1988). “Diversity indices and species abundance models,” in Ecological Diversity and Its Measurement (Dordrecht: Springer), 7–45.
Matsler, A. (2017). Knowing Nature in the City: Comparative Analysis of Knowledge Systems Challenges Along the “Eco-Techno” Spectrum of Green Infrastructure in Portland & Baltimore. Available online at: https://pdxscholar.library.pdx.edu/open_access_etds/3767.
McGlade, C. (2015). Is Phoenix Area's Long Love Affair with Grass Waning? Ariz. Repub. Available online at: https://www.azcentral.com/story/news/arizona/investigations/2015/10/28/phoenix-areas-long-love-affair-grass-waning/73696944/ (Accessed October 31, 2017).
McIntyre, J. K., Davis, J. W., Hinman, C., Macneale, K. H., Anulacion, B. F., Scholz, N. L., et al. (2015). Soil bioretention protects juvenile salmon and their prey from the toxic impacts of urban stormwater runoff. Chemosphere 132, 213–219. doi: 10.1016/j.chemosphere.2014.12.052
McPhillips, L. E., and Walter, M. T. (2015). Hydrologic conditions drive denitrification and greenhouse gas emissions in stormwater detention basins. Ecol. Eng. 67–75. doi: 10.1016/j.ecoleng.2015.10.018
MD Department of the Environment (2007). Maryland's Stormwater Management Act of 2007. Md. Stormwater Manag. Act. Available online at: http://mde.maryland.gov/programs/water/StormwaterManagementProgram/Pages/swm2007.aspx (Accessed October, 31, 2017).
MD Department of the Environment (2009). Maryland Stormwater Design Manual. Md. Stormwater Des. Man. Available at: http://mde.maryland.gov/programs/water/StormwaterManagementProgram/Pages/stormwater_design.aspx (Accessed October 31, 2017).
Meierdiercks, K. L., Smith, J. A., Baeck, M. L., and Miller, A. J. (2010). Analyses of Urban Drainage Network Structure and its Impact on Hydrologic Response1. JAWRA J. Am. Water Resour. Assoc. 46, 932–943. doi: 10.1111/j.1752-1688.2010.00465.x
Mell, I. C. (2013). Can you tell a green field from a cold steel rail? Examining the “green” of Green Infrastructure development. Local Environ. 18, 152–166. doi: 10.1080/13549839.2012.719019
Melosi, M. V. (2008). The Sanitary City: Environmental Services in Urban America from Colonial Times to the Present. Pittsburgh, PA: University of Pittsburgh Pre.
Mid-County Memo (2005). A Look Back at February 1992. Available at: https://midcountymemo.com/sept05_past.html (Accessed December 27, 2017).
Montalto, F., Behr, C., Alfredo, K., Wolf, M., Arye, M., and Walsh, M. (2007). Rapid assessment of the cost-effectiveness of low impact development for CSO control. Landsc. Urban Plan. 82, 117–131. doi: 10.1016/j.landurbplan.2007.02.004
Nazir, N. N. M., Othman, N., and Nawawi, A. H. (2014). Green infrastructure and its roles in enhancing quality of life. Proc. Soc. Behav. Sci. 153, 384–394. doi: 10.1016/j.sbspro.2014.10.071
Netusil, N. R., Levin, Z., Shandas, V., and Hart, T. (2014). Valuing green infrastructure in Portland, Oregon. Landsc. Urban Plan. 124, 14–21. doi: 10.1016/j.landurbplan.2014.01.002
Newell, J. P., Seymour, M., Yee, T., Renteria, J., Longcore, T., Wolch, J. R., et al. (2013). Green alley programs: planning for a sustainable urban infrastructure? Cities 31, 144–155. doi: 10.1016/j.cities.2012.07.004
Nir, S. M. (2017). To the City, a Pollution Fighter. To Some Residents, an Eyesore. N. Y. Times. Available online at: https://www.nytimes.com/2017/03/23/nyregion/bioswale-rain-gardens-new-york.html
Oberndorfer, E., Lundholm, J., Bass, B., Coffman, R. R., Doshi, H., Dunnett, N., et al. (2007). Green roofs as urban ecosystems: ecological structures, functions, and services. BioScience 57, 823–833. doi: 10.1641/B571005
Portland Bureau of Environmental Services (BES) (2010). Stormwater Management Facility Monitoring Report Summary. Available online at: https://www.portlandoregon.gov/bes/article/343463
Poornima, N., and Davis, A. P. (2010). Thermal reduction by an underground storm-water detention system. J. Environ. Eng. 136, 520–526. doi: 10.1061/(ASCE)EE.1943-7870.0000172
Portland BES (2011). City of Portland Underground Injection Controls (UICs). Available online at: https://www.portlandoregon.gov/bes/article/436258
Redman, C. L., and Miller, T. R. (2015). “The technosphere and earth stewardship,” in Earth Stewardship Ecology and Ethics, eds R. Rozzi, F. S. Chapin III, J. B. Callicott, S. Pickett, M. E. Power, J. J. Armesto, and R. H. May Jr. (Cham: Springer), 269–279.
Roy, A. H., Wenger, S. J., Fletcher, T. D., Walsh, C. J., Ladson, A. R., Shuster, W. D., et al. (2008). Impediments and solutions to sustainable, watershed-scale urban stormwater management: lessons from Australia and the United States. Environ. Manage. 42, 344–359. doi: 10.1007/s00267-008-9119-1
Schneider, D. (2011). Hybrid Nature: Sewage Treatment and the Contradictions of the Industrial Ecosystem. Cambridge, MA: MIT Press.
Schröder, P., Navarro-Aviñó, J., Azaizeh, H., Goldhirsh, A. G., DiGregorio, S., Komives, T., et al. (2007). Using phytoremediation technologies to upgrade waste water treatment in Europe. Environ. Sci. Pollut. Res. Int. 14, 490–497. doi: 10.1065/espr2006.12.373
Shuster, W., A., Morrison, M., and Webb, R. (2008). Front-loading urban stormwater management for success – a perspective incorporating current studies on the implementation of retrofit low-impact development. Cities Environ. 1:8.
Templeton, N. P., Vivoni, E. R., Wang, Z., and Schreiner-McGraw, A. P. (2017). Quantifying water and energy fluxes over different urban land covers in Phoenix, Arizona. J. Geophys. Res. Atmos. 123, 2111–2128. doi: 10.1002/2017JD027845
Tzoulas, K., Korpela, K., Venn, S., Yli-Pelkonen, V., Kazmierczak, A., Niemela, J., et al. (2007). Promoting ecosystem and human health in urban areas using Green Infrastructure: A literature review. Landsc. Urban Plan. 81, 167–178. doi: 10.1016/j.landurbplan.2007.02.001
US Environmental Protection Agency (US EPA) (2007). Memo: Use of Green Infrastructure in NPDES Permits and Enforcement. Available online at: https://www.epa.gov/sites/production/files/2015-10/documents/gi_memo_enforce_0.pdf
US Environmental Protection Agency (US EPA) (2015). Stormwater Discharges from Municipal Sources. US EPA. Available online at: https://www.epa.gov/npdes/stormwater-discharges-municipal-sources (Accessed October 31, 2017).
Vanier, D. J., and Danvlo, N. (1998). “Municipal infrastructure investment planning: asset management,” in Innovations in Urban Infrastructure Seminar of the APWA International Public Works Congress (Las Vegas, NV). 25–39.
Vogel, J. R., and Moore, T. L. (2016). Urban stormwater characterization, control, and treatment. Water Environ. Res. 88, 1918–1950. doi: 10.2175/106143016X14696400495938
Vymazal, J. (2010). Constructed wetlands for wastewater treatment. Water 2, 530–549. doi: 10.3390/w2030530
Walsh, C. J., Roy, A. H., Feminella, J. W., Cottingham, P. D., Groffman, P. M., and Morgan, R. P. (2005). The urban stream syndrome: current knowledge and the search for a cure. J. North Am. Benthol. Soc. 24, 706–723. doi: 10.1899/04-028.1
Wang, R., Eckelman, M. J., and Zimmerman, J. B. (2013). Consequential environmental and economic life cycle assessment of green and gray stormwater infrastructures for combined sewer systems. Environ. Sci. Technol. 47, 11189–11198. doi: 10.1021/es4026547
Weber, B., Alfen, H. W., and Stab-Bisang, M. (eds). (2016). Infrastructure as an Asset Class: Sustainability, Investment Strategies, Project Finance and PPP. 2nd Edn., Chichester: John Wiley & Sons.
Yabiku, S. T., Casagrande, D. G., and Farley-Metzger, E. (2008). Preferences for landscape choice in a Southwestern desert city. Environ. Behav. 40, 382–400. doi: 10.1177/0013916507300359
Keywords: green infrastructure, stormwater control measures, stormwater management, urban ecosystem services, social-ecological-technological systems
Citation: McPhillips LE and Matsler AM (2018) Temporal Evolution of Green Stormwater Infrastructure Strategies in Three US Cities. Front. Built Environ. 4:26. doi: 10.3389/fbuil.2018.00026
Received: 29 December 2017; Accepted: 24 April 2018;
Published: 15 May 2018.
Edited by:
Franco Montalto, Drexel University, United StatesReviewed by:
Ahmed M. ElKenawy, Mansoura University, EgyptUlf Mallast, Helmholtz-Zentrum für Umweltforschung (UFZ), Germany
Copyright © 2018 McPhillips and Matsler. This is an open-access article distributed under the terms of the Creative Commons Attribution License (CC BY). The use, distribution or reproduction in other forums is permitted, provided the original author(s) and the copyright owner are credited and that the original publication in this journal is cited, in accordance with accepted academic practice. No use, distribution or reproduction is permitted which does not comply with these terms.
*Correspondence: Lauren E. McPhillips, Lauren.McPhillips@asu.edu