Creep Behavior of Red-Clay Under Triaxial Compression Condition
 Kaixi Xue
  Shengfu Wang
- School of Civil & Architecture Engineering, East China University of Technology, Nanchang, China
To investigate the shear strength and creep behavior of red-clay, laboratory experiments were conducted and the experimental results were compared with available theoretical creep models. Based on the consolidated drained (CD) triaxial tests results, internal friction angle and cohesion of the red clay soil were 21.5° and 61.1 kPa, respectively. Three different confining pressures were set up to conduct the creep tests using multi-stage loading. The overall creep curves exhibited stepped stress-strain behavior. The creep behaviors were remarkably different from the soils tested with three distinct confining stresses. The post-creep failure mode of all the red clay samples exhibited drum shaped parabolic bulging with predefined shear planes. The experimental results were compared with three different types of creep models that used in practice. Among all of this verified results, Burger’s model behaved betted than other models when fitting with the data collected from the experiment. An experimental result based empirical equation has also been developed which fits well with the experimental results obtained from the tested red clay samples. The results of this study will be helpful to evaluate the long-term shear strength and deformation of red clays subjected to various structural loadings.
Introduction
Under the hot and humid climate in the south of China, limestone, dolomite and other carbonate rocks undergo long-term physical and chemical weathering and reddening that formed a kind of high plastic clay with colors of brown red, purple red, and brown yellow. The liquid limit is generally greater than 50%, which is defined as red clay in engineering classification (Lu, 2001). The specific surface area of red clay is large, the adsorption capacity of particles is strong, coupled with the cementation of free iron oxide, solid particles are formed in the natural state (Wang and Song, 2018). Red clay owns a large natural water content and a small liquid index, which is mainly in a hard-plastic state. This material belongs to a medium low compressibility soil when considering its property of void ratio and compressibility Its internal friction angle is small, but its cohesion is large, and its bearing capacity is high, which indicates that red clay has good engineering characteristics (Li et al., 2019). Because of these advantages of red clay, red clay is often used as subgrade fill in these areas, or directly as bearing foundation to build buildings and structures in red clay areas (Yang et al., 2019). Red clay is widely distributed in wet areas with abundant water in the south of China, such as the city of Chongqing. Its creep characteristics and long-term stability are directly related to the safety of the project and its surrounding environment. Therefore, it is of great engineering significance to study the creep characteristics of red clay.
Rheology of soil includes the changes in the physical and mechanical properties of soil or rock mass over time under a constant stress. Such processes include creep, stress relaxation, long-term strength, elastic lag, etc. (Grimstad et al., 2010; Yin and Tong, 2011; Boyle, 2012; Zhao et al., 2017a, b), among which the creep behavior of the soil is the most extensive research topic. Excessive creep in the soil can lead to differential settlement in buildings, dam foundation failures, and landslides.
The creep characteristics of rock and soil are usually described by element creep model and empirical creep model. The famous component models include: Maxwell model, Kelvin model, Burgers model, etc. (Atkinson, 1978; Zhao et al., 2018, 2019), the famous creep model Empirical models include Singh Mitchell model (Singh, 1968), Mesri model (Mesri et al., 1981), etc. Mitchell (1960) indicated that clays are easier to creep due to its flocculence structure. Early works were focused more on soil creep properties that exhibit the relationship between time, stress and strain. Various creep models have been proposed to predict settlement of builds or dam foundations. At present, the study of creep behavior has been extended to evaluate the long-term deformation of most geotechnical engineering applications such as slope stability, tunnel, dam, etc. More robust research, such as study of the three-dimensional or in situ creep behavior of different kinds of soils, such as clay (Sayed-Ahmed et al., 1998; Naumann et al., 2007; Maio et al., 2015), boom clay (Yu et al., 2015), soft clay (Yin et al., 2015), expansive clay (Vu and Fredlund, 2004; Thyagaraj and Rao, 2013), and sand (Zhang et al., 2018) have been carried out. The long-term mechanical properties of sandstone and tailings are particularly important in the fields of hydropower, energy, mining and others. Kovalenko (1973) investigated the consolidation of a peat base. Similarly, creep behaviors of granular soil (Kuwano and Jardine, 2002) and gassy muddy soil (Xu et al., 2014) have also been studied in the past. On the other hand, some researchers have studied the soil microscopic properties for the creep deformation (Shi et al., 1997; Li and Li, 2012; Sachan et al., 2013).
Several mathematical models are available to describe the creep behavior of rock or soil mass. At present, the available creep constitutive models can be divided into three categories: (a) element models established based on the theory of sticky elastic-plastic, such as Kelvin model, Burges model, and Liu Baochen model; (b) models based on the experimental data, through studying the experience of the statistics law to establish model; (c) microscopic model which was established based on the microscopic rheology theory, such as empty-pipe network model (Jong, 1968), micro sliding surface model (Shi et al., 1997) and discrete particle model (Kuhn and Mitchell, 1993), etc. The first two models are the most widely used ones. However, the theoretical model shows low precision when used to describe the non-linear characteristic of soil creep behavior and the determination of model parameters is complicated. Development of models based on the laboratory experimental data requires a few soil parameters although it predicts the creep behavior more accurately. However, such models are soil specific and cannot be generalized for all types of soils and of field conditions. Microscopic model parameters are more difficult to identify although these models reveal the microscopic characteristics of soil creep and can help to understand its creep properties and corresponding deformation mechanism.
Although the creep properties of clay have been studied for a long time, due to the complexity in the behavior of rock and soil as well as the sedimentation history, variation in the mineralogical composition, significant regional differences, it is important to determine an appropriate model to represent the creep behavior of a specific region and soil type. This study focused on the creep behavior of red clay abundantly available in Chongqing, China, through laboratory experiments and theoretical analysis. A few of comparative analysis of theoretical and empirical models was performed to describe the nature of the red clay creep process. Many important projects have been built on these red clays, such as shown in Figure 1. Similarly, these red clays are also widely used at highway excavation sites in the study area (Figure 2).
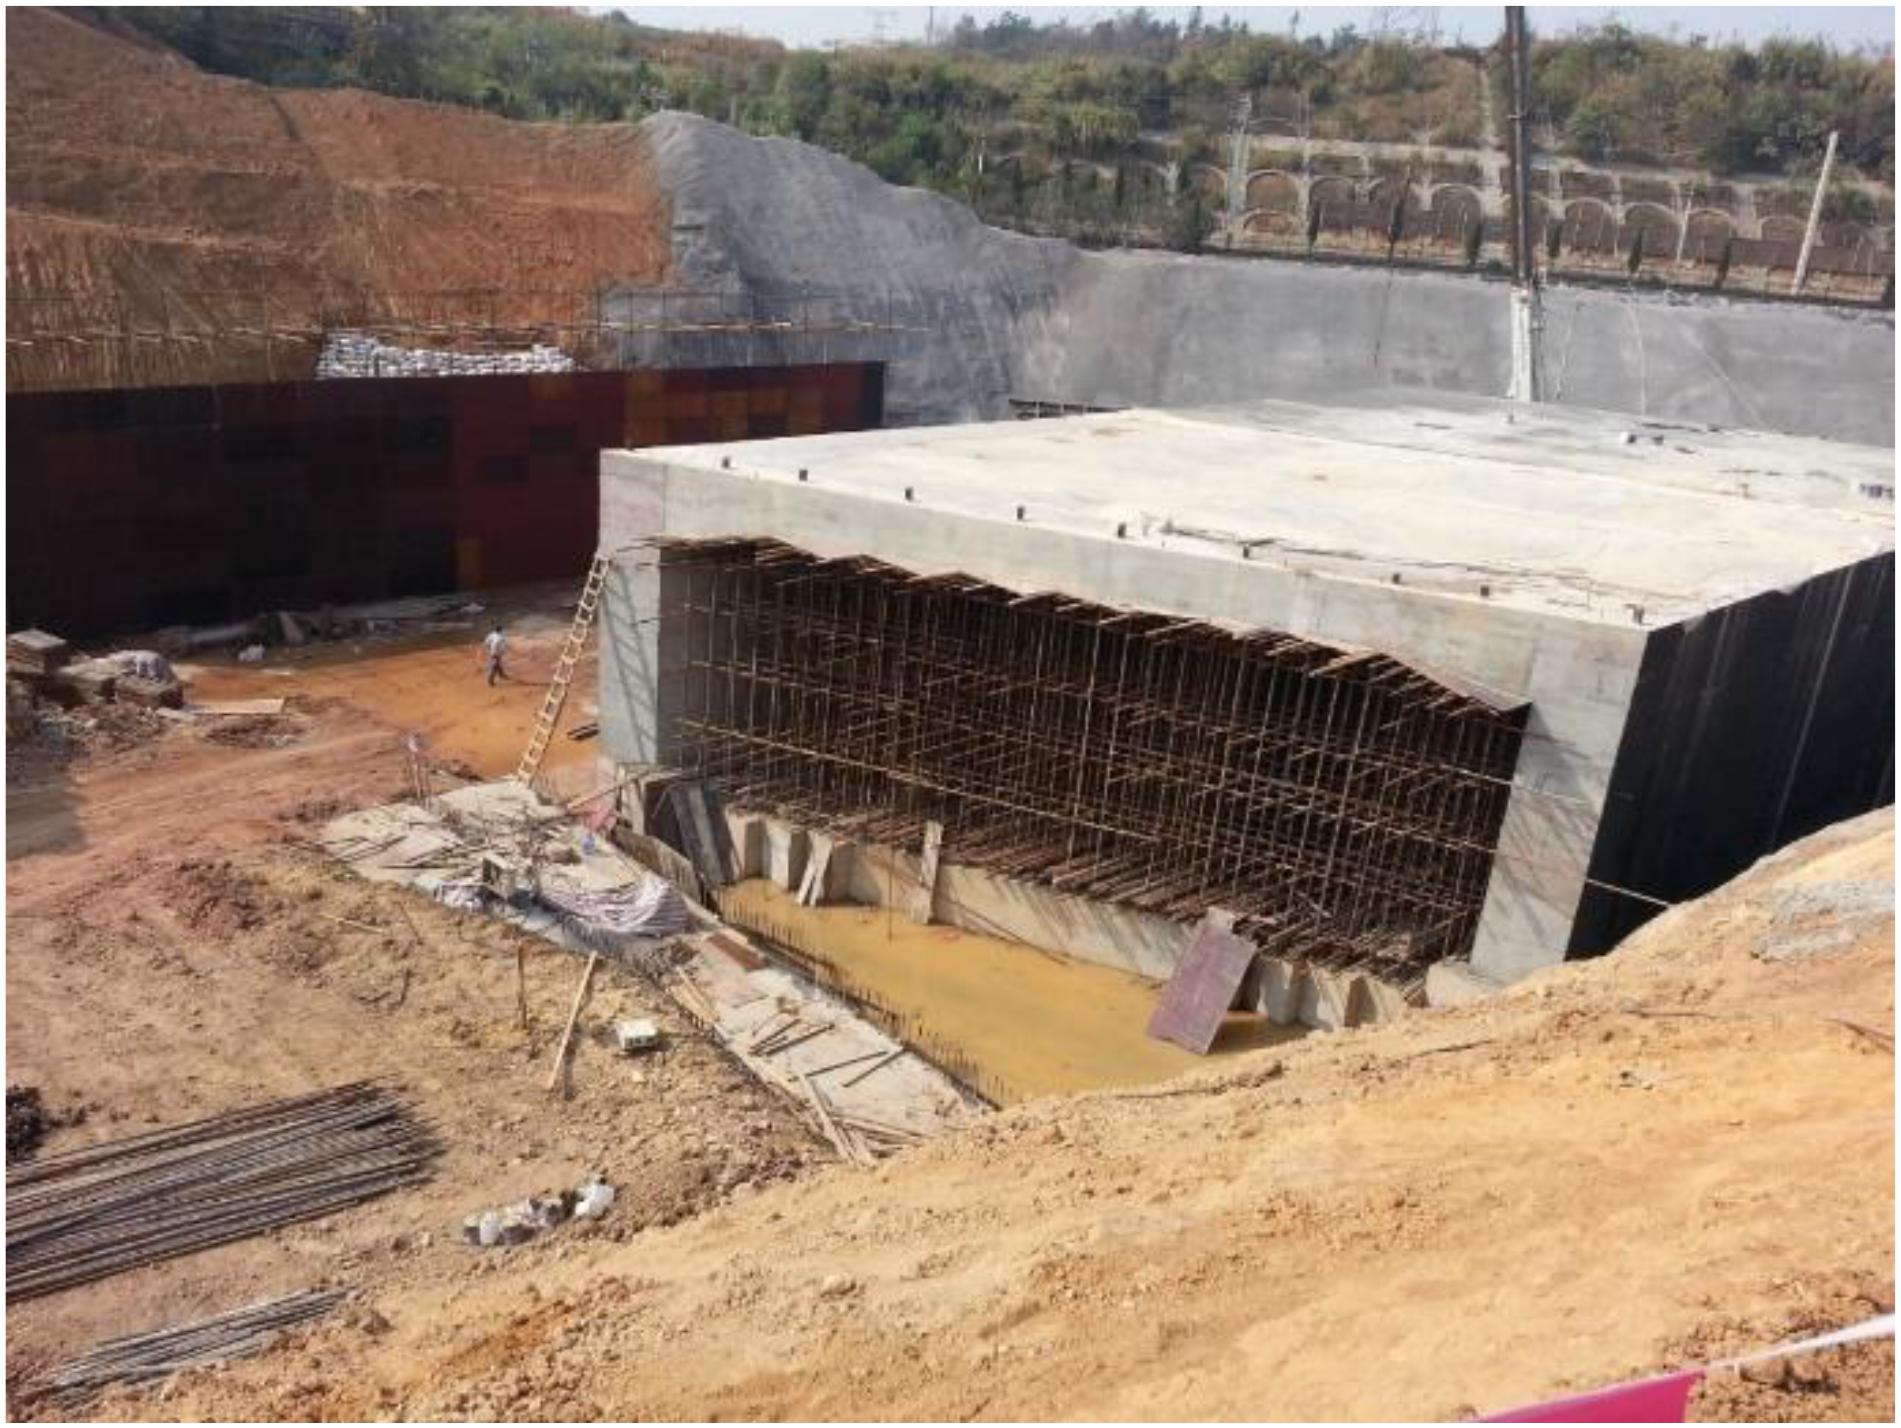
Figure 1. A structure in the study area constructed on the red clays.
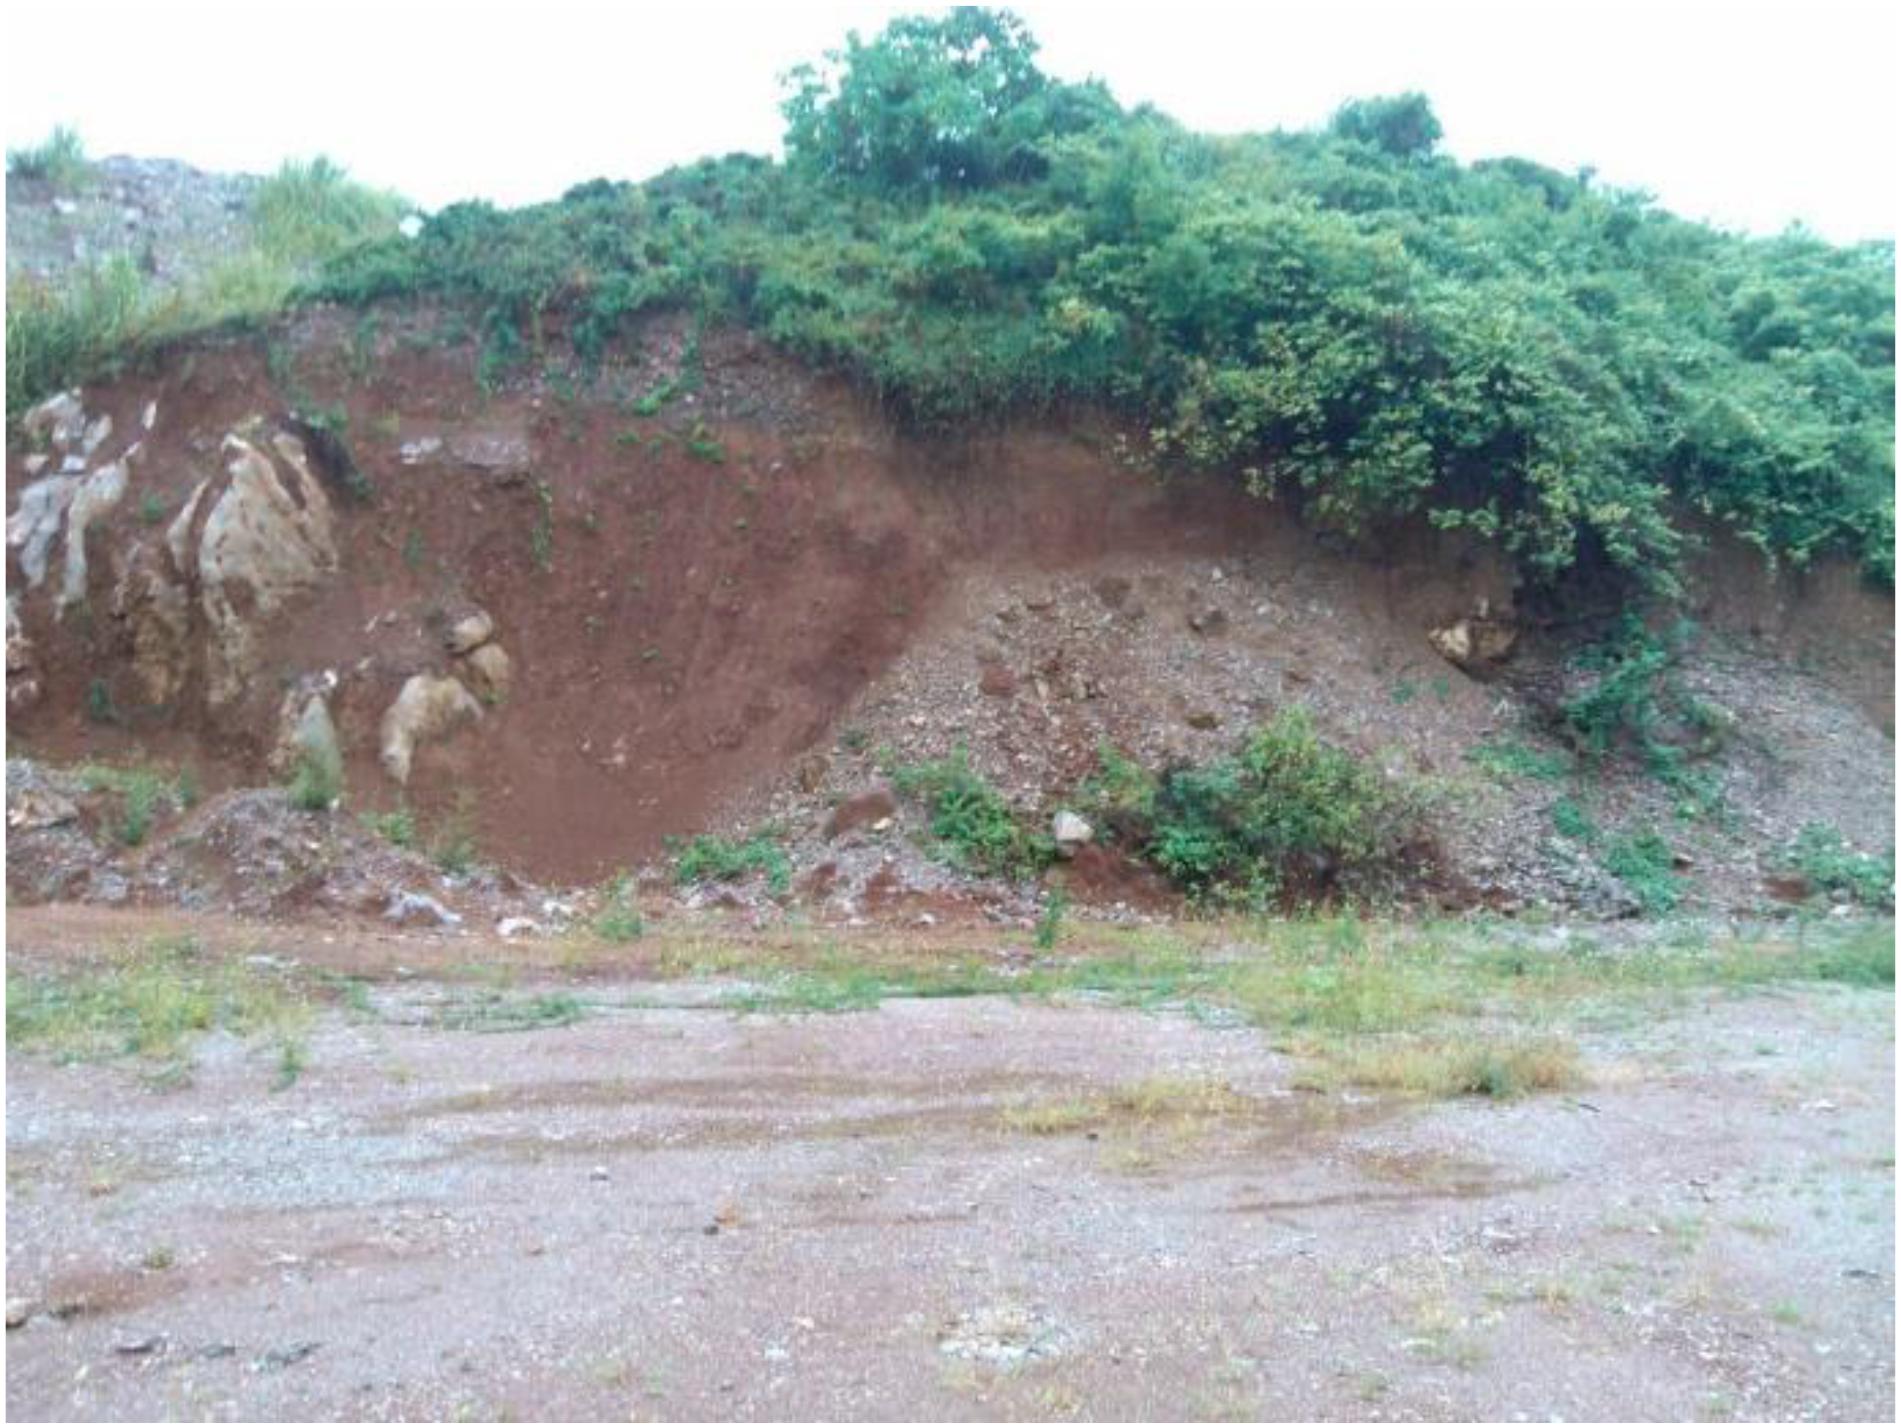
Figure 2. Red clay slopes encountered during highway excavation in the study area.
Materials and Methods
This section describes the index properties of soil samples, instrument and equipment used to simulate consolidated drained (CD) triaxial compression process, creep test methods, and test procedures.
Soil Investigated
Typical red clay samples available in hot and humid regions areas of southern China were collected from Shapingba area of Chongqing, China. Red clays are formed by the laterization from exposed carbonate rocks, and can be brownish red or brownish yellow. The physical properties of red clays used in this study are summarized in Table 1. It was classified as fat clay (CH) per according to Unified Soil Classification System.
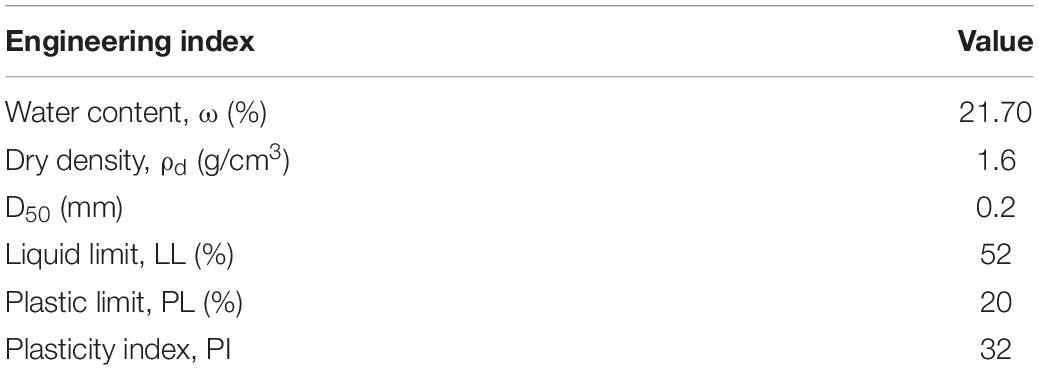
Table 1. Soil index properties of tested samples.
Soil Testing Methodology
Consolidated Drained (CD) Triaxial Compression Tests
The triaxial compression test was conducted with a strain-controlled triaxial compression apparatus (TSZ-6A) manufactured by Nanjing Soil Instrument Factory Co., Ltd. (Figure 3). This apparatus uses a cylindrical specimen with a diameter of 61.8 or 101 mm and a length of 125 or 200 mm. The maximum confining pressure that can be applied in this apparatus is 2.0 MPa.
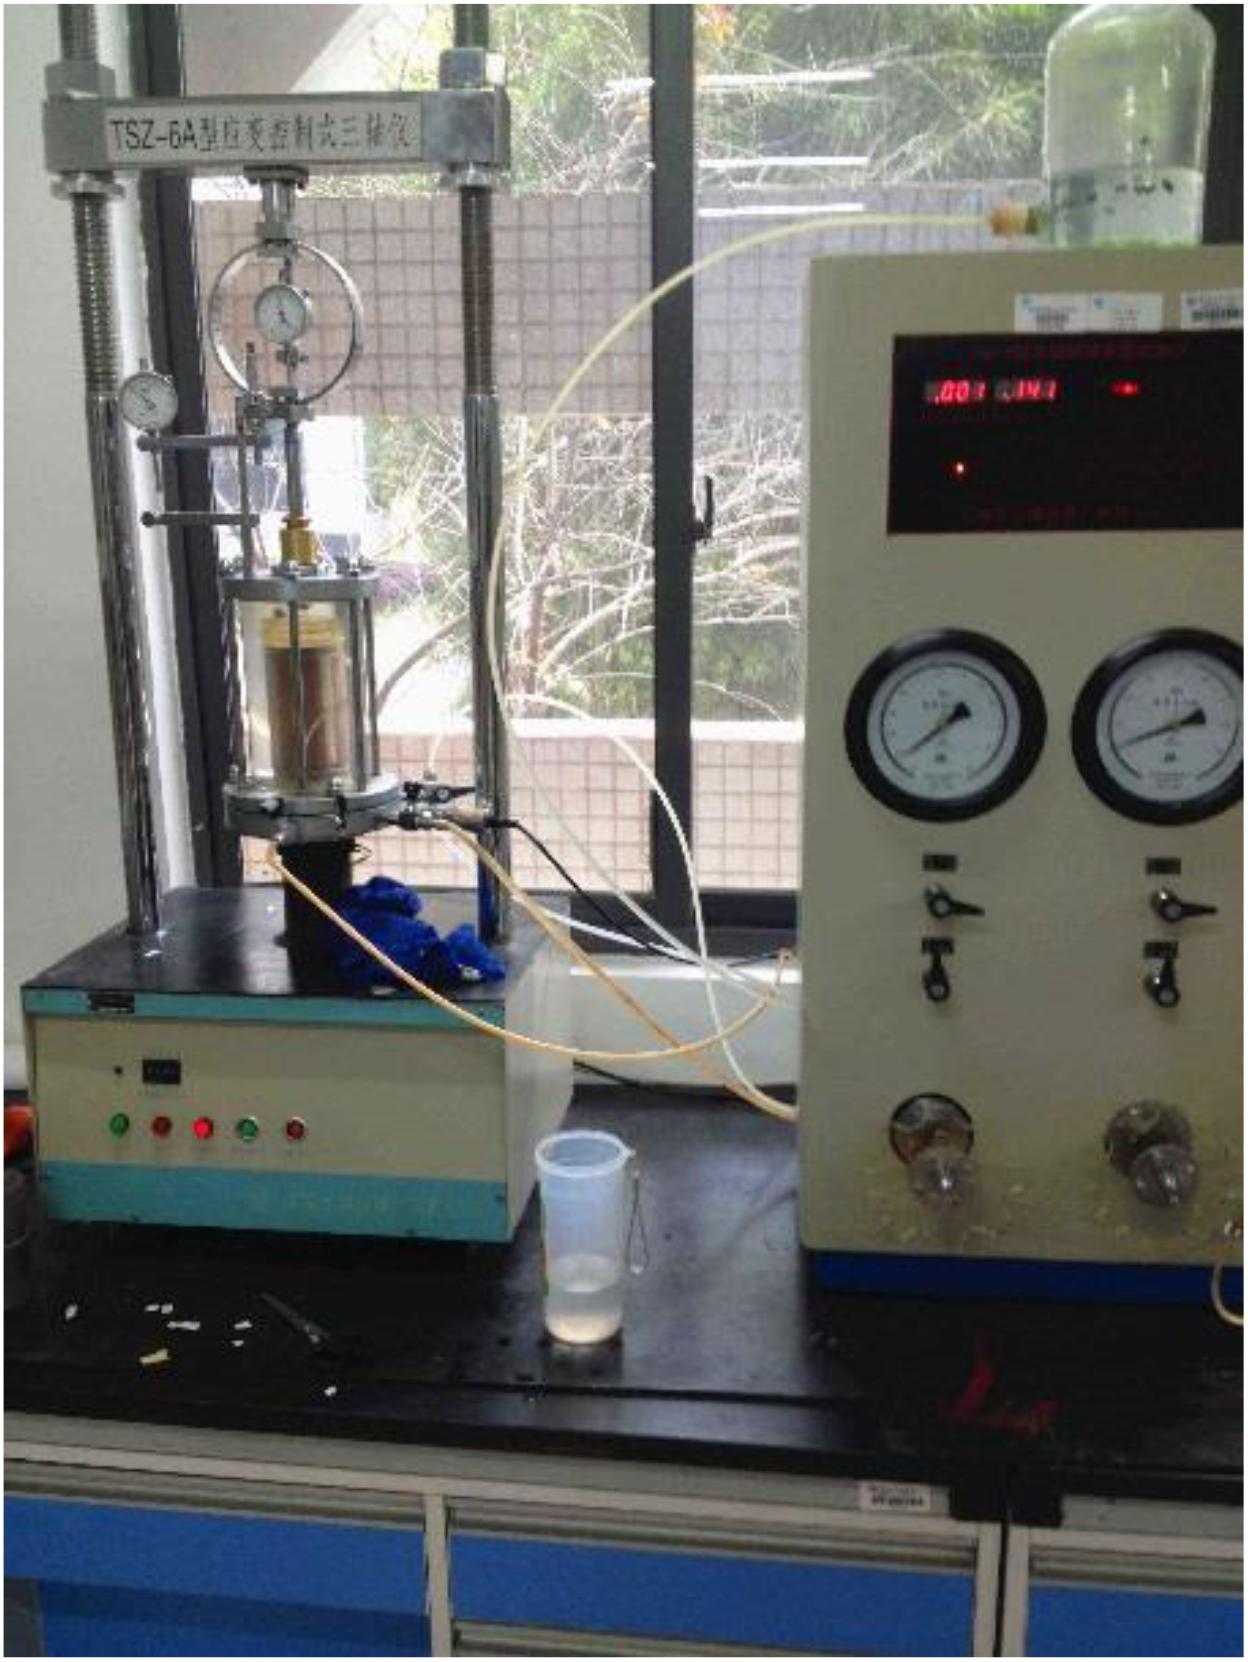
Figure 3. Strain control triaxial compression apparatus (TSZ-6A).
The natural red clay samples was compressed into a cylindrical mold having an internal diameter of 61.8 mm and a length of 125 mm and the density was 1.6 g/cm3. The compacted samples were submerged under a de-aired water bath and saturated by applying vacuum pressure from one end of the sample. The saturated samples were then frozen to maintain the shape of the cylinder and transferred to a triaxial apparatus.
Five confining pressures were applied to the tested soil samples i.e., 50, 75, 100, 200, and 300 kPa. The corresponding deviator stress is measured for different confining stresses. The shear strength parameters of the red clay samples were calculated by drawing the Mohr’s circles. The stress-strain behaviors observed in the strain-controlled CD triaxial test helps to develop a test plan for the creep test as the failure strains at different confining stresses can be known through the CD triaxial tests results. Special measures have been taken to reduce errors in the instrument itself and during commissioning. To study the effect of confining stress on the shear strength parameters, tests and corresponding analyses were performed in three different confining stress ranges – (a) low stress range including the confining stresses of 50, 75, and 100 kPa, (b) medium confining stress range including the confining stresses of 75, 100, and 200 kPa, and (c) large confining stress range including 100, 200, and 300 kPa. Full saturation of the soil specimens was confirmed by checking the saturation index B values, which were larger than 0.98 in all the cases.
Creep Tests Methods
Creep tests were conducted using a triaxial rheology apparatus (TRA-001) (Figure 4). Currently, creep test can be performed, through two approaches – (a) multi-stage loading in soil samples and (b) multi-stage loading in individual soil samples. The former method involves gradually applying different deviator stresses on one sample. In this way, each loading step needs to be completed until the deformation of the sample reaches a steady state i.e., cease further deformation. At the final procedure of loading, the sample showed a serious failure. The later approach involves applying different stresses on samples using the same equipment and test conditions and obtaining a series of creep behavior curves for different stresses. The advantage of the former method is that the creep test can be performed with only one sample and the overall creep curves can be obtained for different stresses using various available creep models such as the Boiztman linear superposition principle. Therefore, the first method was used in this study.
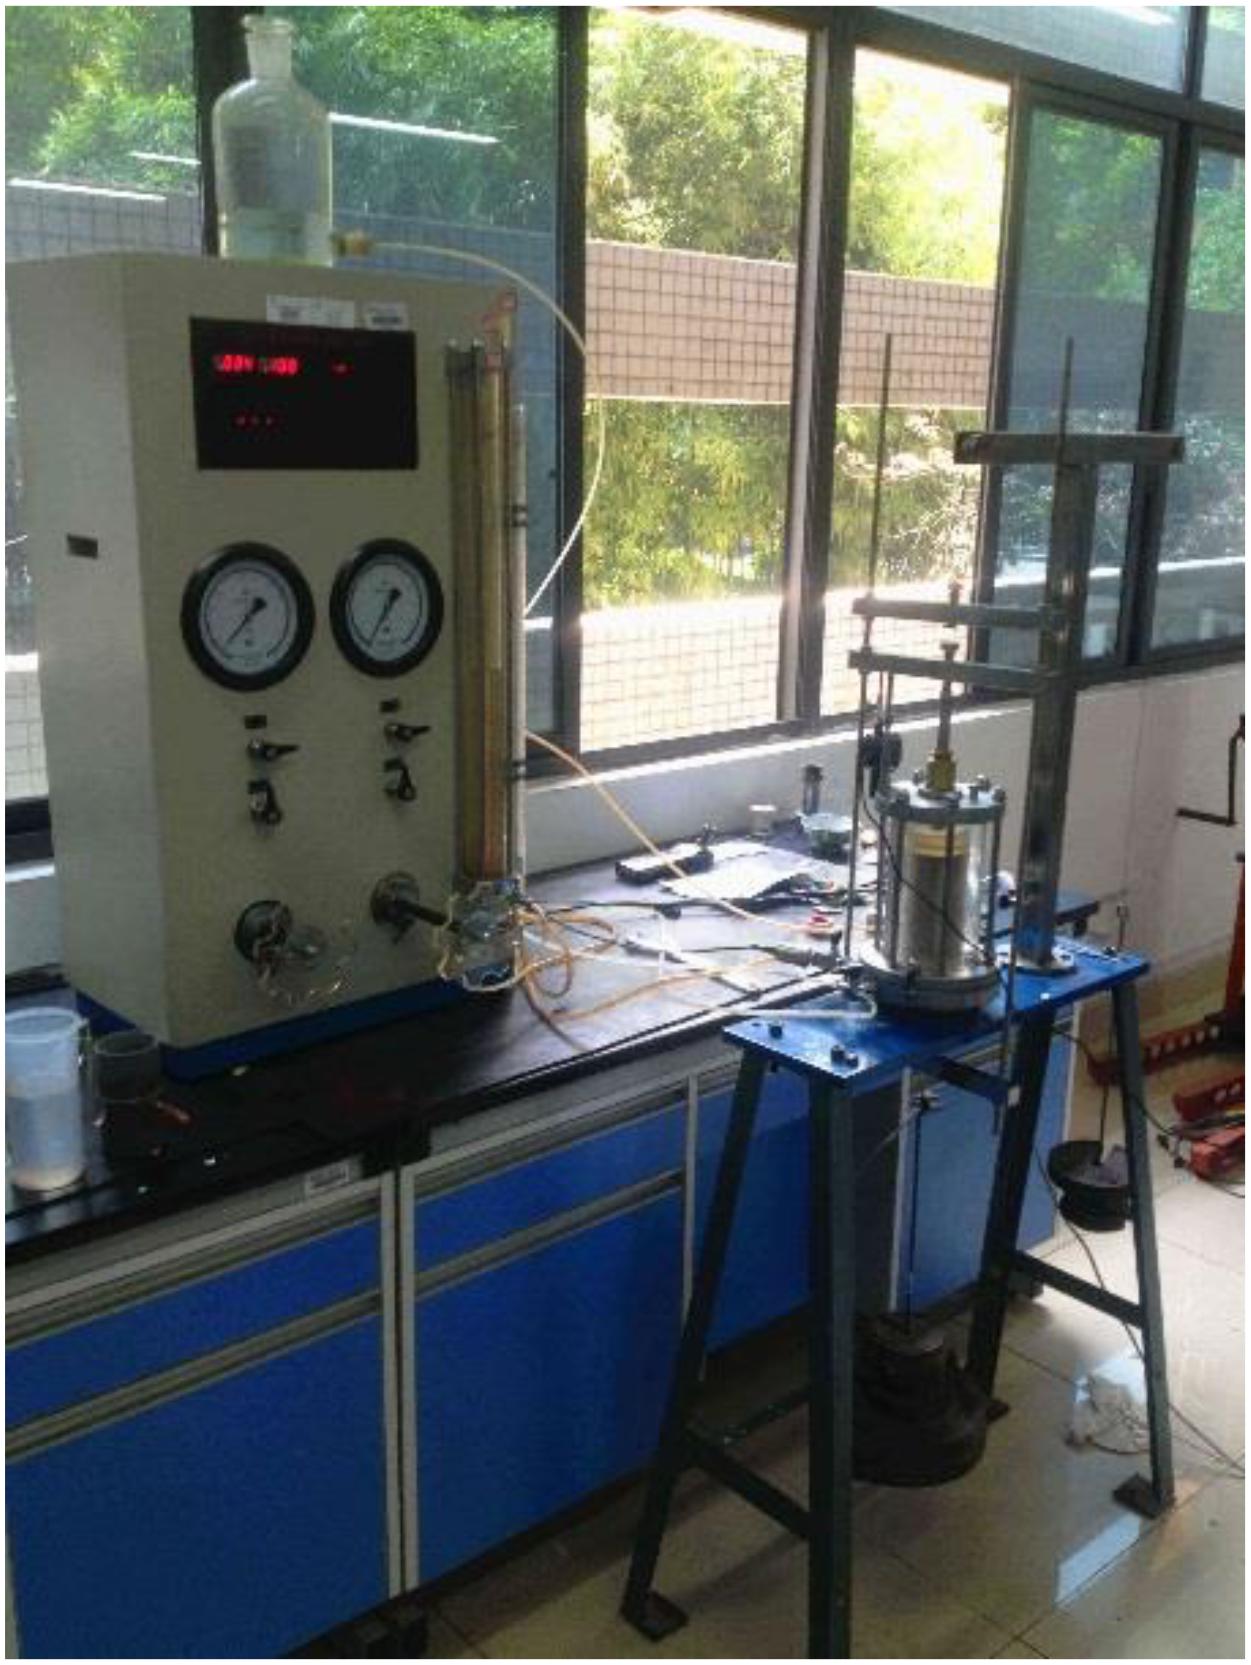
Figure 4. Triaxial rheology apparatus (TRA-001).
In this study, creep tests were conducted in three different groups at confining pressures of 50, 75, and 100 kPa, respectively, according to the first approach of multi-stage loading described above. Required loadings were applied into five different steps. First, the first step of loading will be applied to the red clay sample followed by the second step when the recorded vertical deformation is less than 0.001 m within 24 h. Further steps of loading are applied similarly until the completion of all steps and the failure of all samples. Gradual loading stages were calculated based on the maximum deviator stress obtained from the CD triaxial compression test described above. The loading steps are presented in Table 2.
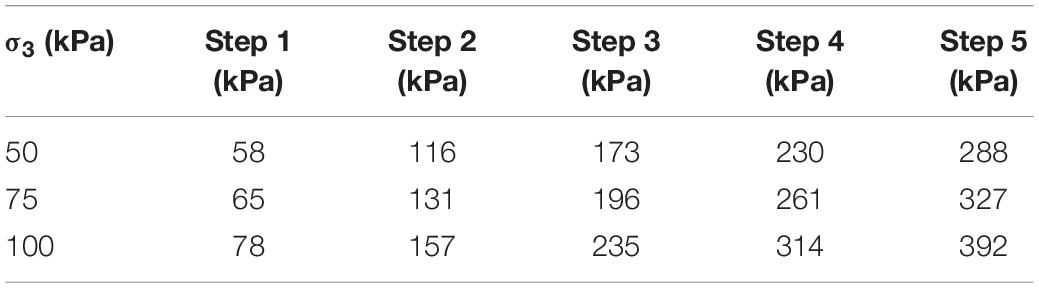
Table 2. Gradual deviator loading steps applied for different confining pressures.
Test Results and Discussion
CD Triaxial Compression Tests
Analysis of Stress-Strain Behavior
Deviator stress–axial strain relationships obtained from the CD triaxial test is shown in Figure 5. As presented in Figure 5, the sample exhibited contractive behavior at a confining stresses of 50, 75, and 100 kPa and the deviator stresses peaked at the axial stress of approximately 20%. This indicates that the soil sample undergoes significant creep damage at a lower confining pressure. However, when the confining stress is increased more than 100 kPa, the deviator stress does not exhibit any peak value even at the axial strain of 20%. Figure 5 also shows that under a given confining stress, the axial strain rate of the sample is larger in the early stage of loading and gradually decreases in the later stages. The axial strain required to obtain a stabilized deviator stress increases as the confining pressure increases. The stress-strain behavior of each stress limit is significantly different.
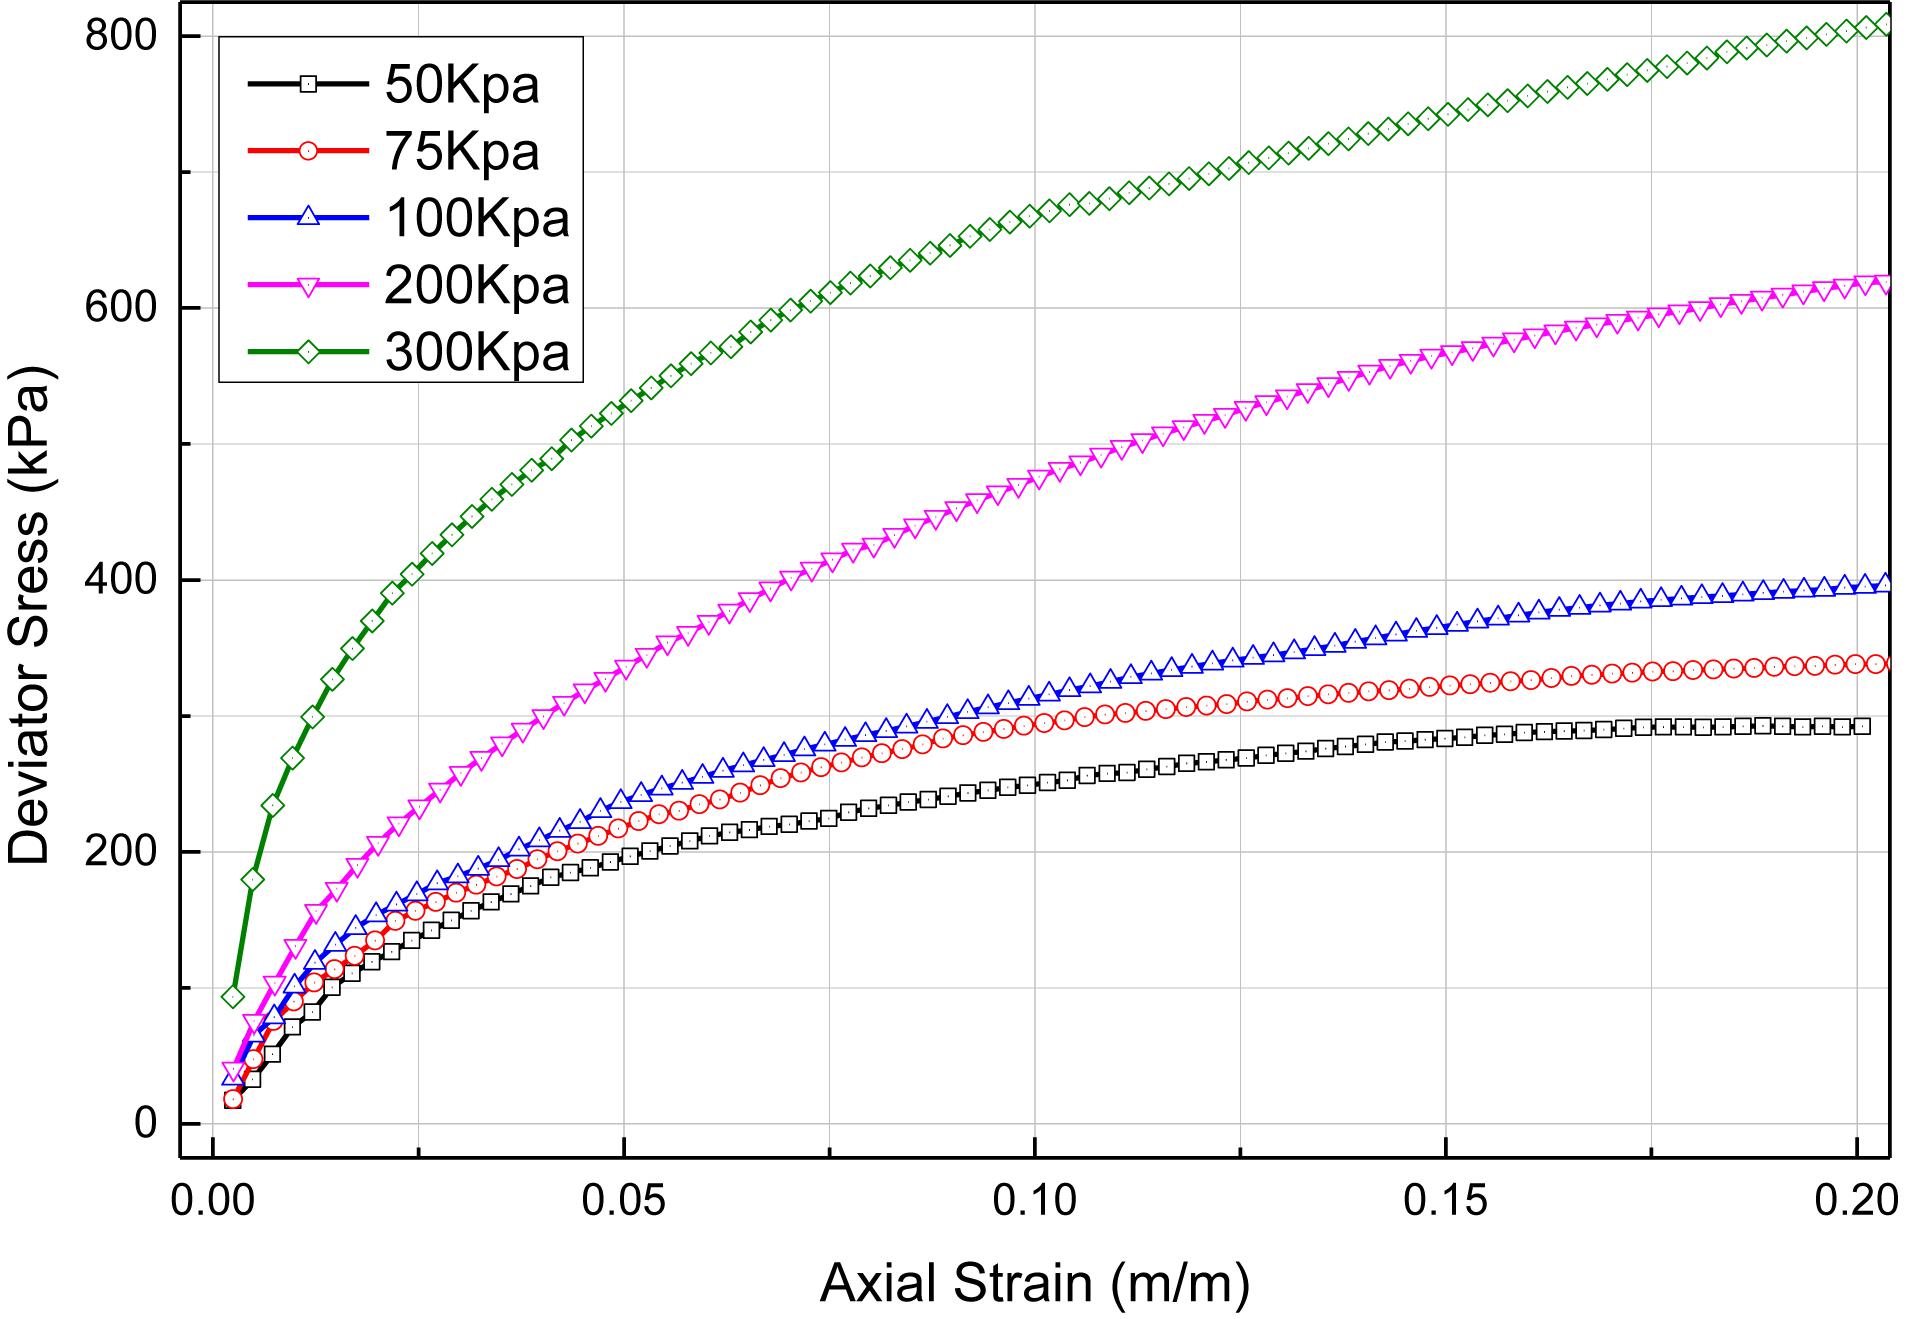
Figure 5. Stress-strain curve of red-clay.
Shear Strength Parameters
Presented in Figure 6 is the Mohr Circles and shear envelopes developed from the CD triaxial compression test results in the low, medium and high confining stress ranges, respectively. Data presented in Table 3 shows the major principal stresses at failure or at 20% axial strain for non-failure red clay specimens, corresponding confining stresses for each set of constrained stress, and the corresponding cohesion and friction angles obtained from linear regression analysis. The average values of the internal friction angle and cohesion all three sets of confining stresses were 21.5° and 61.1 kPa, respectively.
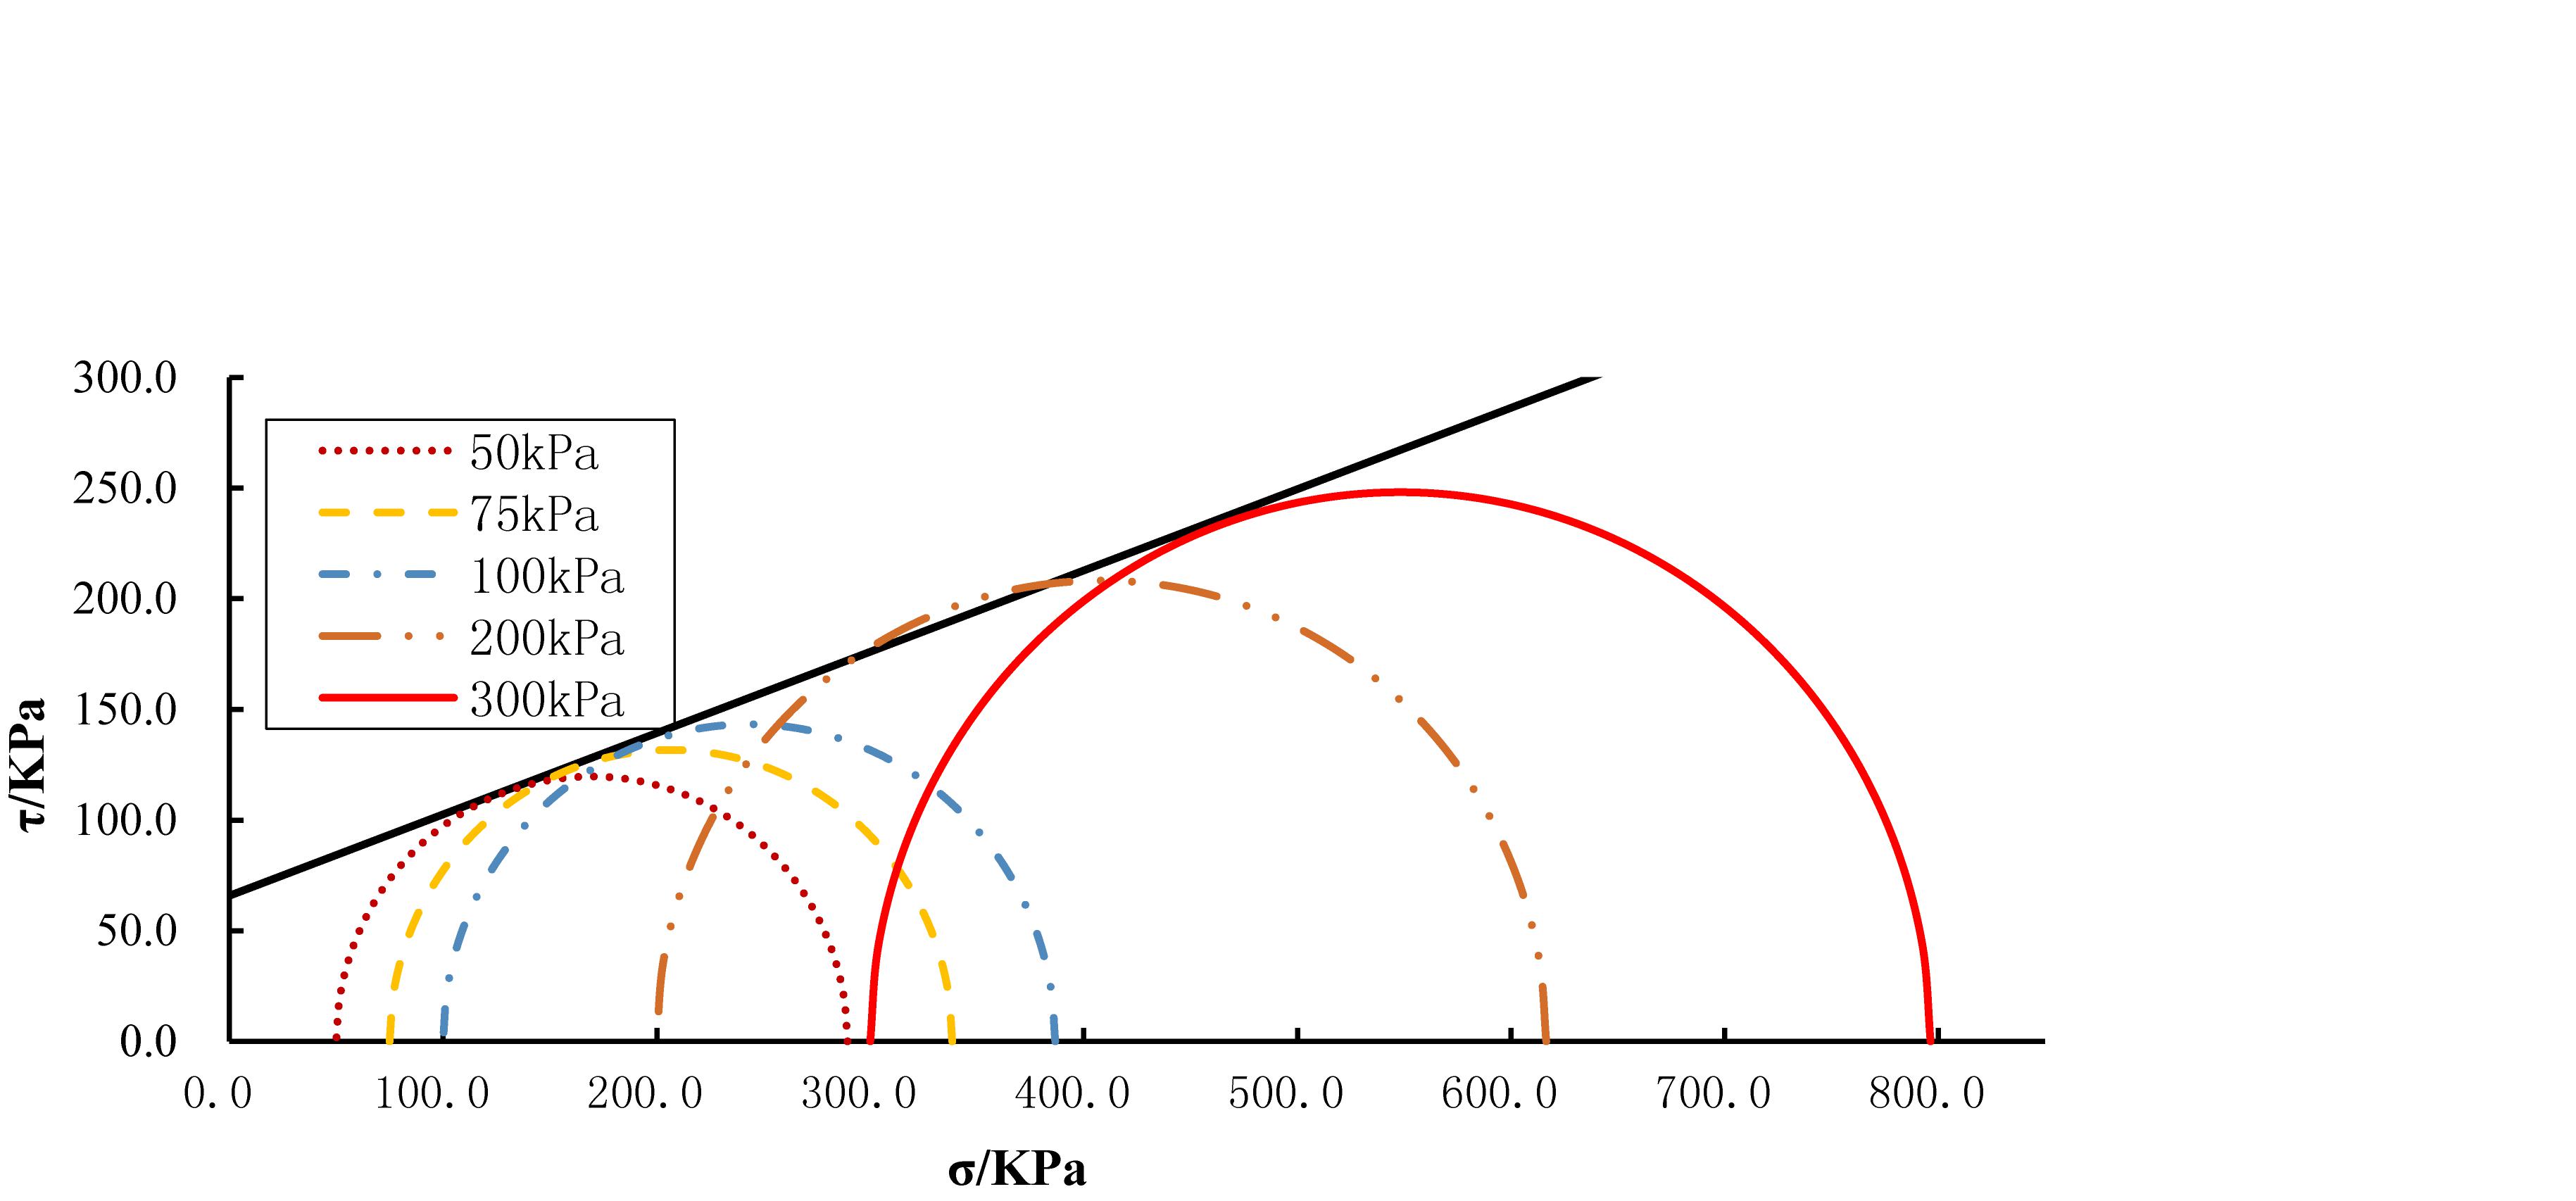
Figure 6. Mohr Circles and shear envelope developed for the red clay samples tested at low confining stress range i.e., 50–300 kPa.
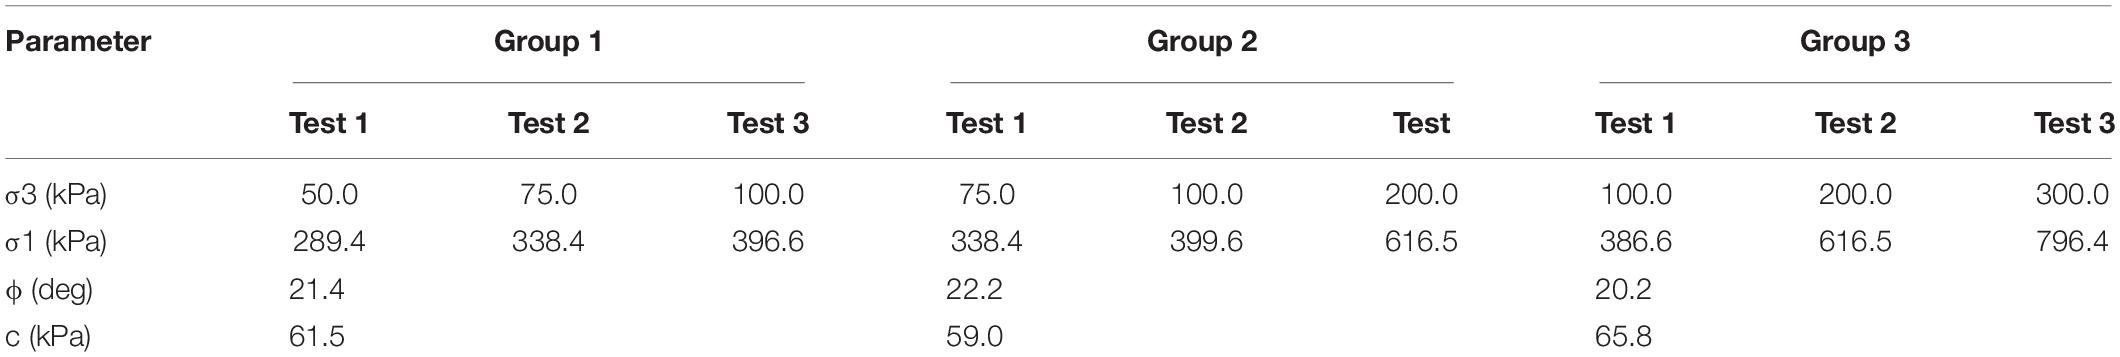
Table 3. Soil strength parameters obtained from the CD triaxial compression tests.
Failure Patterns of the Samples
Figure 7 shows the failure patterns of the samples after the CD triaxial compression tests. As shown in Figure 7, in the case of confining stress 50 and 75 kPa, the deformation pattern was not remarkable, and no failure surface was observed. The sample presented a significant distortion, especially drum shape, when the confining stress is increased to 100 kPa. When the applied confining pressure was 200 kPa, the sample deformed into a distinct drum shape, but there were no clearly visible shear planes observed. Deformation of this drum shape was more prominent and remarkable when the confining pressure of 300 kPa applied. At this confining stress, the samples exhibited a clearly visible shear plane (Figure 7), which can be clearly observed as 45°. However, when the samples were sheared to a complete failure under large deformation, all samples exhibited drum shaped failure as presented in Figure 7F, showing a series of vertical cracks, irrespective of the confining stress.
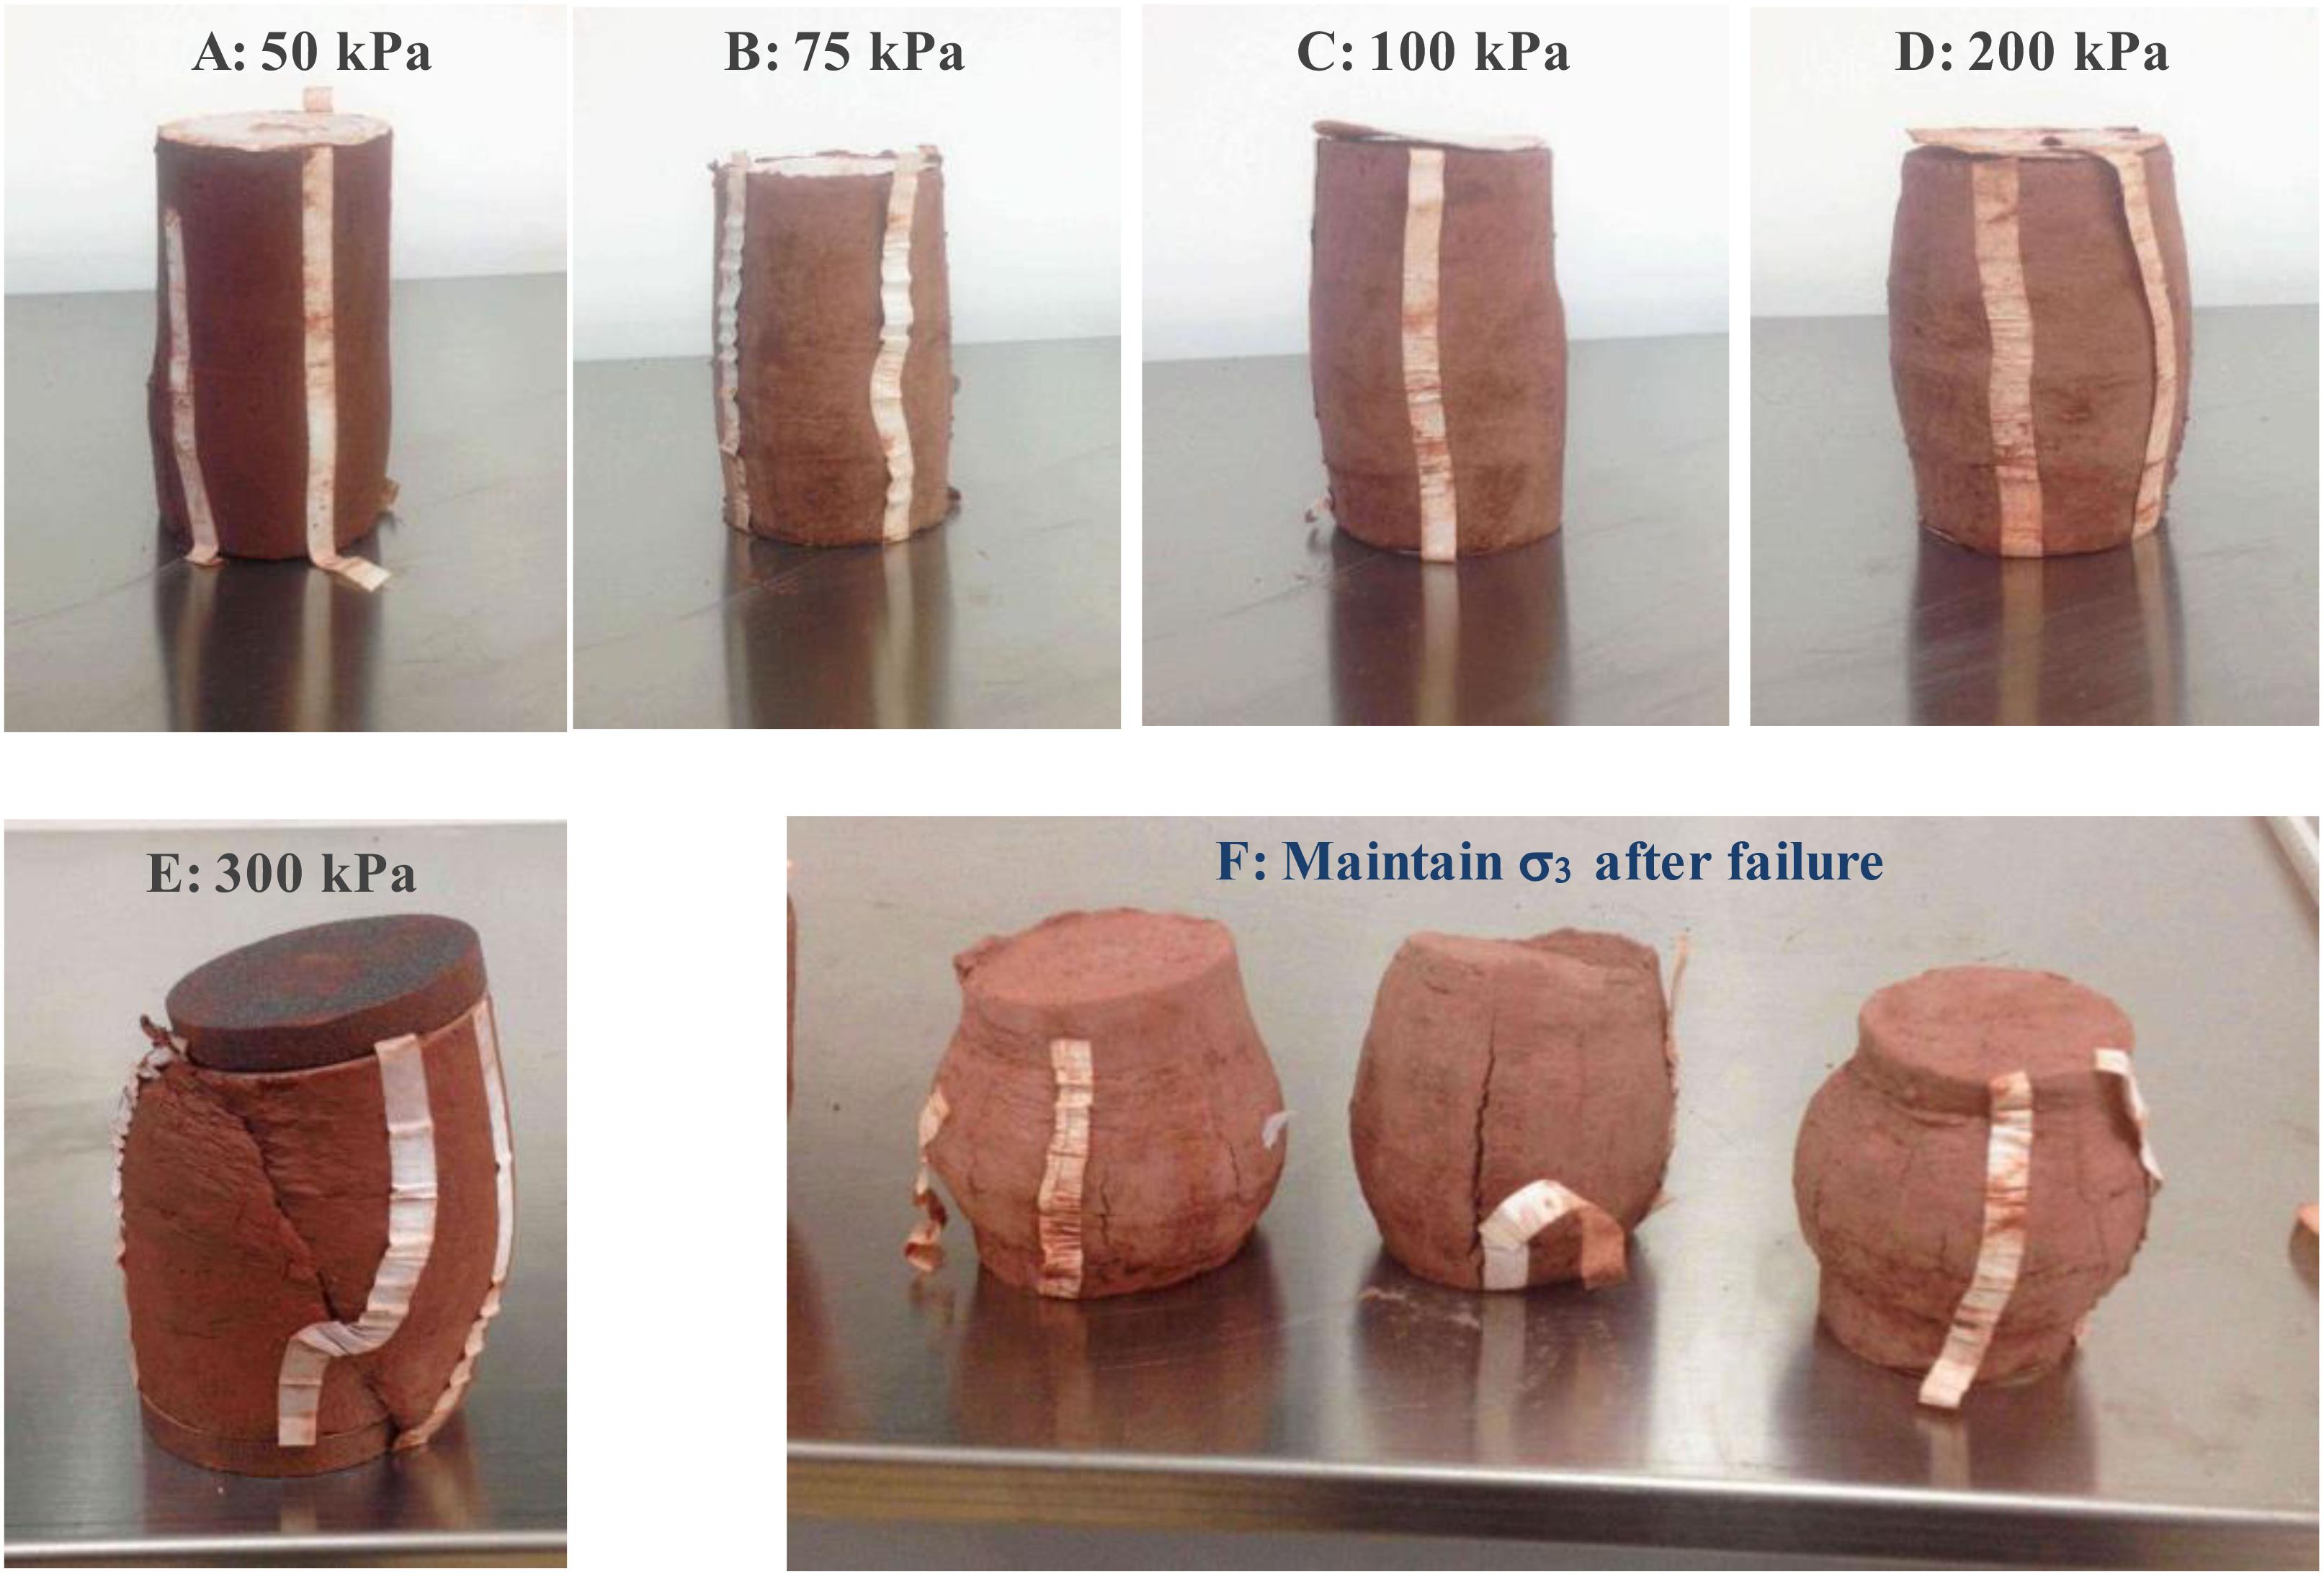
Figure 7. Failure patterns after shear strength tests. (A–F) Represents different confining pressures.
Triaxial Creep Tests
Creep Curve Analysis
Red clay is a typical elastic-plastic material. Instantaneous elastic and plastic deformation occurs when an additional external force is applied. Figure 8 shows the development of vertical deformation of the samples under confining stresses of 50, 75, and 100 kPa. Furthermore, the creep curves of multi-step constant load, the equal-time stress-strain curves were gained by using “Chen method” (Chen et al., 1991). Results presented in Figure 8 indicates that the creep patterns exhibited stepped shape under confined pressure, except for samples failed in the final loading step. The corresponding deformation process of every loading step can be divided into three stages: (1) the instantaneous deformation stage; vertical deformation ended instantaneously at this stage; this stage accounted for about 55% of the total deformation and exhibits elastic-plastic deformation. (2) Deceleration creep deformation stage; in this deformation stage, vertical deformation accounts for 29∼41% of the total deformation approximately; the deformation rate was larger in the early stage followed by a gradual decay in the later part of this stage; this stage accounts for 1∼13% of the total loading time, and (3) Stable creep deformation stage; the deformation of the sample at this stage tends to be stable; the vertical deformation at this stage, basically, accounts for about 4% of the total vertical deformation. Sample tested at the confining stress of 50 kPa in this stage exhibited accelerated creep and failure (i.e., 25 mm of vertical deformation) at the 4th step of loading, just after 16640 s (4.62 h) of loading. However, for soil samples tested at confining pressures of 75 and 100 kPa, the samples exhibited accelerated creep and failure at the fifth loading step. Most of the deformation occurs at the initial stage of loading as the confining pressure increases.
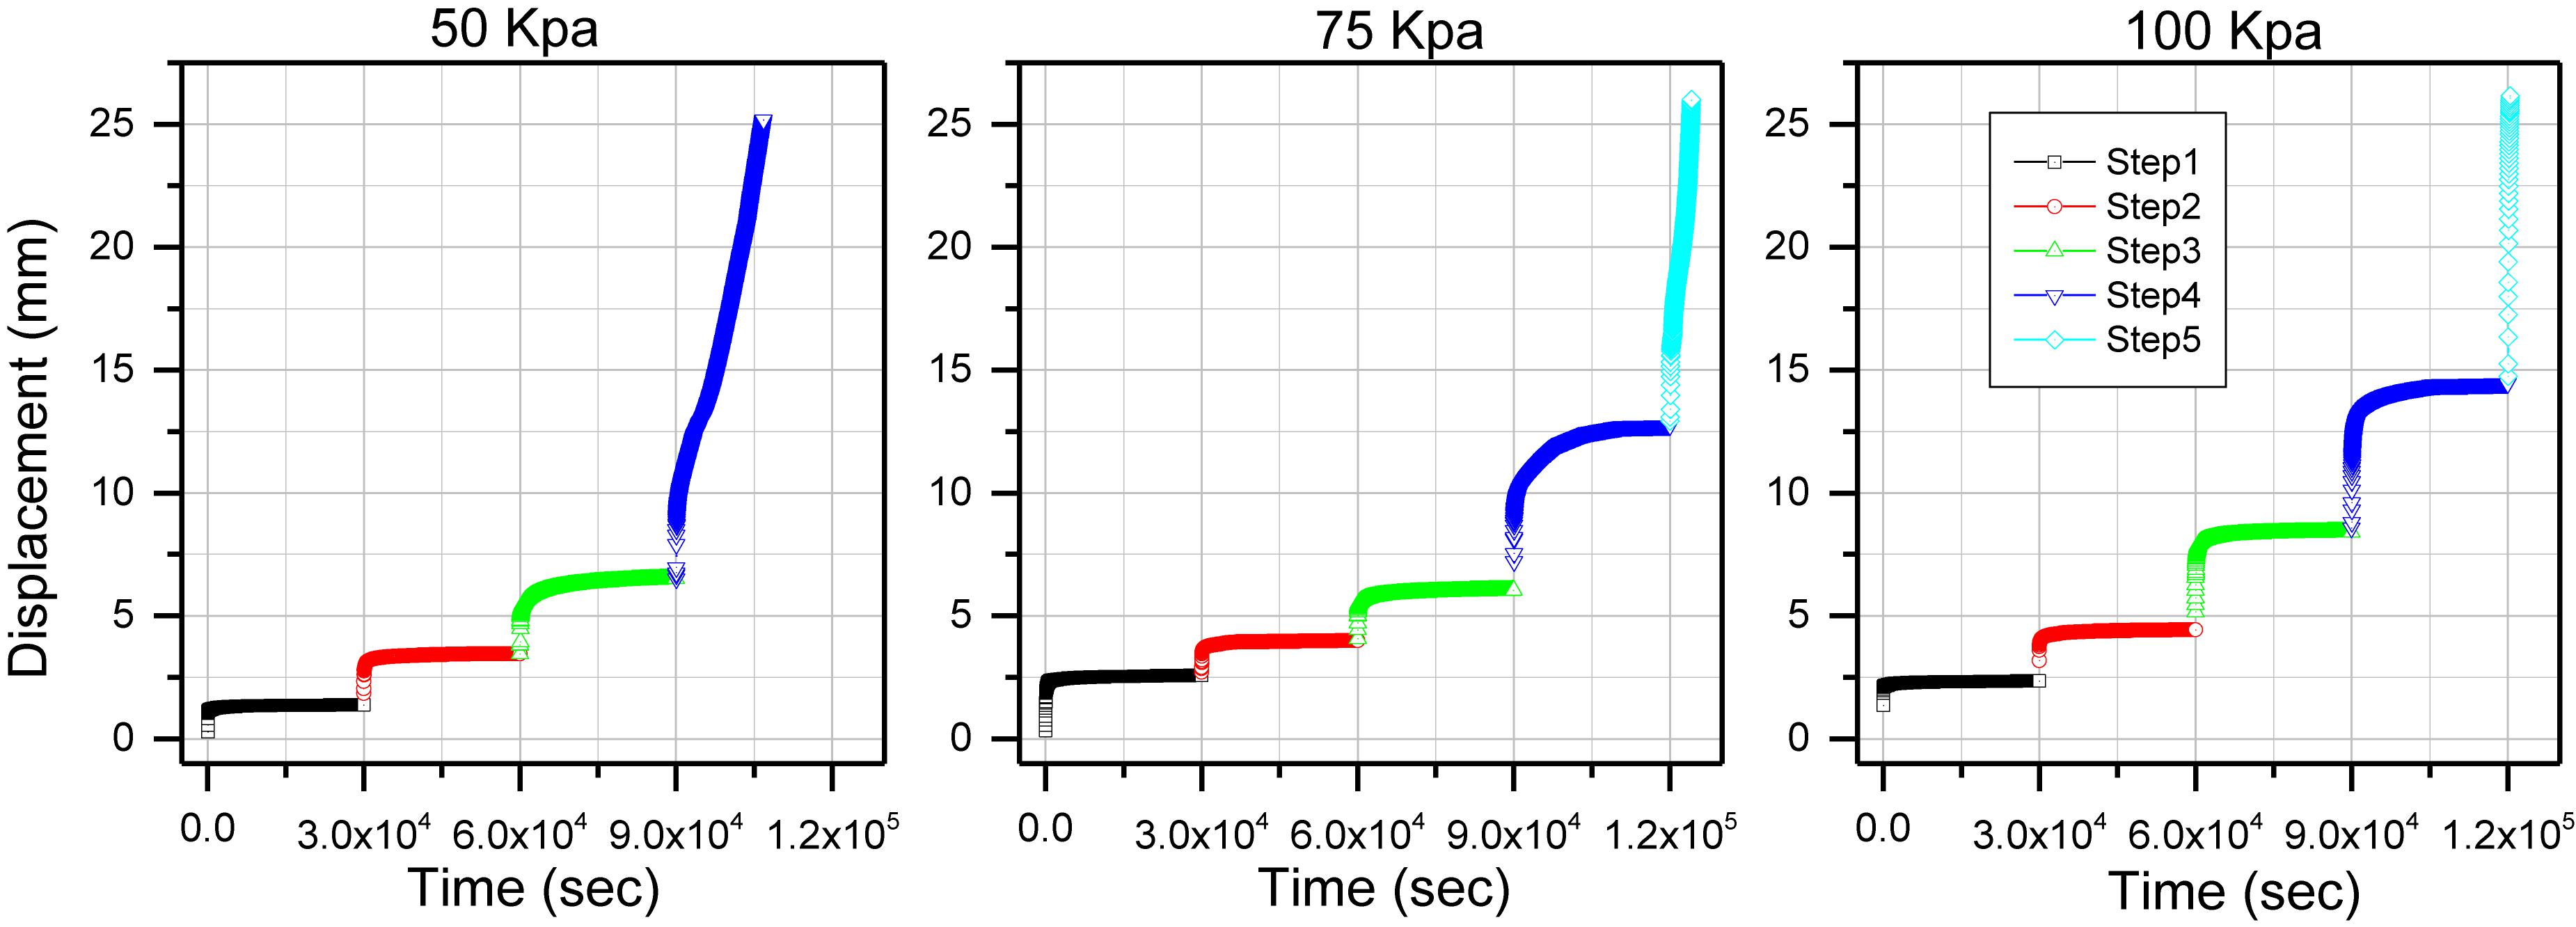
Figure 8. Creep deformation tests curves obtained for different confining stresses.
In order to observe the rate of displacement over time more clearly, the creep curves were replotted with time in logarithmic scale, as shown in Figure 9. The results indicated that the development of deformation can be divided into two stages under the first three loading steps. In the early days, In the early days, the deformation developed at a high speed, and at a later stage the deformation speed decreased. The samples tested at a confining stress of 50 kPa exhibited failure at the fourth loading step by exhibiting a big instantaneous vertical deformation in the early stage following by the stable deformation in the second stage further followed by a sharp increase in deformation until failure in the last stage of loading. For the samples tested at the confining stresses of 75 and 100 kPa, a larger deformation was observed when the fourth loading step was applied. When the vertical deformation rate in these samples is larger than a certain amount of antecedent value, then rate of deformation is stable until the fifth loading step. The creep patterns obtained for samples tested at the confining stresses of 75 and 100 kPa exhibited different behaviors. The behavior of the former is similar to that tested at the confining stress of 50 kPa, but if shorten processing time. However, the later entered the stage of rapid creep phase and failure after instantaneous deformation appeared.
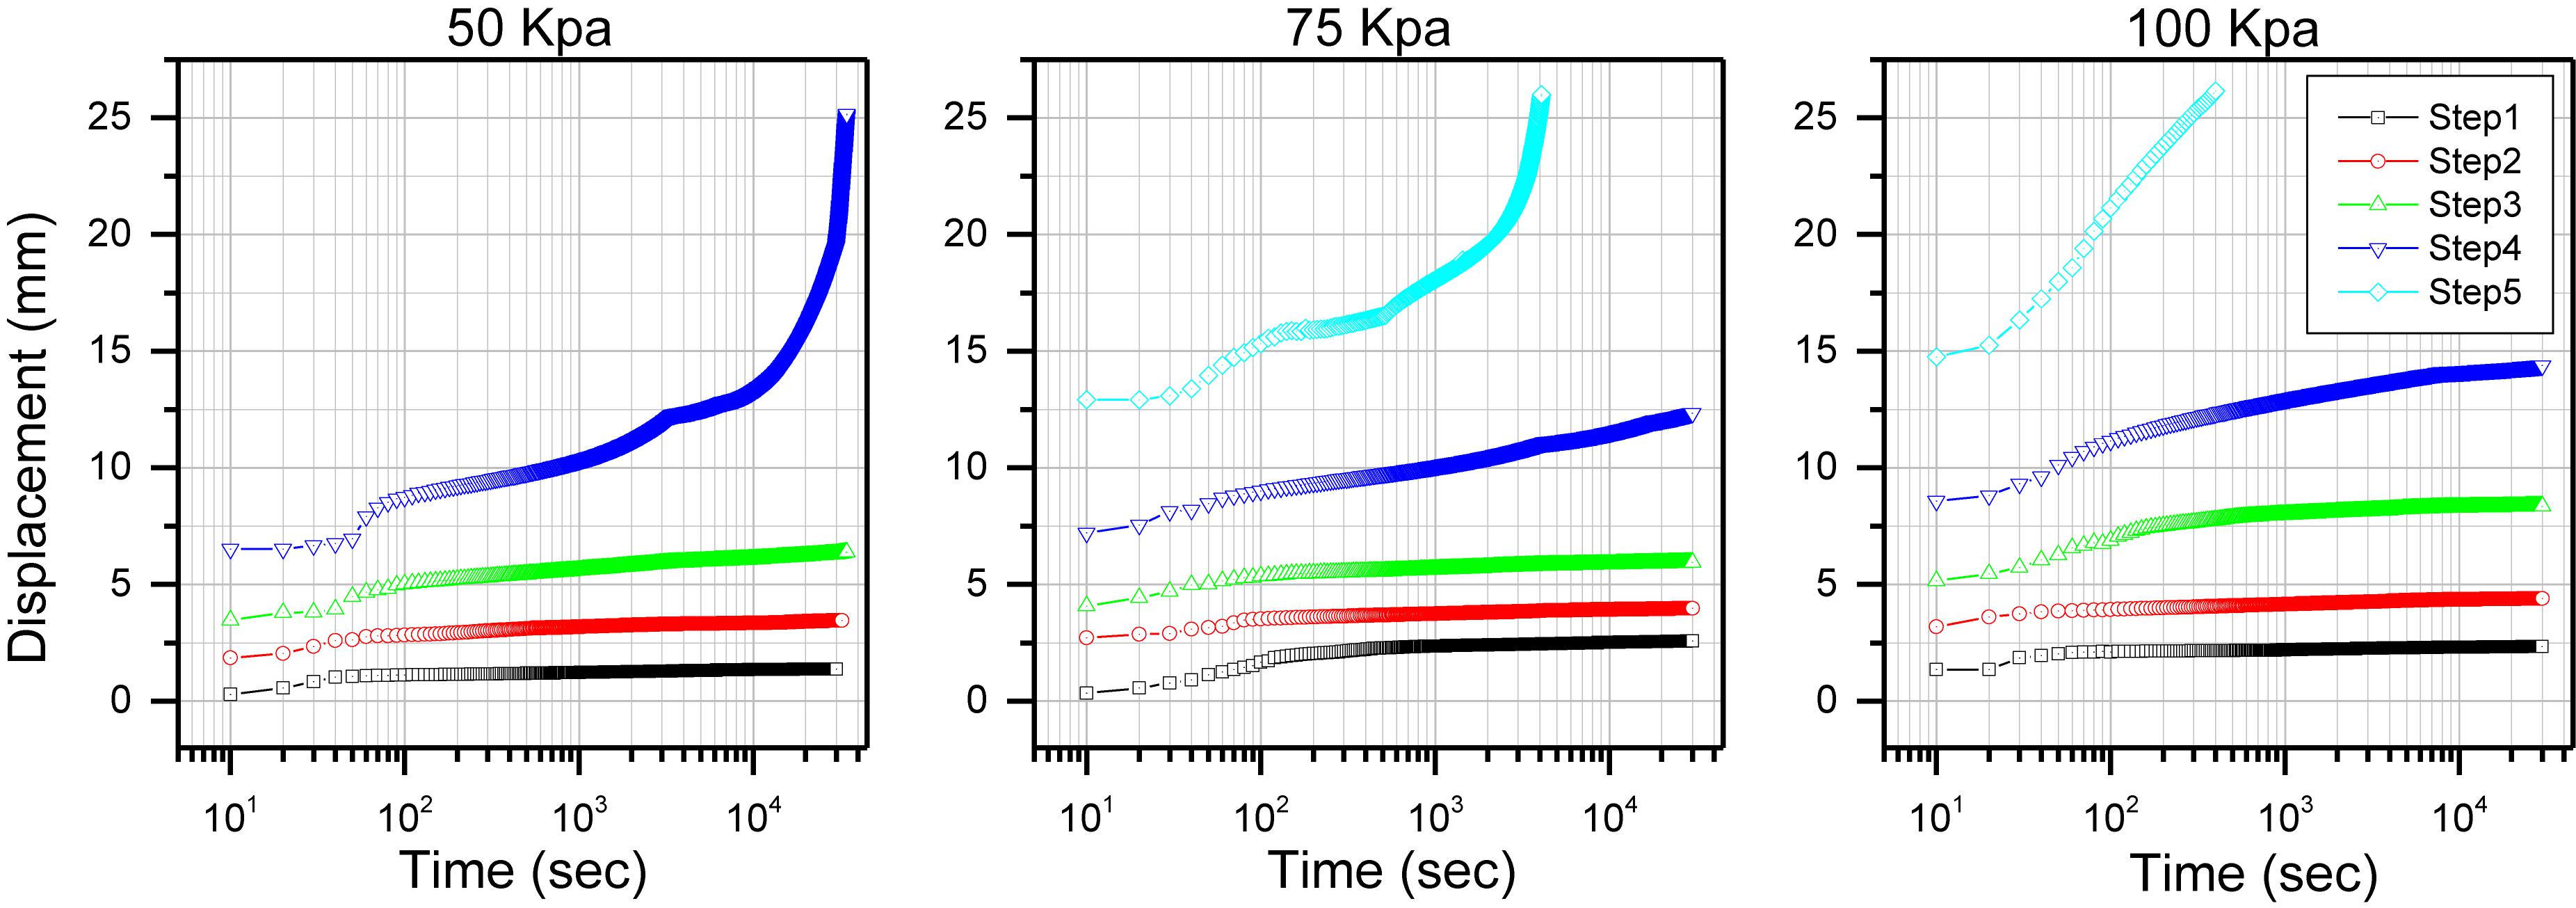
Figure 9. Creep deformation tests curves for different confining pressure with time plotted in logarithm scale.
Strain Rate Analysis
Figure 10 shows the strain rate during the five steps of the loading process under the confining stress of 75 kPa. Results presented in Figure 10 indicates that the creep rate at the earlier stage is larger than the later stage in each step. The initial strain rate mounted as the vertical stress increases. However, the initial strain rate of the fifth step is lower than that the fourth step, and it reduced to 0 following a prolonged loading time, then up to a high level until the entire sample failed.
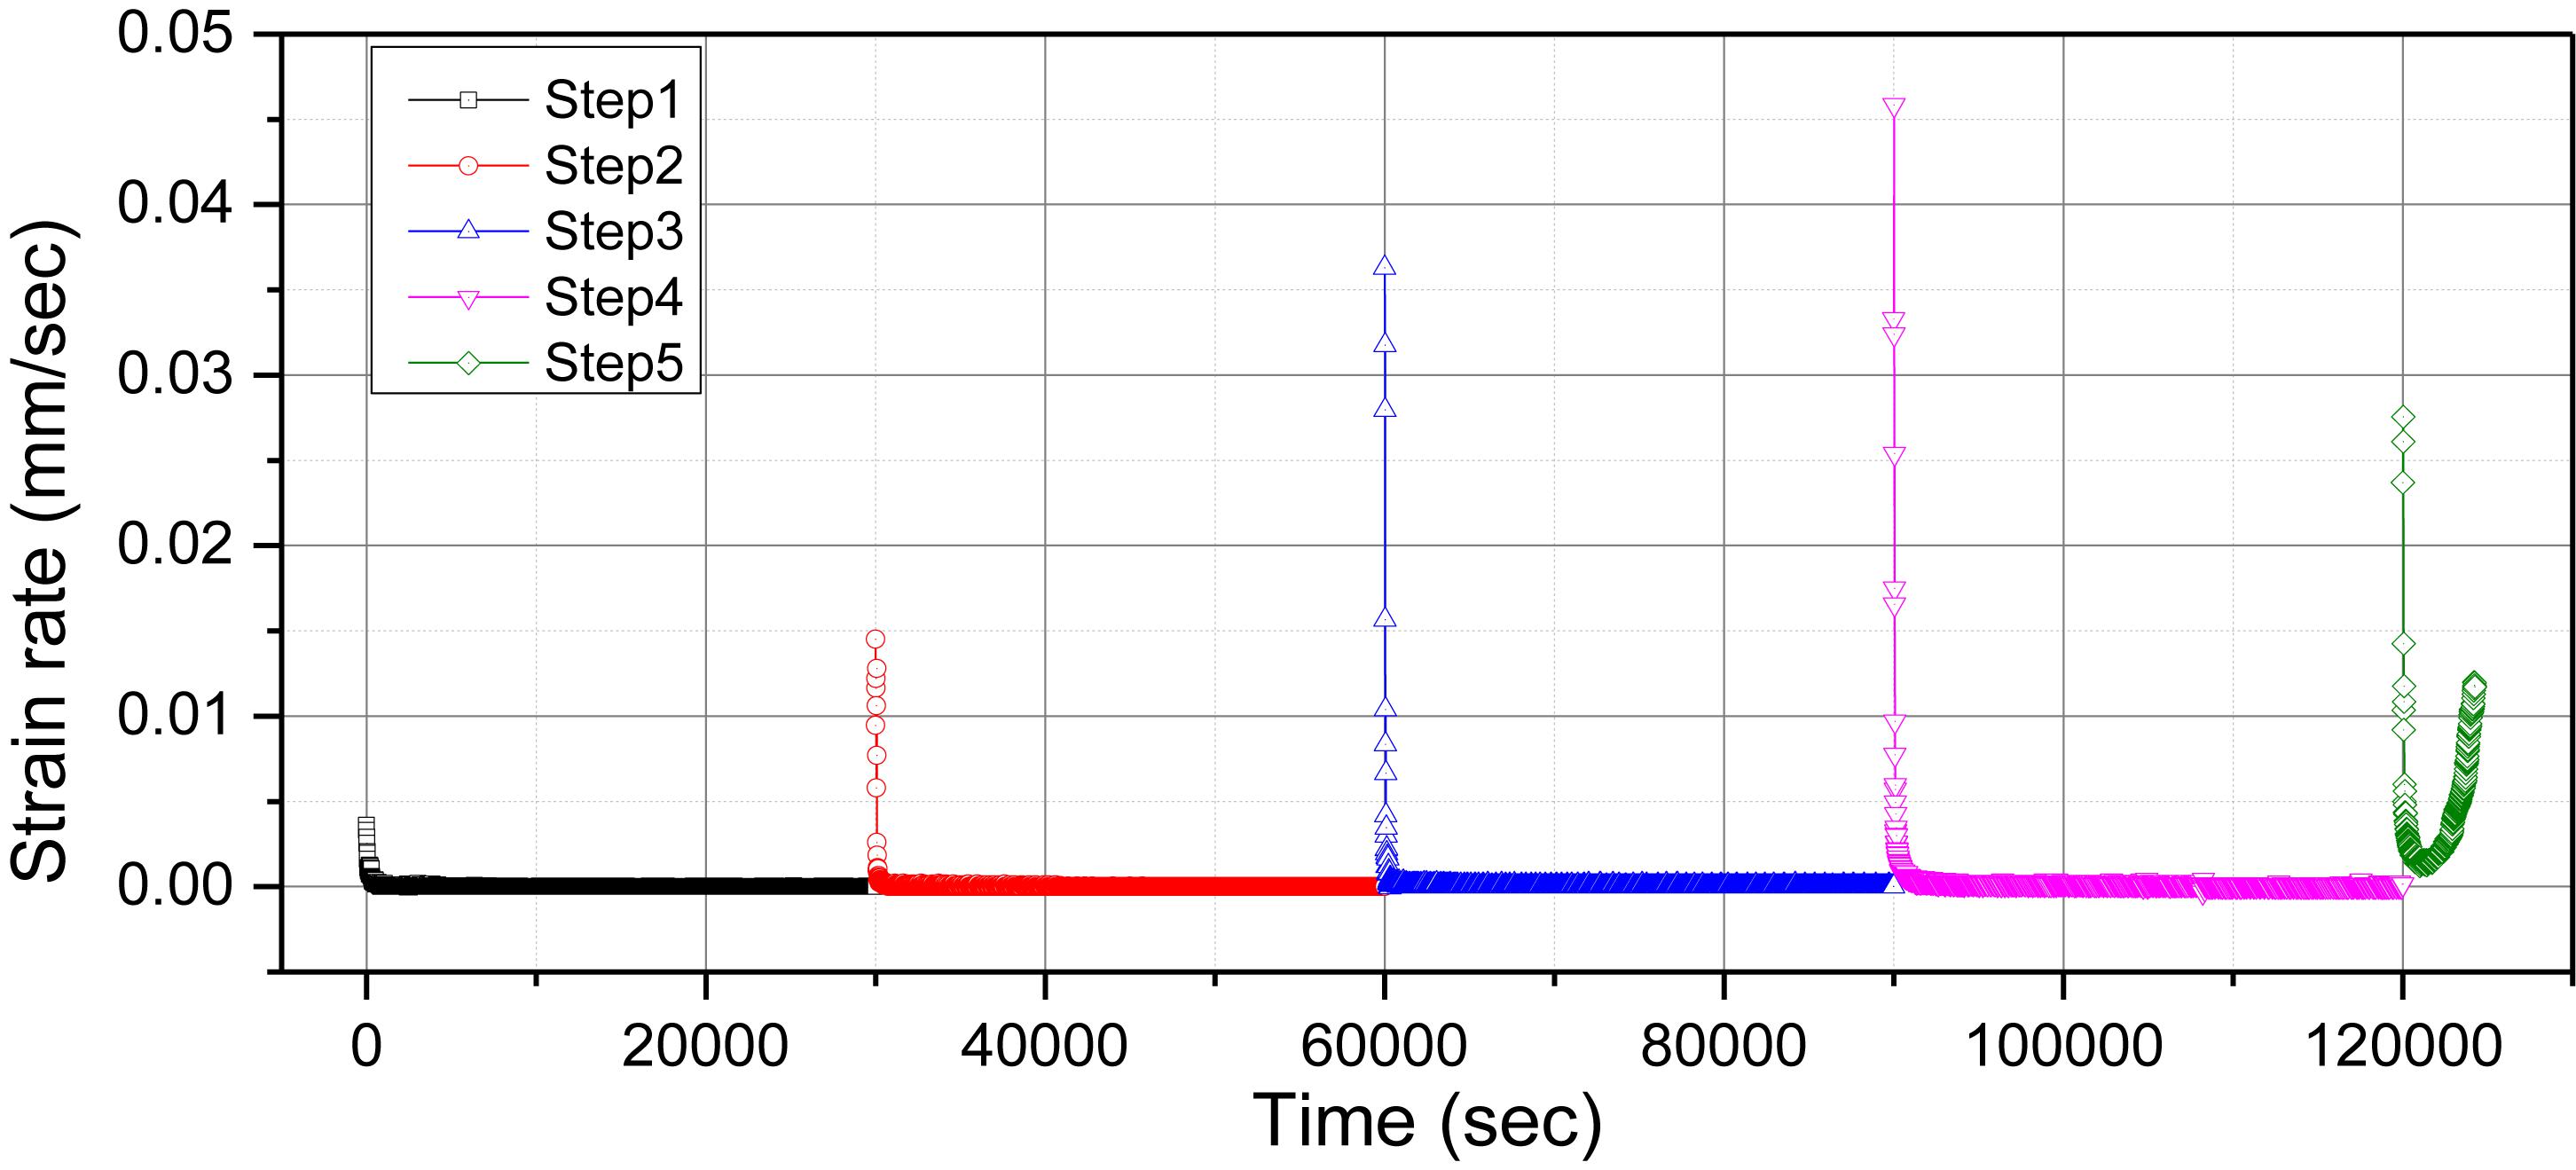
Figure 10. Creep deformation development rates (for the sample tested at the confining stress of 75 kPa).
The Failure Patterns After Creep Tests
Figure 11 shows a typical failure pattern of tested red clay after creep testing conducted under different confining stresses. Results indicated that there was no defined failure plane in the sample tested at the confining stress of 50 kPa, and; the overall shape exhibited parabolic bulging in the shape of a drum. In the case of samples tested at the confining stress of 75 kPa, a clearly defined shear plane was observed and the sample still exhibited parabolic bulging with drum shape. In the case of samples tested at the confining stress of 100 kPa, the sample exhibited more complex distortion at a predefined shear plane.
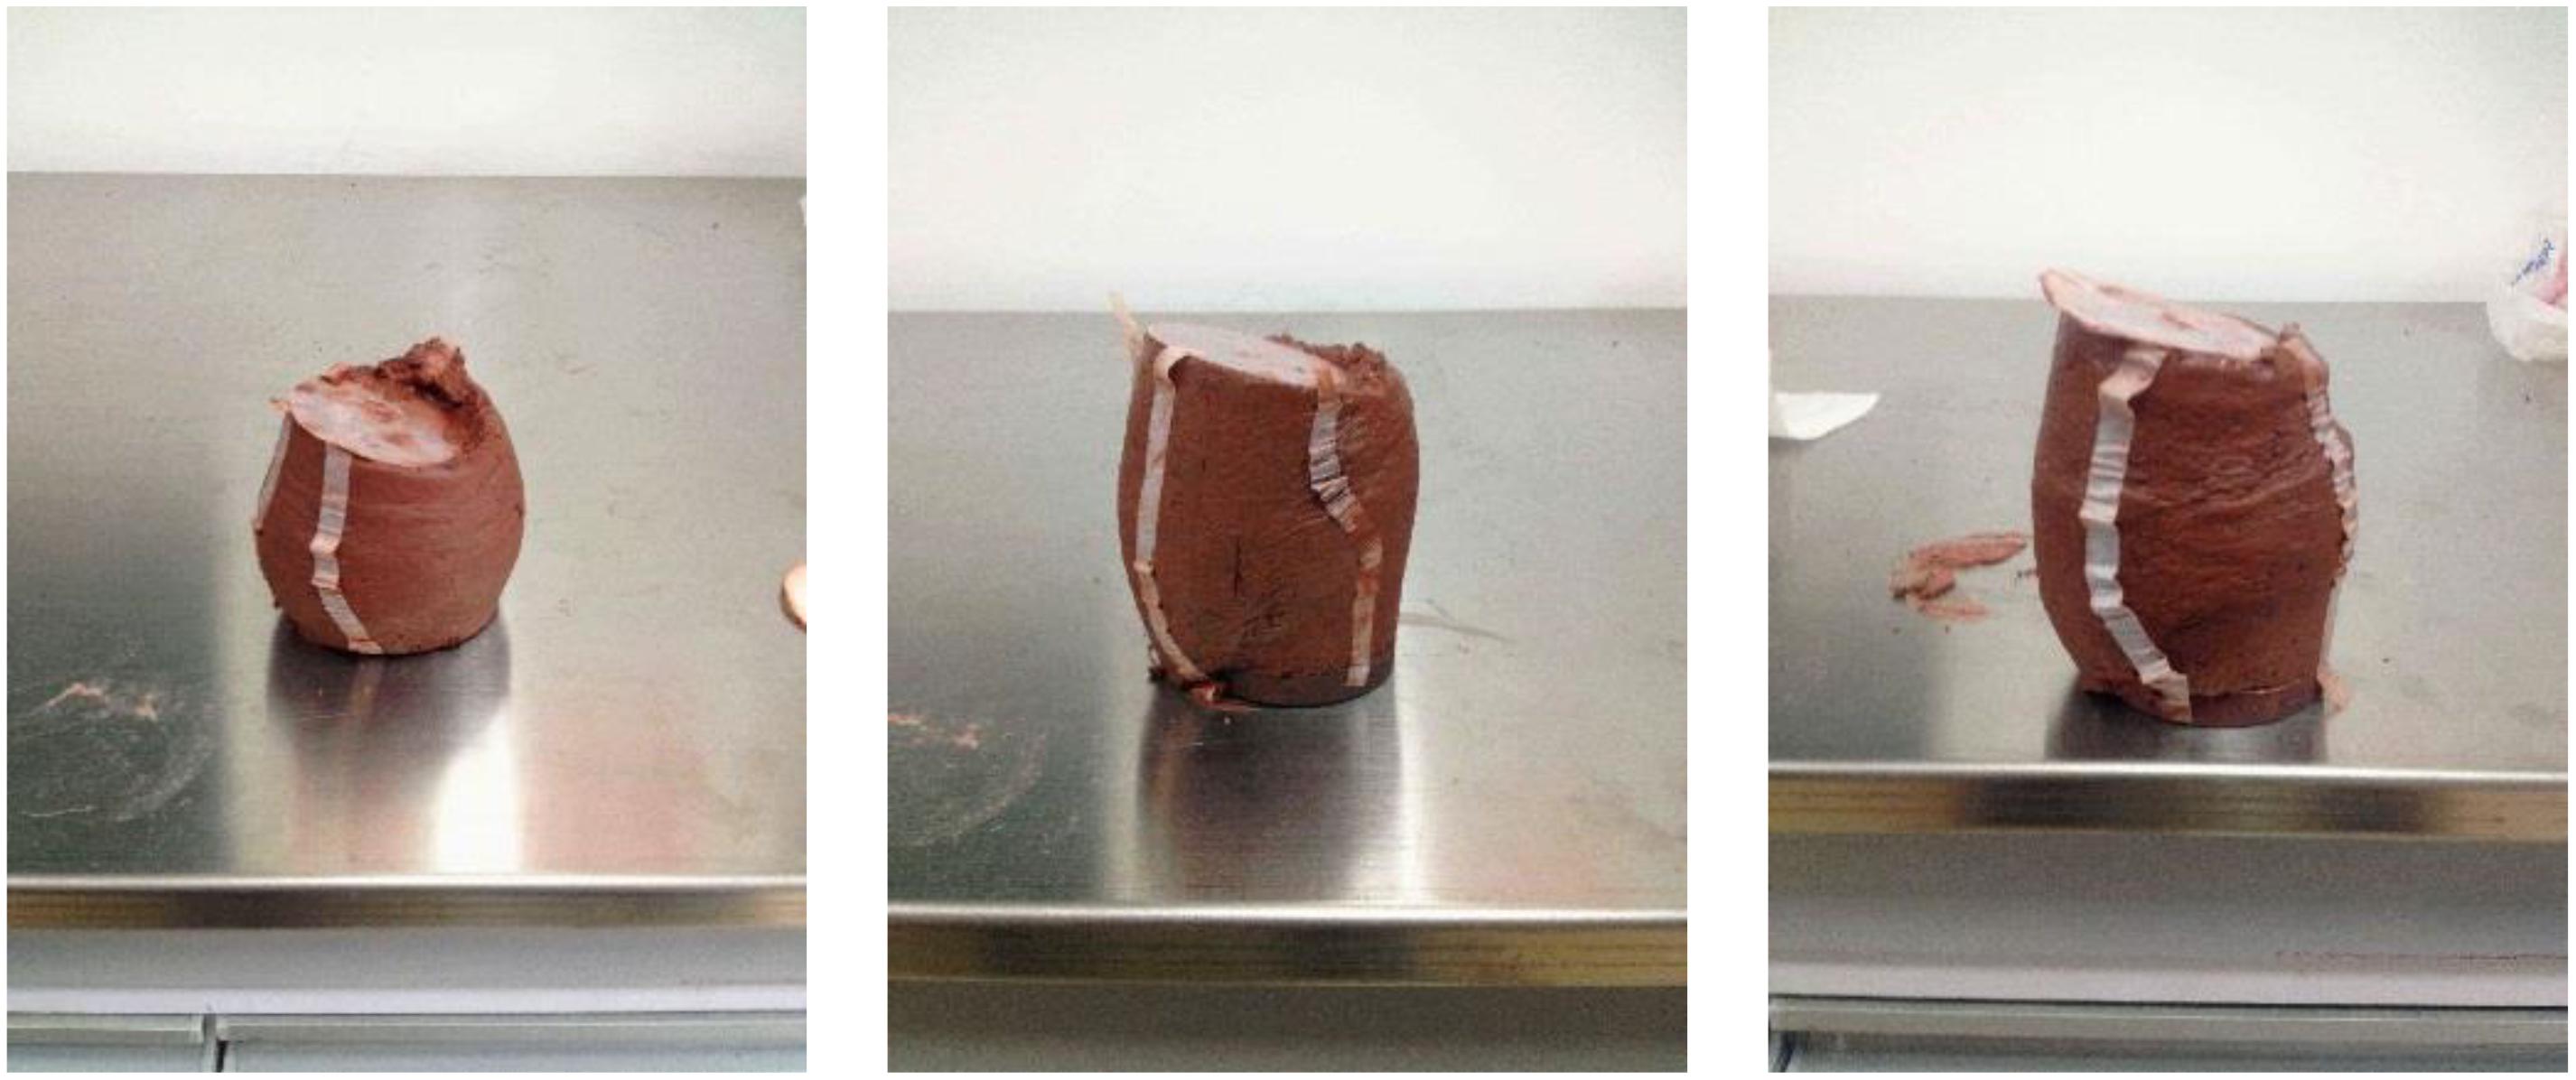
Figure 11. Failure patterns after creep tests.
Development of Creep Model
In order to assess the creep behavior of the soil, it is important to compare the creep deformation pattern with available creep model. Some of the available creep deformation models in practice are presented in Table 4. In order to check the applicability of the available models to fit the creep deformation characteristics of red clays, results obtained from this study of the confining stress of 100 kPa was compared with the results obtained from the available creep deformation models presented in Table 4. Among the models presented in Table 4, results obtained by Kelvin Model, General Kelvin Model, and Burgers Model are presented in this paper as they provided closer comparison compared to other models.
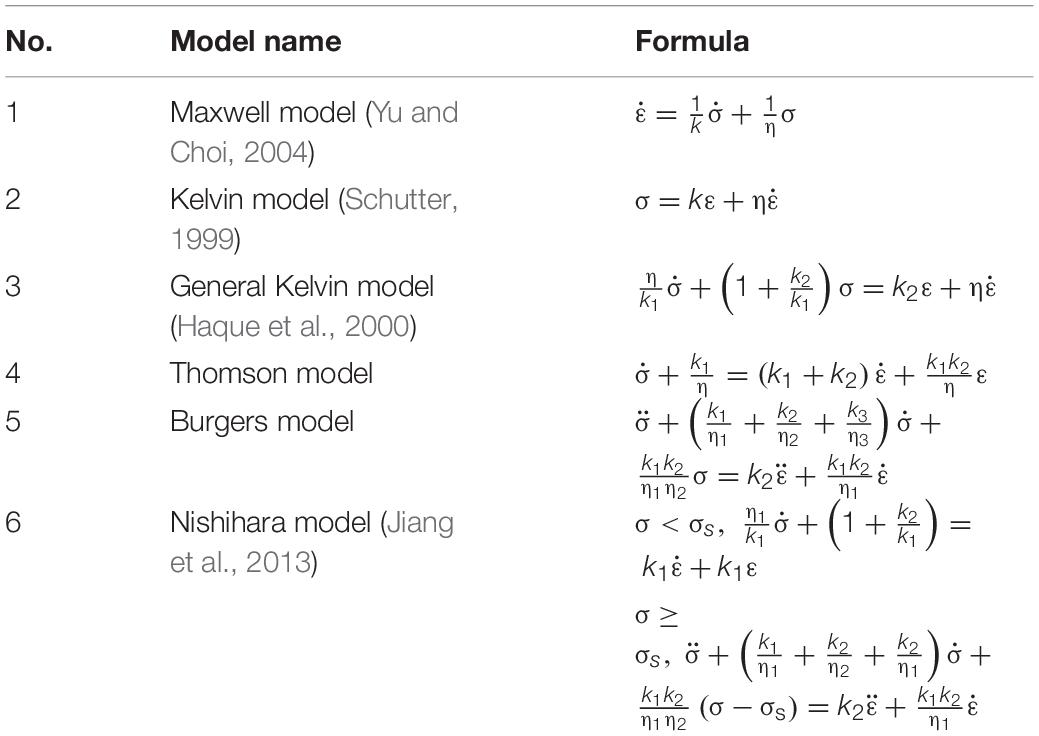
Table 4. Widely used creep models available in practice.
Figure 12 shows the comparison of analysis results obtained from the three models and Table 5 shows the goodness of fit with these models.
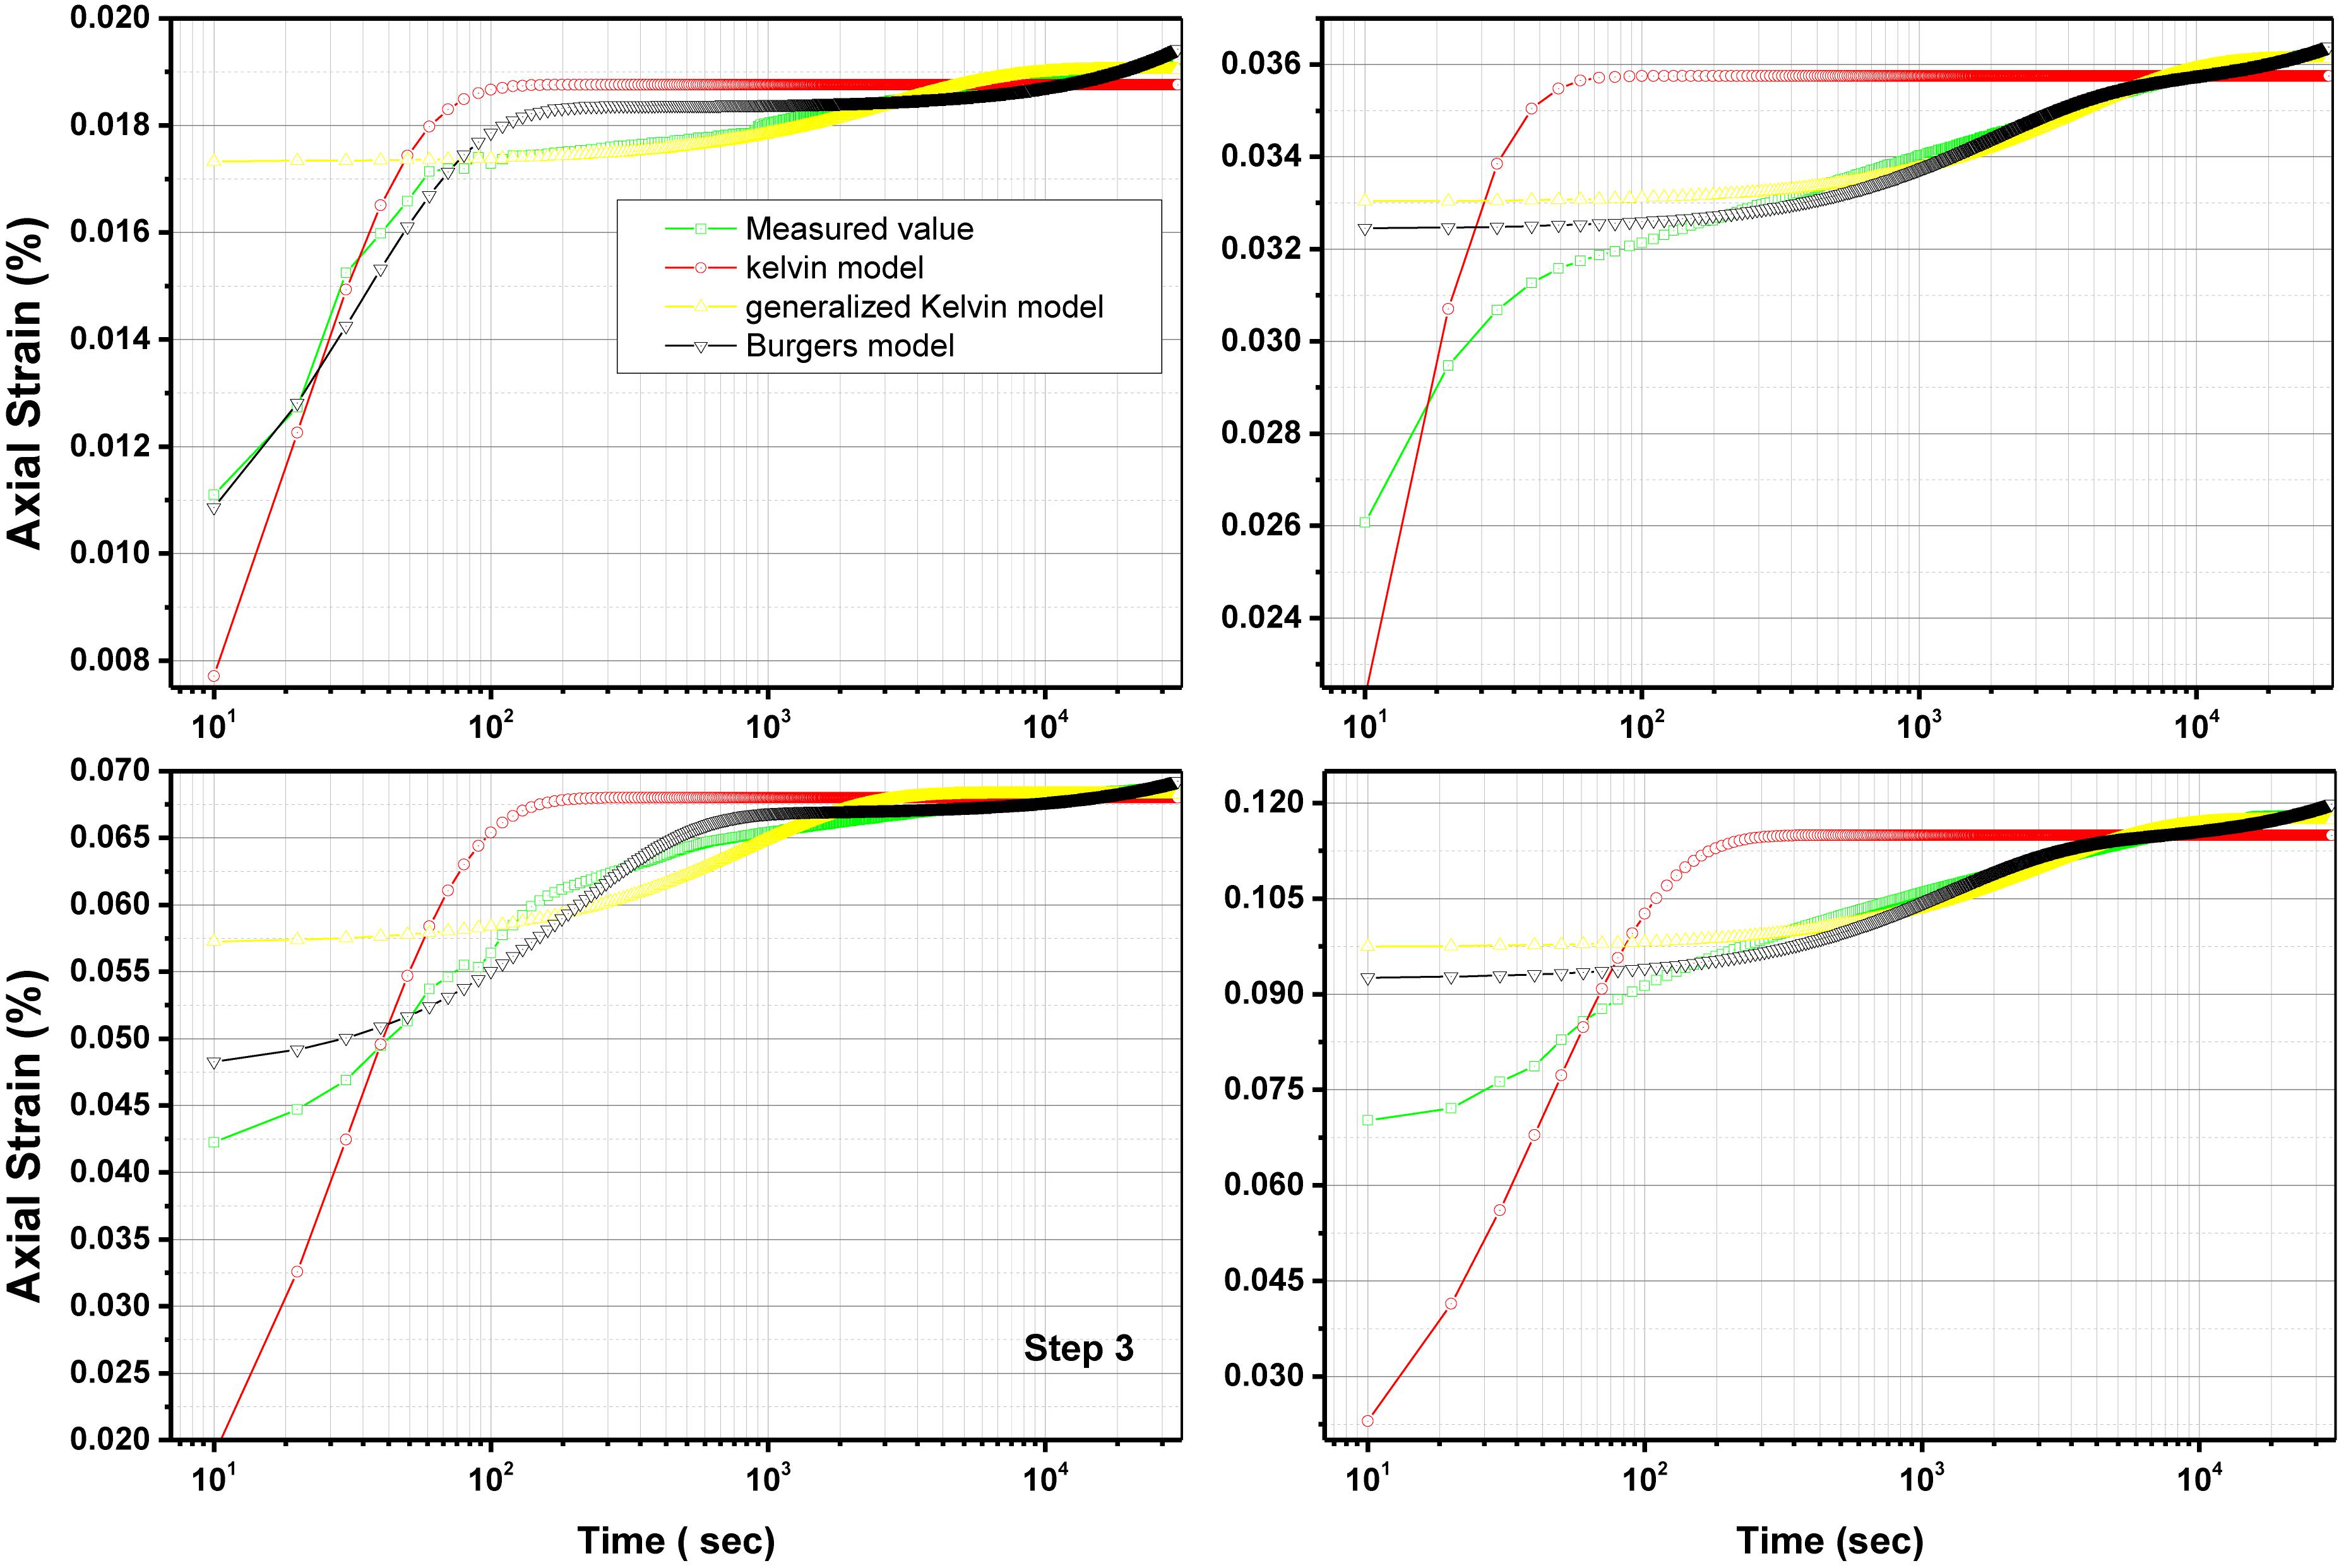
Figure 12. Fitted curve for different creep models (time presented in log scale).
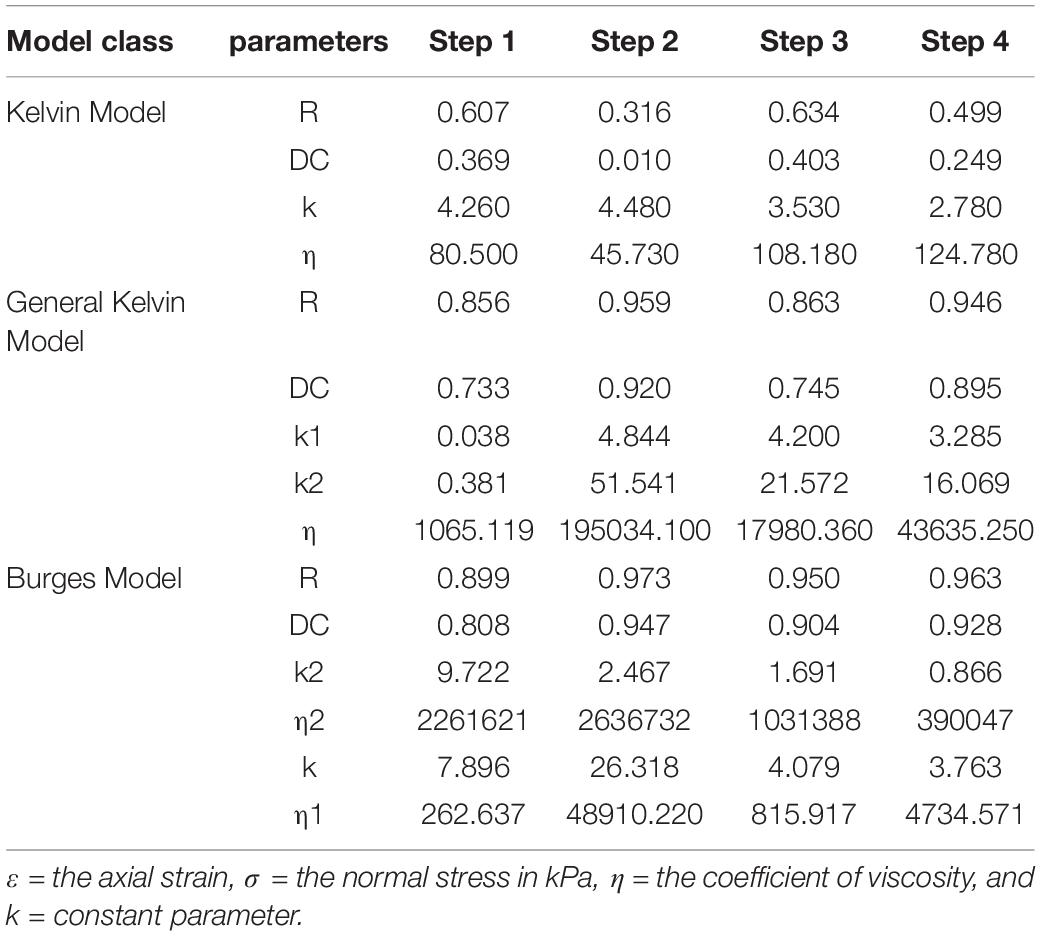
Table 5. Goodness of fitting parameters for some of the creep models used in this study.
Figure 12 shows that there are significant differences in every loading step between the curve fitted to the Kelvin Model and the experimental results, showing that the Kelvin Model is not suitable for describing he creep behavior of red clay. Similarly, the curve fitted by the General Kelvin Model was modified to present three typical stages: elastic deformation stage, deceleration creep stage, and stable creep stage, and the creep deformation pattern is similar to the results of laboratory tests. However, the calculation accuracy is not good enough, and the third step curve exhibited a poor fitting. On the other hand, the fitted curve based on the Burges Model shows better performance than the Kelvin Model and General Kelvin Model, and its correlation coefficient R2 is larger than 0.9. However, the curve showed a rising trend in the end, deviating off from the test data. As shown although the Burgers Model showed better result compared to other models none of the models could represent the creep behavior of the red clay, especially in the early stages deformation.
In addition to the above-mentioned theoretical model, empirical models can also be developed based on experimental data. This approach is more concise more direct and provides high precision. Lu et al. (2008) proposed a general expression to describe the creep deformation properties the of soft clay described in Eq. 1.
In this study, tests data were fitted by using the 1st Opt Universal Global Optimization (UGO) algorithm. In this approach, the creep deformation models for every step of testing are as follows:
Where, ε is the strain of the sample, and t is the loading time in seconds.
The fitted data matched well with the test data as shown in Figure 13. The results indicates that curves of all five steps fit well with the correlation coefficient R of 0.99, proving that the empirical model is more suitable for describing the red clay creep behavior. However, such empirical models are site specific and soil specific thus may not be available for all types of soil until they are verified with further experimental results acquired on soils obtained from other sites.
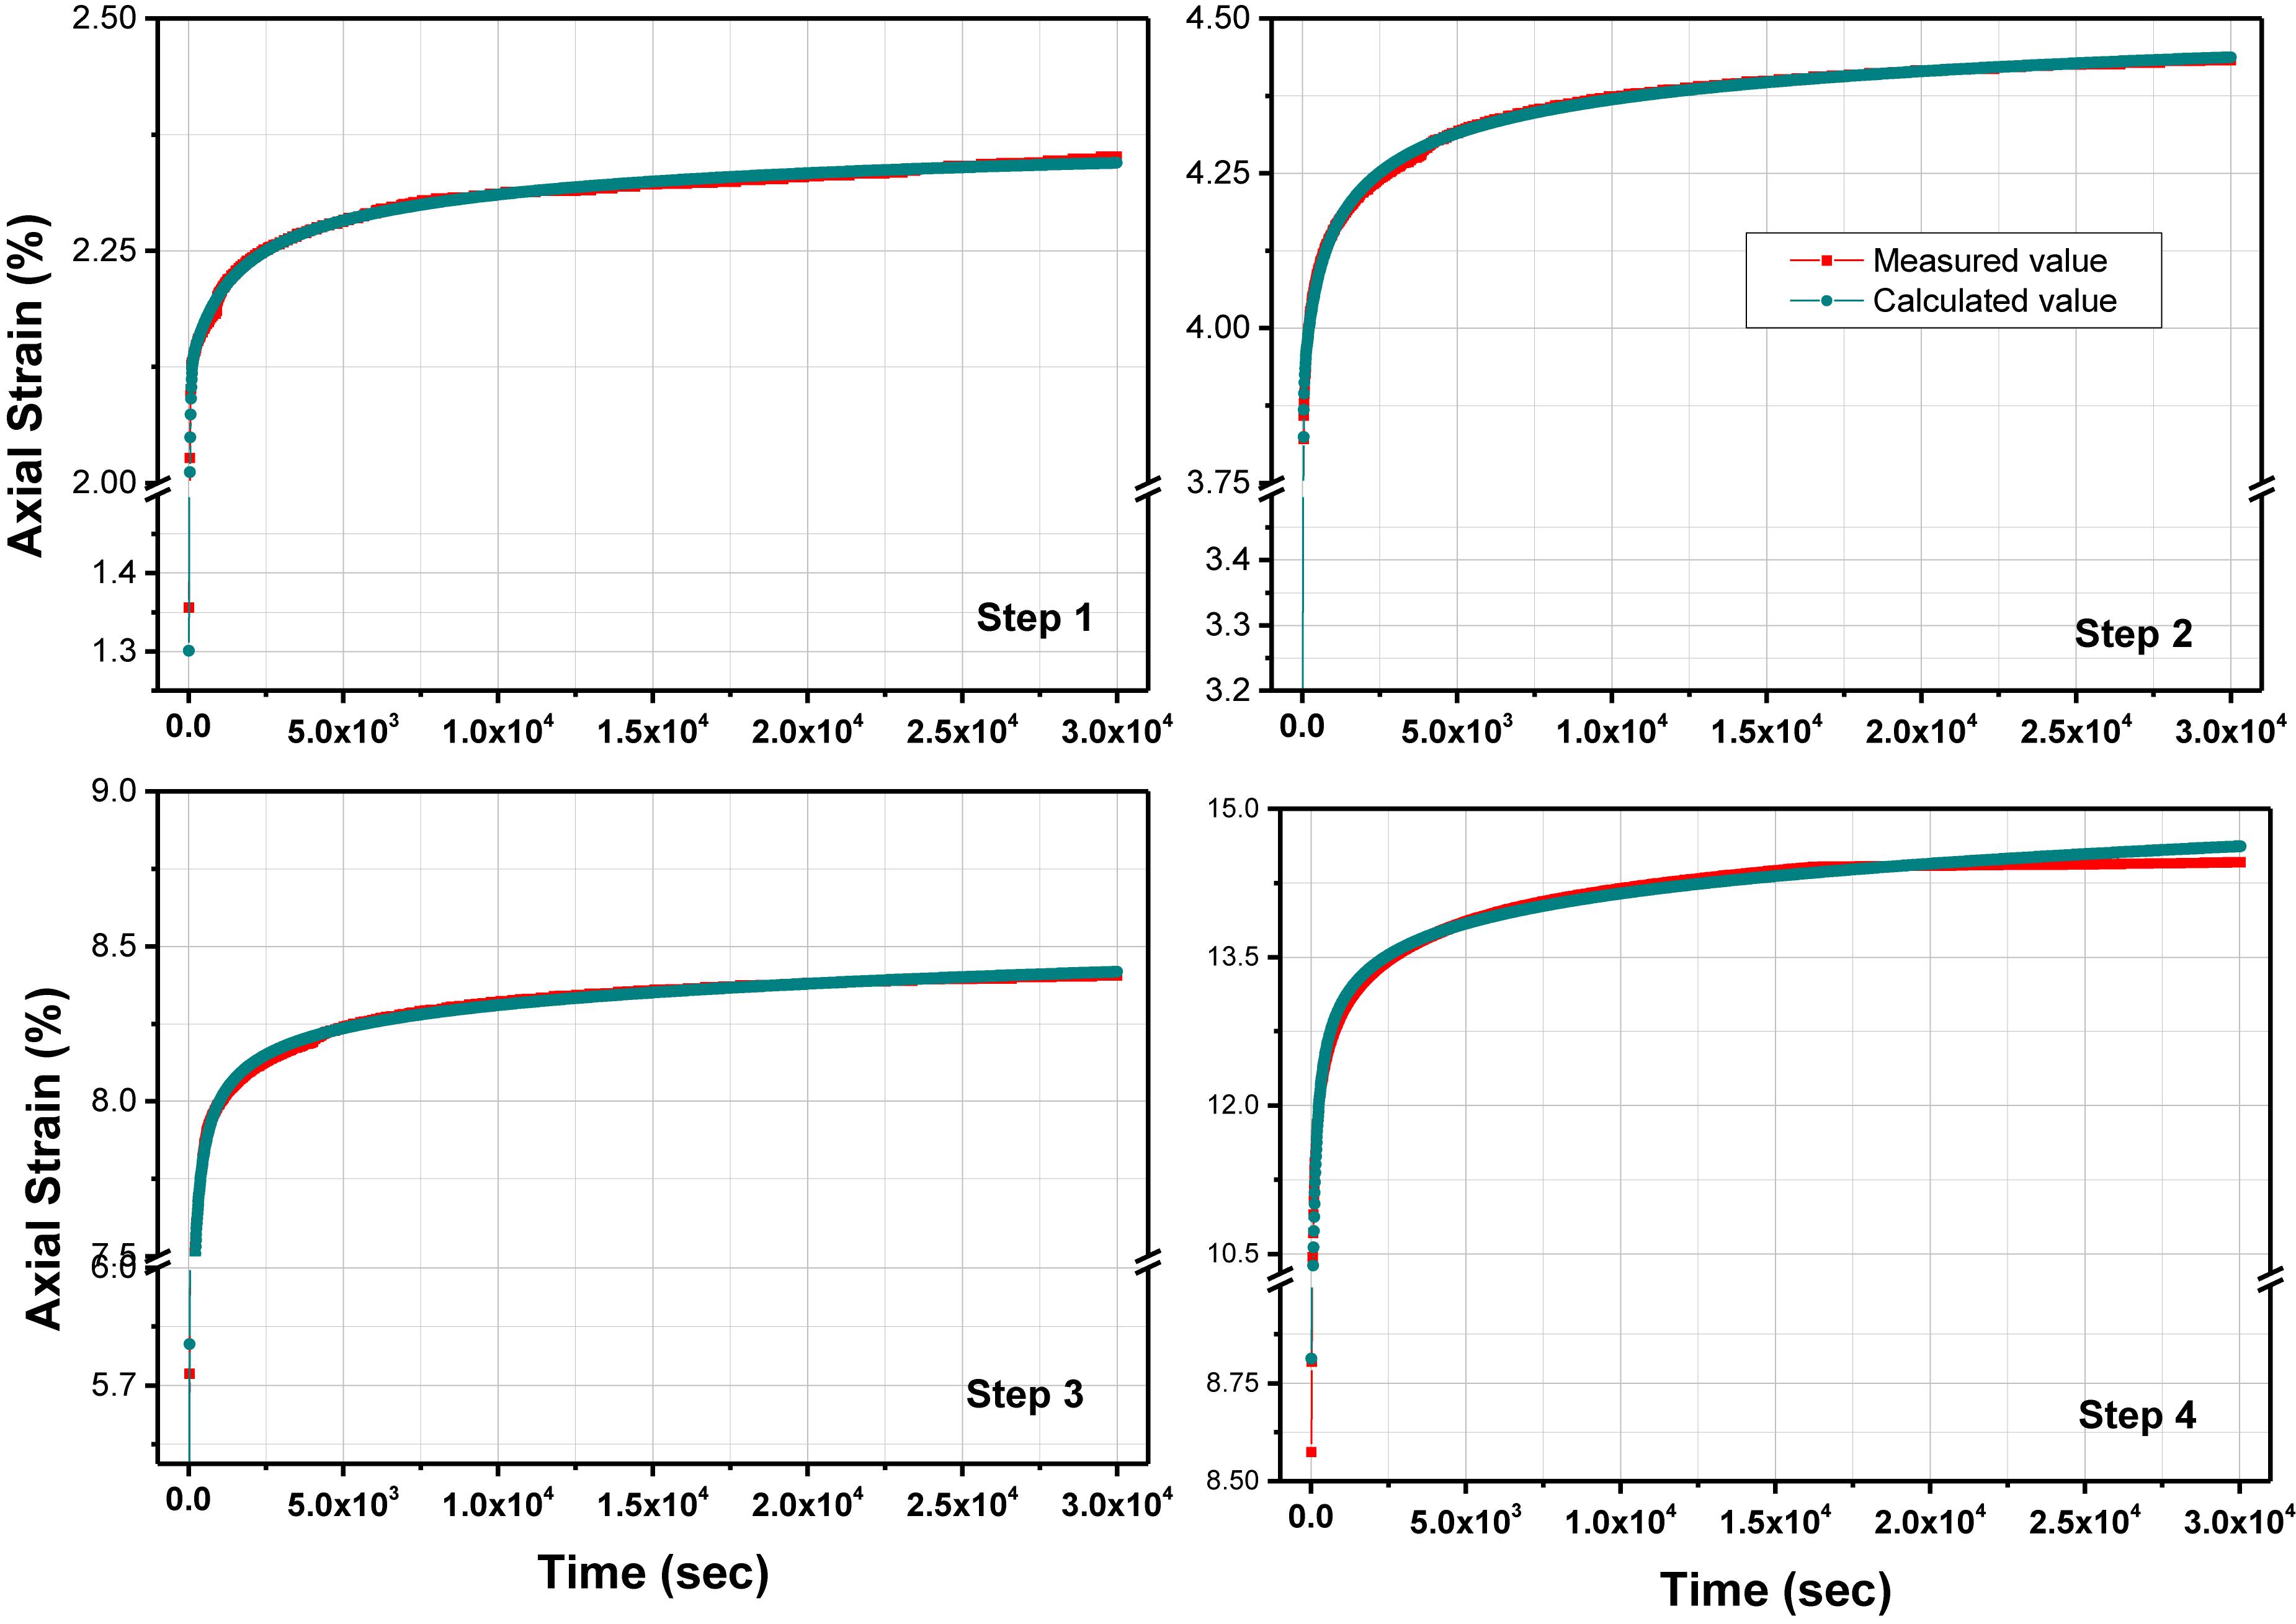
Figure 13. Fitted curve obtained from the Empirical Creep Model compared to the strains obtained from the test data.
Limitations and Engineering Implications
Because of the special geological origin of red clay, it is believed that red clay should be a favorable stratum in the past practical engineering, especially when used as foundation soil and subgrade fill. However, with the rise of large-scale urban construction in red clay area, more and more attention has been paid to the study of creep deformation caused by long-term stress in the red clay areas, in order to solve practical engineering problems such as long-term settlement deformation of buildings and subgrade. Based on this engineering background, this paper selected Chongqing, a typical red clay in southwest China, as the research object. The creep characteristics of rock and soil are usually described by element creep model and empirical creep model. In this paper, according to the practical engineering application of red clay, combining with the existing empirical model and the indoor test data, the empirical formula suitable for the research object of this paper is fitted. However, this is only a empirical formula for engineering construction. The following work of authors will be to establish the creep model in combination with more in-depth tests and theories.
Conclusion
In order to investigate the shear strength and creep behavior of red clay, abundantly available in Chongqing, China, a series of laboratory tests were conducted and the creep deformation behavior were evaluated and compared with the results obtained from some theoretical creep models. Using the experimental results, some empirical relationships have also been developed to evaluate the creep behavior of red clay. Based on the analytical and experimental investigations presented in this paper, the following conclusions can be made:
(1) Based on the CD triaxial compression test results, strains required to achieve the peak deviator stresses increase as the confining pressure increases. Moreover, the red clay samples did not exhibit significant failure plane under lower confining stress. However, the development of the shear planes was remarkable when the confining stress was 100 kPa or higher. The final shape of the deformed samples exhibited parabolic bulging in the shape of drum, when the confining stress of 100 kPa or higher was applied. When confining stresses lower than 100 kPa were applied, confining pressure, the deformed sample shapes exhibited parabolic bulging with drum shape only when the compressive loading continued until a complete failure. At this stage, some vertical cracks were observed on the sample.
(2) Under the stress controlled multi-stage creep tests, the overall creep curve presented a significant stepped shape. When a confining stress of 50 kPa was applied, the sample failed at the fourth step of loading, while for the confining stresses of 75 and 100 kPa, clay samples exhibited a rapid creep phase under the fifth loading step. The initial strain rate was observed to be larger than the rate observed in the later period of loading in every loading step except the last loading step. The failed sample at the end of the creep test also exhibited parabolic bulging at the shape of drum for all confining stresses and all samples exhibited clear shear plane.
(3) Among the three best creep models used to compare the experimental results, Burger’s model exhibited the best fitting, although in each loading step, the early stages of loading were different. The Statistically derived empirical model developed with the tool of “1St Opt” exhibited the best fitting with the experimental data, with a correlation coefficient of 0.99. However, the general application of such empirical model for all types of soils and site conditions requires further research.
Data Availability Statement
The datasets generated for this study are available on request to the corresponding author.
Author Contributions
All authors listed have made a substantial, direct and intellectual contribution to the work, and approved it for publication.
Funding
This work was supported by the National Natural Science Foundation of China (Nos. 41462011, 51609093, 41977236, and 51869001), the Doctoral Scientific Research Foundation of East China University of Science and Technology (No. DHBK2017121), Science and Technology Project Founded by the Education Department of Jiangxi Province (No. GJJ170485), and Science and Technology Project of Jiangxi Province (Nos. 20192ACBL20002 and 20192ACBL20002).
Conflict of Interest
The authors declare that the research was conducted in the absence of any commercial or financial relationships that could be construed as a potential conflict of interest.
References
Atkinson, B. K. (1978). High-temperature stress relaxation of synthetic, polycrystalline galena. Phys. Chem. Miner. 2, 305–315. doi: 10.1007/bf00307573
Boyle, J. T. (2012). The creep behavior of simple structures with a stress range-dependent constitutive model. Arch. Appl. Mech. 82, 495–514. doi: 10.1007/s00419-011-0569-1
Chen, Z., Kang, W., and Huang, J. (1991). On the locked in stress, creep, and dilatation of rocks, and the constitutive equations. Chinese. J. Rock Mech.Eng. 10, 299–312.
Grimstad, G., Degago, S. A., Nordal, S., and Karstunen, M. (2010). Modeling creep and rate effects in structured anisotropic soft clays. Acta Geotechn. 5, 69–81. doi: 10.1007/s11440-010-0119-y
Haque, M. N., Tag, L., Keep, L. B., and Keey, R. B. (2000). Model fitting for visco-elastic creep of Pinus radiata during kiln drying. Wood Sci. Technol. 34, 447–457. doi: 10.1007/s002260000058
Jiang, Q., Qi, Y., Wang, Z., and Zhou, C. (2013). An extended Nishihara model for the description of three stages of sandstone creep. Geophys. J. Int. 193, 841–854. doi: 10.1093/gji/ggt028
Jong, G. D. J. D. (1968). Consolidation models consisting of an assembly of viscous elements or a cavity channel network. Geotechnique 18, 102–135. doi: 10.1007/978-1-4020-3629-3_12
Kovalenko, N. P. (1973). Investigation of the consolidation of a peat base. Soil Mech. Found. Eng. 10, 307–310. doi: 10.2166/wst.2010.363
Kuhn, M. R., and Mitchell, J. K. (1993). New perspectives on soil creep. J. Geotech. Eng. 119, 507–524. doi: 10.1061/(asce)0733-9410(1993)119:3(507)
Kuwano, R., and Jardine, R. J. (2002). On measuring creep behaviour in granular materials through triaxial testing. Can. Geotech. J. 39, 1061–1074. doi: 10.1139/t02-059
Li, C., Kong, G., Liu, H., and Hossam, A. N. (2019). Effect of temperature on behaviour of red clay–structure interface. Revue Can. Géotech. 56, 126–134. doi: 10.1139/cgj-2017-0310
Li, W., and Li, X. (2012). Study on deep clay during high-pressure Ko creep test and its microstructure anisotropy. Dis. Adva. 5, 1247–1252.
Lu, H. (2001). Aeolian origin and palaeoclimatic implications of the ‘red clay’ (north china) as evidenced by grain-size distribution. J. Q. Sci. 1, 89–97. doi: 10.1002/1099-1417(200101)16:1<89::aid-jqs578>3.0.co;2-8
Lu, P., Zeng, J., and Sheng, Q. (2008). Creep tests on soft clay and its empirical models. Rock Soil Mech. 29, 1041–1030.
Maio, C. D., Scaringi, G., and Vassallo, R. (2015). Residual strength and creep behaviour on the slip surface of specimens of a landslide in marine origin clay shales: influence of pore fluid composition. Landslides 29, 1041–1044.
Mesri, G., Febrescordero, E., Shields, D. R., and Castro, A. (1981). Shear stress-strain-time behaviour of clays. Geotechnique 32, 407–411. doi: 10.1680/geot.1982.32.4.407
Naumann, M., Hunsche, U., and Schulze, O. (2007). Experimental investigations on anisotropy in dilatancy, failure and creep of Opalinus Clay. Phys. Chem. Earth Parts 32, 889–895. doi: 10.1016/j.pce.2005.04.006
Sachan, A., Vikash, G., and Prashant, A. (2013). Development of intermediate microfabric in kaolin clay and its consolidation behaviour. Geotech. Geol. Eng. 31, 23–34. doi: 10.1007/s10706-012-9557-7
Sayed-Ahmed, E. Y., Shrive, N. G., and Tilleman, D. (1998). Creep deformation of clay masonry structures: a parametric study. Canadian J. Civ. Eng. 25, 67–80. doi: 10.1139/l97-026
Schutter, G. D. (1999). Degree of hydration based Kelvin model for the basic creep of early age concrete. Mater. Struct. 32, 260–265. doi: 10.1007/bf02479595
Shi, B., Wang, B., and Ning, W. (1997). Micromechanical model on creep of anisotropic clay. Chin. J. Geotechn. Eng. 19, 10–16.
Singh, D. P. (1968). A study of creep of rocks. Int. J. Rock Mech. Min. Sci. Geomech. Abstracts 12, 271–276. doi: 10.1016/0148-9062(75)91084-0
Thyagaraj, T., and Rao, S. M. (2013). Osmotic swelling and osmotic consolidation behaviour of compacted expansive clay. Geotechnical and Geological Eng. 31, 435–445. doi: 10.1007/s10706-012-9596-0
Vu, H. Q., and Fredlund, D. G. (2004). The prediction of one-, two-, and three-dimensional heave in expansive soils. Can. Geotech. J. 41, 713–737. doi: 10.1139/t04-023
Wang, Q., and Song, Y. (2018). Clay minerals and major elements concentrations of zhuanglang miocene red clay in longzhong basin, china. Data Brief 17, 297–304. doi: 10.1016/j.dib.2018.01.030
Xu, H., Ying, H., Xie, X., and Xie, K. (2014). Analysis on effective stress formula and consolidation of gassy muddy clay. J. Central South Univ. 21, 1594–1599. doi: 10.1007/s11771-014-2100-7
Yang, G., Cheng, Y., Xu, Y., Li, L., Sun, X., and Qu, C. (2019). Experimental study on dynamic characteristics of over-consolidated remolded red clay subjected to traffic load in anning area. J. Exp. Mech. 34, 675–683.
Yin, J., and Tong, F. (2011). Constitutive modeling of time-dependent stress–strain behavior of saturated soils exhibiting both creep and swelling. Can. Geotech. J. 48, 1870–1885. doi: 10.1139/t11-076
Yin, Z., Xu, Q., and Yu, C. (2015). Elastic-viscoplastic modeling for natural soft clays considering nonlinear creep. Int. J. Geomech. 15:A6014001.
Yu, H. D., Chen, W. Z., Gong, Z., Tan, X. J., Ma, Y. S., Li, X. L., et al. (2015). Creep behavior of boom clay. Int. J. Rock Mech. Min. Sci. 76, 256–264. doi: 10.1016/j.ijrmms.2015.03.009
Yu, W., and Choi, S. U. S. (2004). The role of interfacial layers in the enhanced thermal conductivity of nanofluids: a renovated maxwell model. J. Nanopart. Res. 6, 355–361. doi: 10.1007/s11051-004-2601-7
Zhang, X., Cai, Y., Wang, Z., and Jiang, Y. (2018). Fractal breakage and particle shape analysis for coral sand under high-pressure and one-dimensional creep conditions. Rock Soil Mech. 39, 1573–1580.
Zhao, Y., Wang, Y., Wang, W., and Tang, L. (2019). Modeling of rheological fracture behavior of rock cracks subjected to hydraulic pressure and far field stresses. Theor. Appl. Fract. Mec. 101, 59–66. doi: 10.1016/j.tafmec.2019.01.026
Zhao, Y., Wang, Y., Wang, W., Wan, W., and Tang, J. (2017a). Modeling of non-linear rheological behavior of hard rock using triaxial rheological experiment. Int. J. Rock Mech. Min. Sci. 93, 66–75. doi: 10.1016/j.ijrmms.2017.01.004
Zhao, Y., Zhang, L., and Wang, W. (2017b). Creep behavior of intact and cracked limestone under multi-level loading and unloading cycles. Rock Mechan. Rock Eng. 50, 1409–1424. doi: 10.1007/s00603-017-1187-1
Keywords: creep behavior, red clay, triaxial compression condition, shear strength, deformation
Citation: Xue K, Wang S, Hu Y and Li M (2020) Creep Behavior of Red-Clay Under Triaxial Compression Condition. Front. Earth Sci. 7:345. doi: 10.3389/feart.2019.00345
Received: 11 September 2019; Accepted: 10 December 2019;
Published: 10 January 2020.
Edited by:
Yanlin Zhao, Hunan University of Science and Technology, ChinaReviewed by:
Martin Charles Wilding, Sheffield Hallam University, United KingdomBingxiang Yuan, Guangdong University of Technology, China
Chaolin Wang, Guizhou University, China
Copyright © 2020 Xue, Wang, Hu and Li. This is an open-access article distributed under the terms of the Creative Commons Attribution License (CC BY). The use, distribution or reproduction in other forums is permitted, provided the original author(s) and the copyright owner(s) are credited and that the original publication in this journal is cited, in accordance with accepted academic practice. No use, distribution or reproduction is permitted which does not comply with these terms.
*Correspondence: Shengfu Wang, nfuwangsf@foxmail.com