A Review on Data Preprocessing Techniques Toward Efficient and Reliable Knowledge Discovery From Building Operational Data
 Cheng Fan1,2
  Xinghua Wang
- 1Sino-Australia Joint Research Center in BIM and Smart Construction, Shenzhen University, Shenzhen, China
- 2Department of Construction Management and Real Estate, Shenzhen University, Shenzhen, China
- 3eSight Technology (Shenzhen) Company Limited, Shenzhen, China
The rapid development in data science and the increasing availability of building operational data have provided great opportunities for developing data-driven solutions for intelligent building energy management. Data preprocessing serves as the foundation for valid data analyses. It is an indispensable step in building operational data analysis considering the intrinsic complexity of building operations and deficiencies in data quality. Data preprocessing refers to a set of techniques for enhancing the quality of the raw data, such as outlier removal and missing value imputation. This article serves as a comprehensive review of data preprocessing techniques for analysing massive building operational data. A wide variety of data preprocessing techniques are summarised in terms of their applications in missing value imputation, outlier detection, data reduction, data scaling, data transformation, and data partitioning. In addition, three state-of-the-art data science techniques are proposed to tackle practical data challenges in the building field, i.e., data augmentation, transfer learning, and semi-supervised learning. In-depth discussions have been presented to describe the pros and cons of existing preprocessing methods, possible directions for future research and potential applications in smart building energy management. The research outcomes are helpful for the development of data-driven research in the building field.
Introduction
As highlighted by the International Energy Agency (IEA), the building sector has become the largest energy consumer in the world, and now accounts for more than a third of global energy consumption (IEA, 2019). The potential gains from increasing the energy efficiency of buildings are considerable, since the operation of a building accounts for 80–90% of the total energy consumption over the whole life cycle, and almost all types of defects appear at the building operation stage (Ramesh et al., 2010; Fan et al., 2019b). Thanks to the development in data mining technology and the wide availability of operational data on buildings, exploring the energy saving possibilities has become easier through data-driven approaches (Fan et al., 2021b). The knowledge discovered from massive building operational data can be very helpful in a variety of tasks related to building energy management, such as predictive modelling, fault detection and diagnosis, and control optimisation (Ramesh et al., 2010). Building operational data are typically of poor quality and hence, data preprocessing is often needed to ensure the reliability of data analysis using various techniques. It has been widely acknowledged as a non-trivial task in data analysis and may account for 80% of the total data mining effort (Cui et al., 2018).
In the building context, data preprocessing can be very challenging considering the relatively poor data quality and the intrinsic complexity of building operations. Data preprocessing is often needed to ensure the validity and reliability of data analysis results. For example, building operational data typically have many missing values and outliers due to faults in data collection, transmission and storage (Xiao and Fan, 2014; Cui et al., 2018). A data preprocessing step can be applied to remove outliers and fill in missing values for more reliable data analysis. In addition, most data mining algorithms have certain requirements for input data. For instance, building operational data mainly consist of numerical data, such as power, temperature, humidity, flow rates and pressures. However, conventional association rule algorithms (e.g., A-priori) can only handle categorical data such as high, medium, and low (Fan et al., 2015b). In this case, conventional data preprocessing should be conducted to ensure the compatibility between data and algorithms.
Besides conventional data preprocessing techniques, more advanced methods are often needed to address the challenges in building management tasks. Taking the fault detection and diagnosis task for example, the training data for classification model development should be sufficiently large and properly labelled to ensure the model performance. In practice, individual buildings may suffer from data shortage problems, i.e., individual buildings may not have sufficient data due to the lack of data accumulation time and automated data collection systems. More importantly, the availability of labelled data can be quite scarce considering the time and costs in manual labelling. In such a case, it may not be feasible to apply advanced classification algorithms due to the overfitting and non-convergence problems (Goodfellow et al., 2016; Fan et al., 2020; Gao et al., 2020). Possible data preprocessing solutions can be developed based on concepts of transfer learning, data augmentation and semi-supervised learning. At present, there is a knowledge gap between advanced data preprocessing techniques and building data analysis as limited studies have been conducted in relevant contexts.
This paper serves as a critical review on data preprocessing techniques for building operational data analysis. It aims to provide a clear picture of data preprocessing methods for data-driven building energy management. The remainder of the paper is organised as follows. The General Framework for Building Operational Data Preprocessing introduces the general data preprocessing framework for building operational data analysis. Data Cleaning Methods for Building Operational Data Analysis, Data Reduction, Data Scaling, Data Transformation, Data Partitioning describe representative techniques for typical data preprocessing tasks. Data Augmentation, Transfer Learning, Semi-Supervised Learning introduces advanced data preprocessing techniques developed based on data augmentation, transfer learning, and semi-supervised learning methods. Conclusions are drawn as the last section.
The General Framework for Building Operational Data Preprocessing
Figure 1 summarises typical data preprocessing tasks for building operational data analysis. In general, building operational data preprocessing consists of five major tasks, i.e., data cleaning, reduction, scaling, transformation and partitioning (Xiao and Fan, 2014; Fan et al., 2015a; Fan et al., 2015b). Data cleaning aims to enhance the quality of the data by missing value imputations and outlier removals. Building operational data are typically stored in two-dimensional data tables, where each row represents an observation collected at a specific time step and each column represents a building variable (Fan et al., 2015b). In such a case, data reduction can be conducted in two directions, i.e., row-wise for data sample reduction and column-wise for data variable reduction. Data reduction is applied to reduce data dimensions and therefore, reducing the computational costs associated. Data scaling aims to transform the original data into similar ranges for predictive modelling. As shown in Figure 1, it can be achieved in three main approaches, i.e., data range-, distribution-, and structure-based methods. The aim of data transformation is to arrange the original data into suitable formats for various data mining algorithms. It typically includes two tasks, i.e., numerical data transformation which transforms numerical data to categorical data, and categorical data transformation which transforms categorical data into numerical data. Data partitioning aims to divide the whole data set into different groups based on building operating characteristics. It is expected to enhance the sensitivity and reliability of the follow-up analysis (Cheng et al., 2016; Fan and Xiao, 2018; Fan et al., 2019c).
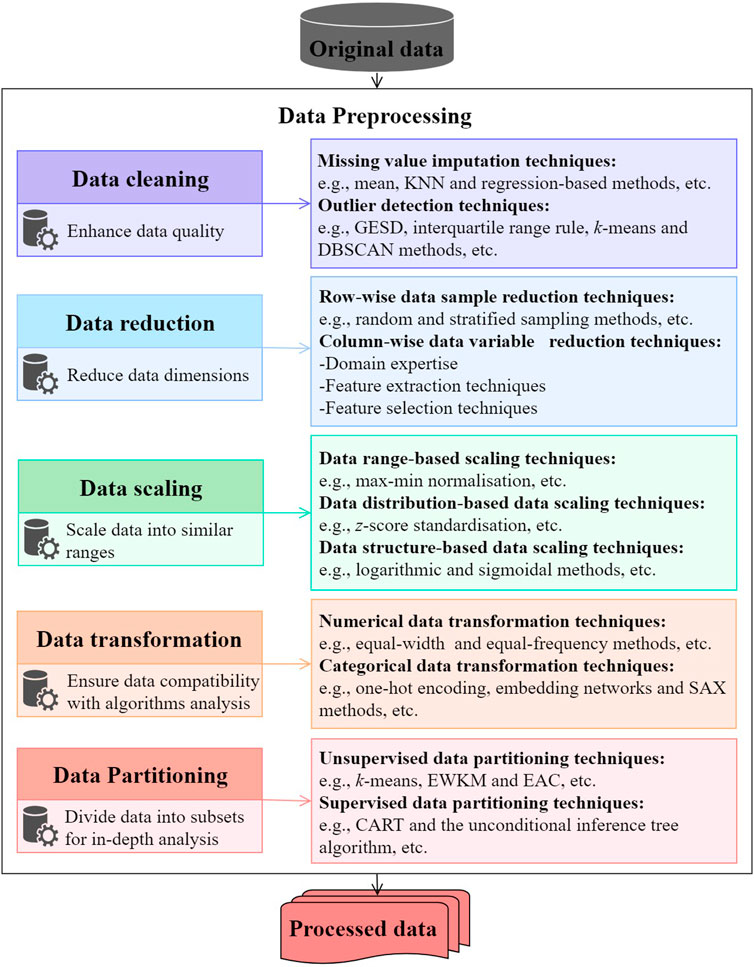
FIGURE 1. Typical data preprocessing tasks for building operational data analysis.
Data Cleaning Methods for Building Operational Data Analysis
Missing Value Imputation
There are two general ways to handle missing values in building operational data. The first is to simply discard data samples with missing values as most data mining algorithms cannot handle data with missing values. Such method is only applicable when the proportion of missing values are insignificant. The second is to apply missing value imputation methods to replace missing data with inferenced values.
As shown in Figure 2, common missing value imputation methods can be divided into two groups, i.e., univariate and multivariate methods. The first includes mean imputation, forward or backward imputation, and moving average methods. In such a case, missing values are inferenced based on data characteristics of that variable alone and therefore, are called univariate methods. The mean or median imputation method will replace missing values (i.e., white circles in Figure 2) with the mean or median of that variable. The forward or backward method simply replaces the missing value with the previous or next data measurement. These two methods are straightforward for implementation, yet do not consider temporal correlations along time steps and may not produce reasonable data replacements. Considering that building operational data are in essence time series, Fan et al. used a simple moving average method to fill in missing values in a building operational dataset with a missing value ratio of 1.28% (Fan et al., 2015b). Yu et al. used the moving average method to handle a building operational dataset with a missing value ratio of 4%. The results indicate that the moving average method is effective in capturing temporal fluctuations in building system operations when the missing data ratio is small (Fan et al., 2015a; Yu et al., 2019). To summarize, univariate imputation methods may not capture cross-sectional and temporal correlations in building operational data and are only applicable when the missing data ratios are low (i.e., 1–5%). Previous studies have shown that when the missing data ratios become higher (i.e., 5–15%), more sophisticated imputation methods should be used (Jenghara et al., 2018).
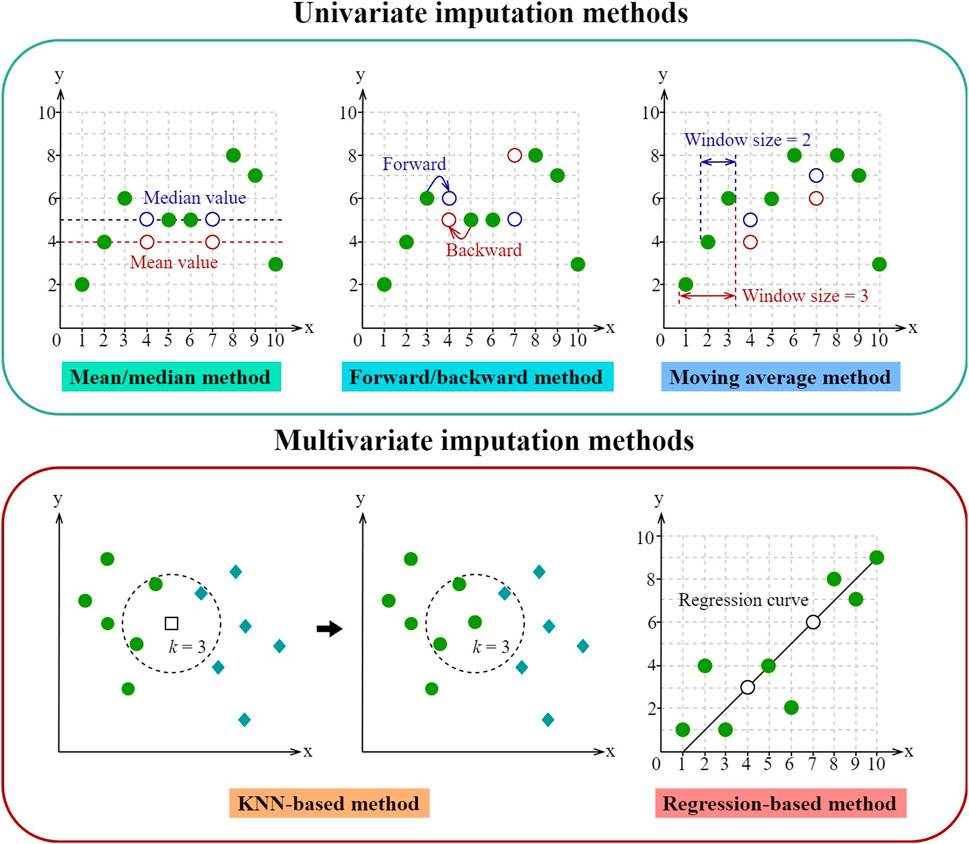
FIGURE 2. Missing value imputation methods for building operational data.
Multivariate imputation methods can be applied for more accurate results. Examples of such methods include k-nearest neighbour (KNN) and regression model-based methods. Cui et al. applied the KNN algorithm for the missing value imputation of building energy data and missing values are replaced using the means of k most similar data samples (Cui et al., 2018). Previous research has shown that the KNN method can achieve satisfactory performance even with relatively large missing data ratios (i.e., 5–15%) (Kang, 2013). Regression-based imputation methods typically adopt machine learning algorithms to capture cross-sectional or temporal data dependencies for missing value imputation (Jenghara et al., 2018). Popular modelling methods include multiple linear regression (MLR), support vector machines (SVM), decision trees (DT) and artificial neural networks (ANN). Previous studies have suggested the use of regression-based imputation methods for handling missing values over long time periods (Fan et al., 2015a). It should be mentioned that there is no universal solution for replacing missing values in different building operational datasets. The users should make their decisions considering the trade-off between accuracy and computation costs.
Outlier Detection
As shown in Table 1, the building field mainly adopts two methods for outlier detection, i.e., statistical and clustering-based methods. Most statistical methods are suitable for detecting outliers in numerical data, such as indoor temperatures and building power consumptions (Li et al., 2010). Seem et al. developed a generalised extreme studentised deviate (GESD) method for identifying outliers in average daily consumptions and peak power demands (Seem, 2007). The GESD method is a statistical method which uses conventional statistics such as standard deviations and means to quantify the boundary and amount of data outliers. Li et al. adopted the GESD method to identify outliers in building electricity data (Li et al., 2020b). The GESD method has proved to be computationally efficient in detecting outliers in building energy data (Fan et al., 2014). However, it assumes that the data follow a normal distribution, which may not be the case for actual building variables. Another popular choice is order-based methods, which rely on data quantiles for decision-makings (Li et al., 2010; Yu et al., 2012; Xiao and Fan, 2014; Ashouri et al., 2018; Yu et al., 2019; Ashouri et al., 2020). For example, data outliers can be identified if the data fall beyond the range between
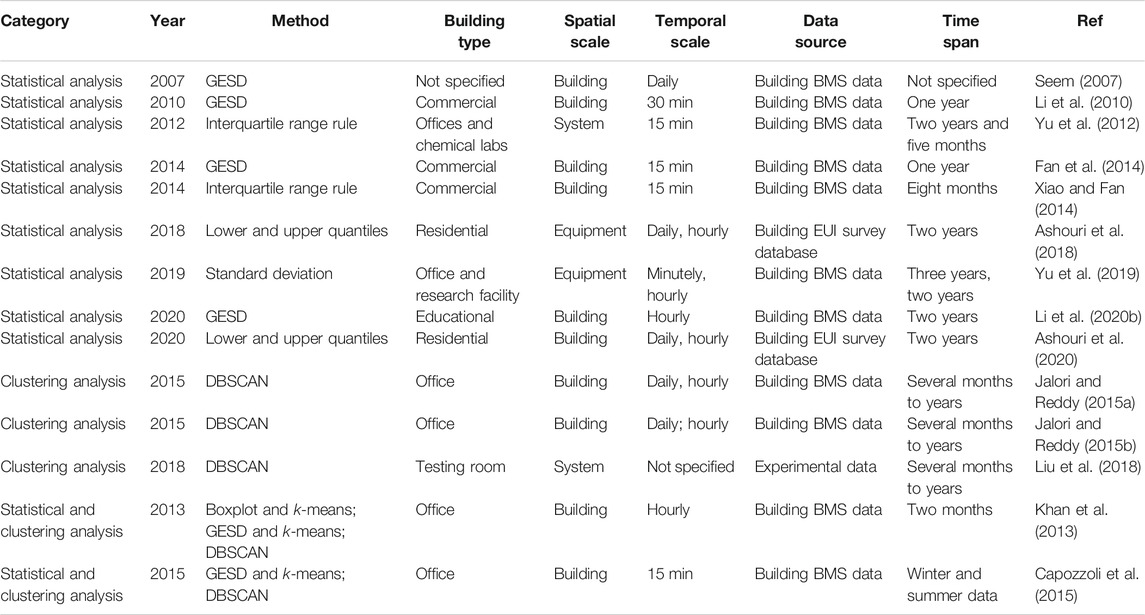
TABLE 1. A summary on outlier detection methods for building operational data.
Clustering-based methods can be used to detect outliers in two ways. Firstly, it can be used as a preliminary step to identify data clusters, based on which statistical methods (e.g., GESD) are then applied for outlier detection (Khan et al., 2013; Capozzoli et al., 2015). Secondly, it can be directly used for outlier identification. The density-based spatial clustering of applications with noise (DBSCAN) algorithm has been widely used for this purpose (Capozzoli et al., 2015). Liu et al. developed an efficient framework to diagnose the energy performance of variable refrigerant flow systems (Liu et al., 2018). The DBSCAN algorithm was used to identify transient operation data in system operations. Previous studies have shown that the DBSCAN is also effective in identifying outliers in building energy operational data, e.g., daily energy consumptions (Jalori and Reddy, 2015a; Jalori and Reddy, 2015b). The DBSCAN method do not require prior knowledge on cluster numbers. However, it is sensitive to parameter settings and may require extensive trial-and-errors for practical applications.
Data Reduction
Data reduction is typically conducted in two directions, i.e., row-wise for data sample reduction and column-wise for data variable reduction. Various data sampling techniques can be applied for row-wise data reduction, such as random and stratified sampling (Fan et al., 2015b). Random sampling is typically used to simulate a random process in data sample selection. By contrast, stratified sampling is performed to maintain the proportions of data samples corresponding to different categories. For instance, assuming there are 100 and 50 data samples in the original data set for category A and B respectively, a stratified sampling process with a selection rate of 0.7 will randomly select 70 out of 100, and 35 out of 50 data samples in category A and B for further analysis. Such techniques can be applied for sampling time series data as well. In such a case, it is recommended to transform the original sequence data into shorter subsequences before data sampling, since direct sampling may lead to temporal information loss.
There are three main methods of column-wise data variable reduction. The first is to use domain knowledge to directly select variables of interests. The second is to use statistical feature selection methods to select important variables for further analysis. The third is to adopt feature extraction methods to construct useful features for data analysis. The details of the latter two methods are shown in Feature Selection Techniques, Feature Extraction Techniques.
Feature Selection Techniques
As shown in Table 2, feature selection methods can be broadly divided into three categories, i.e., the filter, wrapper and embedded methods. The filter method is a simple, fast feature selection method, in which the principle is to rank and select variables according to certain univariate metrics. Note that the selection of these metrics is critical in the filter method. Commonly used metrics include the correlation coefficient, mutual information (MI) and information gain. Pearson’s correlation coefficient is one of the most popular filter methods and can measure the direction and strength of the linear relationship between two variables (Liu et al., 2018). Chou et al. adopted six data mining algorithms to predict the coefficient of performance for refrigeration equipment for varying amounts of refrigerant. In this process, Pearson’s correlation coefficient was used to find the critical variables associated with the refrigeration performance and finally obtain 10 feature sets (Chou et al., 2014). The MI-based feature selection is also a frequently used method. Wang et al. proposed a feature selection method based on MI and grey clustering analysis (GCA) for chiller fault detection and diagnosis, which was evaluated on a public database (i.e., ASHARE RP-1043). The research results indicated that the proposed method could select useful features for better classification performance (Wang et al., 2019). Note that the MI-based method can handle data with both categorical and numerical variables, while Pearson’s correlation coefficient is typically applied for numeric variables.
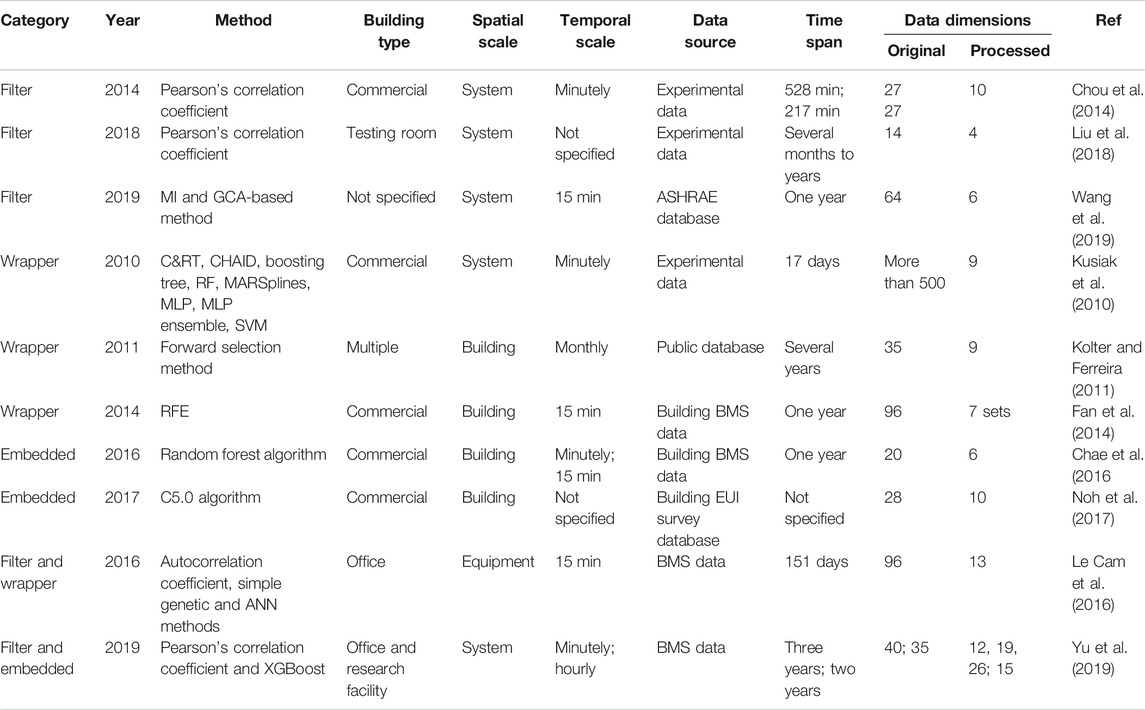
TABLE 2. A summary of feature selection techniques for building operational data.
A wrapper method can be used to evaluate the usefulness of data variables given a certain learning algorithm. Heuristic search methods are often used, such as stepwise forward and backward selection methods. Fan et al. adopted the recursive feature elimination (RFE) method to select input variables for various algorithms, e.g., MLR, support vector regression (SVR), random forests (RF), multi-layer perceptron (MLP), boosting tree (BT), multivariate adaptive regression splines (MARS). The results showed that the RFE method was able to automatically and objectively choose the optimal input combination for different predictive algorithms from different datasets, resulting in more flexibility in real applications (Fan et al., 2014). Kolter et al. adopted a simple greedy stepwise forward selection method to select nine of 35 variables for building energy predictions (Kolter and Ferreira, 2011). Compared with the filter method, the wrapper method can take into account the correlations among data variables and interactions with learning algorithms. However, it is typically conducted using exhaustive search and hence, the computation costs associated can be much higher (Kusiak et al., 2010; Han et al., 2011; Fan et al., 2014).
To reduce the computation cost, the embedded method has been proposed to optimize the feature selection result through the model training process. Two popular embedded methods are the L1 regularisation (based on the least absolute shrinkage and selection operator, LASSO) and L2 regularisation (based on ridge regression). These two methods rely on multiple linear regression for predictive modelling and the feature selection is achieved by adding a L1 or L2 regularisation terms to the objective function (Guyon and Elisseeff, 2003; Fan et al., 2014). Additionally, decision tree is often used as the base learner for regularisation-based embedded methods, e.g., RF and C5.0 (Chae et al., 2016; Noh et al., 2017). Chae et al. employed RF algorithm for feature selection. In such a case, the importance of a variable can be evaluated based on the reduction of prediction performance if it is absent in the input data (Chae et al., 2016).
Considering that each of the three methods has its pros and cons, researchers have tried to combine these methods for more reliable and accurate results. For instance, Cam et al. applied a hybrid filtering-wrapping method to select input variables for a fan power prediction model (Le Cam et al., 2016). Yu et al. developed a novel feature selection process using a combination of the filter and embedded methods. A filter method based on Pearson’s correlation coefficient was used to remove highly correlated features, and then the Shapley Additive Explanation (SHAP) values were calculated to obtain the feature set using the eXtreme Gradient Boosting (XGBoost) algorithm (Yu et al., 2019).
Feature Extraction Techniques
Unlike feature selection which only selects useful features from existing variables, feature extraction aims to construct new features based on linear or nonlinear combinations of existing variables. Table 3 summarises the main feature extraction techniques used in the building field. Representative linear feature extraction techniques include principal component analysis (PCA) and statistical methods (Li et al., 2010; Wang, 2015; Wahid et al., 2017; Cui et al., 2018; Zhang et al., 2018). As shown in Figure 3, statistical methods typically calculate summarising statistics (e.g., the mean, peak, and standard deviation) for data measurements over a particular time span as features. Wahid et al. proposed a statistical feature-based approach to derive features as inputs for building energy predictions. Four statistical features, i.e., the mean, variance, skewness, and kurtosis, were extracted from hourly building power consumption data (Wahid et al., 2017). It should be mentioned that such methods may result in high information loss, especially when the time span considered is too large or the time series are highly fluctuated (Fan et al., 2019a). Zhang et al. applied PCA to extract linear features to reduce data dimensions of building energy data. The results validated the usefulness of such method in constructing meaningful features from data with sparse distributions (Zhang et al., 2018). The features extracted are in essence linear combinations of the original data variables. The PCA-based method can be very useful when there presents data multicollinearity problem. Note that all the data variables should be normalized or standardized before PCA to ensure the result validity. In practice, the number of principal components or features extracted is determined based on the proportion of total data variance explained, e.g., the principal components should be capable of explaining at least 80 or 90% of the total data variance (Fan et al., 2019a).
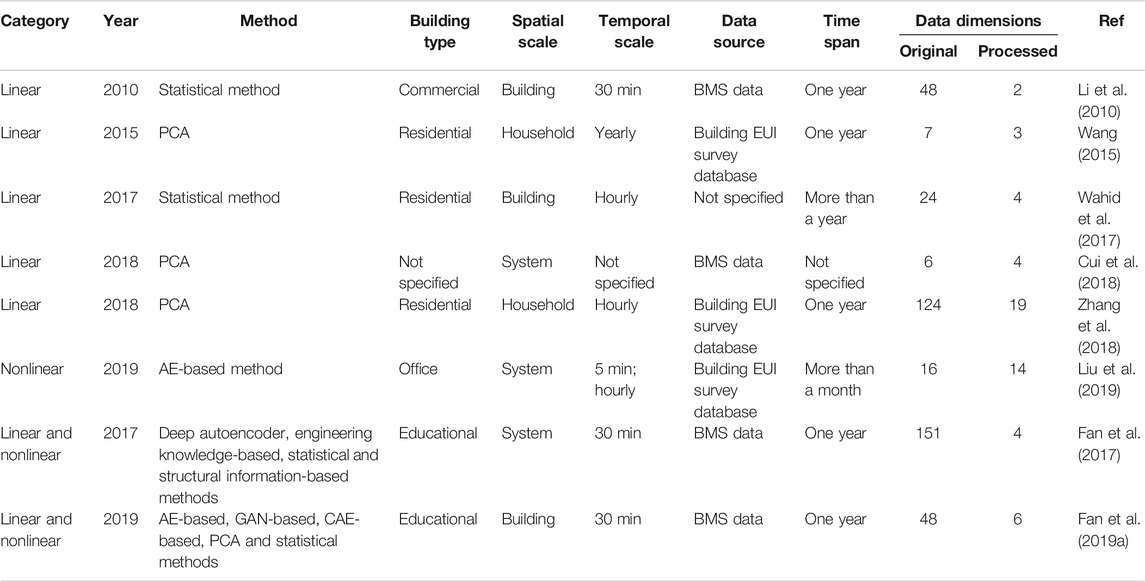
TABLE 3. A summary of feature extraction techniques for building operational data.
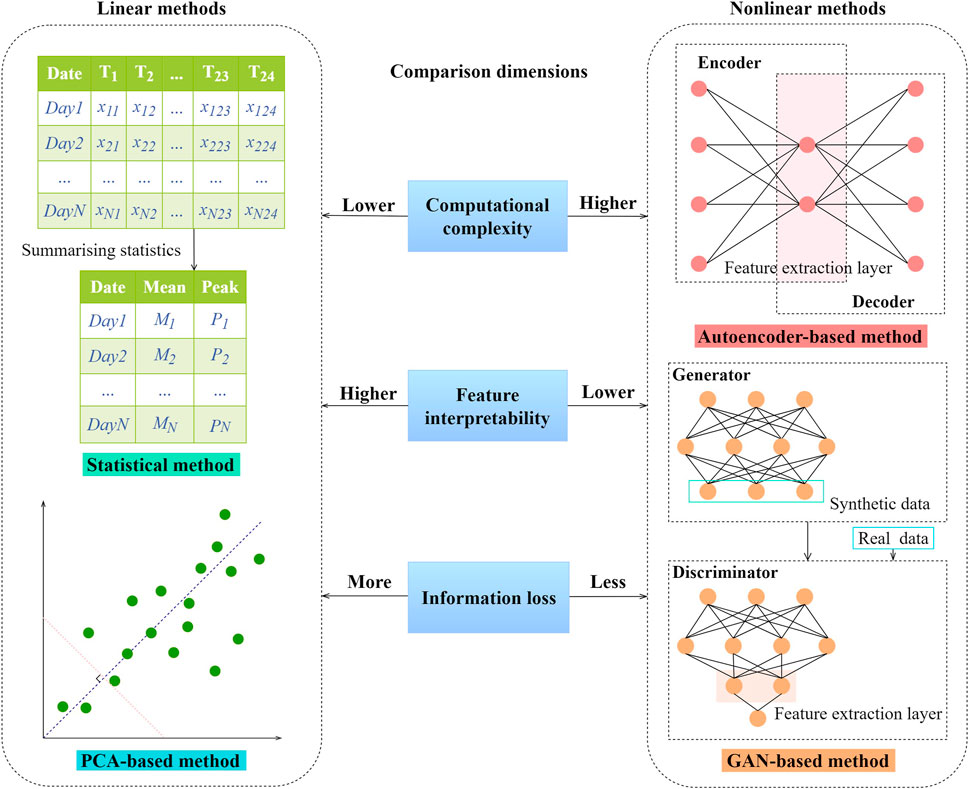
FIGURE 3. Linear and nonlinear feature extraction techniques for building operational data.
To minimize the potential information loss, nonlinear feature extraction methods have been used for building operational data analysis (Liu et al., 2019). Fan et al. investigated the value of unsupervised autoencoders in extracting useful features for short-term building energy predictions (Fan et al., 2017). The results showed that the nonlinear features extracted could improve the accuracy of building energy prediction models, while the other conventional feature extraction methods (i.e., engineering knowledge-based, summarising statistics, and structural information-based methods) may not be able to enhance the prediction performance given different supervised learning algorithms. As a more in-depth analysis, Fan et al. further investigated the power of unsupervised and generative deep learning in building feature extraction (Fan et al., 2019a). The results indicated that fully connected autoencoders (AE), one-dimensional convolutional autoencoders (CAE) and generative adversarial networks (GAN) were valuable for constructing meaningful features for building system modelling. Compared with linear feature extraction methods, nonlinear methods can better capture complicated data interactions in building operations and thereby, leading to more accurate results in building system prediction tasks (Fan et al., 2017; Liu et al., 2019).
Data Scaling
Data scaling is often needed to ensure the validity of predictive modelling, especially when the input variables have different scales. The max-min normalisation (i.e.,
Ashouri et al. used max-min normalisation to transform building variables into a range between zero and one (Ashouri et al., 2020). Such method is sensitive to data outliers as their presence may dramatically change the data range. By contrast, the z-score standardisation method is less affected by outliers. It is typically used to reform the variable to be normally distributed with a mean of zero and a standard deviation of one. Yu et al. applied the z-score standardisation method to normalise operational parameters of an air handling unit with different scales, e.g., the fan speed ranges from 0 to 1,300 revolution per minute, the static air pressure ranges between −3.5 to 2 in. (Yu et al., 2019). Theoretically, z-score standardisation works the best when the data are normally distributed. The max-min normalisation is recommended when the building operational data do not conform to a normal distribution and are free of obvious outliers (Ribeiro et al., 2018). Another type of data scaling method may change the data structures. For instance, the original data can be mapped into a new space using certain mathematical functions, such as the logarithmic, sigmoidal or arctan functions. Such methods are often used to minimize the differentials in data variables.
Data Transformation
In the building field, data transformation is mainly used to transform numerical data into categorical data to ensure the compatibility with data mining algorithms. The equal-width and equal-frequency methods have been widely used due to their simplicity (Fan et al., 2015b). The equal-width method divides the range of a variable into several equally sized intervals. The number of intervals is typically predefined by the user based on domain knowledge. To ensure the compatibility with conventional association rule mining algorithms, Xiao et al. adopted the equal-width method to transform numerical building variables into categorical ones (Xiao and Fan, 2014). The equal-frequency method divides the data into several intervals, each with approximately the same data amounts. For instance, Li et al. used the equal frequency method to categorise five numerical variables of a variable refrigerant flow system into three classes, i.e., low, medium and high (Li et al., 2017). Compared with the equal-width method, the equal-frequency method is less sensitive to outliers.
Data transformation can also be applied to transform categorical variables into numerical ones to facilitate the development of prediction models. The one-hot encoding method has been widely applied for this purpose, in which a matrix of L − 1 columns is generated for a categorical variable with L levels (Fan et al., 2019a). One potential drawback is that it may result in high-dimensional data when the categorical variables have many levels. To tackle this issue, deep learning algorithms, such as embedding networks, can be applied to represent categorical variables using dense representations. Such method is particular useful for text data, where individual words are represented as vectors for further analysis (Goodfellow et al., 2016; Fan et al., 2020).
In addition, data transformation can be applied to reduce computation costs associated with analysing large-scale time series data. The symbolic aggregate approximation (SAX) method has been adopted to transform numerical time series in building data into meaningful sequences of symbols (Fan et al., 2015a; Piscitelli et al., 2020; Piscitelli et al., 2021). Such method could reduce the size of the original data while restricting the information loss in data transformation. Similarly, dictionary-based and difference-based methods can also transform time series data into symbols for subsequent data analysis, e.g., energy usage pattern recognition and prediction (Kwac et al., 2014; Gulbinas et al., 2015).
Data Partitioning
Data partitioning aims to divide the whole data into several groups for in-depth analysis. As shown in Table 4, clustering analysis and the decision tree methods have been widely used in the building field for this purpose. A number of clustering algorithms have been applied for data partitioning, such as k-means, hierarchical clustering, entropy weighting k-means (EWKM), and fuzzy c-means clustering. Cam et al. adopted a fuzzy c-means clustering algorithm to group daily fan powers into several clusters, based on which atypical daily profiles were identified under different working conditions. The results showed that data partitioning could help to improve the performance of the electricity forecasting model (Le Cam et al., 2016). Ashouri et al. applied the k-means clustering algorithm to group building energy consumption data based on weather conditions. The results indicated that such approach could reduce the potential negative impact of weather conditions on energy data analysis and thereby, facilitating the effective extraction of meaningful association rules (Ashouri et al., 2018). In practice, it can be very difficult to determine the optimal cluster number. One solution is to apply the concept of ensemble learning to clustering analysis, e.g., evidence accumulation clustering (EAC). Fan et al. adopted the EAC method to partition daily energy profiles into different groups (Fan et al., 2015a). Although it is more complex than conventional clustering algorithms, ensemble clustering can discover clusters with various sizes and shapes and can automatically determine the optimal cluster number. In addition, previous researchers have applied partitioning around medoids (PAM) as the base algorithm for the EAC method, since it is more robust to outliers and noise, and can accept more diverse matrices as data inputs (Li et al., 2020a).
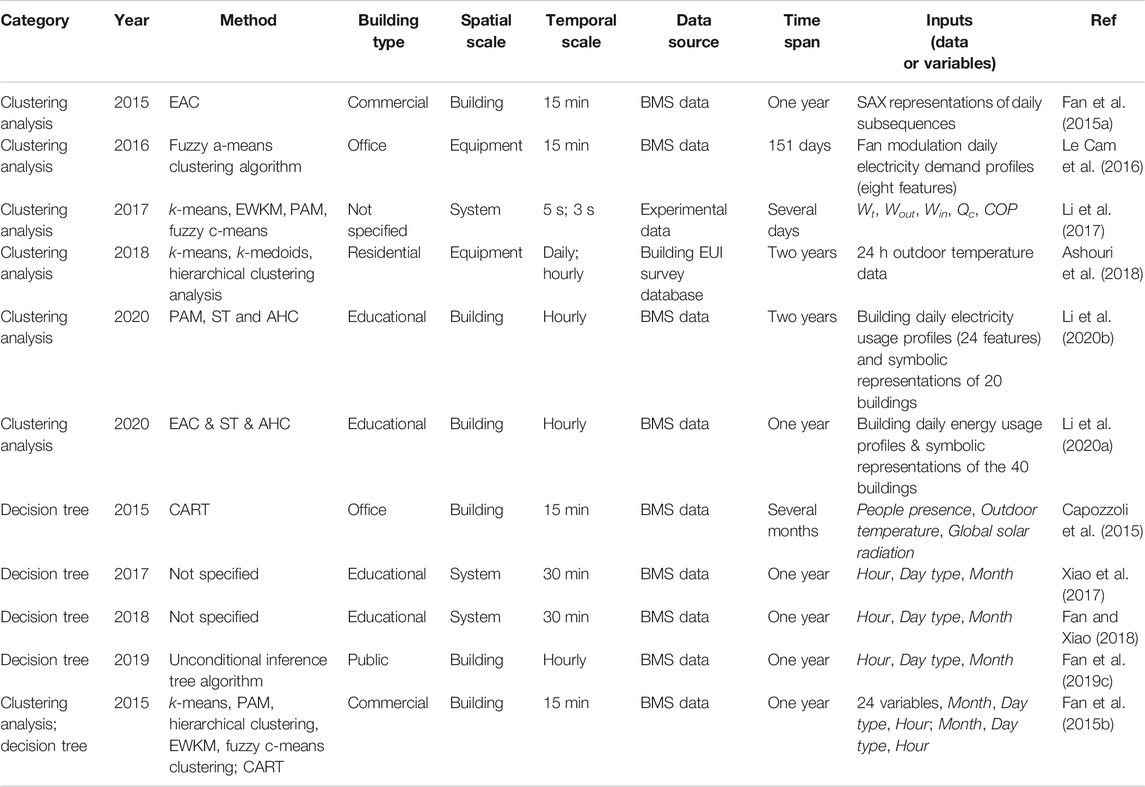
TABLE 4. A summary of data partitioning techniques for building operational data.
Since there is no one clustering method that is universally the best, another solution is to use multiple clustering methods for data partitioning. Fan et al. adopted five clustering methods to partition building operational data and the clustering performance were evaluated using both internal (e.g., the Dunn or silhouette indices) and external validation methods (e.g., the F-measure and normalised mutual information) (Fan et al., 2015b). Li et al. used the Dunn index to compare the partitioning results from four chosen clustering methods, i.e., k-means, EWKM, PAM and fuzzy c-means clustering (Li et al., 2017). The results indicated that k-means has performance over the other three for energy pattern identification (Li et al., 2017). In order to obtain reasonable partitioning results, it is also recommended to use multiple validation methods to find the optimal clustering number. Li a et al. adopted five commonly used metrics (i.e., the Calinski-Harabasz, Davies-Bouldin, Dunn, silhouette and C-index) to determine the optimal cluster number. Considering that external validation methods typically require high level of domain knowledge, internal validation methods can be more flexible and easier for practical applications.
Decision tree is another popular method for data partitioning. In general, high-level variables, such as the total building energy consumptions or cooling loads, are used as outputs, whereas time variables (e.g., Month, Day type, and Hour) can be used as inputs. Fan et al. used the classification and regression tree (CART) algorithm to explore the underlying relationships between time variables and the power consumption of primary air-handling units (PAU) and the rules derived from the decision tree were used for data partitioning (Fan et al., 2015b). Compared with clustering-based methods, decision tree-based methods are much easier for user interpretations (Fan and Xiao, 2018; Fan et al., 2019c). Xiao et al. used the decision tree method for data partitioning and applied the QuantMiner algorithm to separately discover the underlying association rules in each data group (Xiao et al., 2017). Capozzoli et al. applied the CART algorithm for data partitioning and anomalous building energy data within each data group were successfully identified using statistical methods (Capozzoli et al., 2015).
To summarize, decision tree-based methods are more suitable for partitioning building operational data given a certain high-level variable (e.g., the total building energy consumptions). By contrast, clustering analysis-based methods can perform data partitioning based on multiple data variables. Nevertheless, post-mining efforts are typically required to understand the characteristics of each data clusters.
Data Augmentation
Despite the wide adoption of advanced building automation systems, individual buildings may still encounter the problem of data shortage in practice. For instance, the building operational data may be scarce due to the lack of data accumulation time for new buildings. Similar data shortage problem may exist for existing buildings due to the lack of automated data collection systems. In practice, the amount and quality of training data should be sufficient to ensure the reliability and generalization performance of complicated data-driven models. Data augmentation techniques can be applied as a lightweight solution to tackle the potential data shortage problem. As shown in Figure 4, the main idea of data augmentation is to generate synthetic data that have similar data distributions to the real data. The synthetic data can then be integrated with actual data to enhance the generalisation performance of data-driven prediction models. Data augmentation techniques have been widely used in the field of computer visions while seldom explored in the building field (Rashid and Louis, 2019). In recent year, increasing research efforts have been made to address the potential of data augmentation in building data analysis, such as unbalanced fault classification and building energy prediction tasks.
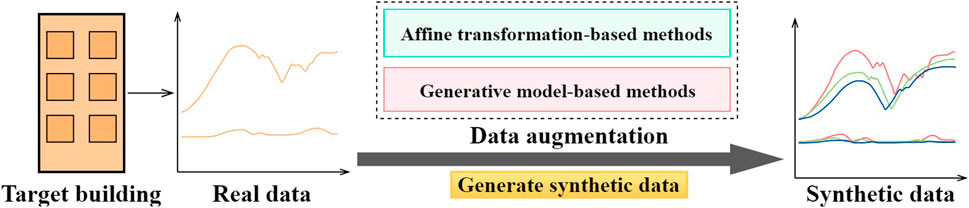
FIGURE 4. The main idea of data augmentation for building operational data analysis.
Affine transformation-based methods, such as rotation, time-warping, scaling and jittering, are conventional data augmentation techniques for time series data. Such methods can create new data samples by introducing additional variability into existing time series data. As shown in Figure 5, rotation operations can be applied to create synthetic sequences by inverting data signs without changing data magnitudes (Wen et al., 2020). The time-warping method creates synthetic data by stretching or shortening the original time series with different warping ratios. The jittering method will add random noises drawn from normal distributions to each value in the time series, while the scaling method applies a random scalar to change data magnitudes. Previous studies have shown that affine transformation-based methods could be used to improve the generalisability of data-driven models. Rashid et al. adopted four affine-based methods to address the data imbalance problem in classifying operation states of construction equipment (Rashid and Louis, 2019). The results showed that data augmentation methods were capable of enriching the training data for reliable model development. The application of such augmentation methods is strongly dependent on prior knowledge. In other words, researchers need to determine the conversion function and correctly define relevant parameters to ensure the validity of synthetic data (Zhang and Wu, 2019). For example, the jittering method can generate new data samples by adding Gaussian noise and the main challenge is to determine a suitable standard deviation to avoid the introduction of unreasonable data. More importantly, the data diversity introduced by conventional affine-based methods are rather limited (Um et al., 2017).
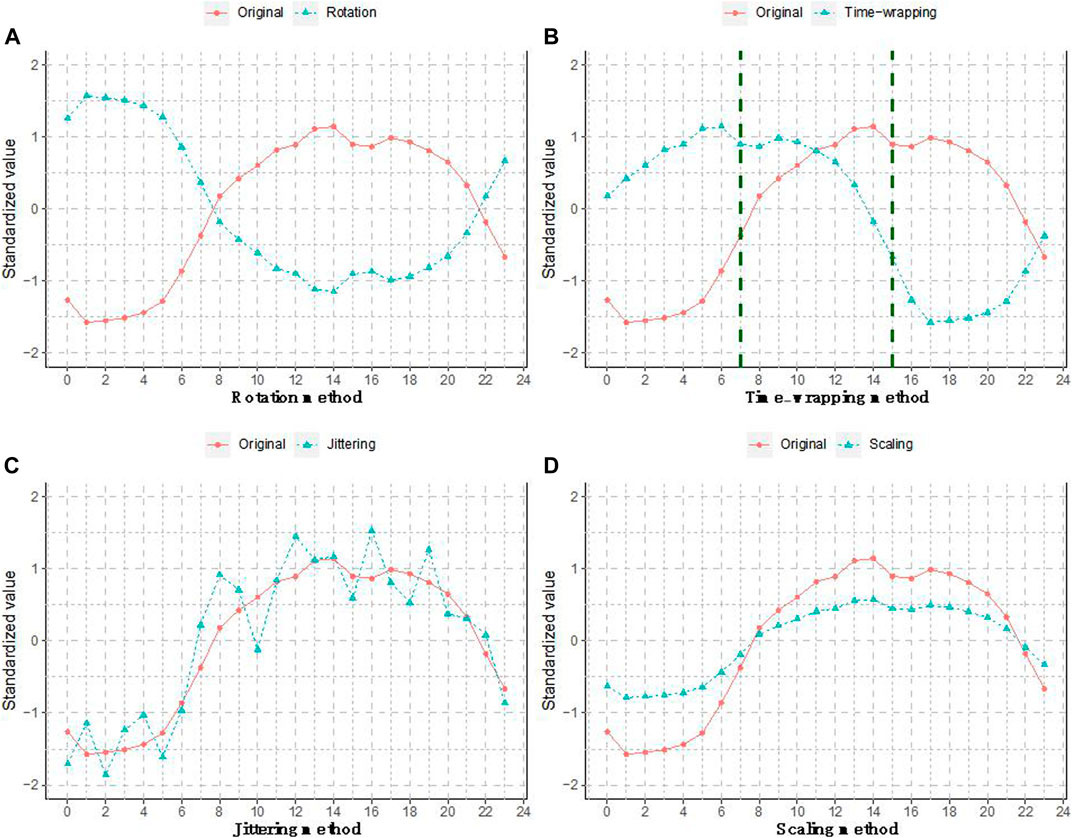
FIGURE 5. Affine transformation-based data augmentation methods.
To overcome the above limitation, advanced data augmentation techniques based on generative models have been proposed. Compared with conventional augmentation techniques, generative models can produce synthetic data with broader variations and higher quality. The generative adversarial networks (i.e., GANs) and variational autoencoders (i.e., VAEs) are two powerful generative modelling methods based on artificial neural networks. As shown in Figure 6A, VAEs are developed in three steps. Firstly, an encoder model is developed to map the original data into a number of latent normal distributions represented by a set of means and variances. Secondly, a latent vector is drawn from latent normal distributions using random sampling. Thirdly, a decoder model is developed to transform the latent vector into synthetic data samples (Chollet and Allaire, 2018; Kornish et al., 2018). As shown in Figures 6B GAN models are trained in an adversarial way, i.e., the generator model is trained to create high-quality synthetic data to fool the discriminator, while the discriminator is trained to correctly differentiate between actual and synthetic data. Once converged, the generator of a GAN model, which typically takes random data drawn from certain distributions as inputs, can be used to create synthetic data (Frid-Adar et al., 2018).
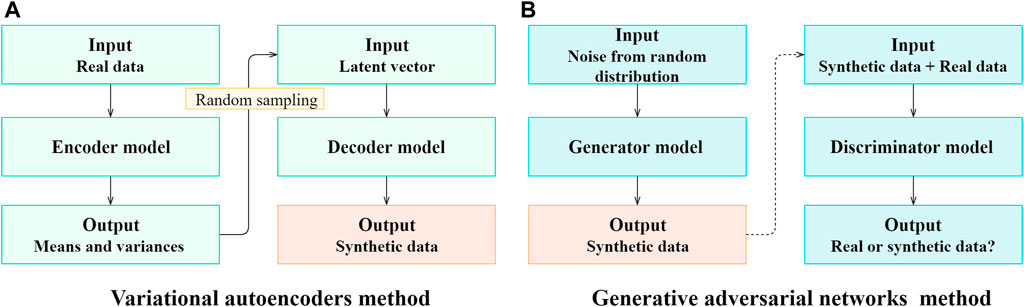
FIGURE 6. The main idea of generative model-based data augmentation methods.
Tian et al. proposed a parallel prediction scheme using GANs to solve the insufficient data problem in building energy predictions (Tian et al., 2019). The proposed method involved two stages, i.e., the first was to use a GAN model to generate synthetic data as supplements to the original data, and the second was to utilise data mining algorithms to develop prediction models based on the joint use of synthetic and original data. The results verified that the synthetic data generated by GANs indeed had a similar distribution to the original data, and the prediction models trained on the mixed data could achieve higher accuracy (Tian et al., 2019). Besides the vanilla version of GAN and VAE, advanced models can be developed to generate synthetic data under certain conditions, e.g., conditional variational autoencoder (CVAE) and conditional generative adversarial network (CGAN). Such methods can be very useful in analysing imbalanced data. In such a case, the conditional generative models can be applied to generate more synthetic data for minority classes and thereby, enhance the reliability of data-driven classification models. In practice, GANs can be very difficult to train and often suffer from the problems of non-convergence, vanishing gradients and unbalanced learning between the generator and discriminator. By contrast, VAEs are much easier to train with an explicitly defined objective function of minimizing the data reconstruction and regularisation losses (Kingma and Welling, 2014). More research efforts should be made to investigate the potentials of data augmentation in building data analysis, especially in imbalanced fault classification tasks.
Transfer Learning
Transfer learning is another promising concept to tackle the potential data shortage problem in the building field. As shown in Figure 7, the main idea of transfer learning is to leverage the knowledge learnt from well-measured buildings (or source buildings) to facilitate the modelling task in poorly measured buildings (or target buildings). In principle, there are four strategies for knowledge transfer, i.e., the data instance-based, model parameter-based, feature representation-based or relational knowledge-based strategies (Pan and Yang, 2010). The data instance-based strategy will select and reweight data in the source domain to facilitate the data-driven task in the target domain. It is typically used when the data variables are the same across different domains. The model parameter-based strategy typically develops a complicated data-driven model using source domain data, based on which model parameters are fine-tuned using the target domain data for problem adaptation. The feature representation-based strategy can be used when the data variables are different between source and target domains. In such a case, the common feature subspace is explored for data integration and problem adaptation. The relational knowledge-based strategy is generally used to analyse multi-relational datasets between source and target domains.
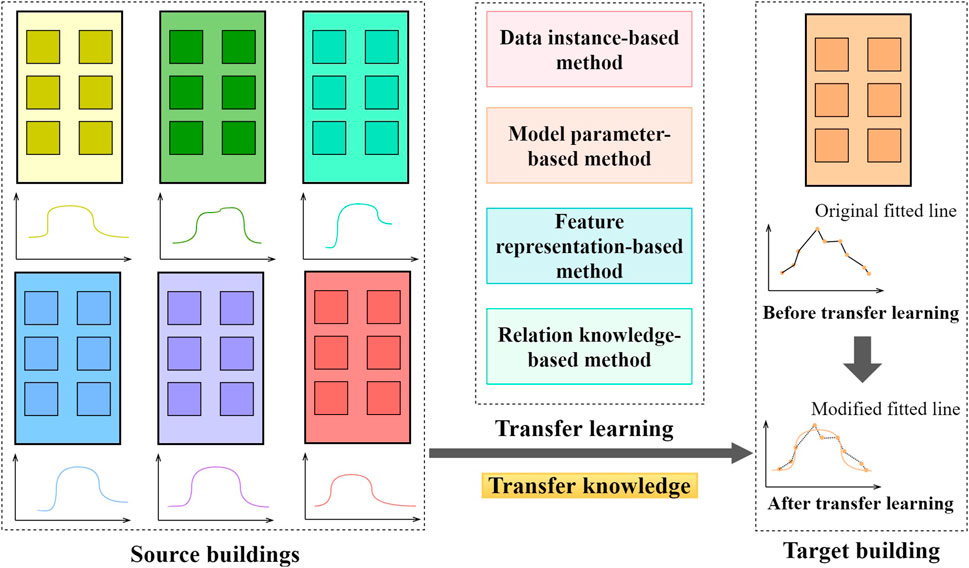
FIGURE 7. The main idea of transfer learning for building operational data analysis.
In the building field, previous studies mainly investigated the value of model parameter-based strategy for knowledge transfer. Fan et al. investigated the value of neural network-based transfer learning for short-term building energy predictions (Fan et al., 2020). As shown in Figure 8, there are two approaches for parameter sharing, i.e., using the pretrained model for feature extraction (Sermanet et al., 2014) or weight initialization (Li et al., 2020). The authors have designed a set of data experiments to quantify the transfer learning performance in different data shortage scenarios and using different knowledge transfer approaches. The results showed that the proposed transfer learning method could enhance prediction accuracy by approximately 15–78%, while the second approach could lead to more stabilized performance. Ribeiro et al. used the Hephaestus method to integrate building data with different distributions and seasonalities (Ribeiro et al., 2018). It is in essence a model parameter- and data instance-based transfer learning strategy. The case study results showed that such method could improve the building energy prediction accuracy by 11.2%.
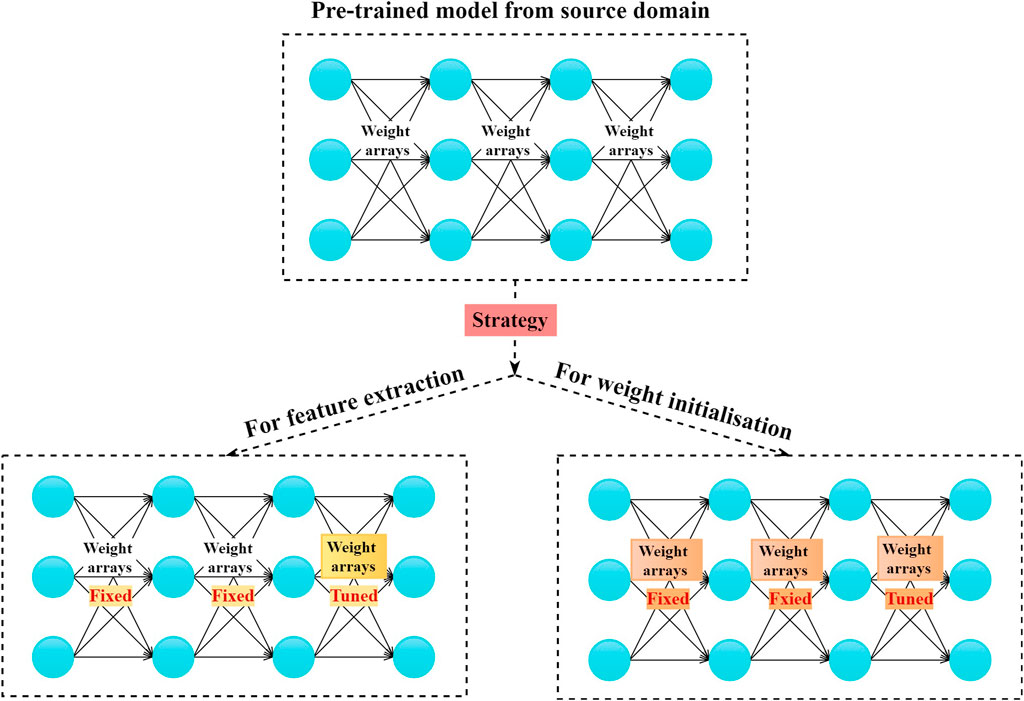
FIGURE 8. Two common strategies for network-based transfer learning.
Transfer learning has great potentials in integrating and utilising existing building data resources. However, it has not been comprehensively investigated in the building field. Existing studies mainly adopted the parameter-based approach for knowledge transfer. To ensure the validity of knowledge transferred, the source building used for pertained model development should be optimized. At present, limited studies have been performed to address suitable methods and possible outcomes of source building selection. One possible solution is to measure similarities between source and target buildings, where similarity metrics can be developed considering the building type, total floor area, year of construction, geographical location and outdoor environment. In addition, other transfer learning approaches, such as data instance-based and subspace feature representation-based approaches, may be useful and applicable in different building data scenarios. For instance, the instance-based approach seems to be the only choice when the target building does not have any measurements at all. In such a case, the key challenge is how to correctly quantify the similarities between source and target buildings as data weights for source data utilization. The subspace feature representation-based approach is applicable when the data variables collected in source and target buildings are different. In such a case, there is no way to directly implement the data instance-based or model parameter-based approaches for knowledge transfer. Suitable methods should be developed to find meaningful data subspaces, based on which the data resources between source and target buildings are integrated for further analysis.
Semi-Supervised Learning
In practice, buildings may have collected large amounts of operational data, yet only a small subset is properly labelled for direct supervised learning. In this study, semi-supervised learning is reviewed as a data preprocessing technique as it can be used to fully realize the value of unlabelled data. Taking the fault detection and diagnosis task as examples, the amount of labelled data is typically limited due to the costs associated with manual labelling. Consequently, the classification model developed is of low complexity to avoid to the overfitting problem. As shown in Figure 9, the main idea of semi-supervised learning is to effectively utilize the large amounts of unlabelled data for updating the decision boundary. There are four main methods of semi-supervised classification: generative model-based, low-density separation-based, graph-based and self-labelled methods (Chapelle et al., 2006; Triguero et al., 2015). The generative model-based method assumes that the unlabelled data follow certain distributions, e.g., normal distributions (Vandewalle et al., 2013). The low-density separation-based method assumes that the underlying decision boundary only lies in low-density regions (Tian et al., 2012). The graph-based method adopts graphs to represent original data and the labelling information is propagated across similar nodes for semi-supervised learning (Talukdar and Pereira, 2010). Compared with the above-mentioned methods, the self-labelled method is more convenient to use, as it imposes less stringent assumptions on data distributions and does not require extensive modifications to supervised learning algorithms (Triguero et al., 2015).
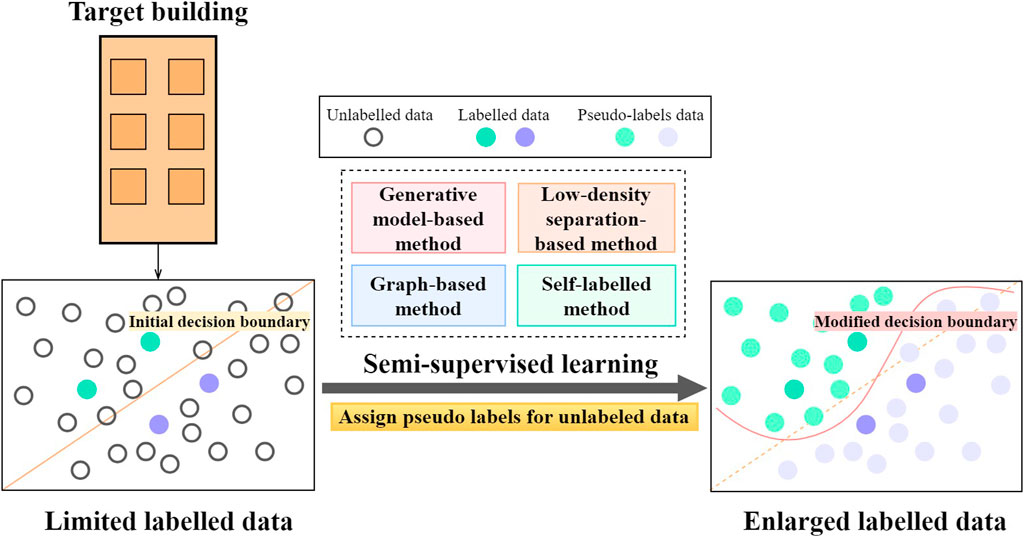
FIGURE 9. Semi-supervised learning for building operational data analysis.
Previous studies have explored the advantage of semi-supervised learning in building data analysis. Dey et al. used semi-supervised support vector machines to classify faulty and normal patterns of an HVAC terminal unit (Dey et al., 2018). It is in essence a low-density separation method and the results validated the use of semi-supervised learning in building system fault detection. Yan et al. proposed a semi-supervised learning framework to detect and diagnose faults in air handling units (AHU), where only a few labelled training samples were available for supervised learning (Yan et al., 2018). Fan et al. developed a semi-supervised neural network-based method for identifying faults in AHU operations (Fan et al., 2021a). A self-labelling scheme was adopted for semi-supervised neural network development. A set of data experiments have been designed to quantify the value of semi-supervised learning. It was reported that up to 30% performance improvement could be achieved given limited labelled data. Semi-supervised learning is a less explored topic in the building. It is of great potential considering the wide existence of unlabelled building operational data. Further in-depth studies are suggested to investigate methods and impacts of semi-supervised learning on typical building operational data analysis tasks.
Conclusion
Data preprocessing is an indispensable step in the knowledge discovery from massive building operational data. This paper provides a comprehensive review of both conventional and advanced data preprocessing techniques in existing literatures. Conventional data preprocessing tasks, including missing value imputation, outlier detection, data scaling, data reduction, data transformation and data partitioning, have been reviewed with the most widely used methods discussed. Existing studies indicated that the data preprocessing for building operational data cannot be fully automated due to significant variations in building operating characteristics and data quality. At present, it is more like a trail-and-error process which relies heavily on domain expertise and practical tasks at hand. More research efforts should be made towards the automation of building operational data preprocessing tasks for data analysis efficiency enhancement.
This study also summarizes three advanced data preprocessing techniques, i.e., data augmentation, transfer learning and semi-supervised learning for building operational data analysis. The data augmentation and transfer learning methods can be used to tackle the potential data shortage problem in individual buildings. These methods can bring significant values to enhance the reliability and generalisation performance of data-driven models. Meanwhile, semi-supervised learning can be used to fully exploit the hidden value in massive amounts of unlabelled data. It is especially useful in developing classification models for building systems, as it can be very expensive and labour-intensive to determine labels for building operational data, e.g., whether a data sample corresponds to normal or faulty operations. Such research topics are relatively new in the building field. Possible in-depth analyses are suggested for the efficient integration and utilisation of building data resources.
Author Contributions
Conceptualization: CF and XW. Methodology: MC and CF Formal analysis: CF and MC. Writing: MC and CF. Review and editing: JW and BH. Visualization: MC and CF.
Funding
The authors gratefully acknowledge the support of this research by the National Natural Science Foundation of China (No. 51908365 and 71772125), the Shenzhen Science and Technology Program (No. KQTD2018040816385085), and the Philosophical and Social Science Program of Guangdong Province (GD18YGL07).
Conflict of Interest
XW and BH were employed by eSight Technology (Shenzhen) Company Limited.
The remaining authors declare that the research was conducted in the absence of any commercial or financial relationships that could be construed as a potential conflict of interest.
References
Ashouri, M., Fung, B. C., Haghighat, F., and Yoshino, H. (2020). Systematic approach to provide building occupants with feedback to reduce energy consumption. Energy 194, 116813. doi:10.1016/j.energy.2019.116813
Ashouri, M., Haghighat, F., Fung, B. C. M., Lazrak, A., and Yoshino, H. (2018). Development of building energy saving advisory: a data mining approach. Energy Build. 172, 139–151. doi:10.1016/j.enbuild.2018.04.052
Capozzoli, A., Lauro, F., and Khan, I. (2015). Fault detection analysis using data mining techniques for a cluster of smart office buildings. Expert Syst. Appl. 42 (9), 4324–4338. doi:10.1016/j.eswa.2015.01.010
Chae, Y. T., Horesh, R., Hwang, Y., and Lee, Y. M. (2016). Artificial neural network model for forecasting sub-hourly electricity usage in commercial buildings. Energy Build. 111, 184–194. doi:10.1016/j.enbuild.2015.11.045
Chapelle, O., Scholkopf, B., and Zien, A. (2006). Semi-supervised learning. Cambridge, MA: MIT Press.
Cheng, Z., Zhao, Q., Wang, F., Chen, Z., and Li, Y. (2016). “Case studies of fault diagnosis and energy saving in buildings using data mining techniques,” in IEEE international conference on automation science and engineering, Fort Worth, TX, August 21–25, 2016 (New York, NY: IEEE), 646–651.
Chollet, F., and Allaire, J. J. (2018). Deep learning with R. 1st Edn. New York, NY: Manning Publications.
Chou, J. S., Hsu, Y. C., and Lin, L. T. (2014). Smart meter monitoring and data mining techniques for predicting refrigeration system performance. Expert Syst. Appl. 41 (5), 2144–2156. doi:10.1016/j.eswa.2013.09.013
Cui, Z. G., Cao, Y., Wu, G. F., Liu, H., Qiu, Z. F., and Chen, C. W. (2018). Research on preprocessing technology of building energy consumption monitoring data based on machine learning algorithm. Build. Sci. 34 (2), 94–99.
Dey, M., Rana, S. P., and Dudley, S. (2018). “Semi-supervised learning techniques for automated fault detection and diagnosis of HVAC systems,” in IEEE 30th international conference on tools with artificial intelligence (ICTAI, Volos, Greece, November 5–7, 2018 (New York, NY: IEEE), 872–877.
Fan, C., Liu, X., Xue, P., and Wang, J. (2021a). Statistical characterization of semi-supervised neural networks for fault detection and diagnosis of air handling units. Energy Build. 234, 110733. doi:10.1016/j.enbuild.2021.110733
Fan, C., Sun, Y., Xiao, F., Ma, J., Lee, D., Wang, J., et al. (2020). Statistical investigations of transfer learning-based methodology for short-term building energy predictions. Appl. Energy 262, 114499. doi:10.1016/j.apenergy.2020.114499
Fan, C., Sun, Y., Zhao, Y., Song, M., and Wang, J. (2019a). Deep learning-based feature engineering methods for improved building energy prediction. Appl. Energy 240, 35–45. doi:10.1016/j.apenergy.2019.02.052
Fan, C., Wang, J., Gang, W., and Li, S. (2019b). Assessment of deep recurrent neural network-based strategies for short-term building energy predictions. Appl. Energy 236, 700–710. doi:10.1016/j.apenergy.2018.12.004
Fan, C., Xiao, F., Madsen, H., and Wang, D. (2015a). Temporal knowledge discovery in big BAS data for building energy management. Energy Build. 109, 75–89. doi:10.1016/j.enbuild.2015.09.060
Fan, C., and Xiao, F. (2018). Mining big building operational data for improving building energy efficiency: a case study. Build. Serv. Eng. Res. Technol. 39 (1), 117–128. doi:10.1177/0143624417704977
Fan, C., Xiao, F., Song, M., and Wang, J. (2019c). A graph mining-based methodology for discovering and visualizing high-level knowledge for building energy management. Appl. Energy 251, 113395. doi:10.1016/j.apenergy.2019.113395
Fan, C., Xiao, F., and Wang, S. (2014). Development of prediction models for next-day building energy consumption and peak power demand using data mining techniques. Appl. Energy 127, 1–10. doi:10.1016/j.apenergy.2014.04.016
Fan, C., Xiao, F., and Yan, C. (2015b). A framework for knowledge discovery in massive building automation data and its application in building diagnostics. Autom. Constr. 50, 81–90. doi:10.1016/j.autcon.2014.12.006
Fan, C., Xiao, F., and Zhao, Y. (2017). A short-term building cooling load prediction method using deep learning algorithms. Appl. Energy 195, 222–233. doi:10.1016/j.apenergy.2017.03.064
Fan, C., Yan, D., Xiao, F., Li, A., An, J., and Kang, X. (2021b). Advanced data analytics for enhancing building performances: from data-driven to big data-driven approaches. Build. Simul. 14, 3–24. doi:10.1007/s12273-020-0723-1
Frid-Adar, M., Klang, E., Amitai, M., Goldberger, J., and Greenspan, H. (2018). “Synthetic data augmentation using GAN for improved liver lesion classification,” in IEEE 15th international symposium on biomedical imaging, Washington, DC, April 4–7, 2018 (New York, NY: IEEE), 289–293.
Gao, X., Deng, F., and Yue, X. H. (2020). Data augmentation in fault diagnosis based on the Wasserstein generative adversarial network with gradient penalty, Neurocomputing 396, 487–494. doi:10.1016/j.neucom.2018.10.109
Goodfellow, I., Bengio, Y., and Courville, A. (2016). Deep learning. 1st Edn. Cambridge, MA: MIT Press.
Gulbinas, R., Khosrowpour, A., and Taylor, J. (2015). Segmentation and classification of commercial building occupants by energy-use efficiency and predictability. IEEE Trans. Smart Grid 6 (3), 1414–1424. doi:10.1109/tsg.2014.2384997
Guyon, I., and Elisseeff, A. (2003). An introduction to variable and feature selection. J. Machine Learn. Res. 3, 1157–1182. doi:10.1063/1.106515
Han, J. W., Kamber, M., and Pei, J. (2011). Data mining: concepts and techniques. 3rd Edn. Burlington, MA: Morgan Kaufmann.
IEA (2019). Energy efficiency: buildings. Available at: https://www.iea.org/topics/energyefficiency/buildings/ (Accessed January 13, 2021).
Jalori, S., and Reddy, T. A. (2015a). A new clustering method to identify outliers and diurnal schedules from building energy interval data. ASHRAE Trans. 121 (2), 33–44.
Jalori, S., and Reddy, T. A. (2015b). A unified inverse modeling framework for whole-building energy interval data: daily and hourly baseline modeling and short-term load forecasting. ASHRAE Trans. 121, 156–169.
Jenghara, M. M., Ebrahimpour-Komleh, H., Rezaie, V., Nejatian, S., Parvin, H., and Yusof, S. K. S. (2018). Imputing missing value through ensemble concept based on statistical measures. Knowledge Inf. Syst. 56 (1), 123–139.
Kang, P. (2013). Locally linear reconstruction based missing value imputation for supervised learning. Neurocomputing 118, 65–78. doi:10.1016/j.neucom.2013.02.016
Khan, I., Capozzoli, A., Corgnati, S. P., and Cerquitelli, T. (2013). Fault detection analysis of building energy consumption using data mining techniques. Energy Procedia 42, 557–566. doi:10.1016/j.egypro.2013.11.057
Kingma, D. P., and Welling, M. (2014). Auto-encoding variational bayes. Available at: https://arxiv.org/abs/1312.6114 (Accessed December 20, 2013).
Kolter, J., and Ferreira, J. (2011). “A large-scale study on predicting and contextualizing building energy usage,” in Twenty-fifth AAAI conference on artificial intelligence (AAAI’11), San Francisco, CA, August 7–11, 2011 (Menlo Park, CA: AAAI Press), 1349–1356.
Kornish, D., Ezekiel, S., and Cornacchia, M. (2018). “DCNN augmentation via synthetic data from variational autoencoders and generative adversarial networks,” in IEEE applied imagery pattern recognition workshop, Washington, DC, October 9–11, 2011 (New York, NY: IEEE).
Kusiak, A., Li, M., and Tang, F. (2010). Modeling and optimization of HVAC energy consumption. Appl. Energy 87 (10), 3092–3102. doi:10.1016/j.apenergy.2010.04.008
Kwac, J., Flora, J., and Rajagopal, R. (2014). Household energy consumption segmentation using hourly data. IEEE Trans. Smart Grid 5 (1), 420–430. doi:10.1109/tsg.2013.2278477
Le Cam, M., Daoud, A., and Zmeureanu, R. (2016). Forecasting electric demand of supply fan using data mining techniques. Energy 101 (101), 541–557. doi:10.1016/j.energy.2016.02.061
Li, G., Hu, Y., Chen, H., Li, H., Hu, M., Guo, Y., et al. (2017). Data partitioning and association mining for identifying VRF energy consumption patterns under various part loads and refrigerant charge conditions. Appl. Energy 185 (1), 846–861. doi:10.1016/j.apenergy.2016.10.091
Li, K., Ma, Z., Robinson, D., and Ma, J. (2020a). Using evidence accumulation-based clustering and symbolic transformation to group multiple buildings based on electricity usage patterns. Sustain. Energy Build., 61–71. doi:10.1007/978-981-32-9868-2_6
Li, K., Sun, Y., Robinson, D., Ma, J., and Ma, Z. (2020b). A new strategy to benchmark and evaluate building electricity usage using multiple data mining technologies. Sustain. Energy Technol. Assess. 40, 100770. doi:10.1016/j.seta.2020.100770
Li, X., Bowers, C. P., and Schnier, T. (2010). Classification of energy consumption in buildings with outlier detection. IEEE Trans. Ind. Electron. 57 (11), 3639–3644. doi:10.1109/tie.2009.2027926
Li, X., Grandvalet, Y., and Davoine, F. (2020c). A baseline regularization scheme for transfer learning with convolutional neural networks. Pattern Recognit. 98, 107049. doi:10.1016/j.patcog.2019.107049
Liu, J., Liu, J., Chen, H., Yuan, Y., Li, Z., and Huang, R. (2018). Energy diagnosis of variable refrigerant flow (VRF) systems: data mining technique and statistical quality control approach. Energy Build. 175, 148–162. doi:10.1016/j.enbuild.2018.07.017
Liu, T., Xu, C., Guo, Y., and Chen, H. (2019). A novel deep reinforcement learning based methodology for short-term HVAC system energy consumption prediction. Int. J. Refrig. 107, 39–51. doi:10.1016/j.ijrefrig.2019.07.018
Noh, B., Son, J., Park, H., and Chang, S. (2017). In-depth analysis of energy efficiency related factors in commercial buildings using data cube and association rule mining. Sustainability 9 (11), 2119. doi:10.3390/su9112119
Pan, S. J., and Yang, Q. (2010). A survey on transfer learning. IEEE Trans. Knowl. Data Eng. 22 (10), 1345–1359. doi:10.1109/tkde.2009.191
Piscitelli, M. S., Brandi, S., Capozzoli, A., and Xiao, F. (2021). A data analytics-based tool for the detection and diagnosis of anomalous daily energy patterns in buildings. Build. Simul. 14, 131–147. doi:10.1007/s12273-020-0650-1
Piscitelli, M. S., Mazzarelli, D. M., and Capozzoli, A. (2020). Enhancing operational performance of ahus through an advanced fault detection and diagnosis process based on temporal association and decision rules. Energy Build. 226, 110369. doi:10.1016/j.enbuild.2020.110369
Ramesh, T., Prakash, R., and Shukla, K. K. (2010). Life cycle energy analysis of buildings: an overview. Energy Build. 42 (10), 1592–1600. doi:10.1016/j.enbuild.2010.05.007
Rashid, K. M., and Louis, J. (2019). Times-series data augmentation and deep learning for construction equipment activity recognition. Adv. Eng. Inform. 42, 100944. doi:10.1016/j.aei.2019.100944
Ribeiro, M., Grolinger, K., ElYamany, H. F., Higashino, W. A., and Capretz, M. A. M. (2018). Transfer learning with seasonal and trend adjustment for cross-building energy forecasting. Energy Build. 165, 352–363. doi:10.1016/j.enbuild.2018.01.034
Seem, J. E. (2007). Using intelligent data analysis to detect abnormal energy consumption in buildings. Energy and Buildings 39 (1), 52–58. doi:10.1016/j.enbuild.2006.03.033
Sermanet, P., Eigen, D., Zhang, X., Mathieu, M., Fergus, R., and LeCun, Y. (2014). “Overfeat: integrated recognition, localization and detection using convolutional networks,” in International conference on learning representations, Banff, Canada, April 14–16, 2014.
Talukdar, P. P., and Pereira, F. (2010). Experiments in graph-based semi-supervised learning methods for class-instance acquisition. Stroudsburg, PA: Association for Computational Linguistics, 1473–1481.
Tian, C., Li, C., Zhang, G., and Lv, Y. (2019). Data driven parallel prediction of building energy consumption using generative adversarial nets. Energy Build. 186, 230–243. doi:10.1016/j.enbuild.2019.01.034
Tian, X., Gasso, G., and Canu, S. (2012). A multiple kernel framework for inductive semi-supervised SVM learning. Neurocomputing 90, 46–58. doi:10.1016/j.neucom.2011.12.036
Triguero, I., García, S., and Herrera, F. (2015). Self-labeled techniques for semi-supervised learning: taxonomy, software and empirical study. Knowl Inf. Syst. 42 (2), 245–284. doi:10.1007/s10115-013-0706-y
Um, T. T., Pfister, F. M. J., Pichler, D., Endo, S., Lang, M., Hirche, S., et al. (2017). “Data augmentation of wearable sensor data for Parkinson’s disease monitoring using convolutional neural networks”, in ACM international conference on multimodal interaction. Glasgow United Kingdom, November, 2011, 216–220.
Vandewalle, V., Biernacki, C., Celeux, G., and Govaert, G. (2013). A predictive deviance criterion for selecting a generative model in semi-supervised classification. Comput. Stat. Data Anal. 64 (4), 220–236. doi:10.1016/j.csda.2013.02.010
Wahid, F., Ghazali, R., Ghazali, R., Fayaz, M., and Shah, A. S. (2017). Statistical features based approach (SFBA) for hourly energy consumption prediction using neural network. Networks 9 (5), 23–30. doi:10.5815/ijitcs.2017.05.04
Wang, E. (2015). Benchmarking whole-building energy performance with multi-criteria technique for order preference by similarity to ideal solution using a selective objective-weighting approach. Appl. Energy 146, 92–103. doi:10.1016/j.apenergy.2015.02.048
Wang, Z. W., Wang, L., Liang, K. F., Tan, Y. Y., and Wang, Z. W. (2019). Feature-optimizing selection for chiller fault detection and diagnosis. Cyro. Supercond. 47 (3), 49–54. doi:10.16711/j.1001-7100.2019.03.0108
Wen, Q., Sun, L., Song, X., Gao, J., Wang, X., and Xu, H. (2020). Time series data augmentation for deep learning: a survey. Available at: https://arxiv.org/abs/2002.12478 (Accessed February 27, 2020).
Xiao, F., and Fan, C. (2014). Data mining in building automation system for improving building operational performance. Energy Build. 75 (11), 109–118. doi:10.1016/j.enbuild.2014.02.005
Xiao, F., Wang, S., and Fan, C. (2017). “Mining big building operational data for building cooling load prediction and energy efficiency improvement,” in IEEE international conference on smart computing (SMARTCOMP). Hong Kong, May 29–31, 2017 (New York, NY: IEEE), 1–3.
Yan, K., Zhong, C., Ji, Z., and Huang, J. (2018). Semi-supervised learning for early detection and diagnosis of various air handling unit faults. Energy Build. 181, 75–83. doi:10.1016/j.enbuild.2018.10.016
Yu, X., Ergan, S., and Dedemen, G. (2019). A data-driven approach to extract operational signatures of HVAC systems and analyze impact on electricity consumption. Appl. Energy 253, 113497. doi:10.1016/j.apenergy.2019.113497
Yu, Z., Haghighat, F., Fung, B. C. M., and Zhou, L. (2012). A novel methodology for knowledge discovery through mining associations between building operational data. Energy Build. 47, 430–440. doi:10.1016/j.enbuild.2011.12.018
Zhang, C., Cao, L., and Romagnoli, A. (2018). On the feature engineering of building energy data mining. Sustain. Cities Soc. 39, 508–518. doi:10.1016/j.scs.2018.02.016
Keywords: data preprocessing, building operational data analysis, data science, knowledge discovery, building energy management
Citation: Fan C, Chen M, Wang X, Wang J and Huang B (2021) A Review on Data Preprocessing Techniques Toward Efficient and Reliable Knowledge Discovery From Building Operational Data. Front. Energy Res. 9:652801. doi: 10.3389/fenrg.2021.652801
Received: 13 January 2021; Accepted: 15 February 2021;
Published: 29 March 2021.
Edited by:
Yongjun Sun, City University of Hong Kong, Hong KongCopyright © 2021 Fan, Chen, Wang, Wang and Huang. This is an open-access article distributed under the terms of the Creative Commons Attribution License (CC BY). The use, distribution or reproduction in other forums is permitted, provided the original author(s) and the copyright owner(s) are credited and that the original publication in this journal is cited, in accordance with accepted academic practice. No use, distribution or reproduction is permitted which does not comply with these terms.
*Correspondence: Xinghua Wang, wangxinghua@esightech.com.cn