Benchmarking Nature-Based Solution and Smart City Assessment Schemes Against the Sustainable Development Goal Indicator Framework
 Laura A. Wendling
 Aapo Huovila
 Malin zu Castell-Rüdenhausen1
 - 1VTT Technical Research Centre of Finland Ltd, Espoo, Finland
- 2Finnish Association of Civil Engineers RIL, Helsinki, Finland
Increasing global urbanization yields substantial potential for enhanced sustainability through careful management of urban development and optimized resource use efficiency. Nature-based solutions (NBS) can provide a means for cities to successfully navigate the water-energy-climate relationship, thus enhancing urban resilience. Implementation of NBS can improve local or regional economic resilience underpinned by the sustainable use of natural resources. The innovative governance, institutional, business, and finance models and frameworks inherent to NBS implementation also provide a wealth of opportunity for social transformation and increased social inclusiveness in cities. The ultimate benefit of NBS implementation in cities is increased livability, which is typically measured as a function of multiple social, economic and environmental variables. Given the range of different interventions classified as NBS and the cross-sectoral character of their co-benefits, different assessment schemes can be used to evaluate NBS performance and impact. Herein, performance and impact indicators within three robust NBS- and Smart City-related assessment schemes—Mapping and Assessment of Ecosystems and their Services (MAES), Knowledge and Learning Mechanism on Biodiversity and Ecosystem Services (EKLIPSE), and Smart City Performance Measurement Framework (CITYkeys)—were critically analyzed with respect to Sustainable Development Goal (SDG) 11, “Make cities and human settlements inclusive, safe, resilient and sustainable.” Each selected assessment scheme was benchmarked with respect to the Inter-Agency Expert Group on SDG Indicators' global indicator framework for the sub-objectives of SDG 11. The alignment between each of the selected NBS assessment schemes and the SDG indicator framework was mapped with particular emphasis on consistency with city-level framework indicators for each SDG 11 sub-objective. The results were illustrated as composite scores describing the alignment of the analyzed NBS and Smart city assessment schemes with the SDG 11 sub-objectives. These results facilitate NBS assessment scheme selection based on alignment between each analyzed assessment scheme and specific SDG 11 sub-objectives. Cities face multiple challenges amidst a complex hierarchy of legislative, regulatory and other stakeholder obligations. The present study showed that strategic selection of an NBS assessment scheme which closely aligns with one or more sub-objectives within SDG 11 can maximize operational efficiency by exploiting synergies between evaluation schemes.
Introduction
Urban areas are currently home to 54% of the world's human population, and account for approximately 75% of global CO2 emissions and 60–80% of total energy consumption (Rode and Burdett, 2011; United Nations, Department of Economic and Social Affairs, Population Division, 2015a). As the world's population continues to increase—from 7.3 billion in 2015 to an estimated 9.7 billion in 2050—cities are expected to accommodate the majority of the future population increase, with 67% of the world's population expected to reside in urban areas by 2050 (EEA, 2015; United Nations, Department of Economic and Social Affairs, Population Division, 2015b). The further concentration of the human population within urban centers yields substantial potential for enhanced sustainability through careful management of urban development and improved resource use efficiency. A 2011 report by the UNEP indicated that compact, densely populated mixed-use urban areas are the most resource-efficient urban form (Rode and Burdett, 2011), with significant opportunity for resource use and emissions optimization based on the design and integration of infrastructure, energy, water and waste systems. Conversely, cities are characterized by relatively lesser resilience to disturbances compared to non-human-dominated ecosystems (Alberti et al., 2003), making them relatively more susceptible to the impacts of climate change.
The UN Sustainable Development Goals (SDGs), unanimously adopted by the 193 UN Member States in 2015, are comprised of 17 Global Goals and 169 targets intended to balance the economic, social and environmental dimensions of sustainable development (United Nations General Assembly, 2015). The SDGs build upon the Millennium Development Goals to extend action from developing to all countries, and focus on strategies to address socio-economic needs whilst protecting the environment and adapting to global climate change. The Preamble to the 2030 Agenda for Sustainable Development states, in part: “This Agenda is a plan of action for people, planet and prosperity.…All countries and all stakeholders, acting in collaborative partnership, will implement this plan.…We are determined to take the bold and transformative steps which are urgently needed to shift the world onto a sustainable and resilient path” (United Nations General Assembly, 2015). The SDGs and associated targets, indicators and evaluation metrics (UN-Habitat et al., 2016; United Nations General Assembly, 2017) represent an internationally-accepted framework for the evaluation of sustainability at a global level. A fundamental question is how to apply the adage “think globally, act locally” (Geddes, 1915) for effective implementation and monitoring of city-level actions to increase urban sustainability and resilience to climate change impacts. Several guides have been developed to support localization of the SDGs (e.g., SDSN, 2016), yet the alignment between the SDG targets and indicators and the multitude of individual focused indicator frameworks developed to evaluate specific actions at local or regional scale remains unclear.
Although the concepts of “sustainability” and “resilience” in the context of urban ecosystems are sometimes used interchangeably, these terms have unique meanings. Urban resilience is associated both with recovery from disruptive events as well as the capacity for the urban ecosystem to adapt to change. People play an important role in the resilience of social-ecological systems such as cities by anticipating change and influencing future events. The current concept of resilience focuses on the capacity for continued learning, self-organization and adaptation to dynamic environments—in short, persisting with change (Folke, 2016). Resiliency of urban ecosystems is particularly relevant in the context of adaptation to rapid urban growth coupled with global climate change. Sustainability refers to an ecosystem's capacity to maintain diversity and productivity over time. Urban sustainability can be interpreted as equitably meeting the social, economic, environmental, and governance needs of current and future generations. Thus, sustainability fundamentally implies intergenerational equity in resource use and management. From a normative viewpoint, sustainable development is a holistic framework of economic, social, and environmental goals targeting widespread economic progress, elimination of extreme poverty, implementation of policies that strengthen communities and social trust, and the protection of the environment from anthropogenic harm (Sachs, 2015). Defining sustainable use of natural resources relates to the concept of planetary boundaries (Rockström et al., 2009; Steffen et al., 2015), thereby linking sustainability with the ability of the ecosystem to adapt to change or recover following perturbation.
Sustainable urban development is inherently connected with urban resilience to climate change via intergenerational equity. Worldwide efforts to enhance urban sustainability and resilience are driven by widely-recognized global challenges: population growth, increasing urbanization and urban densification, climate change, and competing demands for finite resources in the water-energy-food nexus. Successful navigation of the food-water-energy-climate relationship is central to enhancing the biophysical aspect of urban resilience and can contribute to social and economic resilience. Urban sustainability and resilience planning, and urban initiatives such as Habitat III New Urban Agenda and 100 Resilient Cities, are frequently associated with urban greening and efforts to enhance ecosystem services in urban environments. The biophilic or green city concept has garnered increasing interest among researchers and practitioners as potential water-climate-energy benefits conferred by green and blue spaces within urban areas are further elucidated (Rode and Burdett, 2011; Beatley and Newman, 2013). Nature-based solutions (NBS) provide a systemic approach to fostering the maintenance, enhancement and restoration of biodiversity and ecosystems in urban areas, extending the concepts of green infrastructure and ecosystem-based climate adaptation by addressing societal challenges and promoting sustainable, resilient urbanization pathways.
NBS could be a central component of urban resilience strategies as the implementation of NBS can improve local or regional resilience to multiple impacts of climate change as well as economic resilience underpinned by the sustainable use of natural resources. In addition, the innovative governance, institutional, business, and finance models and frameworks inherent to NBS implementation provide a wealth of opportunity for social transformation and increased social inclusiveness in cities. The co-benefits of enhanced ecosystem services provision following NBS implementation in urban areas can include improvements to the social fabric of cities, as well as measureable improvements in quality of life, physical and mental health, sense of belonging and cultural identity (Jackson, 2003; Tzoulas et al., 2007; Sugiyama et al., 2008; Keniger et al., 2013; Hartig et al., 2014). Thus, the overall benefit gained through NBS implementation in cities has multiple social, economic and environmental components. Evaluating the impacts and co-benefits of NBS broadly requires consideration of environmental performance, human health and well-being impacts, stakeholder involvement, and the transferability or longevity of the action (Kabisch et al., 2016). Moreover, the transformative potential of NBS for sustainable, liveable cities resilient to future climate change requires evaluation in the context of existing urban sustainability planning.
Planning for vibrant urban communities now and in the future balances environmental protection, economic development, and social equity priorities, at the center of which lies sustainable development (Campbell, 1996). The perceived conflict between environment and development has been researched exhaustively. Use of ecosystem function analysis and valuation to assess cost-benefit and trade-offs associated with different land uses has shown that investment in urban nature provides ecological, social and economic benefit, thereby minimizing the conflict between environment and development (de Groot, 2006; de Groot et al., 2010; Maes et al., 2012). The benefits of urban nature in terms of social equity are less well understood, with relatively less public discourse to date concerning the long-term sustainability of NBS-induced changes to the urban social fabric. The complexity of the relationship between social inclusiveness and urban greening highlights the need for further consideration of social-ecological processes to explicitly address issues of equity and inclusiveness in the development of urban greening strategies (Haase et al., 2017; Juntti and Lundy, 2017).
Given the range of different interventions classified as NBS and the cross-sectoral character of their co-benefits a number of different assessment schemes can potentially be used to evaluate different aspects of NBS performance and impact depending on the desired outcomes of NBS implementation. The comprehensive systems approach embodied by the UN SDGs represents an internationally accepted standard of targets, indicators and metrics for the evaluation of progress toward sustainability and resilience to climate change (United Nations General Assembly, 2015, 2017). Thus, alignment between a given assessment scheme and relevant SDGs provides an indication of the degree to which the selected assessment framework addresses the environmental, economic, and social dimensions of sustainable development central to urban planning. Herein, we interrogate the alignment between indicator frameworks potentially applicable to evaluation of the direct benefits and co-benefits of NBS implementation in urban areas and the global indicator framework for UN Sustainable Development Goal 11 “Make cities and human settlements inclusive, safe, resilient and sustainable” (SDG 11; United Nations General Assembly, 2015). Three robust NBS- and smart city-related assessment schemes –MAES (Maes et al., 2016), EKLIPSE (Raymond et al., 2017), and CITYkeys (Bosch et al., 2017)—were critically analyzed with respect to SDG11, with particular emphasis on consistency with city-level framework indicators for each SDG 11 target.
The Mapping and Assessment of Ecosystems and their Services-Urban Ecosystems (MAES) technical report and indicator framework (Maes et al., 2016) was selected for comparison to SDG 11 because the aim to provide ecosystem services for, and enhance the water and climate resilience of, urban areas through engineered solutions is central to the NBS concept. Thus, a credible analysis of the effectiveness of NBS projects should employ metrics related to ecosystem services. The MAES framework provides expert guidance applicable at the European, State and local level for evaluation of ecosystem services in urban areas. The NBS impact evaluation framework developed by the EKLIPSE Working Group on NBS to Promote Climate Resilience in Urban Areas (EKLIPSE framework) was further selected for comparison with SDG 11 because it provides information about environmental, social and economic challenges that can potentially be addressed by NBS, along with example indicators of NBS performance (Raymond et al., 2017). The EKLIPSE framework focuses on defining actions and indicators to support the process of NBS design, development, implementation and assessment. The EKLIPSE framework indicators are localized in that they are project-focused and applicable at various scales, from a single building to a geographic region.
Indicator frameworks which simultaneously consider social, environmental, and economic sustainability are generally accepted indicator systems for national and regional urban development (SCOPE, 2007). A key aspect of NBS is the inclusive, participatory approach to bottom-up design, implementation and management of NBS—stakeholder co-design, co-creation, and co-management (EC, 2016)—highlighting the need for NBS assessment frameworks which also consider institutional or governance aspects of performance and impact. The CITYkeys assessment framework for smart city projects and smart cities (Bosch et al., 2017) was selected for comparison with SDG 11 because it facilitates evaluation of governance factors via indicators across the major themes People, Planet, Prosperity, Governance, and Propagation. The CITYkeys and EKLIPSE frameworks are both designed to assess project implementation processes as well as outcomes. Similar to the EKLIPSE framework indicators for NBS evaluation, CITYkeys indicators are also localized in that they can also be applied at different scales to address environmental, social and economic outcomes. The CITYkeys indicators were recently standardized by the European Telecommunications Standards Institute (ETSI) in the form of the technical specification ETSI TS 103 463 Key Performance Indicators for Sustainable Digital Multiservice Cities (ETSI, 2017a) and the group specification ETSI GS OEU 019 KPIs for Smart Cities (ETSI, 2017b; Huovila et al., 2017).
In summary, the UN SDG 11 sub-objectives are of critical importance to all cities as they provide universally agreed sustainability targets. However, global application of the proposed SDG 11+ indicator framework is not yet uniformly feasible due to lack of clarity in indicator definitions, related assessment methodologies and standards. Therefore, it is essential to analyze related indicator frameworks that are already successfully used by cities in order to improve knowledge of the alignment between these indicator frameworks and the proposed UN SDG 11+ indicators, to inform further development of SDG 11+ indicators, and to elucidate any inherent bias in NBS and Smart City assessment schemes. The knowledge gained by benchmarking can contribute to harmonization of indicators, standardization of assessment methods and avoidance of duplicate data collection and indicator calculation in cities. NBS and Smart Cities constitute two central approaches to urban sustainability in Europe and there is presently a lack of knowledge regarding alignment of these frameworks with the SDG 11 objectives. The present study evaluates the degree to which three related NBS and Smart city assessment schemes (MAES, EKPLIPSE and CITYkeys) are aligned with the SDG 11+ indicators.
Materials and Methods
The MAES, EKLIPSE, and CITYkeys impact evaluation frameworks were critically analyzed with respect to the Inter-Agency Expert Group on SDG Indicators' global indicator framework for the sub-objectives of SDG 11, SDG 1.4 and SDG 6.3 (SDG11+; UN-Habitat et al., 2016). Quantitative comparisons between the respective key performance metrics within each of the selected NBS assessment schemes and SDG11+ metadata were used to conceptually map the alignment between prospective NBS assessment frameworks and SDG 11 and quantitatively benchmark the MAES, EKLIPSE and CITYkeys indicator frameworks on a scale of 0–10 against SDG11+ indicators (Table 1; Table 1 in Supplementary Material).
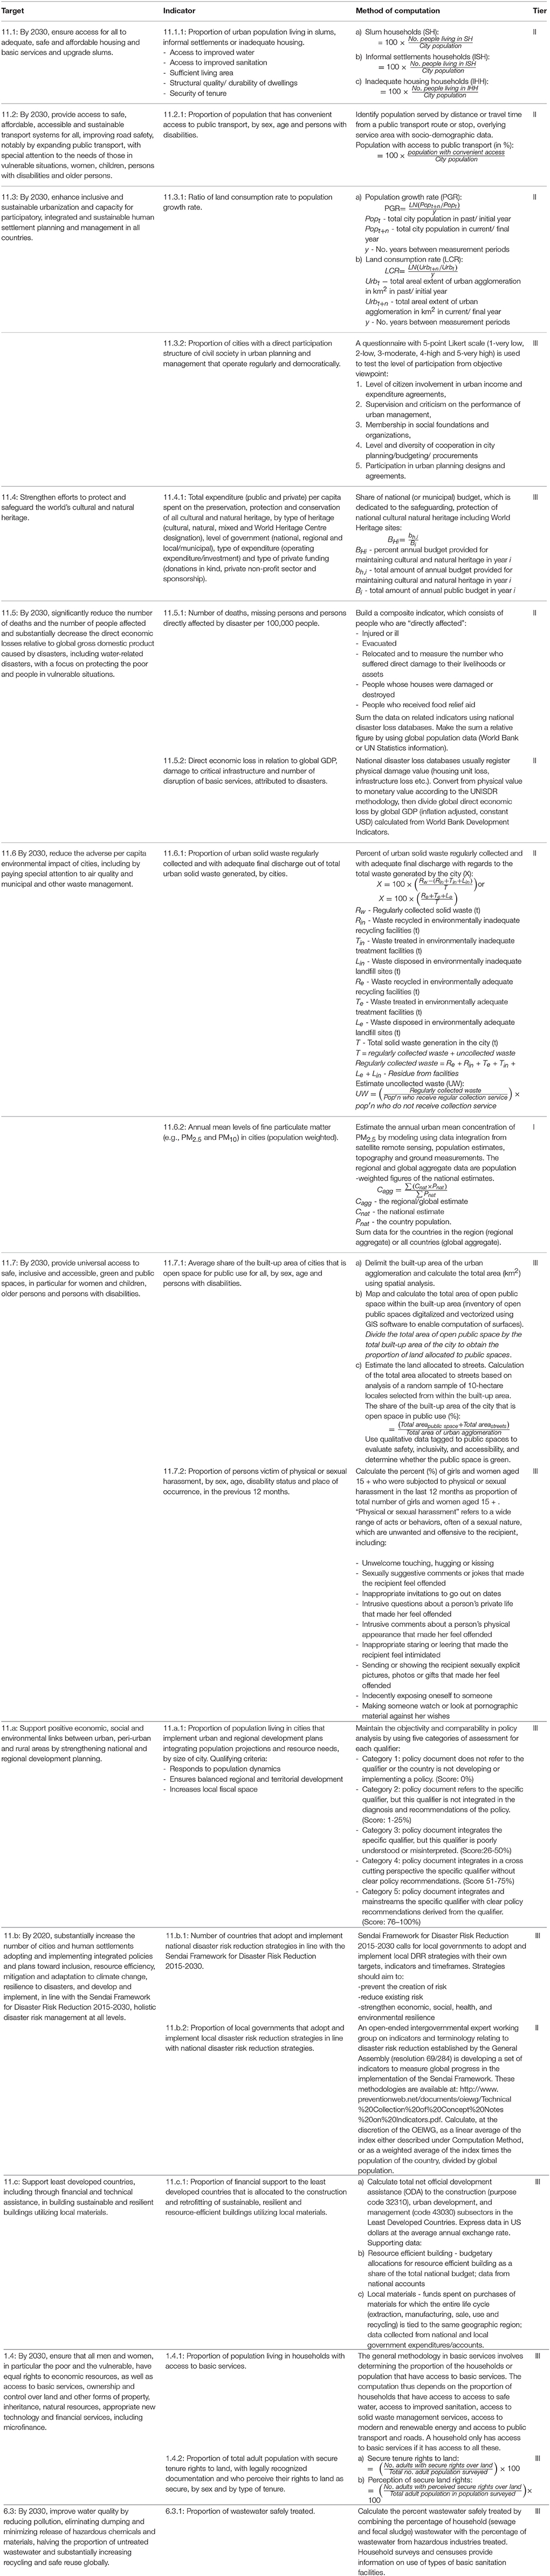
Table 1. Sustainable Development Goal 11+ (SDG11+) indicators and targets (UN-Habitat et al., 2016).
The SDG11+ indicators and targets were considered the standard or point of reference for comparison regardless of the level of methodological development or data availability, categorized as Tier I, II or III in descending order of data availability and development of standardized methodology (UN-Habitat et al., 2016). Ten of the 18 SDG11+ indicators are classified as Tier III, meaning that there is no internationally established methodology or standards are yet available for the indicator, but the methodology/standards are in development. Seven SDG11+ indicators are Tier II. Tier II indicators are those that are conceptually clear, have an internationally established methodology and standards are available, but data are not regularly produced by countries. Only one of the 18 indicators for SDG11+ is Tier I (Table 1), meaning that the indicator is conceptually clear, has an internationally established methodology and standards are available, and data are regularly produced by countries for at least half of countries and for the population in every region where the indicator is relevant.
Where SDG11+ targets were comprised of more than one indicator, individual indicator benchmark scores for a single target were averaged to yield a mean value for each SDG11+ target. All SDG11+ target benchmark scored were then averaged to obtain a composite benchmark score for the MAES, EKLIPSE, and CITYkeys indicator frameworks, respectively, relative to the SDG11+ “Sustainable cities and communities” indicators. The MAES, EKLIPSE and CITYkeys indicator frameworks were further critically analyzed and quantitatively benchmarked relative to recommended indicators for evaluating the effectiveness of NBS for climate change adaptation and mitigation, and associated co-benefits (Kabisch et al., 2016; Table 2 in Supplementary Material).
All indicators for measuring the condition of urban ecosystems, and provisioning, regulating and cultural ecosystem services as defined by the MAES framework were included in the present assessment. The example indicators of NBS performance presented in the EKLIPSE framework across 10 defined categories of challenges to urban climate resilience were evaluated against the SDG11+ global indicator framework. We examined all 76 city indicators and 101 project indicators in the CITYkeys smart city indicator framework.
Results
Numerical benchmarking scores for the MAES, EKLIPSE, and CITYkeys indicator frameworks relative to SDG11+ targets and key performance metrics (UN-Habitat et al., 2016) are summarized in Table 2.
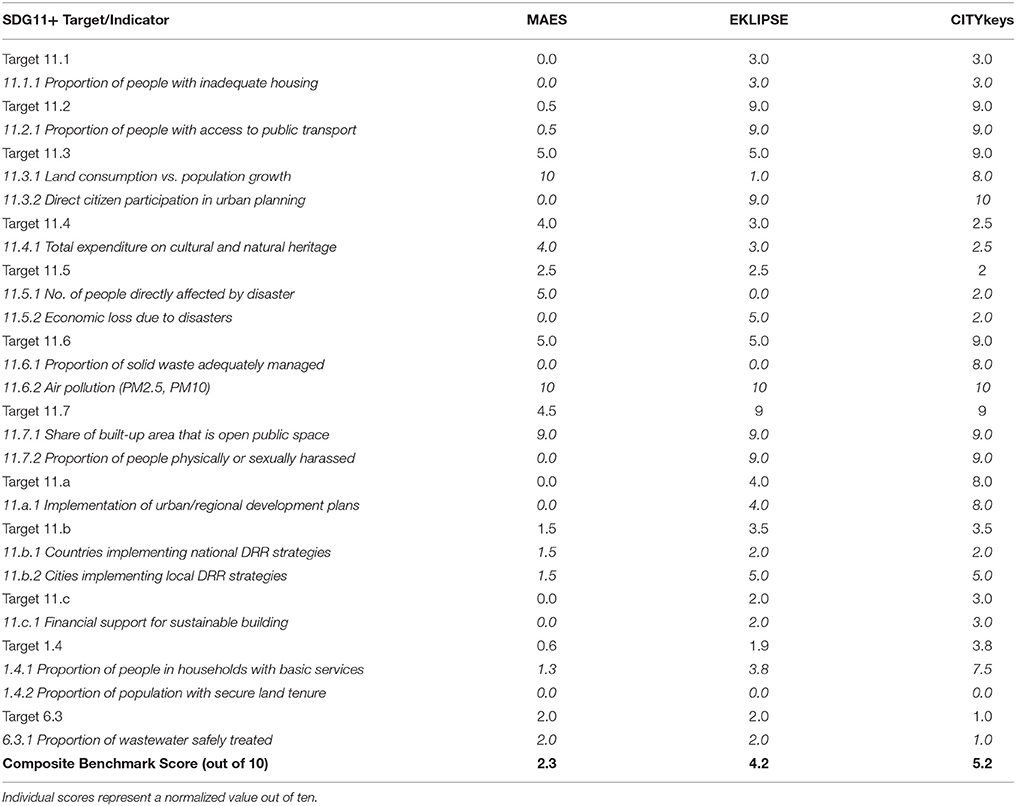
Table 2. Summary of MAES, EKLIPSE and CITYkeys assessment framework quantitative benchmarking against SDG11+ targets and indicators.
SDG Target 11.1 Housing and Slum Upgrading
Proportion of Urban Population Living in Slums, Informal Settlements or Inadequate Housing
The definition of adequate housing applied to SDG Target 11.1 specifies a household with: access to improved drinking water and improved sanitation; sufficient living area, where no more than three people share the same habitable room; a structure built on a non-hazardous location and that can protect inhabitants from climatic extremes; and, protection from forced evictions. Although the focus of the EKLIPSE NBS impact assessment framework's “Challenge 6: Urban Regeneration” is not adequacy of housing or access to improved water and sanitation, indicator 11.1.1 is partially addressed by the EKLIPSE “Challenge 6: Urban Regeneration” indicator “Access to housing: affordability and choice.” The EKLIPSE framework does not explicitly address housing adequacy, i.e., the proportion of the urban population that live in slums or informal settlements, or have inadequate housing. Rather, the EKLIPSE framework is concerned with potential trade-offs between the implementation of NBS in urban areas and social equity, especially as it concerns urban gentrification. The overall score of EKLIPSE framework indicators for SDG11+ indicator 11.1.1 was 3.0/10.
SDG11+ indicator 11.1.1 is similarly partially addressed by the CITYkeys framework via the indicator “Affordability of housing,” also earning a score of 3.0/10 for indicator 11.1.1. SDG11+ indicator 11.1.1 is not addressed by the MAES framework indicators (score: 0/10).
SDG Target 11.2 Accessible Transport System for All
11.2.1 Proportion of Population That Has Convenient Access to Public Transport
Disaggregation of the proportion of the urban population with convenient access to public transport by age group, sex, and persons with disabilities is specified by SDG11+ indicator 11.2.1. The CITYkeys framework defines the indicator “Access to public transport” similarly to SDG11+ indicator 11.2.1, as the proportion of people within 500 m distance from a public transport route or stop. Disaggregation of data to different populations is not explicitly required by the CITYkeys framework indicator, but is possible. The EKLIPSE framework “Challenge 6: Urban Regeneration” indicator “Public transport links: walking distance to nearest facilities” is also consistent with SDG11+ indicator 11.2.1, but also lacks explicit disaggregation of data. Both the CITYkeys and EKLIPSE frameworks adequately address indicator 11.2.1, yielding benchmark scores of 9.0/10 for CITYkeys and EKLIPSE frameworks, respectively, against SDG11+ indicator 11.2.1. Indicator 11.2.1 is not addressed, directly or indirectly, in the MAES framework (score: 0/10).
SDG Target 11.3 Participatory and Inclusive Urbanization
11.3.1 Ratio of Land Consumption Rate to Population Growth Rate
The MAES framework addresses urban sprawl, and land use and land use intensity as indicators of ecosystem state. Relevant MAES ecosystem state indicators include “Weighted urban proliferation (urban permeation units),” “Artificial area per inhabitant (m2/person),” “Land annually taken for built-up areas per person (m2/person),” and “Number of inhabitants per area (number/ha).” Although MAES indicators do not specify expression of the rate of land consumption and population growth rate as a ratio, it is possible to calculate this metric using data for the aforementioned MAES ecosystem state indicators. Thus, the MAES framework aligns with SDG11+ indicator 11.3.1 earning a score of 10/10. In contrast, the EKLIPSE framework addresses SDG11+ indicator 11.3.1 only marginally and indirectly via “Physical indicators: land-use and land cover changes” under “Challenge 3: Coastal Resilience” (score: 1.0/10). The issue of land consumption vs. population growth is not specifically addressed by the CITYkeys framework, although the following CITYkeys indicators can be employed to gather similar information: “Population density,” “Brownfield use,” “Green space,” “Share of green and water spaces,” and “Public outdoor recreation space.” The ratio of rate of land consumption to population growth rate may be calculated using data from these CITYkeys indicators, giving the CITYkeys framework a benchmark score of 8.0/10 for SDG11+ indicator 11.3.1.
11.3.2 Proportion of Cities With a Direct Participation Structure of Civil Society in Urban Planning and Management That Operate Regularly and Democratically
Indicator 11.3.2 is broadly addressed by the EKLIPSE framework, which does not explicitly evaluate citizen involvement in income and expenditure agreements but clearly assesses stakeholder participation in planning and governance. Multiple indicators in EKLIPSE “Challenge 7: Participatory Planning and Governance” can be used to evaluate citizen participation in urban planning and management, such as “Openness of participatory processes,” “Legitimacy of knowledge in participatory processes,” “Social learning concerning urban ecosystems and their functions/ services,” “Perceptions of citizens on urban nature,” and “Social values for urban ecosystems and biodiversity.” As such, the EKLIPSE framework benchmark score is 9.0/10 for SDG11+ indicator 11.3.2. Similar to EKLIPSE, numerous indicators in the CITYkeys framework address inclusive urbanization: “Citizen participation,” “Open public participation,” “Voter participation,” “Bottom-up or top-down initiative,” “Local community involvement in the planning phase,” “Local community involvement in the implementation phase,” “Participatory Governance,” and “Municipal involvement—financial support.” Using these indicators the SDG11+ indicator 11.3.2 is comprehensively addressed by the CITYkeys framework, earning a score of 10/10. SDG11+ Indicator 11.3.2 is not addressed, directly or indirectly, by the MAES framework (score: 0/10).
Averaging the benchmarking scores against SDG11+ indicators 11.3.1 and 11.3.2 for MAES, EKLIPSE and CITYkeys frameworks yields overall benchmark scores for SDG11+ Target 11.3 of 5.0/10, 5.0/10, and 9.0/10, respectively.
SDG Target 11.4 World's Cultural and Natural Heritage Protection
11.4.1 Total Expenditure Per Capita on the Preservation, Protection, and Conservation of All Cultural and Natural Heritage
None of the indicator frameworks examined, MAES, EKLIPSE; or CITYkeys, address total expenditure (public and private) on cultural and natural heritage. The proportion of protected area (natural heritage) is addressed by the MAES framework ecosystem state indicator “Land use - proportion of protected area (%).” The MAES framework also addresses the number of cultural and natural heritage sites per unit area as an indicator of cultural ecosystem services through the indicator “Cultural and natural heritage sites (e.g., UNESCO world heritage sites) (number per unit area, % per unit area),” earning a benchmarking score of 4.0/10. Both the EKLIPSE and CITYkeys frameworks address cultural heritage. In the CITYkeys framework, the relevant indicators include “Preservation of cultural heritage” and “Design for a sense of place” (score 2.5/10). The relevant EKLIPSE framework indicator falls within “Challenge 6: Urban Regeneration,” namely “Conservation of built heritage resources: percentage of built form retained for culture.” EKLIPSE framework indicator “Number of subsidies or tax reductions applied for (private) NBS measures” from “Challenge 10: Potential for Economic Opportunities and Green Jobs” could partially represent expenditure on natural heritage preservation depending upon the NBS implemented. The benchmark score for the EKLIPSE framework against SDG11+ indicator 11.4.1 is 3.0/10.
SDG Target 11.5 Protection of the Poor and People in Vulnerable Situation
11.5.1 Number of Deaths, Missing Persons, and Persons Directly Affected by Disaster Per 100,000 People
The CITYkeys framework only partially and indirectly addresses SDG11+ indicator 11.5.1 via the indicator “Climate resilience strategy and action plan,” yielding a benchmarking score of 2.0/10. Indicator 11.5.1 is also partially addressed by the MAES framework through indicators of flood protection (regulating services). Whilst the number of people directly affected by floods (deaths, missing persons, displaced persons, etc.) is not explicitly addressed, the MAES framework accounts for the population exposed to flood risk, and area exposed to flood risk under the regulating services indicators of flood protection (flood protection by appropriate land coverage) “Share of green areas in zones of danger of floods (%),” “Population exposed to flood risk (% per unit area),” and “Areas exposed to flooding (ha).” Benchmarking the MAES indicator framework against SDG11+ indicator 11.5.1 yields a score of 5.0/10. There are no indicators in the EKLIPSE framework which facilitate direct assessment of human mortality or other adverse impacts to people as a result of disasters (score: 0/10).
11.5.2 Direct Economic Loss in Relation to Global GDP Attributed to Disasters
Some direct economic losses attributed to disasters, expressed relative to GDP, may be calculated using data from the CITYkeys indicators “Climate resilience strategy” and “GDP.” As SDG11+ indicator 11.5.2 is only indirectly and partly addressed by CITYkeys framework indicators, the benchmark score is 2.0/10. The MAES framework does not address direct disaster economic loss in relation to GDP, either directly or indirectly (score: 0/10). Several indicators within the EKLIPSE framework “Challenge 2: Water Management” are relevant to SDG11+ indicator 11.5.2, including: “Reduction of inundation risk for critical urban infrastructures (probability) based on hydraulic modeling and GIS assessment,” “Estimation of avoided damages and costs from flooding (e.g., stage-damage curves relating depth and velocity of water to material damages),” “Linear cost benefit assessments (CBA), introducing flexibility for adaptive solutions into the assessment of infrastructure measures,” and “Extended cost benefit assessments (social cost benefit analysis, SCBA) including also social costs and benefits (taxes, subsidies, etc.).” These EKLIPSE indicator metrics partially address SDG11+ indicator 11.5.2, but are not specific to critical infrastructure or disruption of basic services, or in relation to GDP (score: 5.0/10).
Averaging the benchmarking scores against SDG11+ indicators 11.5.1 and 11.5.2 for MAES, EKLIPSE and CITYkeys frameworks yields overall benchmark scores for SDG11+ Target 11.5 of 2.5/10, 2.5/10, and 2.0/10, respectively.
SDG Target 11.6 Capital Environmental Impact of Cities Reduction
11.6.1 Proportion of Urban Solid Waste Regularly Collected and With Adequate Final Discharge
The CITYkeys indicators “Municipal solid waste,” “Domestic material consumption,” and “Recycling rate” largely address SDG11+ indicator 11.6.1; however, the adequacy of final solid waste discharge is only partially addressed by the CITYkeys framework. As such, the CITYkeys framework scores 8.0/10 against SDG11+ indicator 11.6.1. Solid waste management is not addressed directly or indirectly by the either the MAES or EKLIPSE frameworks, yielding scores of 0/10 for MAES and EKLIPSE, respectively.
11.6.2 Annual Mean Levels of Fine Particulate Matter (e.g., PM2.5 and PM10) in Cities
Both the MAES and CITYkeys frameworks explicitly address atmospheric levels of fine particulate matter (PM2.5). The MAES framework indicators relevant to urban air quality include ecosystem state indicators “Concentration of NO2, PM10, PM2.5, O3 (μg/m3),” “Number of annual occurrences of maximum daily 8 h mean of O3 >120 μg/m3,” “Number of annual occurrences of 24 h mean of PM10 >50 μg/m3,” and “Number of annual occurrences of hourly mean of NO2 >200 μg/m3.” Relevant CITYkeys indicators are “Fine particulate matter emissions (PM2.5)” and “Air quality index (NO2 emissions, GHG emissions).” Urban air quality is comprehensively addressed by “Challenge 5: Air Quality” indicators within the EKLIPSE framework, including: “Non-spatial indicators of gross quantities: annual amount of pollutants captured by vegetation,” “Non-spatial indicators of net quantities: net air quality improvement (pollutants produced—pollutants captured + GHG emissions from maintenance activities),” “Non-spatial indicators of shares: share of emissions (air pollutants) captured/sequestered by vegetation,” “Spatial indicators: pollutant fluxes per m2 per year,” and “Monetary values: value of air pollution reduction.” Levels of atmospheric PM2.5 are, however, not specifically mentioned as an indicator in the EKLIPSE framework. All three frameworks evaluated, MAES, EKLIPSE and CITYkeys, earn benchmarking scores of 10/10 for SDG11+ indicator 11.6.2.
Averaging the benchmarking scores against SDG11+ indicators 11.6.1 and 11.6.2 for MAES, EKLIPSE and CITYkeys frameworks yields overall benchmark scores for SDG11+ Target 11.6 of 5.0/10, 5.0/10, and 9.0/10, respectively.
SDG Target 11.7 Access to Safe and Inclusive Public Space
11.7.1 Average Share of the Built-Up Area of Cities That Is Open Space for Public Use for All
All three indicator frameworks examined, MAES, EKLIPSE, and CITYkeys, yield benchmarking scores of 9.0/10 against SDG11+ indicator 11.7.1. The MAES framework comprehensively addresses accessibility of public green space through both ecosystem state indicators (i.e., “Land use: proportion of urban green space (%)”) and indicators of cultural ecosystem services, such as “Accessibility to public parks, gardens and playgrounds” disaggregated by size of park, “Weighted recreation opportunities provided by urban green infrastructure,” “Nature based recreation opportunities,” and “Proximity of green infrastructure to green travel routes.” Indicators within the EKLIPSE framework “Challenge 7: Participatory Planning and Governance” address public green space distribution, accessibility and use via indicators “Distribution of public green space—total surface or per capita,” “Accessibility (measured as distance or time) of urban green spaces for population,” “The availability and distribution of different types of parks and/or ecosystem services with respect to specific individual or household socioeconomic profiles and landscape design,” and “Recreational (number of visitors, number of recreational activities) or cultural (number of cultural events, people involved, children in educational activities) value.” The CITYkeys framework indicators similarly address SDG11+ indicator 11.7.1 from the perspectives of total area, distribution and accessibility. Relevant CITYkeys indicators include “Public outdoor recreation space,” “Green space,” “Share of green and water spaces,” and “Access to public amenities.” The CITYkeys indicator “Public outdoor recreation space” is similar to the SDG 11.7.1 indicator although streets are excluded from calculations of public space, and additional supporting indicators are provided.
11.7.2 Proportion of Persons Victim of Physical or Sexual Harassment
Indicators from both the EKLIPSE and CITYkeys frameworks adequately address SDG11+ indicator 11.7.2, earning benchmarking score of 9.0/10 for both EKLIPSE and CITYkeys. The aggregated CITYkeys indicator “Crime rate” addresses annual crime similar to SDG11+ indicator 11.7.2. Whilst CITykeys does not specify disaggregation of data to different populations it is possible to do so. The EKLIPSE “Challenge 6: Urban Regeneration” indicator “Level of devices contributing to the safety of users in the neighborhood: lighting of common areas, access control, presence of technical, or specialized staff, etc.,” and “Challenge 8:Social Justice and Social Cohesion” indicator “Bodily integrity: being able to move freely from place to place; to be secure against violent assault, including indicators of crime by time of day” effectively address SDG11+ indicator 11.7.2. The MAES framework does not include any indicators involving safety of green and public places (score: 0/10).
Averaging the benchmarking scores against SDG11+ indicators 11.7.1 and 11.7.2 for MAES, EKLIPSE and CITYkeys frameworks yields overall benchmark scores for SDG11+ Target 11.7 of 4.5/10, 9.0/10, and 9.0/10, respectively.
SDG Target 11.a Urban-Rural Linkages
11.a.1 Proportion of Population Living in Cities That Implement Urban and Regional Development Plans Integrating Population Projections and Resource Needs
The following CITYkeys framework indicators partially address SDG11+ indicator 11.a.1: “Multilevel government,” “Citizen participation,” “Open public participation,” “Involvement of city administration,” “Design for a sense of place,” “Ground floor usage,” “Local community involvement in the planning phase,” “Participatory governance,” “Local community involvement in the implementation phase,” “Municipal involvement—financial support,” “Smart City Policy,” and “Materials, water, and land.” The aforementioned indicators enable consideration of how urban and regional development plans respond to population dynamics, ensures balanced regional and territorial development, and increases local fiscal space. Alignment between CITYkeys indicators and SDG11+ indicator 11.a.1 is imperfect, however, due to differences in approach. As a result benchmarking yields a score of 8.0/10 for the CITYkeys framework relative to indicator 11.a.1.
SDG11+ indicator 11.a.1 is marginally addressed by EKLIPSE framework “Challenge 6: Urban Regeneration” indicator “Enforce micro-scale and cross-scale interactions, consider urban hinterland and ‘distant landscapes,”’ and by EKLIPSE framework development planning indicators related to the development, implementation and assessment of NBS. All EKLIPSE indicators refer only to NBS/green space planning, however, and do not consider regional and territorial development or local fiscal space. Benchmarking of the EKLIPSE framework indicators against SDG11+ indicator 11.a.1 yields a score of 4.0/10. The MAES framework does not address, directly or indirectly, the evaluation of public policy for urban or regional development planning (score: 0/10).
SDG Target 11.b Mitigation and Adaptation Planning and Disaster Risk Reduction
11.b.1 Number of Countries That Adopt and Implement National Disaster Risk Reduction Strategies
The Sendai Disaster and Risk Reduction (DRR) Framework specifies the development and implementation of local DRR strategies and plans across different timescales, with specific targets, indicators and time frames, aimed at preventing the creation of risk, reducing existing risk and strengthening economic, social, health and environmental resilience. The implementation of DRR strategies is partially addressed by the MAES framework, but not in a manner aligned with Sendai framework process. Water resource sufficiency is addressed in the MAES framework by provisioning ecosystem services whilst flood risk reduction and climate regulation (mitigation of climate change) are addressed in MAES by regulating ecosystem services. Climate resilience strategy, the participation of vulnerable groups in policy development and decision-making, and increased efficiency of resource use are not addressed by MAES framework indicators. Benchmarked against SDG11+ indicator 11.b.1, the MAES framework scores 1.5/10.
The EKLIPSE framework indirectly addresses SDG11+ indicator 11.b.1. Resilience to disasters exclusively referred to in the context of NBS to foster urban adaptation to climate change (flooding/drought/heat islands), and human health issues are addressed through “Challenge 5: Air Quality” indicators. Indicators within the EKLIPSE framework support the strengthening of economic, social, health and environmental resilience, but as these indicators are not expressly aligned with the Sendai framework the EKLIPSE framework scores 2.0/10 against SDG11+ indicator 11.b.1. CITYkeys framework indicators, predominantly the indicator “Climate resilience strategy,” partially address SDG11+ indicator 11.b.1. Similar to the EKLIPSE framework, the CITYkeys framework approach is not aligned with the Sendai DRR Framework. Thus, the CITYkeys framework also earns a benchmarking score of 2.0/10 against SDG11+ indicator 11.b.1.
11.b.2 Proportion of Local Governments That Adopt and Implement Local Disaster Risk Reduction Strategies
The same indicators within the respective frameworks MAES, EKLIPSE and CITYkeys which address national-level DRR strategies per SDG11+ indicator 11.b.1 can also be applied to local DRR strategies. Both the EKLIPSE and CITYkeys indicator frameworks are targeted to city-level interventions, thus increasing benchmarking scores against SDG11+ indicator 11.b.2 relative to indicator 11.b.1–5.0/10 for each EKLIPSE and CITYkeys. The MAES indicators applicable to national-level DRR strategy development and implementation are equally applicable at a local level, yielding a benchmarking score of 1.5/10 against SDG11+ indicator 11.b.2 for the MAES framework.
Averaging the benchmarking scores against SDG11+ indicators 11.b.1 and 11.b.2 for MAES, EKLIPSE and CITYkeys frameworks yields overall benchmark scores for SDG11+ Target 11.b of 1.5/10, 3.5/10 and 3.5/10, respectively.
SDG Target 11.c Sustainable and Resilient Buildings
11.c.1 Proportion of Financial Support to the Least Developed Countries That Is Allocated to Sustainable Building
The MAES framework contains no indicators for official (financial) assistance or budgetary allocation for resource efficient building or utilization of local materials (score: 0/10). The EKLIPSE framework “Challenge 6: Urban Regeneration” addresses resource efficient building practices and use of reclaimed (local) materials at microscale (building scale), including the indicators “Energy efficiency: building materials/ construction methods based on points awarded according to energy efficiency checklist,” “Incorporation of environmental design: percentage of total building stock,” and “Reclamation of building materials: percentage reclaimed from existing buildings.” There are no EKLIPSE indicators for official (financial) assistance or budgetary allocation for resource efficient building or purchase of local materials using government funds, and no indicators regarding support for actions outside the municipality (i.e., financial support to other countries). Thus, SDG11+ indicator 11.c.1 is partially addressed by the EKLIPSE framework, earning a score of 2.0/10.
The SDG11+ indicator 11.c.1 is partially addressed by CITYkeys framework indicators “Municipal involvement—financial support,” “Smart city policy,” and “Increased efficiency of resource consumption.” The CITYkeys framework does not possess indicators that specifically refer to the use of local materials or to financial support for actions outside the municipality. Application of a combination of CITYkeys indicators is required to capture the intent of SDG11+ indicator 11.c.1, thus yielding a benchmarking score of 3.0/10.
SDG Target 1.4 Access to Basic Services and Secure Tenure Rights to Land
1.4.1 Proportion of Population Living in Households With Access to Basic Services
Access to basic services is largely addressed by the CITYkeys indicators “Water: Water consumption,” “Gray and rain water use,” “Water exploitation index,” “Water losses,” “Municipal solid waste,” “Access to public transport,” “Public transport use,” “Quality of public transport,” “Access to vehicle sharing solutions for city travel,” “Length of bike route network,” “Annual final energy consumption,” “Renewable energy generated within the city,” “CO2 emissions,” and “Maximum Hourly Deficit.” As three of the four sub-categories specified by this indicator are considered, the resultant benchmarking score for the CITYkeys framework against SDG11+ indicator 1.4.1 is 7.5/10.
Access to improved water and improved sanitation basic services are partially, indirectly addressed by several EKLIPSE framework indicators under “Challenge 2: Water Management.” Water and sanitation may be partially addressed by indicators of reduced hydraulic load to sewerage systems and reduced costs associated with wastewater treatment, e.g., via the installation of NBS for decentralized water management. EKLIPSE framework indicators of NBS performance such as reduced runoff volume and slowing of peak runoff discharge during rainfall events indirectly address septic system capacity issues highlighted in SDG11+ indicator 1.4.1. The EKLIPSE framework does not explicitly consider solid waste collection and management or access to energy. The availability of public transport is addressed by EKLIPSE framework indicators as previously detailed for SDG11+ indicator 11.2.1. Benchmarking of EKLIPSE framework indicators against SDG11+ indicator 1.4.1 yields a score of 3.75/10.
Access to drinking water is can be partially addressed using the MAES framework provisioning ecosystem service indicators “Drinking water provision (m3/ha/y)” and “Drinking water consumption (m3/y).” Similar to the EKLIPSE framework, the treatment of urban wastewater is indirectly addressed by the MAES framework by regulating ecosystem services indicators “Surface runoff (mm),” “Soil water storage capacity (mm),” “Soil water infiltration capacity (cm),” “Water retention capacity by vegetation and soil (t/km2),” and “Intercepted rainfall (m3/y).” Benchmarking of the MAES indicator framework against SDG11+ indicator 1.4.1 yields a score of 1.25/10.
1.4.2 Proportion of Total Adult Population With Real or Perceived Secure Tenure Rights to Land
None of the indicator frameworks examined herein address secure tenure rights to land. Benchmarking scores for MAES, EKLIPSE and CITYkeys indicator frameworks are all 0/10 for SDG11+ indicator 1.4.2.
Averaging the benchmarking scores for SDG11+ indicators 1.4.1 and 1.4.2 for MAES, EKLIPSE and CITYkeys frameworks yields overall benchmark scores for SDG11+ Target 1.4 of 0.6/10, 1.9/10 and 3.8/10, respectively.
SDG Target 6.3 Safe Treatment of Wastewater
6.3.1 Proportion of Wastewater Safely Treated
Indicator 6.3.1 can be partially, indirectly addressed by the MAES and EKLIPSE frameworks using indicators for reduction of surface run-off and/or slowing of run-off peak discharge as detailed for SDG11+ indicator 1.4.1 in section SDG Target 1.4 Access to Basic Services and Secure Tenure Rights to Land. Both the MAES and EKLIPSE indicator frameworks score 2.0/10 when benchmarked against SDG11+ indicator 6.3.1. Wastewater treatment is only marginally addressed by CITYkeys framework indicators “Gray and rain water use (% of houses)—percentage of houses equipped to reuse gray and rain water” and “Water loss (% of m3)—percentage of water loss of the total water consumption.” Gray and rainwater use refers to alternate on-site water management, whilst the proportion of water loss of total water consumption refers to the urban water conveyance network. Benchmarking of the CITYkeys indicator framework against SDG11+ indicator 6.3.1 yields a score of 1.0/10.
Normalization of individual indicator benchmark scores to SDG11+ targets yields mean composite benchmarking scores of 2.3/10 for the MAES framework, 4.2/10 for the EKLIPSE framework, and 5.2/10 for the CITYkeys framework, respectively (Table 2).
Discussion
NBS can provide a means for urban areas to effectively manage natural resources for optimal ecosystem services delivery in order to address the food-water-energy-climate nexus, thus improving cities' environmental sustainability and contributing to climate and water resilience. The systemic process of NBS co-design, co-implementation and co-maintenance with stakeholders further confers social, institutional, and economic resilience. A multitude of direct and co-benefits contribute to various aspects of urban sustainability and resilience to climate change impacts, with the ultimate benefit of NBS implementation being increased urban liveability and enhanced intergenerational equity. Appropriate, standardized assessment criteria are required to accurately quantify the direct and co-benefits of NBS in the short- and long-term and across varying spatial scales in order to maximize benefits.
Critical analysis of MAES, EKLIPSE, and CITYkeys, indicator frameworks potentially applicable to evaluation of NBS implementation to enhance urban sustainability and resilience to climate change, provides insight regarding how metrics within these respective frameworks may be integrated to assess NBS performance and impact whilst ensuring alignment with high-level objectives for sustainable development. The composite scores determined by benchmarking the MAES, EKLIPSE, and CITYkeys frameworks against SDG11+ “Sustainable cities and communities” targets, although useful, fail to illustrate synergies among the three respective assessment frameworks, nor do the composite scores describe the particular strengths of each assessment scheme. Visual representation of the relative coverage of SDG11+ targets provided by the MAES, EKLIPSE, and CITYkeys frameworks clearly shows where these assessment frameworks complement one another (Figure 1).
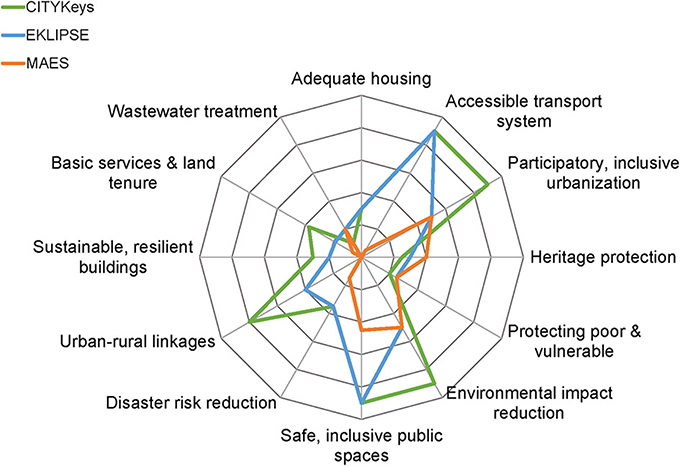
Figure 1. Visual representation of the degree to which the MAES (Maes et al., 2016), EKLIPSE (Raymond et al., 2017), and CITYkeys (Bosch et al., 2017) frameworks, respectively, address the key indicators of sustainable urban development as defined by UN-Habitat et al., 2016.
None of the assessment frameworks evaluated align well with SDG targets 1.1 “Housing and slum upgrading,” 11.5 “Disaster preparedness” and 6.3 “Safe treatment of wastewater” although the frameworks broadly address various aspects of housing, water treatment and resiliency. The apparent incoherence with some SDG targets is to some extent explained by the fact that CITYkeys, EKLIPSE and MAES are European assessment frameworks corresponding to European needs whilst the SDG targets and related indicators, although applicable globally, were formulated with significant consideration of developing countries' urgent needs.
Although many of the SDG11+ targets are supported by delivery of one or more ecosystem services, there is no explicit reference to ecosystem services within SDG11 for sustainable cities and communities. A recent investigation indicated that 16 selected provisioning, regulating, supporting and cultural ecosystem services contribute to 44 of the 169 SDG targets (Wood et al., 2018). The study showed that one or more ecosystem services contribute strongly to SDG targets 6.3, 11.5, 11.6, 11.7, and 11.a, and 14 of the selected ecosystem services contribute weakly to SDG 11.c. Ecological diversity is critical to enable ecosystem recovery and renewal following major perturbation. This is broadly recognized by innumerable municipal-level strategies to promote biological diversity; however, the complexity of social-ecological interactions presents a challenge to the systemic integration of ecosystem services-based targets in urban planning and policy. Increasing implementation of blue-green infrastructure and NBS in urban areas highlights both the potential for delivery of key ecosystem services by NBS and blue-green infrastructure, as well as the need for the integration of standardized targets and methodologies to map and evaluate ecosystem services delivered within the SDGs. The analysis herein shows that MAES framework indicators relevant to SDG11+ targets are largely encompassed within the EKLIPSE framework (Figure 1), with the exception of SDG11+ target 11.4 “World's cultural and natural heritage protection.” On-going testing of the MAES indicator framework presented by Maes et al. (2016) can be expected to yield further definition of ecosystem services indicator metrics and methodologies.
The performance and impact indicators identified in the EKLIPSE framework are wide-ranging and address key environmental, social, governance/institutional and economic challenges faced by cities. The EKLIPSE indicator framework is underlain by robust scientific knowledge as evidenced by detailed references to numerous peer-reviewed methodologies of data collection and analysis; however, the framework is indicative only and non-exhaustive, thus it is possible for users to independently define novel indicators aligned with one or more of the EKLIPSE challenge areas. The flexibility of the EKLIPSE framework is advantageous in that users with expert knowledge of NBS impact evaluation can develop customized metrics for particular projects. The inherent flexibility of the framework also provides ample opportunity for further refinement and standardization of NBS indicators. A potential disadvantage is that the non-definitive nature of the EKLIPSE framework indicators may present a barrier to widespread use of the framework by non-expert users in its present form. The exclusive focus on NBS assessment substantially affects alignment between EKLIPSE framework indicators and those of the SDG11+ targets; however, benchmarking analysis clearly shows that NBS implementation in urban areas is consistent with sustainable urban development and strongly aligned with SDG11+ targets 11.2 “Accessible transport system for all,” and 11.7 “Access to safe and inclusive public space” (Figure 1).
Similar to the EKLIPSE framework, the CITYkeys framework addresses several SDG11+ targets and indicators, particularly SDGs 11.2 “Accessible transport system for all,” 11.3 “Participatory and inclusive urbanization,” 11.6 “Urban environmental impact,” 11.7 “Access to safe and inclusive public space,” and 11.a.1 “Urban-rural linkages” (Figure 1). These results suggest that the CITYkeys framework provides a holistic assessment methodology for SDG11+ targets dealing with urban environmental impacts, safe and inclusive public space, accessibility of transport services, participatory approaches and governance. A particular strength of the CITYkeys indicators for smart city projects and smart cities is the comprehensive assessment methodology with standardized methods of data acquisition and calculation of metrics (ETSI, 2017a). In addition, the availability of required data and feasibility of CITYkeys indicator use have been reviewed in cities across Europe (Huovila et al., 2017). The CITYkeys indicator framework has been validated by pilot testing in more than 20 cities, by project consortia, industrial stakeholders and research networks. Availability of the 116 necessary quantitative city datasets averaged 72% in a comprehensive analysis of five European cities, facilitating calculation of 82% of the 76 city indicators in some test cities. Application of all 101 of the project indicators and qualitative city indicators is feasible as they are based on easily applicable Likert scale assessment (Huovila et al., 2017).
Urban sustainability frameworks like the SDGs allow city planners, managers and policy-makers to evaluate the impacts of strategies and initiatives, and facilitate identification of issues that require further action. There is growing recognition that urban areas need to be resilient as well as sustainable. Resilience planning for complex, adaptive systems such as cities necessitates understanding the key components and processes, and interactions among components, in an urban ecosystem. A growing body of research indicates that NBS have substantial potential to increase cities' resilience to the impacts of climate change (e.g., Santiago Fink, 2016; Kabisch et al., 2017; Faivre et al., in press). Further quantitative benchmarking of the MAES, EKLIPSE and CITYkeys frameworks against recommended indicators for evaluating the effectiveness of NBS for climate change adaptation and mitigation, and associated co-benefits (Kabisch et al., 2016) shows that the selected indicator frameworks complement one another within the four primary domains of NBS effectiveness (Figure 2). Compared with framework benchmarking against SDG11+, the MAES, EKLIPSE and CITYkeys indicator frameworks benchmark relatively more favorably against indicators recommended by Kabisch et al. (2016) for evaluating NBS effectiveness (Table 3).
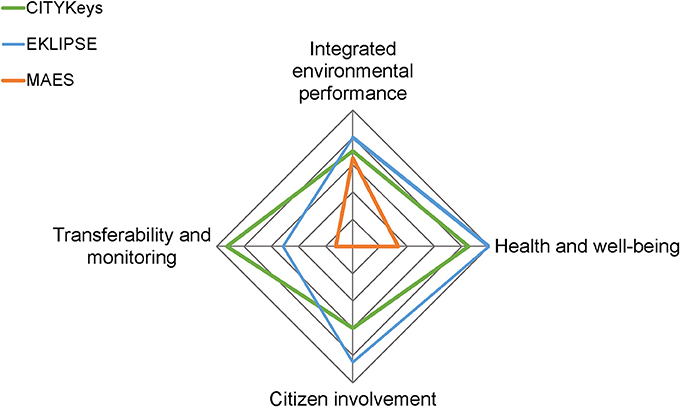
Figure 2. Conceptual mapping of the MAES (Maes et al., 2016), EKLIPSE (Raymond et al., 2017), and CITYkeys (Bosch et al., 2017) frameworks, respectively, against recommended indicators per Kabisch et al. (2016) for evaluating the effectiveness of NBS for climate change adaptation and mitigation, and associated co-benefits.
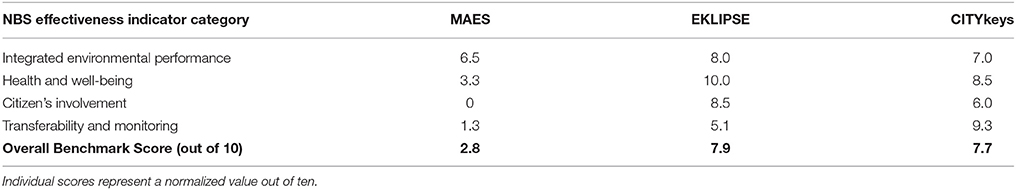
Table 3. Summary of MAES, EKLIPSE, and CITYkeys assessment framework quantitative benchmarking against recommended indicators for evaluating the effectiveness of NBS for climate change adaptation and mitigation, and associated co-benefits (Kabisch et al., 2016).
The EKLIPSE framework, which was developed specifically to evaluate the impact of NBS and references Kabisch et al. (2016) in its development, demonstrates good alignment across the four primary domains of NBS evaluation. The CITYkeys framework, however, is particularly well-suited for evaluation of NBS transferability and monitoring, suggesting that a combination of EKLIPSE and CITYkeys indicators may provide coverage of aspects critical to NBS performance and long-term impact. The focus on processes rather than products by the EKLIPSE and CITYkeys assessment frameworks supports urban resilience planning where the ideal future state is unknown due to continuous change. Likewise, the strong focus on the human component of the urban ecosystem by both the EKLIPSE and CITYkeys frameworks provides critical information regarding social considerations. Although not specifically developed to measure NBS performance, the extended triple-bottom-line People-Planet-Prosperity-Governance-Propagation structure of the CITYkeys indicator framework addresses major societal challenges associated with urban densification and the European Union's 20/20/20 energy and climate targets. Indicators within both the EKLIPSE and CITYkeys frameworks are primarily impact-oriented and aim to evaluate the long-term sustainability impacts of implemented solutions (e.g., reduction of GHG emissions). An important strength of the EKLIPSE and CITYkeys assessment frameworks are the output indicators (e.g., number of open data sets, number of new jobs created) which support evaluation of progress in the short term. The combination of indicators across different timeframes and geographic scale are important for decision-making.
Each of the assessment frameworks analyzed herein, MAES, EKLIPSE, and CITYkeys, possesses unique strengths that can be leveraged to further inform indicators of sustainable urban development and associated methodologies and standards. Ecosystem-services related indicators from MAES, EKLIPSE, and/or CITYkeys frameworks can be adopted to strengthen alignment between the delivery of urban ecosystem services and urban planning and governance. Our critical analysis of the EKLIPSE and CITYkeys indicator frameworks clearly demonstrates their capacity for evaluating the role of citizen's involvement in NBS and Smart City actions to build sustainable, resilient urban societies. It has been suggested that people play the most critical role in urban ecosystems by shaping the creation, governance and maintenance of all other system components (Desouza and Flanery, 2013). Concomitantly, European Union sustainability indicator frameworks have variously been criticized for a perceived lack of attention to social and governance aspects of sustainability (Adelle and Pallemaerts, 2009), or social and economic factors (Lynch et al., 2011). The analysis herein demonstrates that the CITYkeys indicator framework in particular is strongly aligned with social and governance considerations of urban sustainability.
Cities face multiple challenges amidst a complex hierarchy of legislative, regulatory and other stakeholder obligations. Strategic selection of an NBS assessment scheme which closely aligns with one or more targets within SDG11+ “Sustainable cities and communities” can maximize operational efficiency by exploiting synergies between evaluation schemes. Based on the present critical evaluation of assessment frameworks potentially applicable to NBS relative to SDG11+, a combination of metrics from the EKLIPSE and CITYkeys frameworks will best address the four primary NBS benefit/co-benefit domains (Figure 2). Selected indicators for evaluation of ecosystem state and/or services should be consistent with metrics defined in the MAES framework to ensure standardization among assessment frameworks focused on different aspects of the urban ecosystem. The results of our benchmarking analysis yield the following recommendations to optimize the effectiveness of assessment frameworks intended for the evaluation of initiatives to enhance both urban sustainability and resilience to the impacts of climate change:
• Integration of an ecosystem services approach to resource management, and associated ecosystem services-based evaluation metrics, to ensure intergenerational equity in the supply and distribution of natural resources.
• Extension of the traditional People-Planet-Prosperity pillars of sustainability model to include Governance and Propagation aspects.
• Strategic inclusion of NBS-relevant indicators that explicitly quantify benefits and co-benefits of NBS implementation in order to further support urban re-naturing as a means to improve cities' sustainability and climate and water resilience.
• Inclusion of indicator metadata detailing standardized, scientifically-validated methods of data acquisition and calculation of metrics in order to facilitate widespread use.
• Concomitant development of short-term, project-level (outcome based) and longer-term, city- or region-level (impact based) indicators to better support decision-making.
• Derivation of relevant evaluation indicators across multiple spatial scales, or metrics that are readily scalable, to facilitate micro- to regional-scale performance and impact assessment.
Author Contributions
LW and AH performed quantitative benchmarking analyses and co-wrote the manuscript with assistance, review and help with quantitative benchmarking analyses from MzC-R and MH. MzC-R created figures. MA provided advice, editorial review, and assisted with quantitative benchmarking analyses.
Conflict of Interest Statement
The authors declare that the research was conducted in the absence of any commercial or financial relationships that could be construed as a potential conflict of interest.
Acknowledgments
The authors thank Sami Kazi and Satu Paiho (VTT Technical Research Centre of Finland, Ltd.) for insightful discussions and insights on the ideas presented herein. This work was partially supported using funding from the European Union's Horizon 2020 research and innovation programme under Grant Agreement No. 730052, under topic SCC-022016-2017 Smart Cities and Communities Nature based solutions.
Supplementary Material
The Supplementary Material for this article can be found online at: https://www.frontiersin.org/articles/10.3389/fenvs.2018.00069/full#supplementary-material
References
Adelle, C., and Pallemaerts, M. (2009). Sustainable Development Indicators. Overview of relevant FP-Funded Research and Identification of Further Needs. Brussels: European Commission Directorate-General for Research.
Alberti, M., Marzluff, J. M., Schulenberger, E., Bradley, G., Ryan, C., and Zumbrennen, C. (2003). Integrating humans into ecology: opportunities and challenges for studying urban ecosystems. Bioscience 53, 1169–1179. doi: 10.1641/0006-3568(2003)053[1169:IHIEOA]2.0.CO;2
Beatley, T., and Newman, P. (2013). Biophilic cities are sustainable, resilient cities. Sustain. Basel 5, 3328–3345. doi: 10.3390/su5083328
Bosch, P., Jongeneel, S., Rovers, V., Neumann, H.-M., Airaksinen, M., and Huovila, A. (2017). CITYkeys Indicators for Smart City Projects and Smart Cities. [CITYkeys project D1.4] Available online at: http://nws.eurocities.eu/MediaShell/media/CITYkeysD14Indicatorsforsmartcityprojectsandsmartcities.pdf
Campbell, S. (1996). Green cities, growing cities, just cities? Urban planning and the contradictions of sustainable development. J. Am. Plann. Assoc. 62, 296–312. doi: 10.1080/01944369608975696
de Groot, R. (2006). Function-analysis and valuation as a tool to assess land use conflicts in planning for sustainable, multi-functional landscapes. Landscape Urban Plan. 75, 175–186. doi: 10.1016/j.landurbplan.2005.02.016
de Groot, R. S., Alkemade, R., Braat, L., Hein, L., and Willemen, L. (2010). Challenges in integrating the concept of ecosystem services and values in landscape planning, management and decision making. Ecol. Complex 7, 260–272. doi: 10.1016/j.ecocom.2009.10.006
Desouza, K. C., and Flanery, T. H. (2013). Designing, planning and managing resilient cities: a conceptual framework. Cities 35, 89–99. doi: 10.1016/j.cities.2013.06.003
EC (2016). Horizon 2020 Work Programme 2016–2017. 12. Climate Action, Environment, Resource Efficiency and Raw Materials. European Commission Decision C (2016)4614 of 25 July 2016. Available online at: http://ec.europa.eu/research/participants/data/ref/h2020/wp/2016_2017/main/h2020-wp1617-climate_en.pdf
EEA (2015). European Environment – State and Outlook 2015: Assessment of Global Megatrends. Copenhagen: European Environment Agency.
ETSI (2017a). ETSI TS 103 463 Key Performance Indicators for Sustainable Digital Multiservice Cities, Technical Specification of Access, Terminals, Transmission and Multiplexing (ATTM) Group in Better Living with ICT Cluster of ETSI, V1.1.1 (2017-07). Available online at: http://www.etsi.org/deliver/etsi_ts/103400_103499/103463/01.01.01_60/ts_103463v010101p.pdf
ETSI (2017b). ETSI GS OEU 019 KPIs for Smart Cities, Group specification of Operational energy Efficiency for Users (OEU) Group in Better Living with ICT Cluster of ETSI, V1.1.1 (2017-08). Available online at: http://www.etsi.org/deliver/etsi_gs/OEU/001_099/019/01.01.01_60/gs_OEU019v010101p.pdf
Faivre, N., Sgobbi, A., Happaerts, S., Raynal, J., and Schmidt, L. (in press). Translating the Sendai Framework into action: the EU approach to ecosystem-based disaster risk reduction. Int. J. Disast. Risk Res. doi: 10.1016/j.ijdrr.2017.12.015
Folke, C. (2016). “Resilience,” in Oxford Research Encyclopedia, Environmental Science (Oxford: Oxford University Press), 63.
Geddes, P. (1915). Cities in Evolution: An Introduction to the Town Planning Movement and to the Study of Civics. London: Williams & Norgate.
Haase, D., Kabisch, S., Haase, A., Andersson, E., Banzhaf, E., Baró, F., et al. (2017). Greening cities - To be socially inclusive? About the alleged paradox of society and ecology in cities. Habitat Int. 64, 41–48. doi: 10.1016/j.habitatint.2017.04.005
Hartig, T., Mitchell, R., de Vries, S., and Frumkin, H. (2014). Nature and health. Annu. Rev. Publ. Health 35, 207–228. doi: 10.1146/annurev-publhealth-032013-182443
Huovila, A., Airaksinen, M., Pinto-Seppä, I., Piira, K., Bosch, P., Penttinen, T., et al. (2017). CITYkeys smart city performance measurement system. Int. J. Hous. Sci. 41, 113–125.
Jackson, L. E. (2003). The relationship of urban design to human health and condition. Landscape Urban Plan. 64, 191–200. doi: 10.1016/S0169-2046(02)00230-X
Juntti, M., and Lundy, L. (2017). A mixed methods approach to urban ecosystem services: experienced environmental quality and its role in ecosystem assessment within an inner-city estate. Landscape Urban Plan. 161, 10–21. doi: 10.1016/j.landurbplan.2017.01.002
Kabisch, N., Frantzeskaki, N., Pauleit, S., Naumann, S., Davis, M., Artmann, M., et al. (2016). Nature-based solutions to climate change mitigation and adaptation in urban areas: perspectives on indicators, knowledge gaps, barriers, and opportunities for action. Ecol. Soc. 21:39. doi: 10.5751/ES-08373-210239
Kabisch, N., Korn, H., Stadler, J., and Bonn, A. (2017). Nature-Based Solutions to Climate Change Adaptation in Urban Areas. Theory and Practice of Urban Sustainability Transitions. Cham: Springer.
Keniger, L. W., Gaston, K. J., Irvine, K. N., and Fuller, R. A. (2013). What are the benefits of interacting with nature? Int. J. Env. Res. Pub. Health 10, 913–935. doi: 10.3390/ijerph10030913
Lynch, A. J., Andreason, S., Eisenman, T., Robinson, J., Steif, K., and Birch, E. L. (2011). Sustainable Urban Development Indicators for the United States. Report to the Office of International and Philanthropic Innovation, Office of Policy Development and Research, U.S. Department of Housing and Urban Development. Philadelphia: Penn Institute for Urban Research.
Maes, J., Egoh, B., Willemen, L., Liquete, C., Vihervaara, P., Schägner, J. P., et al. (2012). Mapping ecosystem services for policy support and decision making in the European Union. Ecosyst. Serv. 1, 31–39. doi: 10.1016/j.ecoser.2012.06.004
Maes, J., Zulian, G., Thijssen, M., Castell, C., Baró, F., Ferreira, A. M., et al. (2016). Mapping and Assessment of Ecosystems and their Services. Urban Ecosystems. Luxembourg: Publications Office of the European Union.
Raymond, C. M., Berry, P., Breil, M., Nita, M. R., Kabisch, N., de Bel, M., et al. (2017). An Impact Evaluation Framework to Support Planning and Evaluation of Nature-based Solutions Projects. Report prepared by the EKLIPSE Expert Working Group on Nature-based Solutions to Promote Climate Resilience in Urban Areas. Wallingford: Centre for Ecology and Hydrology.
Rockström, J., Steffen, W., Noone, K., Persson, Å., Chapin, F. S. III., Lambin, E., et al. (2009). Planetary boundaries: exploring the safe operating space for humanity. Ecol. Soc. 14:32. doi: 10.5751/ES-03180-140232
Rode, P., and Burdett, R. (2011). “Cities: investing in energy and resource efficiency,” in Towards a Green Economy: Pathways to Sustainable Development and Poverty Eradication, corp. ed United Nations Environment Programme (Nairobi: UNEP), 453–492.
Santiago Fink, H. (2016). Human-nature for climate action: Nature-based solutions for urban sustainability. Sustain. Basel 8:54. doi: 10.3390/su8030254
SCOPE (2007). Sustainability Indicators: A Scientific Assessment, ed. T. Hák, B. Moldan, and A. L. Dahl. Washington, DC: Island Press.
SDSN (2016). Getting started with the SDGs in cities, a guide for stakeholders. New York, NY: Sustainable Development Solutions Network. Available online at: http://unsdsn.org/wp-content/uploads/2016/07/9.1.8.-Cities-SDG-Guide.pdf
Steffen, W., Richardson, K., Rockström, J., Cornell, S. E., Fetzer, I., Bennett, E. M., et al. (2015). Planetary boundaries: guiding human development on a changing planet. Science 347:1259855. doi: 10.1126/science.1259855
Sugiyama, T., Leslie, E., Giles-Corti, B., and Owen, N. (2008). Associations of neighbourhood greenness with physical and mental health: do walking, social coherence and local social interaction explain the relationships? J. Epidemiol. Commun. H. 62:e9. doi: 10.1136/jech.2007.064287
Tzoulas, K., Korpela, K., Venn, S., Yli-Pelkonen, V., Kázmierczak, A., Niemela, J., et al. (2007). Promoting ecosystem and human health in urban areas using Green Infrastructure: a literature review. Landscape Urban Plan. 81, 167–178. doi: 10.1016/j.landurbplan.2007.02.001
UN-Habitat, UNESCO, World Health Organisation, UNISDR, UN Women, UNEP. (2016). SDG Goal 11 Monitoring Framework. Available online at: http://unhabitat.org/sdg-goal-11-monitoring-framework/ (Accessed 11 October 2017).
United Nations, Department of Economic and Social Affairs, Population Division. (2015a). World Urbanization Prospects: The 2014 Revision. ST/ESA/SER.A/366. New York, NY: United Nations.
United Nations, Department of Economic and Social Affairs, Population Division. (2015b). World Population Prospects: The 2015 Revision, Key Findings and Advance Tables. Working Paper No. ESA/P/WP.241. New York, NY: United Nations.
United Nations General Assembly (2015). Transforming Our World: The 2030 Agenda for Sustainable Development. A/RES/70/1. Available online at: http://www.unfpa.org/sites/default/files/resource-pdf/Resolution_A_RES_70_1_EN.pdf (Accessed 21 October 2015).
United Nations General Assembly (2017). Resolution Adopted by the General Assembly on 6 July 2017. 71/313 Work of the Statistical Commission pertaining to the 2030 Agenda for Sustainable Development. A/RES/71/313. Available online at: https://undocs.org/A/RES/71/313 (Accessed 10 July 2017).
Keywords: sustainable development, sustainable urbanization, nature-based solution, climate change adaptation, urban resilience, green infrastructure, performance indicator, impact indicator
Citation: Wendling LA, Huovila A, zu Castell-Rüdenhausen M, Hukkalainen M and Airaksinen M (2018) Benchmarking Nature-Based Solution and Smart City Assessment Schemes Against the Sustainable Development Goal Indicator Framework. Front. Environ. Sci. 6:69. doi: 10.3389/fenvs.2018.00069
Received: 26 January 2018; Accepted: 13 June 2018;
Published: 04 July 2018.
Edited by:
Dionysia Kolokotsa, Technical University of Crete, GreeceReviewed by:
Alex Oriel Godoy, Universidad del Desarrollo, ChileMustafa M. Aral, Georgia Institute of Technology, United States
Copyright © 2018 Wendling, Huovila, zu Castell-Rüdenhausen, Hukkalainen and Airaksinen. This is an open-access article distributed under the terms of the Creative Commons Attribution License (CC BY). The use, distribution or reproduction in other forums is permitted, provided the original author(s) and the copyright owner(s) are credited and that the original publication in this journal is cited, in accordance with accepted academic practice. No use, distribution or reproduction is permitted which does not comply with these terms.
*Correspondence: Laura A. Wendling, laura.wendling@vtt.fi