Beauty or Blight? Abundant Vegetation in the Presence of Disinvestment Across Residential Parcels and Neighborhoods in Toledo, OH
 Adam Berland
 Dexter H. Locke
 Dustin L. Herrmann
 Kirsten Schwarz
- 1Department of Geography, Ball State University, Muncie, IN, United States
- 2Baltimore Field Station, Northern Research Station, United States Department of Agriculture (USDA) Forest Service, Baltimore, MD, United States
- 3Department of Botany and Plant Sciences, University of California, Riverside, Riverside, CA, United States
- 4Departments of Urban Planning and Environmental Health Sciences, University of California, Los Angeles, Los Angeles, CA, United States
Urban vegetation can generate social and ecological benefits, so vegetation abundance is commonly treated as a proxy for greater benefits. A repeated finding in environmental justice research related to urban vegetation is that commonly marginalized populations live in neighborhoods with less vegetation. However, urban vegetation can function as amenity or disamenity depending on the context and the characteristics of the vegetation. In areas of disinvestment, overgrown vegetation may indicate neglect and lead to negative social outcomes. For example, previous research in the shrinking city of Toledo, Ohio, showed that areas with concentrated residential vacancy and high representation of traditionally marginalized populations also had relatively high vegetation abundance. This can be largely attributed to spontaneous, weedy vegetation in areas of concentrated vacancy. Equal vegetation cover therefore should not necessarily be equated with environmentally just outcomes. Here, we used several high-resolution data sets to study the relationships among vegetation abundance, vegetation quality, and property parcel occupancy on residential land in Toledo. Our results demonstrate that vacant residential land had more abundant vegetation than comparable occupied parcels according to two common metrics (tree canopy cover and the normalized difference vegetation index). Compared to occupied parcels, vacant parcels also had higher rates of blight associated with overgrown vegetation, as recorded during a citywide ground-based survey of property conditions. There were more vacant parcels overall in areas of disinvestment, and on a per-parcel basis, vacant parcels in these high-vacancy areas were also greener relative to nearby occupied parcels than vacant parcels in low-vacancy areas. This indicates that vacant parcels play a disproportionately large role in greening on residential land in areas of disinvestment. These results reinforce the idea that simply quantifying vegetation abundance may be insufficient for understanding urban social-ecological outcomes. Incorporating parcel occupancy data along with multiple strands of information about vegetation type and condition provides context to understand where abundant vegetation functions as amenity vs. disamenity. These perspectives are especially relevant in shrinking cities like Toledo where legacies of urban socioeconomic change have produced widespread areas of disinvestment and land abandonment.
Introduction
Despite dramatic urbanization globally, hundreds of cities around the world have experienced multi-decadal decline (Hollander et al., 2009; Martinez-Fernandez et al., 2016). These shrinking cities (also termed legacy cities) have undergone sustained population loss and economic retraction driven by the decline of industry, suburbanization, and white flight, among other factors (Martinez-Fernandez et al., 2016). Shrinking cities are characterized by areas of concentrated vacancy and disinvestment, and these patterns can be reinforced through a weakening tax base, the legacy of racial segregation, and persistent poverty (Xie et al., 2018).
Toledo, OH is a shrinking city in the North American “Rust Belt.” Toledo experienced substantial population growth through the middle of the 20th century as a prominent manufacturing center, but the city has seen a decline in population from over 383,000 in 1970 to <279,000 today (US Census Bureau, 2020). As the population in Toledo has declined, vacancy rates have increased. This has left a patchwork of vacant lots across the landscape, embedded among parcels with unoccupied and occupied residences, businesses, and industrial sites. While areas of disinvestment may be particularly prominent in shrinking cities, not all neighborhoods within a shrinking city experience decline (Tighe and Ganning, 2015). Like many U.S. shrinking cities, some of Toledo's neighborhoods have experienced concentrated vacancy while others have minimal vacancy at levels indicative of a healthy real estate market (Mallach, 2018).
The heterogeneity in vacancy across Toledo intersects with the uneven distribution of amenities and hazards long documented by environmental justice researchers (Bullard, 1994; Schlosberg, 2009; Taylor, 2014; Agyeman et al., 2016), but see Baró et al. (2019) for a recent exception that did not find uneven distributions. One important point of intersection between vacancy and environmental justice is urban vegetation, often considered an environmental good or amenity due to the associated ecosystem services (e.g., shade, stormwater interception, human health benefits, biodiversity conservation) provided by trees and other vegetation (Seamans, 2013; Dobbs et al., 2014; Willis and Petrokofsky, 2017; Ibáñez-Álamo et al., 2019). However, context often dictates whether urban vegetation and its attendant social-ecological functions act as amenity or disamenity (Heynen et al., 2006; Hoalst-Pullen et al., 2011; Pearsall and Christman, 2012; Herrmann et al., 2016; Roman et al., 2018). For example, abundant spontaneous vegetation in a vacant lot may perform beneficial ecosystem services such as stormwater interception, but it is unlikely to provide social benefits for neighborhood residents (Riley et al., 2018). Conversely, carefully manicured vegetation may be socially desirable even though it does not maximize ecological benefits (Gobster et al., 2020).
Recognizing the importance of context highlights two shortcomings of existing research in which authors have used the unequal distribution of vegetation within urban areas to illustrate potential cases of environmental injustice (e.g., Heynen et al., 2006; Landry and Chakraborty, 2009; Danford et al., 2014), and particularly where a proposed remedy is to increase the amount of vegetation in underserved areas. First, greening as a solution to unequal vegetation distributions is often accompanied by concerns from residents about gentrification and displacement (Wolch et al., 2014; Anguelovski, 2016), the lack of genuine inclusion in deciding how greening efforts will proceed (Carmichael and McDonough, 2018), or burdens imposed by the need to maintain newly planted vegetation (Heynen et al., 2006; Pincetl, 2010). Note that we use the term greening to describe a general increase in vegetation, regardless of intent. This is in line with previous studies that have used the abundance of vegetation to study (in)equitable distributions of urban vegetation (e.g., Landry and Chakraborty, 2009; Pham et al., 2012), but it differs from studies that use greening to refer specifically to strategies intended to restore beauty and reduce blight (e.g., Krusky et al., 2015; Gobster et al., 2020). We characterize blight as recognizable elements of physical disorder such as unmowed lawns, untrimmed trees and hedges, and abundant weeds. Second, the distribution of vegetation is typically assessed quantitatively but not qualitatively, because qualitative data are not readily available. This is a shortcoming because the abundance of vegetation says little about its quality (Leslie et al., 2010; Hoalst-Pullen et al., 2011; Schwarz et al., 2018). We do not know then whether residents perceive the vegetation as amenity or disamenity. However, qualitative and quantitative indicators of vegetation desirability and evidence of stewardship or maintenance present opportunities to address this shortcoming (Nassauer, 2011; Camacho-Cervantes et al., 2014; Gobster et al., 2020).
Greening and the desirability of urban vegetation must be further situated in its changing contexts. In the case of shrinking cities, indicators of urban greenness gradually respond to population loss and land abandonment (Hoalst-Pullen et al., 2011). Previous work in Toledo showed that the relationship between residential vacancy and the normalized difference vegetation index (NDVI), an indicator of greenness, changed over the several decades following the onset of population loss (Schwarz et al., 2018). In 1980, NDVI was lower in census tracts with higher percentages of residential vacancy, but by 2014 there was not a statistically significant relationship between NDVI and vacancy rates. This was attributed to increasing vegetation in tracts with higher vacancy rates, plausibly driven in large part by spontaneous vegetation on vacant parcels that was not likely to be considered amenity vegetation by the community (Schwarz et al., 2018). This suggests that vacancy and vegetation quantity and quality intersect in important ways, potentially altering the balance between whether urban vegetation is considered beauty or blight.
The intersection of these vacancy and vegetation templates is crucial to understand and support sustainable and equitable city futures (Herrmann et al., 2016; Riley et al., 2018). Disinvestment in legacy cities is uneven, realized through the heterogeneous distribution of both vacancy and amenities/hazards. Failing to understand the intersection among amenities/hazards and vacancy in shrinking cities will likely perpetuate an uneven recovery as well. One important aspect of this intersection that remains understudied is the role of heterogeneous vacancy in driving urban vegetation patterns. It is important to understand how different types of vegetation (i.e., understory vs. canopy) influence observed patterns in shrinking cities, how perception of vegetation quality relates to vegetation quantity, or how these patterns emerge at multiple relevant spatial scales.
Here, we use both parcel- and neighborhood-level data to explore patterns in urban vegetation (NDVI, tree canopy cover, and a qualitative indication of overgrown lawn) in relation to residential vacancy within the city of Toledo. Parcel- and neighborhood-level data are complementary in interpreting urban vegetation outcomes. Parcels importantly have specific identities as vacant or occupied, and represent the scale at which most urban vegetation management decisions are made. Neighborhood-level data integrate many parcels to capture emergent patterns, and neighborhoods provide the immediate context that can influence parcel management decisions. Using these complementary data levels, we address the following research questions:
1) What are the neighborhood-scale relationships among vacancy and the following greenness indicators: tree canopy, NDVI, and the prevalence of overgrown lawns? We hypothesize that tree canopy and NDVI will be higher in both low- and high-vacancy areas, and lowest in areas with intermediate levels of vacancy. This could be explained by an abundance of amenity vegetation in low-vacancy areas. In high-vacancy areas, this would reflect the emergence of spontaneous vegetation on vacant parcels, and we expect this to be reinforced by a higher prevalence of overgrown lawns in high-vacancy areas.
2a) Are vacant residential parcels greener than comparable occupied parcels? If we control for confounding factors by pairing parcels that are similarly sized and in close proximity to one another, we expect that vacant parcels will generally have higher tree canopy cover, higher NDVI values, and higher prevalence of overgrown lawns than occupied parcels. This will reflect the emergence of spontaneous vegetation on vacant parcels. Additionally, the relative greenness of vacant lots with no structures will be amplified, because these parcels do not have residential structures and thus have more space for vegetation to grow.
2b) If vacant parcels are greener than comparable occupied parcels, does the magnitude of this difference vary across geographic space? By definition, we know there will be more vacant parcels overall in high-vacancy areas. But it is also possible that the difference in greenness between vacant and occupied parcels is greater in high-vacancy areas compared to low-vacancy areas, indicating that vacant parcels in high-vacancy areas make a disproportionately large contribution to neighborhood greening on a per-parcel basis. In high-vacancy areas, this could potentially be explained by lower social pressure or capacity to actively maintain vegetation on vacant parcels, coupled with the relative paucity of amenity vegetation on occupied parcels. In low-vacancy areas, we expect occupied parcels to be greener on account of more abundant amenity vegetation, and stricter social norms may encourage proactive maintenance of vegetation on vacant parcels. Therefore, we expect the difference in greenness between vacant and occupied parcels in low-vacancy areas to be weaker (or negative), signaling that vacant parcels make a proportionally smaller contribution to neighborhood greening on a per-parcel basis in low-vacancy areas.
Materials and Methods
Study Area
Toledo (41.65° N, 83.54° W) is situated in Lucas County, Ohio, where the Maumee River flows into Lake Erie. Toledo is located in the humid continental climate zone where vegetation can grow without water subsidy. Toledo and Lucas County have a history of park and green space investment through the City of Toledo Division of Parks, Recreation and Forestry, and through Metroparks (Rozick, 2010), a regional program that has several large holdings with high quality conservation and recreation assets on more than 12,000 acres. Historically, there has been less investment in parks concentrated in downtown Toledo. In 2017, parks and green space only accounted for 2% or 32 acres of downtown Toledo (Downtown Toledo Master Plan., 2017). Shifting the distribution of open space has been a focus of urban planning, with the Downtown Toledo Master Plan highlighting the need for a network of parks to better connect people to the historic focus of the city, the Maumee River. The first urban Metropark, Middlegrounds, opened in 2016 and is part of a planning vision to transform Toledo's waterfront and connect East and West Toledo (Downtown Toledo Master Plan., 2017).
Following a prosperous era as a glass manufacturing center, Toledo experienced substantial economic contraction in the second half of the 20th century associated with deindustrialization (Floyd, 2015). Like other shrinking cities in the North American “Rust Belt,” the loss of manufacturing jobs, suburban development, and social factors in Toledo led to a sustained population decline from 383,818 in 1970 to 282,275 in 2015 (US Census Bureau, 2020). The population loss and economic decline was not experienced evenly throughout Toledo, as some neighborhoods were hit harder than others. Disinvestment was evident in redlined neighborhoods where financial institutions withheld mortgage lending, and where government-sponsored urban renewal projects disrupted communities by constructing highways through predominantly African American neighborhoods (Abdelazim et al., 2016).
In 2015, the poverty rate in Toledo was 27.8%, which was nearly double the poverty rates in the state of Ohio (15.8%) and the US as a whole (15.5%) (US Census Bureau, 2020). The 2015 citywide residential vacancy rate in Toledo was 15.1%, which Mallach (2018) classifies as high vacancy. Many areas of the city had higher vacancy rates (>20%) that can be characterized as hypervacancy; in these areas, abandoned properties are likely to remain vacant due to poor market conditions (Mallach, 2018). Collectively, vacant parcels are conservatively estimated to cost Toledo $9.2 million annually through direct costs (e.g., code enforcement, policing), lost tax revenue from vacant parcels, and lost tax revenue attributable to reduced property values for occupied parcels near vacant parcels (Immergluck et al., 2016). Due to the widespread presence of vacant residential properties in Toledo and the decades-long economic contraction and population loss, Toledo is well-suited to studying the interactions among disinvestment, residential vacancy, urban greening, and blight associated with overgrown vegetation.
Data Collection and Preparation
Parcel Vacancy Data
Parcel-scale analysis offers insights at the fundamental geographic unit of land management for residential parcels in the US (Manson et al., 2009). To characterize vacancy at the parcel scale, we obtained Toledo Survey data in table format from the Lucas County Land Bank. The Toledo Survey is a comprehensive walking survey of property condition that was completed in 2014–2015 for over 121,000 parcels in Toledo. The survey data include observations on whether a structure was present, whether a structure appeared occupied, and indicators of physical disorder such as peeling paint or missing siding, missing or broken windows, and evidence of fire damage. These indicators of physical disorder were recorded as part of the Toledo Survey's efforts to better understand the prevalence and geographic distribution of property blight within the city. The Toledo Survey data table was joined to property parcel polygons from the Lucas County Auditor in a geographic information system (GIS). Parcel information from the Auditor was used to identify and extract residential parcels. Using the Toledo Survey data, we classified residential parcels into three mutually-exclusive categories based on observed occupancy and the presence/absence of a residential structure: (1) occupied structures, which were parcels with occupied residential structures (86.6% of total); (2) vacant structures, defined as parcels with unoccupied residential structures (4.4% of total); and (3) vacant lots, which were residential parcels without a structure present (9.0% of total). We use the term vacant parcels to collectively describe both vacant structures and vacant lots.
Vegetation Data
We obtained or derived three parcel-scale vegetation metrics from existing open data: (1) overgrown lawns as an indicator of blight, (2) tree canopy cover, and 3) NDVI. The Toledo Survey documented the presence or absence of overgrown lawn and/or dumping, henceforth overgrown lawn. Tree canopy cover was obtained from a 2012 tree canopy map at 0.3 m resolution developed for Toledo using object-based classification techniques (Li, 2017). We assessed the overall accuracy of the canopy cover map as 91% accurate, based on visual interpretation of 300 randomly distributed points using 1 m resolution air photos from 2015. Tree canopy at the parcel scale was calculated as the proportion of each parcel's land area occupied by tree canopies when viewed from above. NDVI is an indicator of vegetation abundance and health. NDVI ranges from −1 to 1, where lower values indicate water, bare soil/rock, or impervious surfaces, and increasingly higher values indicate more vigorous vegetation. Note that while average NDVI values tend to be substantially lower for NAIP imagery compared to Landsat imagery (Zhang et al., 2019), the interpretation that higher NDVI values indicate more vigorous vegetation remains applicable. NDVI was derived based on 1 m resolution, growing season color-infrared aerial photography from the National Agriculture Imagery Program (NAIP) acquired from OCM Partners (2020). A mean NDVI value was calculated for the pixels located within each residential parcel to derive a parcel-scale measure for subsequent analysis.
Conceptually, we expected these three greenness indicators to provide somewhat different insights. Due to the slow growth of trees (Roman et al., 2018), tree canopy cover registered tall vegetation that was planted or otherwise began growing years earlier. On the other hand, NDVI is responsive to any green vegetation regardless of its height or age. Thus, NDVI detected trees and low-lying vegetation such as turf grass, as well as ruderal herbaceous plants and woody shrubs that colonized sites in the absence of proactive yard maintenance. Whereas, both tree canopy cover and NDVI are quantitative measures of vegetation abundance, the overgrown lawn indicator was used as a qualitative indicator of perceived blight related to reduced yard maintenance.
Data Analysis
Patterns in Vacancy and Greenness at the Neighborhood Scale
Parcel-scale data were aggregated by census block groups to analyze neighborhood-scale patterns within Toledo. Block groups are designed to be relatively homogeneous with respect to population characteristics. Each residential parcel was assigned to the block group that contained the parcel's centroid to avoid slivers and spurious associations. Toledo contained 303 block groups. We excluded block groups with fewer than 20 residential parcels, resulting in 297 block groups included in analyses. The mean and median number of residential parcels per included block group was 348 (st. dev. = 150.3), and 338, respectively.
We used ordinary least squares (OLS) regression to analyze how vacancy related to indicators of greenness among block groups. We aggregated parcel greenness metrics to the block group scale to construct separate regression models for mean percent tree canopy cover, mean NDVI, and percent of parcels with overgrown lawns. The mean canopy cover and NDVI metrics were calculated as the mean of parcel means for all residential parcels located in each block group. In each regression model, percent vacancy was the independent variable and the greenness metric was the dependent variable. We tested models with a linear term only, and with a linear and quadratic term because exploratory data analyses showed potentially non-linear relationships. The model with the lowest Akaike information criterion (AIC) value was chosen as the model with the best, parsimonious fit.
Spatial dependence among observations can lead to faulty inferences when applying OLS regression (Anselin and Bera, 1998), so we tested the OLS model residuals for spatial autocorrelation using the Moran's I statistic. When Moran's I indicated spatial autocorrelation in OLS residuals, we implemented simultaneous autoregressive models (SAR) to control for spatial dependence. The Lagrange multiplier test was used to guide the selection of the appropriate SAR model, following guidance from Anselin (2005). A first-order queen contiguity spatial matrix was implemented in the SAR models, following earlier studies (e.g., Pham et al., 2012; Grove et al., 2014) and based on the expectation that observed values for a block group are partially dependent on the values of adjacent neighboring block groups. We report Nagelkerke pseudo-R2-values because simple R2-values are not appropriate for SAR models. While pseudo-R2-values do not report the proportion of variability explained by the model, they can be compared among models as a relative measure of model explanatory power.
Patterns in Greenness and Occupancy Status at the Parcel Scale
A primary goal of this study was to compare greenness across occupancy categories at the parcel scale. We used independent, two-way ANOVA to test for effects of occupancy class, overgrown lawn status, and their interaction on both tree canopy and NDVI. When the interaction effects were significant, we used Tukey's HSD post-hoc test to determine which combinations of occupancy class and overgrown status were different from one another.
We conducted an additional parcel-scale analysis to control for potential influences of neighborhood-scale factors. Vacant parcels are spatially concentrated (Figure 1), so observed differences in greenness based on occupancy status could be influenced by confounding geographic patterns at the neighborhood scale like urban form, development history, and socioeconomic status (Roman et al., 2018). For example, if vacant parcels are typically found in neighborhoods with smaller parcel sizes, then parcels with vacant structures may appear less green simply because their structures occupy a larger proportion of the parcel on average, leaving less space to grow vegetation. Conversely, if occupied parcels are more frequently located in neighborhoods with larger parcel sizes where structures occupy proportionally less space, they will generally have more space to grow vegetation. Failing to control for such confounding factors could essentially result in a comparison of greenness attributable to neighborhood-scale geographic patterns across high- vs. low-vacancy areas, rather than an analysis isolating patterns related to occupancy status.
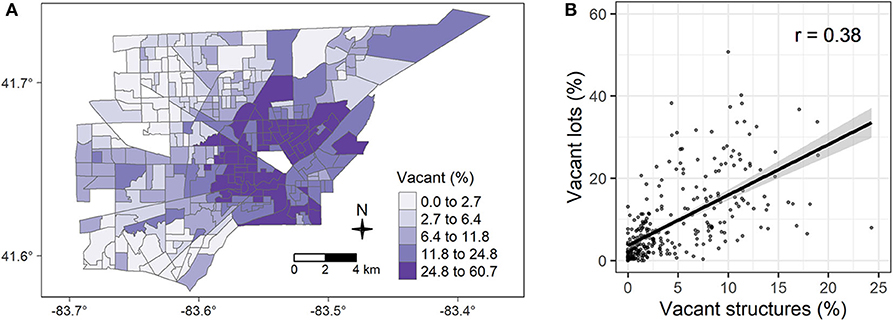
Figure 1. (A) Map of residential vacancy rates (vacant structures plus vacant lots) in Toledo. Filled polygons represent census block groups with ≥20 residential parcels. For reference, the downtown core is located near the center of the map in the unfilled (white) block groups. (B) Scatterplot demonstrating the positive relationship between vacant structures and vacant lots within Toledo block groups. Data: Toledo Survey.
We controlled for these confounding neighborhood-scale factors by matching each vacant parcel with up to three comparable occupied parcels (Aschengrau and Seage, 2008). Comparable occupied parcels were defined as those meeting the following two matching criteria: (1) the parcel land area was within ±10% of the vacant parcel's land area, and (2) the parcel centroid was within 100–300 m of the vacant parcel's centroid. The land area criterion increased the likelihood that matched pairs had similar yard sizes, thereby increasing the likelihood that greenness comparisons were capturing vegetation management rather than differences in yard size. The proximity criterion controlled for unobserved neighborhood factors such as socioeconomics or social norms that could correspond with different vegetation management practices across different neighborhoods within Toledo. The minimum distance threshold of 100 m guarded against matching abutting parcels that could register overhanging tree canopy from the neighboring parcel's trees. The minimum distance threshold also increased the chances that matched pairs would constitute independent observations with respect to vegetation management, because very close neighbors tend to exhibit mimicry in yard maintenance (Minor et al., 2016). From the list of candidate occupied parcels that met both criteria, three parcels were selected at random as matches. This matching procedure was implemented separately for vacant structures and for vacant lots. The parcel matching strategy facilitated more meaningful comparison of greenness according to occupancy status than simply comparing all occupied parcels to all vacant parcels, because the matching process controlled for other confounding factors that likely influence greenness. To assess matching success, we calculated the mean number of occupied matches per vacant structure and per vacant lot, and we compared the mean parcel sizes of matched pairs to ensure they were similar.
Using the matched parcels, we compared vacant parcels and their occupied matches for each vegetation metric (tree canopy cover, NDVI, and overgrown lawn status). For both NDVI and tree canopy cover, paired t-tests were used to test for a difference in means between vacant parcels and their occupied matches. McNemar's test was used to assess whether the proportion of parcels with overgrown lawns was different between vacant parcels and their occupied matches.
Geographic Discrepancies in the Relative Contribution of Vacant Parcels to Neighborhood Greenness
By definition, vacant parcels are more abundant in high-vacancy neighborhoods than low-vacancy neighborhoods, and thus we would expect vacant parcels to play a larger overall role in greenness patterns within high-vacancy areas. But we also hypothesized that vacant parcels in high-vacancy areas make a larger contribution to greenness on a per-parcel basis compared to low-vacancy areas. We expected that low-vacancy areas have relatively more amenity vegetation on occupied parcels, and stricter vegetation maintenance norms compared to high-vacancy areas. These strict social expectations could translate to more proactive vegetation maintenance on vacant parcels in low-vacancy areas, including activities like regular mowing and brush clearing. In high-vacancy areas, vacant parcels may be greener because lawns are more likely to grow taller, and weedy trees and shrubs grow unchecked. We expected the discrepancy in greenness between high- and low-vacancy areas to be stronger for NDVI than for tree canopy, because NDVI captures the low-lying, spontaneous vegetation typical of vacant parcels while tree canopy does not.
To test this hypothesis, we calculated the mean difference in NDVI between vacant parcels and their occupied matches by block group, excluding block groups with low sample sizes of <10 matched pairs. Then we used the Getis-Ord Gi* statistic with a first-order queen contiguity spatial matrix to identify geographic clusters of high and low values. High values (hot spots) indicated block groups with a large, positive difference in NDVI between vacant parcels and their occupied matches that were surrounded by other block groups that also exhibited large, positive differences. Clusters of low values (cold spots) were those block groups and their neighbors that had particularly small positive differences or negative differences in NDVI between vacant parcels and their occupied matches. The analysis was conducted separately for vacant structures and vacant lots, and then we repeated the analysis for tree canopy cover. The Getis-Ord Gi* statistic is reported as z-scores indicating whether a block group and its neighbors have differences between vacant parcels and occupied matches that are higher or lower than expected.
Results
Patterns in Vacancy and Greenness at the Block Group Scale
All three OLS regression models used to assess the relationships between vacancy rates and greenness indicators at the block group scale showed significant spatial autocorrelation in their residuals. As recommended by the Lagrange multiplier test, spatial lag models were implemented for both tree canopy cover and NDVI, while a spatial error model was used for overgrown lawn. For each greenness indicator, the SAR with a quadratic term fit better than the model with a linear term only. The Nagelkerke pseudo-R2-values were 0.65, 0.66, and 0.73 for tree canopy cover, NDVI, and overgrown lawns, respectively. These relationships are visualized in the scatterplots in Figure 2, and the detailed output from the SAR models is given in Supplementary Material 1. In general, tree canopy cover and NDVI are higher in both low- and high-vacancy areas, and lower in block groups with intermediate vacancy rates. The prevalence of overgrown lawns increases with vacancy rates (Figure 2).
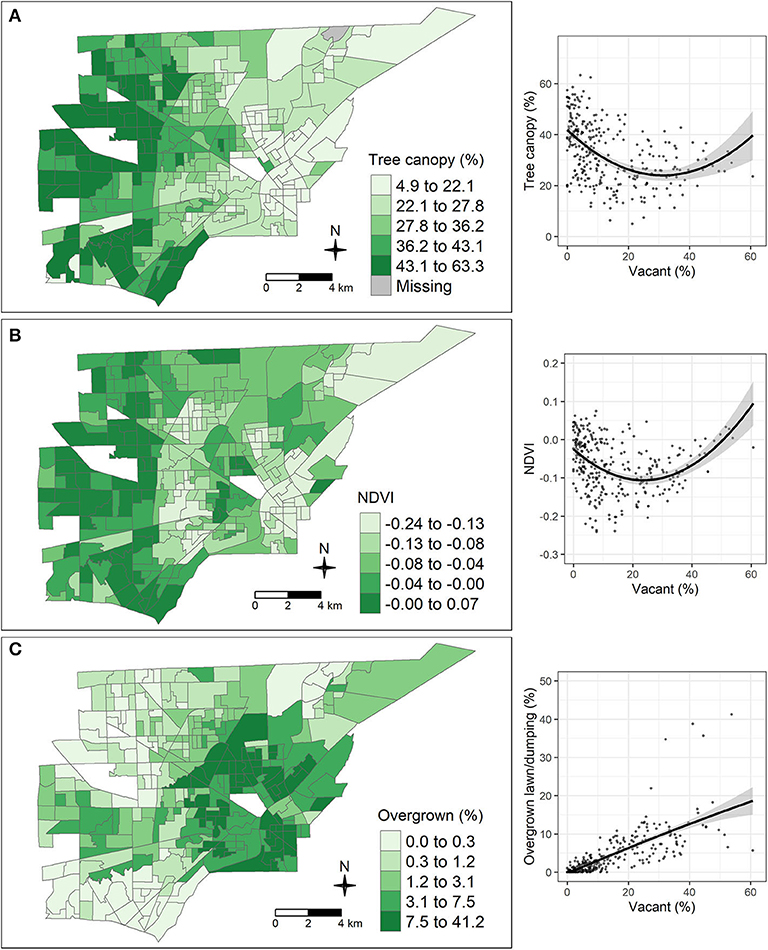
Figure 2. Maps of greenness indicators and their respective relationships with percent vacant parcels (vacant structures plus vacant lots) within Toledo block groups. On the maps, filled polygons represent census block groups with ≥20 residential parcels. Within each block group, (A) tree canopy represents the mean percent canopy cover for all residential parcels, (B) NDVI represents the mean parcel NDVI value, and (C) overgrown lawn and/or dumping represents that percent of parcels noted as such during the Toledo Survey. On the scatterplots, block groups are represented by points, and quadratic regression lines are displayed because they yielded a better fit than linear models.
Patterns in Greenness and Occupancy Status at the Parcel Scale
The results from the two-way ANOVA tests are summarized in Figure 3. In the two-way ANOVA for tree canopy cover, overgrown status (F = 20.5, p < 0.0001) and occupancy class (F = 299.7, p < 0.0001) were both significant, as was their interaction (F = 5.77, p = 0.0031). The results of Tukey's HSD test indicated that tree canopy cover was 2.8% higher (p < 0.0001, 95% confidence interval (CI) of the difference = 1.1–4.5%) for occupied parcels that did not have overgrown lawns, there was no difference for parcels with vacant structures (p = 0.99), and there was no difference for vacant lots based on overgrown status (p = 0.86; Figure 3A). When lawns were not overgrown, tree canopy cover on vacant lots was 9.8% (p < 0.0001, CI = 8.3–11.3%) greater than parcels with vacant structures and 5.7% (p < 0.0001, CI = 4.9–6.4%) greater than occupied structures, and parcels with occupied structures had 4.1% (p < 0.0001, CI = 2.9–5.4%) greater tree canopy cover than vacant structures (Figure 3A). When lawns were overgrown, tree canopy cover was higher on vacant lots by 8.5% (p < 0.0001, CI = 5.7–11.2%) and 7.5% (p < 0.0001, CI = 4.8–10.3%) compared to vacant structures and occupied parcels, respectively, and there was no difference between vacant structures and occupied parcels (p=0.88).
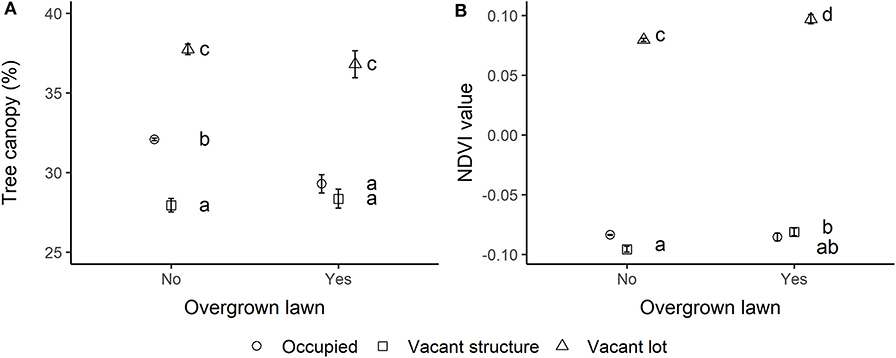
Figure 3. Comparison of (A) tree canopy and (B) NDVI according to the interaction between occupancy class and overgrown status. Significant differences are indicated by different letters.
In the two-way ANOVA for NDVI, overgrown status (F = 221.6, p < 0.0001) and occupancy class (F = 7,153.2, p < 0.0001) were both significant, as was their interaction (F = 8.48, p = 0.0002). The results of Tukey's HSD test for NDVI indicated that there was no difference between occupied parcels with and without overgrown lawns (p = 0.99), parcels with vacant structures had an NDVI value that was 0.015 higher for overgrown parcels compared to those that were not overgrown (p = 0.0032, 95% CI of the difference=0.003–0.026), and vacant lots had an NDVI value that was 0.017 higher for overgrown parcels compared to those that were not overgrown (p = 0.0008, CI = 0.005–0.029; Figure 3B). When lawns were not overgrown, NDVI values on vacant lots were higher than parcels with occupied and vacant structures by 0.163 (p < 0.0001, CI = 0.159–0.168) and 0.176 (p < 0.0001, CI = 0.168–0.183), respectively (Figure 3B). Parcels with occupied structures had NDVI values that were 0.012 (p < 0.0001, CI = 0.005–0.019) higher than parcels with vacant structures. For parcels with overgrown lawns, NDVI on vacant lots was higher than occupied parcels by 0.182 (p < 0.0001, CI = 0.168–0.197) and vacant structures by 0.178 (p < 0.0001, CI = 0.164–0.193). There was no difference between vacant structures and occupied parcels (p = 0.93).
We used spatial proximity and parcel land area criteria to match parcels in an effort to control for geographic influences other than occupancy status. On average, vacant structures were successfully matched with 2.86 occupied parcels, resulting in 12,460 total matches. The mean and median numbers of occupied candidates for each vacant structure were 53.3 and 41, respectively. Eighty-seven (or 2% of total) vacant structures had no occupied matches, and they were not included in the analysis. There were no significant differences in parcel size between the vacant structures and their occupied matches, suggesting that the matching criterion was successfully met. Vacant structures were significantly greener than their occupied matches. Vacant structures had 3.1 percentage points more tree canopy than their occupied matches, significantly higher NDVI, and had an overgrown lawn rate that was 31 percentage points higher (Table 1).
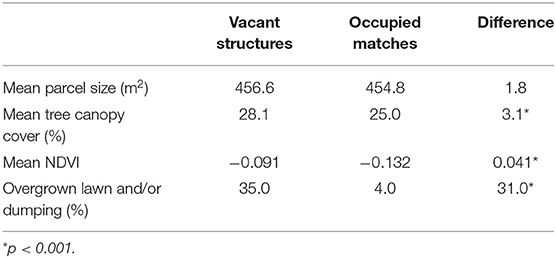
Table 1. Comparison of vacant structure parcels and their occupied matches.
In the paired parcel comparisons, the average vacant lot was successfully matched with 2.49 occupied parcels, resulting in 19,548 total matches. The mean and median numbers of occupied candidates for each vacant lot were 39.3 and 27, respectively. There were 954 vacant lots with no occupied matches (or 11% of total), and they were excluded from the analysis. Again, the matching procedure was successful, as the mean parcel size did not differ significantly between vacant lots and their occupied matches. Vacant lots had an average of 37.7% tree canopy cover, which was 11.1 percentage points greater than the occupied matches (Table 2). NDVI was significantly higher in vacant lots, and the prevalence of overgrown lawns was 8.4 percentage points higher on vacant lots compared to their occupied matches (Table 2).
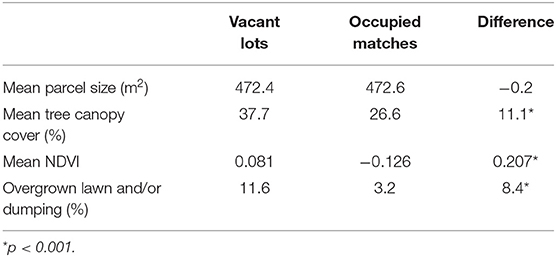
Table 2. Comparison of vacant lot parcels and their occupied matches.
Geographic Discrepancies in the Relative Contribution of Vacant Parcels to Neighborhood Greening
Mapping the results of the Getis-Ord Gi* analyses of tree canopy for vacant structures shows a heterogeneous geographic pattern with a small number of statistically significant clusters of strong and weak differences between vacant structures and occupied matches (Figure 4A). For tree canopy on vacant lots, cold spots indicating weak or negative differences between vacant lots and their occupied matches are concentrated in high-vacancy areas near downtown Toledo, while hot spots indicating larger differences between vacant lots and occupied matches are located further to the west (Figure 4B). For NDVI, the Getis-Ord Gi* analysis shows similar patterns for both vacant structures (Figure 4C) and vacant lots (Figure 4D). Stronger differences in NDVI between vacant parcels and occupied matches were clustered in high-vacancy areas near the center of Toledo, while weaker or negative differences were concentrated in lower-vacancy areas of western Toledo.
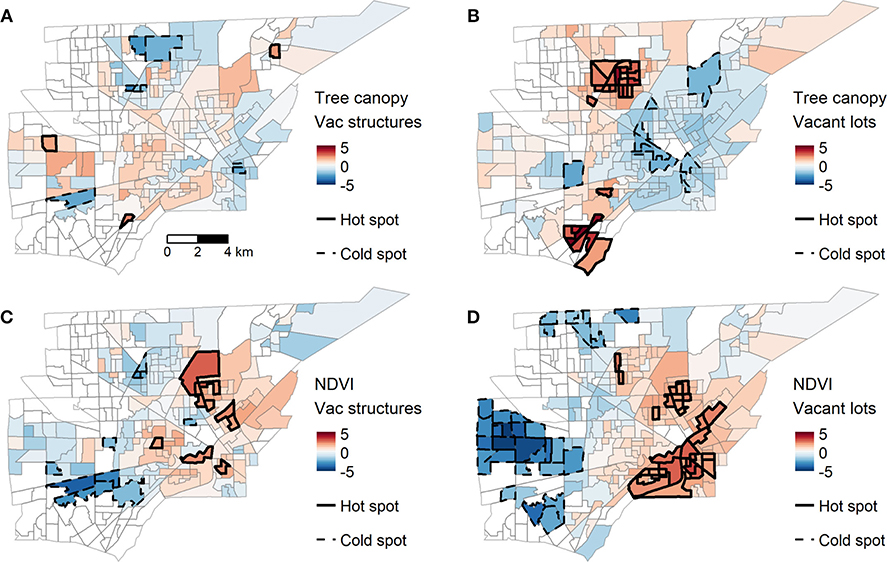
Figure 4. (A–D) Results of Getis-Ord analysis of the discrepancy in greenness between vacant parcels and their comparable occupied matches. Mapped values are z-scores, where darker reds indicate increasingly strong positive differences between vacant parcels and their occupied matches, and darker blues indicate differences that are increasingly smaller or negative. Hot (cold) spots are clusters of block groups that have values that are significantly higher (lower) than expected at the p < 0.05 level. Hot spots can be interpreted as areas where vacant parcels are particularly green compared to their occupied matches. Cold spots can be interpreted as areas where occupied parcels are either greener than or quite similar in greenness to vacant parcels. White block groups had <10 matched pairs and were excluded from the analysis.
Discussion
This study supports the notion that citywide heterogeneity in vacancy intersects with the uneven distribution of vegetation in ways that are especially important to understanding distributional equity in shrinking cities. Using parcel-scale data to explore the connections among parcel occupancy status, vegetation abundance, and blight associated with overgrown lawns, our findings underscore the noteworthy contributions of vacant residential parcels to urban vegetation abundance, particularly in high-vacancy areas. Previous research by Schwarz et al. (2018) showed that high-vacancy areas in Toledo increased in vegetation over time, plausibly due to spontaneous vegetation growth on vacant parcels. They speculated that while this greening reduced the geographic disparity in the quantity of vegetation, it was likely that disparities in the quality or desirability of vegetation persisted across neighborhoods. The findings presented here add multiple lines of complementary evidence supporting this idea, and illustrate that vacancy plays a disproportionately large role in the greening of Toledo's high-vacancy areas. Moreover, much of this greening is driven by overgrown vegetation.
At the neighborhood scale, tree canopy and NDVI both exhibited non-linear associations with vacancy rates. Low-vacancy and high-vacancy block groups had the highest tree canopy and NDVI (Figure 2). This is consistent with earlier findings from Toledo at the census tract scale showing that high-vacancy areas have increased in vegetation over time, presumably as vacant parcels became greener due to building demolition and/or reduced vegetation maintenance (Schwarz et al., 2018). Note that the regression curve for NDVI peaked higher for high-vacancy block groups than for low-vacancy block groups, while the curve for tree canopy did not (Figure 2). This can plausibly be explained by the fact that NDVI captures low-lying vegetation like grasses and shrubs that are not included in the tree canopy classification, and so low-lying vegetation (weedy or otherwise) growing abundantly in high-vacancy block groups contributed to higher NDVI values. The positive association between vacancy and overgrown lawns (Figure 2) suggests that undesirable, weedy vegetation contributes to greening in higher-vacancy block groups. While there are opportunities to advance both social and ecological goals via planned greening initiatives on urban vacant land (Green et al., 2016; Anderson and Minor, 2017), the proliferation of overgrown vegetation in high-vacancy areas of Toledo (Figure 2) indicates that many vacant parcels have greened in a way that could produce negative social outcomes.
The parcel-scale analyses enrich the perspectives from the block group scale by explicitly accounting for occupancy status in comparisons of greenness metrics. An important finding is that vacant parcels were greener than their occupied matches according to tree canopy cover and NDVI (Tables 1, 2). This was expected for vacant lots where building demolition creates additional space for vegetation to grow. But even on parcels with vacant structures we observed higher tree canopy and NDVI than on comparable occupied parcels (Table 1). Given that the prevalence of overgrown lawns is 31% higher for vacant structures than occupied parcels, it is likely that unmaintained vegetation on vacant structures is responsible for a substantial portion of this difference. Indeed, the two-way ANOVA tests showed that both vacant structures and vacant lots had higher NDVI values on parcels with overgrown lawns than those without overgrown lawns (Figure 3); this difference was not observed for occupied parcels. Tree canopy cover did not vary on vacant parcels depending on overgrown lawn status (Figure 3), so the convergence of evidence indicates that the differences in NDVI were driven by low-lying vegetation such as grasses and shrubs.
Vacant parcels are geographically concentrated in neighborhoods near downtown Toledo (Figure 1), where they will influence neighborhood greenness patterns based on their sheer abundance alone. Moreover, when we analyzed spatial patterns in the NDVI discrepancy between vacant parcels and their occupied matches, we found that high-vacancy areas had larger discrepancies (Figure 4). On a per-parcel basis, vacant parcels in high-vacancy areas contribute more to neighborhood greenness than vacant parcels in low-vacancy areas. While this pattern was clear for NDVI, there was almost no discernable pattern for tree canopy on vacant structures, and we saw the opposite pattern for tree canopy on vacant lots (i.e., cold spots were concentrated in high-vacancy areas) (Figure 4). We interpret this as an indication that the large discrepancies in NDVI between vacant and occupied parcels in high-vacancy areas were driven by the proliferation of low-lying vegetation on vacant parcels in high-vacancy areas; this interpretation is consistent with the findings presented in Figures 2, 3B, and Tables 1, 2. On the other hand, vacant parcels in low-vacancy areas did not contribute much to neighborhood greenness overall because there were not many vacant parcels in these areas; occupied parcels in these areas are relatively green in general, so vacant parcels are not particularly green in comparison; and there may be a neighborhood expectation to maintain vegetation on vacant parcels in low-vacancy areas (Krusky et al., 2015), such that these parcels are less likely to become overgrown.
This study highlights the value of incorporating multiple lines of evidence at multiple spatial scales to contextualize observed patterns in urban greenness. Whereas, earlier studies have been limited by data availability, our analysis benefited from parcel-scale data including qualitative data about overgrown lawns from the Toledo Survey. This allowed us to demonstrate that vacant parcels are greener than comparable occupied parcels (Tables 1, 2), and that vacant parcels with overgrown lawns are greener than those without overgrown lawns (Figure 3B), a pattern that is not explained by tree canopy cover (Figure 3A). These conclusions would not have been apparent if we had studied patterns in tree canopy cover or NDVI at the neighborhood scale alone. While the Toledo Survey has demonstrable value for the practical management of land in Toledo, our research also shows the promise of such data sets for research purposes. Where comprehensive parcel condition data are not available, researchers have developed protocols to assess parcel condition that provide context to complement remotely sensed measures like tree canopy cover or NDVI (e.g., Krusky et al., 2015; Troy et al., 2016; Gobster et al., 2020). Such approaches can provide valuable data about human perception that inform whether vegetation functions as beauty or blight (Gobster et al., 2019).
There were limitations to our analyses that may impact our findings. First, the data sets upon which our analyses were based were captured at different times. The 2015 imagery used to calculate NDVI was acquired within 1 year of the Toledo Survey data, which was collected over a 12-month period. Mowing, trimming, and other management interventions may have altered the vegetation abundance and overgrown lawn status in the period between these data acquisitions. The tree canopy cover map was based on 2012 imagery, but its assessed accuracy was 91% with respect to 2015 reference imagery, so we deemed it suitable for use. Second, each data set captured conditions at a single point in time, and there may have been errors in the data sets such as miscategorized occupancy status in the Toledo Survey. However, with a large data set of over 100,000 parcels, we expect that representative patterns were apparent even in the presence of some error. Third, different members of the Toledo Survey field crew may have had different interpretations of what constitutes an overgrown lawn based on their neighborhood social norms and their personal preferences (Hostetler, 2020). Furthermore, we operationalized the Toledo Survey category “overgrown lawn and/or dumping” as an indicator of overgrown vegetation, but there were likely instances of dumping in which the vegetation was not overgrown. While we cannot control for such cases, the relationships between NDVI and the overgrown lawn and/or dumping indicator (Figure 3B) suggest that the indicator was frequently recording overgrown vegetation.
In Toledo, heterogeneity in vacancy and vegetation quantity and quality intersect in ways that point to inequitable social-ecological outcomes. Urban vegetation is often touted for providing ecosystem services (e.g., Seamans, 2013; Dobbs et al., 2014), and environmental justice analyses related to urban greening have generally assumed, implicitly or explicitly, that higher amounts of vegetation are desirable (e.g., Pham et al., 2012; Danford et al., 2014). However, urban vegetation does not always function as an amenity (Schwarz et al., 2018), and here we found that vacant parcels played a substantial role in neighborhood-scale greening in high-vacancy areas. So while vacant parcels may perform important ecological functions like stormwater control and urban heat island amelioration, they can simultaneously evoke negative perceptions of the neighborhood (Herrmann et al., 2016; Riley et al., 2018), creating a potential misalignment between ecosystem services and amenities. This may be particularly unjust in instances where overgrown vegetation in high-vacancy areas provides ecological benefits that are experienced citywide, while the overgrown vegetation simultaneously generates negative social outcomes that are localized within those high-vacancy areas, potentially perpetuating localized disinvestment. This highlights the need to understand both vegetation quantity and quality when assessing the equity of urban vegetation patterns (Schwarz et al., 2018).
Future work in this area of research could further advance our understanding of drivers and consequences of vacancy and unequal vegetation distributions. For example, longitudinal data sets would permit assessment of how patterns in greenness change over time following changes in occupancy status. Incorporating parcel data about ownership could shed light on whether vegetation maintenance varies depending on ownership; this type of information could inform land banks as they work to return vacant parcels to uses that are positive for the community. We have demonstrated clear connections between vacancy, vegetation abundance, and overgrown vegetation functioning as blight in Toledo. Conducting similar studies in additional cities would indicate whether these patterns are generalizable across shrinking cities, as well as in areas of disinvestment within cities that are generally prosperous. Vacant parcels can play a key role in increasing the amount of vegetation in shrinking cities. However, it is not only the quantity, but also how that vegetation is experienced by the community in which it is embedded, that determines whether “greening up” is resisting or perpetuating environmental inequities.
Data Availability Statement
Publicly available datasets were analyzed in this study. This data can be found at: Toledo parcel data were obtained from the Lucas County Auditor (http://co.lucas.oh.us/331/Auditor). Toledo Survey data were obtained from the Lucas County Land Bank (https://lucascountylandbank.org/). Xi Li provided the urban tree canopy classification data that was developed for her Ph.D. dissertation (http://rave.ohiolink.edu/etdc/view?acc_num=toledo1493417634359152). NDVI was calculated based on 2015 NAIP imagery available at https://coast.noaa.gov/dataviewer/#/.
Author Contributions
AB, DL, KS, and DH designed the study. AB prepared data and conducted analysis. AB, DH, and DL generated visualizations. AB, KS, DL, and DH wrote the paper. All authors contributed to the article and approved the submitted version.
Conflict of Interest
The authors declare that the research was conducted in the absence of any commercial or financial relationships that could be construed as a potential conflict of interest.
Acknowledgments
We thank Joshua Murnen (Lucas County Land Bank), Tina Mack (Lucas County Auditor's Office), and Xi Li (tree canopy classification) for providing data for this study. Jason Yang and Max Piana provided valuable comments on an earlier version of this manuscript. The findings and conclusions in this study are those of the authors and should not be construed to represent any official USDA or US Government determination or policy.
Supplementary Material
The Supplementary Material for this article can be found online at: https://www.frontiersin.org/articles/10.3389/fevo.2020.566759/full#supplementary-material
References
Abdelazim, T., Schmidt, M., and Graziani, K. (2016). An Open Space Action Plan for the Junction Neighborhoods in Toledo, Ohio. Center for Community Progress. Available online at: https://www.communityprogress.net/filebin/160630_TASP_LCLRC_Open_Space_Action_Plan_Final.pdf (accessed August 16, 2020).
Agyeman, J., Schlosberg, D., Craven, L., and Matthews, C. (2016). Trends and directions in environmental justice: from inequity to everyday life, community, and just sustainabilities. Annu. Rev. Environ. Resour. 41, 321–340, doi: 10.1146/annurev-environ-110615-090052
Anderson, E. C., and Minor, E. S. (2017). Vacant lots: an underexplored resource for ecological and social benefits in cities. Urban For. Urban Green. 21, 146–152. doi: 10.1016/j.ufug.2016.11.015
Anguelovski, I. (2016). From toxic sites to parks as (green) LULUs? New challenges of inequity, privilege, gentrification, and exclusion for urban environmental justice. J. Plan. Literat. 31, 23–36. doi: 10.1177/0885412215610491
Anselin, L. (2005). Exploring Spatial Data with GeoDa: A Workbook. Available online at: http://www.csiss.org/clearinghouse/GeoDa/geodaworkbook.pdf (accessed May 19, 2020).
Anselin, L., and Bera, A. K. (1998). “Spatial dependence in linear regression models with an introduction to spatial econometrics,” in Handbook of Applied Economic Statistics, eds A. Ullah and D. E. A. Giles (New York, NY: CRC Press), 237–289.
Aschengrau, A., and Seage, G. (2008). Essentials of Epidemiology in Public Health. Sudbury, MA: Jones & Bartlett Learning.
Baró, F., Calderón-Argelich, A., Langemeyer, J., and Connolly, J. J. T. (2019). Under one canopy? Assessing the distributional environmental justice implications of street tree benefits in barcelona. Environ. Sci. Policy 102, 54–64. doi: 10.1016/j.envsci.2019.08.016
Bullard, R. D. (1994). Unequal Protection: Environmental Justice & Communities of Color. San Francsico, CA: Sierra Club Books.
Camacho-Cervantes, M., Schondube, J. E., Castillo, A., and MacGregor-Fors, I. (2014). How do people perceive urban trees? Assessing likes and dislikes in relation to the trees of a city. Urban Ecosyst. 17, 761–773. doi: 10.1007/s11252-014-0343-6
Carmichael, C. E., and McDonough, M. H. (2018). The trouble with trees? Social and political dynamics of street tree-planting efforts in Detroit, Michigan, USA. Urban For. Urban Green. 31, 221–229. doi: 10.1016/j.ufug.2018.03.009
Danford, R. S., Cheng, C., Strobach, M. W., Ryan, R., Nicolson, C., and Warren, P. S. (2014). What does it take to achieve equitable urban tree canopy distribution? A Boston case study. Cities Environ. 7:2. Available online at: https://digitalcommons.lmu.edu/cate/vol7/iss1/2
Dobbs, C., Kendal, D., and Nitschke, C. R. (2014). Multiple ecosystem services and disservices of the urban forest establishing their connections with landscape structure and sociodemographics. Ecol. Indicat. 43, 44–55. doi: 10.1016/j.ecolind.2014.02.007
Downtown Toledo Master Plan. (2017). Available online at: https://issuu.com/mksk/docs/downtown_toledo_master_plan (accessed August 27, 2020).
Floyd, B. L. (2015). The Glass City: Toledo and the Industry That Built It. Ann Arbor, MI: University of Michigan Press.
Gobster, P. H., Hadavi, S., Rigolon, A., and Stewart, W. P. (2020). Measuring landscape change, lot by lot: greening activity in response to a vacant land reuse program. Landsc. Urban Plan. 196:103729. doi: 10.1016/j.landurbplan.2019.103729
Gobster, P. H., Ribe, R. G., and Palmer, J. F. (2019). Themes and trends in visual assessment research: introduction to the landscape and urban planning special collection on the visual assessment of landscapes. Landsc. Urban Plan. 191:103635. doi: 10.1016/j.landurbplan.2019.103635
Green, O. O., Garmestani, A. S., Albro, S., Ban, N. C., Berland, A., Burkman, C. E., et al. (2016). Adaptive governance to promote ecosystem services in urban green spaces. Urban Ecosyst. 19, 77–93. doi: 10.1007/s11252-015-0476-2
Grove, J. M., Locke, D. H., and O'Neil-Dunne, J. P. M. (2014). An ecology of prestige in New York City: examining the relationships among population density, socio-economic status, group identity, and residential canopy cover. Environ. Manag. 54, 402–419. doi: 10.1007/s00267-014-0310-2
Herrmann, D. L., Schwarz, K., Shuster, W. D., Berland, A., Chaffin, B. C., Garmestani, A. S., et al. (2016). Ecology for the shrinking city. BioScience 66, 965–973. doi: 10.1093/biosci/biw062
Heynen, N., Perkins, H. A., and Parama, R. (2006). The political ecology of uneven urban green space: the impact of political economy on race and ethnicity in producing environmental inequality in Milwaukee. Urban Aff. Rev. 42, 3–25. doi: 10.1177/1078087406290729
Hoalst-Pullen, N., Patterson, M. W., and Gatrell, J. D. (2011). Empty spaces: neighbourhood change and the greening of Detroit, 1975–2005. Geocarto Int. 26, 417–434. doi: 10.1080/10106049.2011.585439
Hollander, J. B., Pallagst, K. M., Schwarz, T., and Popper, F. J. (2009). Planning shrinking cities. Progr. Plan. 72, 223–232. Available online at: https://ssrn.com/abstract=1616130
Hostetler, M. (2020). Cues to care: future directions for ecological landscapes. Urban Ecosyst. doi: 10.1007/s11252-020-00990-8
Ibáñez-Álamo, J. D., Morelli, F., Benedetti, Y., Rubio, E., Jokimäki, J., Pérez-Contreras, T., et al. (2019). Biodiversity within the city: effects of land sharing and land sparing urban development on avian diversity. Sci. Tot. Environ. 707:135477. doi: 10.1016/j.scitotenv.2019.135477
Immergluck, D., Toering, S., Abdelazim, T., and Graziani, K. (2016). A Conservative Analysis of Costs Imposed by Vacant and Blighted Properties in Toledo. Center for Community Progress. Available online at: https://www.communityprogress.net/filebin/160630_TASP_LCLRC_Toledo_Cost_of_Blight_Study_Final.pdf (accessed May 19, 2020).
Krusky, A. M., Heinze, J. E., Reischl, T. M., Aiyer, S. M., Franzen, S. P., and Zimmerman, M. A. (2015). The effects of produce gardens on neighborhoods: a test of the greening hypothesis in a post-industrial city. Landsc. Urban Plan. 136, 68–75. doi: 10.1016/j.landurbplan.2014.12.003
Landry, S. M., and Chakraborty, J. (2009). Street trees and equity: evaluating the spatial distribution of an urban amenity. Environ. Plan. A 41, 2651–2670. doi: 10.1068/a41236
Leslie, E., Sugiyama, T., Ierodiaconou, D., and Kremer, P. (2010). Perceived and objectively measured greenness of neighbourhoods: are they measuring the same thing? Landsc. Urban Plan. 95, 28–33. doi: 10.1016/j.landurbplan.2009.11.002
Li, X. (2017). Use of LiDAR in Object-Based Classification to Characterize Brownfields for Green Space Conversion in Toledo. (Dissertation), University of Toledo, Toledo, OH(USA).
Manson, S. M., Sander, H. A., Ghosh, D., Oakes, J. M., Orfield, M. W. Jr, Craig, W. J., et al. (2009). Parcel data for research and policy. Geogr. Compass 3, 698–726. doi: 10.1111/j.1749-8198.2008.00209.x
Martinez-Fernandez, C., Weyman, T., Fol, S., Audirac, I., Cunningham-Sabot, E., Wiechmann, T., et al. (2016). Shrinking cities in Australia, Japan, Europe and the USA: from a global process to local policy responses. Progr. Plan. 105, 1–48. doi: 10.1016/j.progress.2014.10.001
Minor, E., Belaire, J. A., Davis, A., Franco, M., and Lin, M. (2016). “Socioeconomics and neighbor mimicry drive yard and neighborhood vegetation patterns,” in Urban Landscape Ecology: Science, Policy, and Practice, eds. R. A. Francis, J. D. A. Millington and M. Chadwick (London: Routledge), 56–74.
Nassauer, J. I. (2011). Care and stewardship: from home to planet. Landsc. Urban Plan. 100, 321–323. doi: 10.1016/j.landurbplan.2011.02.022
OCM Partners (2020). 2015 Ohio NAIP Digital Ortho Photo Imagery From 2010-06-15 to 2010-08-15. NOAA National Centers for Environmental Information. Available online at: https://inport.nmfs.noaa.gov/inport/item/49522 (accessed May 19, 2020).
Pearsall, H., and Christman, Z. (2012). Tree-lined lanes or vacant lots? Evaluating non-stationarity between urban greenness and socio-economic conditions in Philadelphia, Pennsylvania, USA at multiple scales. Appl. Geogr. 35, 257–264. doi: 10.1016/j.apgeog.2012.07.006
Pham, T.-T.-H., Apparicio, P., Séguin, A.-M., Landry, S., and Gagnon, M. (2012). Spatial distribution of vegetation in Montreal: an uneven distribution or environmental inequity? Landsc. Urban Plan. 107, 214–224. doi: 10.1016/j.landurbplan.2012.06.002
Pincetl, S. (2010). Implementing municipal tree planting: Los Angeles million-tree initiative. Environ. Manag. 45, 227–238. doi: 10.1007/s00267-009-9412-7
Riley, C., Perry, K., Ard, K., and Gardiner, M. (2018). Asset or liability? Ecological and sociological tradeoffs of urban spontaneous vegetation on vacant land in shrinking cities. Sustainability 10:2139. doi: 10.3390/su10072139
Roman, L. A., Pearsall, H., Eisenman, T. S., Conway, T. M., Fahey, R. T., Landry, S., et al. (2018). Human and biophysical legacies shape contemporary urban forests: a literature synthesis. Urban For. Urban Green. 31, 157–168. doi: 10.1016/j.ufug.2018.03.004
Rozick, J. K. (2010). Citizens for Metroparks: A History of the Metropolitan Park District of the Toledo Area. (Dissertation), University of Toledo, Toledo, OH(USA).
Schlosberg, D. (2009). Defining Environmental Justice: Theories, Movements, and Nature. Oxford: Oxford University Press.
Schwarz, K., Berland, A., and Herrmann, D. L. (2018). Green, but not just? Rethinking environmental justice indicators in shrinking cities. Sustain. Cities Soc. 41, 816–821. doi: 10.1016/j.scs.2018.06.026
Seamans, G. S. (2013). Mainstreaming the environmental benefits of street trees. Urban For. Urban Green. 12, 2–11. doi: 10.1016/j.ufug.2012.08.004
Taylor, D. E. (2014). Toxic Communities: Environmental Racism, Industrial Pollution, and Residential Mobility. New York, NY: New York University Press.
Tighe, J. R., and Ganning, J. P. (2015). The divergent city: unequal and uneven development in St. Louis. Urban Geogr. 36, 654–673. doi: 10.1080/02723638.2015.1014673
Troy, A., Nunery, A., and Grove, J. M. (2016). The relationship between residential yard management and neighborhood crime: an analysis from Baltimore City and County. Landsc. Urban Plan. 147, 78–87. doi: 10.1016/j.landurbplan.2015.11.004
US Census Bureau (2020). Data.Census.gov. Available online at: https://data.census.gov/ (accessed May 19, 2020).
Willis, K. J., and Petrokofsky, G. (2017). The natural capital of city trees. Science 356, 374–376. doi: 10.1126/science.aam9724
Wolch, J. R., Byrne, J., and Newell, J. P. (2014). Urban green space, public health, and environmental justice: the challenge of making cities ‘just green enough’. Landsc. Urban Plan. 125, 234–244. doi: 10.1016/j.landurbplan.2014.01.017
Xie, Y., Gong, H., Lan, H., and Zeng, S. (2018). Examining shrinking city of Detroit in the context of socio-spatial inequalities. Landsc. Urban Plan. 177, 350–361. doi: 10.1016/j.landurbplan.2018.03.002
Keywords: shrinking cities, normalized difference vegetation index (NDVI), urban tree canopy, residential vacancy, land abandonment
Citation: Berland A, Locke DH, Herrmann DL and Schwarz K (2020) Beauty or Blight? Abundant Vegetation in the Presence of Disinvestment Across Residential Parcels and Neighborhoods in Toledo, OH. Front. Ecol. Evol. 8:566759. doi: 10.3389/fevo.2020.566759
Received: 28 May 2020; Accepted: 16 September 2020;
Published: 22 October 2020.
Edited by:
Stephanie Pincetl, University of California, Los Angeles, United StatesReviewed by:
James J. T. Connolly, Autonomous University of Barcelona, SpainFederico Morelli, Czech University of Life Sciences Prague, Czechia
Katherine Lieberknecht, University of Texas at Austin, United States
Copyright © 2020 Berland, Locke, Herrmann and Schwarz. This is an open-access article distributed under the terms of the Creative Commons Attribution License (CC BY). The use, distribution or reproduction in other forums is permitted, provided the original author(s) and the copyright owner(s) are credited and that the original publication in this journal is cited, in accordance with accepted academic practice. No use, distribution or reproduction is permitted which does not comply with these terms.
*Correspondence: Adam Berland, amberland@bsu.edu