 Xue Qiu
 Jinyan Lin
 Bixiao Liang
 Yanbing Chen
 Guoqun Liu
 Jing Zheng
- 1Department of Cardiology, The First Affiliated Hospital of Guangxi Medical University, Nanning, China
- 2The First Clinical Medical School, Guangxi Medical University, Nanning, China
Objective: The aim of this study is the identification of hub genes associated with idiopathic pulmonary arterial hypertension (IPAH).
Materials and Methods: GSE15197 gene expression data was downloaded from the Gene Expression Omnibus (GEO) database. Differentially expressed genes (DEGs) were identified by screening IPAH patients and controls. The 5,000 genes with the greatest variances were analyzed using a weighted gene co-expression network analysis (WGCNA). Modules with the strongest correlation with IPAH were chosen, followed by a functional enrichment analysis. Protein–protein interaction (PPI) networks were constructed to identify hub gene candidates using calculated degrees. Real hub genes were found from the overlap of DEGs and candidate hub genes. microRNAs (miRNAs) targeting real hub genes were found by screening miRNet 2.0. The most important IPAH miRNAs were identified.
Results: There were 4,395 DEGs identified. WGCNA indicated that green and brown modules associated most strongly with IPAH. Functional enrichment analysis showed that green and brown module genes were mainly involved in protein digestion and absorption and proteoglycans in cancer, respectively. The top ten candidate hub genes in green and brown modules were identified, respectively. After overlapping with DEGs, 11 real hub genes were identified: EP300, MMP2, CDH2, CDK2, GNG10, ALB, SMC2, DHX15, CUL3, BTBD1, and LTN1. These genes were expressed with significant differences in IPAH versus controls, indicating a high diagnostic ability. The miRNA–gene network showed that hsa-mir-1-3p could associate with IPAH.
Conclusion: EP300, MMP2, CDH2, CDK2, GNG10, ALB, SMC2, DHX15, CUL3, BTBD1, and LTN1 may play essential roles in IPAH. Predicted miRNA hsa-mir-1-3p could regulate gene expression in IPAH. Such hub genes may contribute to the pathology and progression in IPAH, providing potential diagnostic and therapeutic opportunities for IPAH patients.
Introduction
Idiopathic pulmonary arterial hypertension (IPAH) is a pulmonary proliferative vasculopathy (Gallo de Moraes et al., 2016). Pathological changes including plexiform lesions, cellular proliferation, fibrosis, in situ thrombosis of the small pulmonary arteries and arterioles, and angiogenic dysfunction, leading to increased pulmonary vascular resistance, result in IPAH (Barnes et al., 2019). The incidence of IPAH is approximately four to six per million globally. When left untreated, IPAH eventually leads to right heart failure and death (Pahal and Sharma, 2020). IPAH remains intractable, with a 51% 5-year survival rate (Barnes et al., 2019). In the last 20 years, new therapies have been developed, improving hemodynamics and long-term prognosis (Wang Y. et al., 2019). For those not sensitive to therapy, surgery such as atrial septostomy and lung transplantation are options, although the prognosis is poor (Pahal and Sharma, 2020).
Many genes and microRNAs (miRNAs) have been shown to be involved in IPAH. A meta-analysis suggested the serotonin transporter (SERT) is associated with IPAH risk, and those with long genotypes have greater incidence of IPAH than those with short genotypes (Zhang et al., 2013). Mutations in the human bone morphogenetic protein 9 (BMP9) gene reduced anti-apoptosis in pulmonary arterial endothelial cells (Wang X. J. et al., 2019). A greater expression of miR-199b-5p accelerated hemodynamics and pulmonary vascular remodeling (Wu et al., 2016). Silencing of miR23a increased the expression of PGC1α, leading to IPAH progression (Sarrion et al., 2015). However, the genetic mechanisms underlying IPAH pathology remain unclear. More studies are required to explore the pathogenesis, potential drug targets, and diagnostic biomarkers of IPAH.
A systems biology analysis of gene expression and regulation has become an effective method for exploring disease pathogenesis. A weighted gene co-expression network analysis (WGCNA) can identify correlations between genes and microarray samples (Wang T. et al., 2019). Clustering genes with similar expression profiles can identify the association of genes and clinical traits. Thus, WGCNA can be used to find hub genes associated with a specific disease, including cardiovascular disease (Zheng et al., 2020) and cancer (Hu et al., 2020; Shi et al., 2021).
Although cardiovascular disease is well studied, there are few bioinformatics analyses of IPAH. Here, a co-expression network was constructed to identify genes related to IPAH pathogenesis, providing new routes to diagnose and treat IPAH. This study should provide novel biomarkers associated with IPAH pathogenesis and progression, which may be useful as potential therapeutic targets in IPAH. The flow diagram of the work is shown in Figure 1.

Figure 1. Flow chart for this study. miRNA, microRNA.
Materials and Methods
Data Sources
Microarray expression data (GSE15197) was downloaded from the Gene Expression Omnibus (GEO)1 database, representing a GPL6480 Agilent-014850 Whole Human Genome Microarray 4 × 44K G4112F (Probe Name version). GSE15197 includes 31 lung tissue specimens from 18 IPAH patients and 13 normal controls. Subject characteristics are presented in Supplementary Table 1. Platform information and probe annotation were extracted for additional analysis.
Data Preprocessing and Differentially Expressed Genes Screening
The downloaded gene expression data (GSE15197.txt) was preprocessed using k-nearest neighbor (KNN) to supplement missing values. Expression levels were then normalized using a log2 transformation. When multiple probes map to the same gene, the average value was retained as the expression level. After pooling unmatched probes, 17,540 mRNAs were accessed. These samples were divided between IPAH and control groups. Differently expressed mRNAs (DEmRNAs) were screened using the limma package in R3.5.3 (Ritchie et al., 2015). A false discovery rate and the Benjamini–Hochberg method (Fu et al., 2014) were used to calculate fold changes (FC). | Log2FC| > 0.5 and adjusted p-value < 0.05 were used as thresholds.
Weighted Gene Co-expression Network Analysis
To maintain sample diversity, the top 5,000 genes with the greatest variance between IPAH and normal controls were used to construct a co-expression network using the WGCNA package in R3.5.3 (Li et al., 2020; Tutorials for Wgcna R package, 2020; Zhang and Horvath, 2005). The “hclust” function was used for sample cluster analysis. Samples with heights over 115 were regarded as outliers. Other samples were used for calculating Pearson’s correlation coefficients. Scale independence and mean connectivity were calculated using the gradient method, with power values between 1 and 20. An appropriate soft threshold power of β was selected to meet the standard of a scale-free network (scale-free R2 ≥ 0.80) (Langfelder and Horvath, 2008) and ensure the network with enough information. The adjacency matrix was transformed into a topological overlap measure (TOM) matrix, which helped estimate the connectivity properties of the network (Iancu et al., 2015). Subsequently, the dynamic branch-cutting method was used to identify gene modules. Genes with similar gene expression profiles were placed in the same module. Each module contained genes with a minimum size of 30. The correlation between module eigengenes and clinical traits was analyzed and displayed as a heatmap. Modules that correlated most significantly with disease status were treated as key modules of IPAH. Gene significance (GS) represented the association between gene expression and each trait. Module membership (MM) was the correlation between gene expression and each module eigengene. The correlation between MM and GS was calculated using Pearson correlation analysis to validate module–trait associations (Zhang and Horvath, 2005).
Functional Enrichment Analysis of Genes in the Key Module
Key modules showing the strongest correlations with IPAH were chosen for further analysis. The gene complement of each key module was examined using Gene Ontology (GO) and the Kyoto Encyclopedia of Genes and Genomes (KEGG) pathway enrichment analysis using the GEne SeT Analysis Toolkit2. The GO analysis annotates gene function at three levels: biological process (BP), cellular component (CC), and molecular function (MF). P < 0.05 was taken as statistically significant. The top 10 enriched items from each GO category and from KEGG were displayed using bubble charts.
Identification of Protein–Protein Interaction Networks
To explore the potential roles of hub genes in the pathogenesis of IPAH, we used genes from all key modules to construct protein–protein interaction (PPI) networks using the STRING database3 (version 11.0). Cytoscape3.6.1 software was used for visualization and analysis (Shannon et al., 2003). Nodes represent proteins. Edges between nodes indicate the evidence of the supposed relationship between distinct nodes. The more and stronger connections a node has, the more likely it is to have an important role in IPAH pathogenesis. Cytoscape3.6.1 provides 11 methods for calculating the connections between nodes. Degree was chosen to represent connections between nodes. Genes with the top 10 degree in key modules were considered candidate hub genes.
Identification of Real Hub Genes and Statistical Analysis
To increase the biological significance of candidate hub genes, we sought overlaps between candidates and differentially expressed genes (DEGs) to find real hub genes. Student’s t-tests were used to assess expression differences of 11 hub genes between IPAH and controls. Receiver operating characteristic (ROC) curves were used to evaluate the diagnostic ability of hub genes, with the area under the curve (AUC) representing sensitivity and specificity. All P-values were two sided. P < 0.05 was taken as statistically significant. Statistical analysis was performed using GraphPad Prism 8.0 (GraphPad Statistics Guide, 2020) and MedCalc 19.5.1 (Schoonjans et al., 1995).
Construction of Potential miRNA-Target Regulatory Networks
We used miRNet 2.04 to search for miRNAs targeting real hub genes and visualized the miRNA-target regulatory network (Fan et al., 2016). miRNAs with degrees 3 or above are shown.
Results
DEGs Screening
There were 4,395 differently expressed genes between IPAH and controls. This included 2,529 upregulated and 1,866 downregulated genes. The top 20 DEGs are listed in Supplementary Table 2.
Construction and Analysis of Co-expression Network
The top 5,000 genes were selected for construction of a co-expression network. Results of the cluster analysis are shown in Figure 2A. After clustering, GSM379320 was identified as an outlier, so has been excluded. The other 30 samples were used to construct a WGCNA network. To ensure a scale-free network and greater mean connectivity, a power of β = 6 was chosen (Figure 2B). As shown in Figure 2C, 18 gene modules were identified using the dynamic branch-cutting approach, with a merge cut height of 0.25. Genes in the same module had similar expression profiles. From the module–trait relationships analysis (Figure 2D), we found that the green (r = 0.74, p < 0.001), blue (r = 0.59, p < 0.001), black (r = 0.58, p < 0.001), and brown modules (r = −0.60, p < 0.001) were strongly related to the IPAH disease status. The green module had the strongest positive relation with IPAH, and the brown module had the strongest negative relation. We considered these two modules as the key IPAH modules, selecting them for further analysis. Associations between MM and GS for disease status were calculated. Significant correlations between MM and GS for IPAH in the green and brown modules are presented in Figures 3A,B.
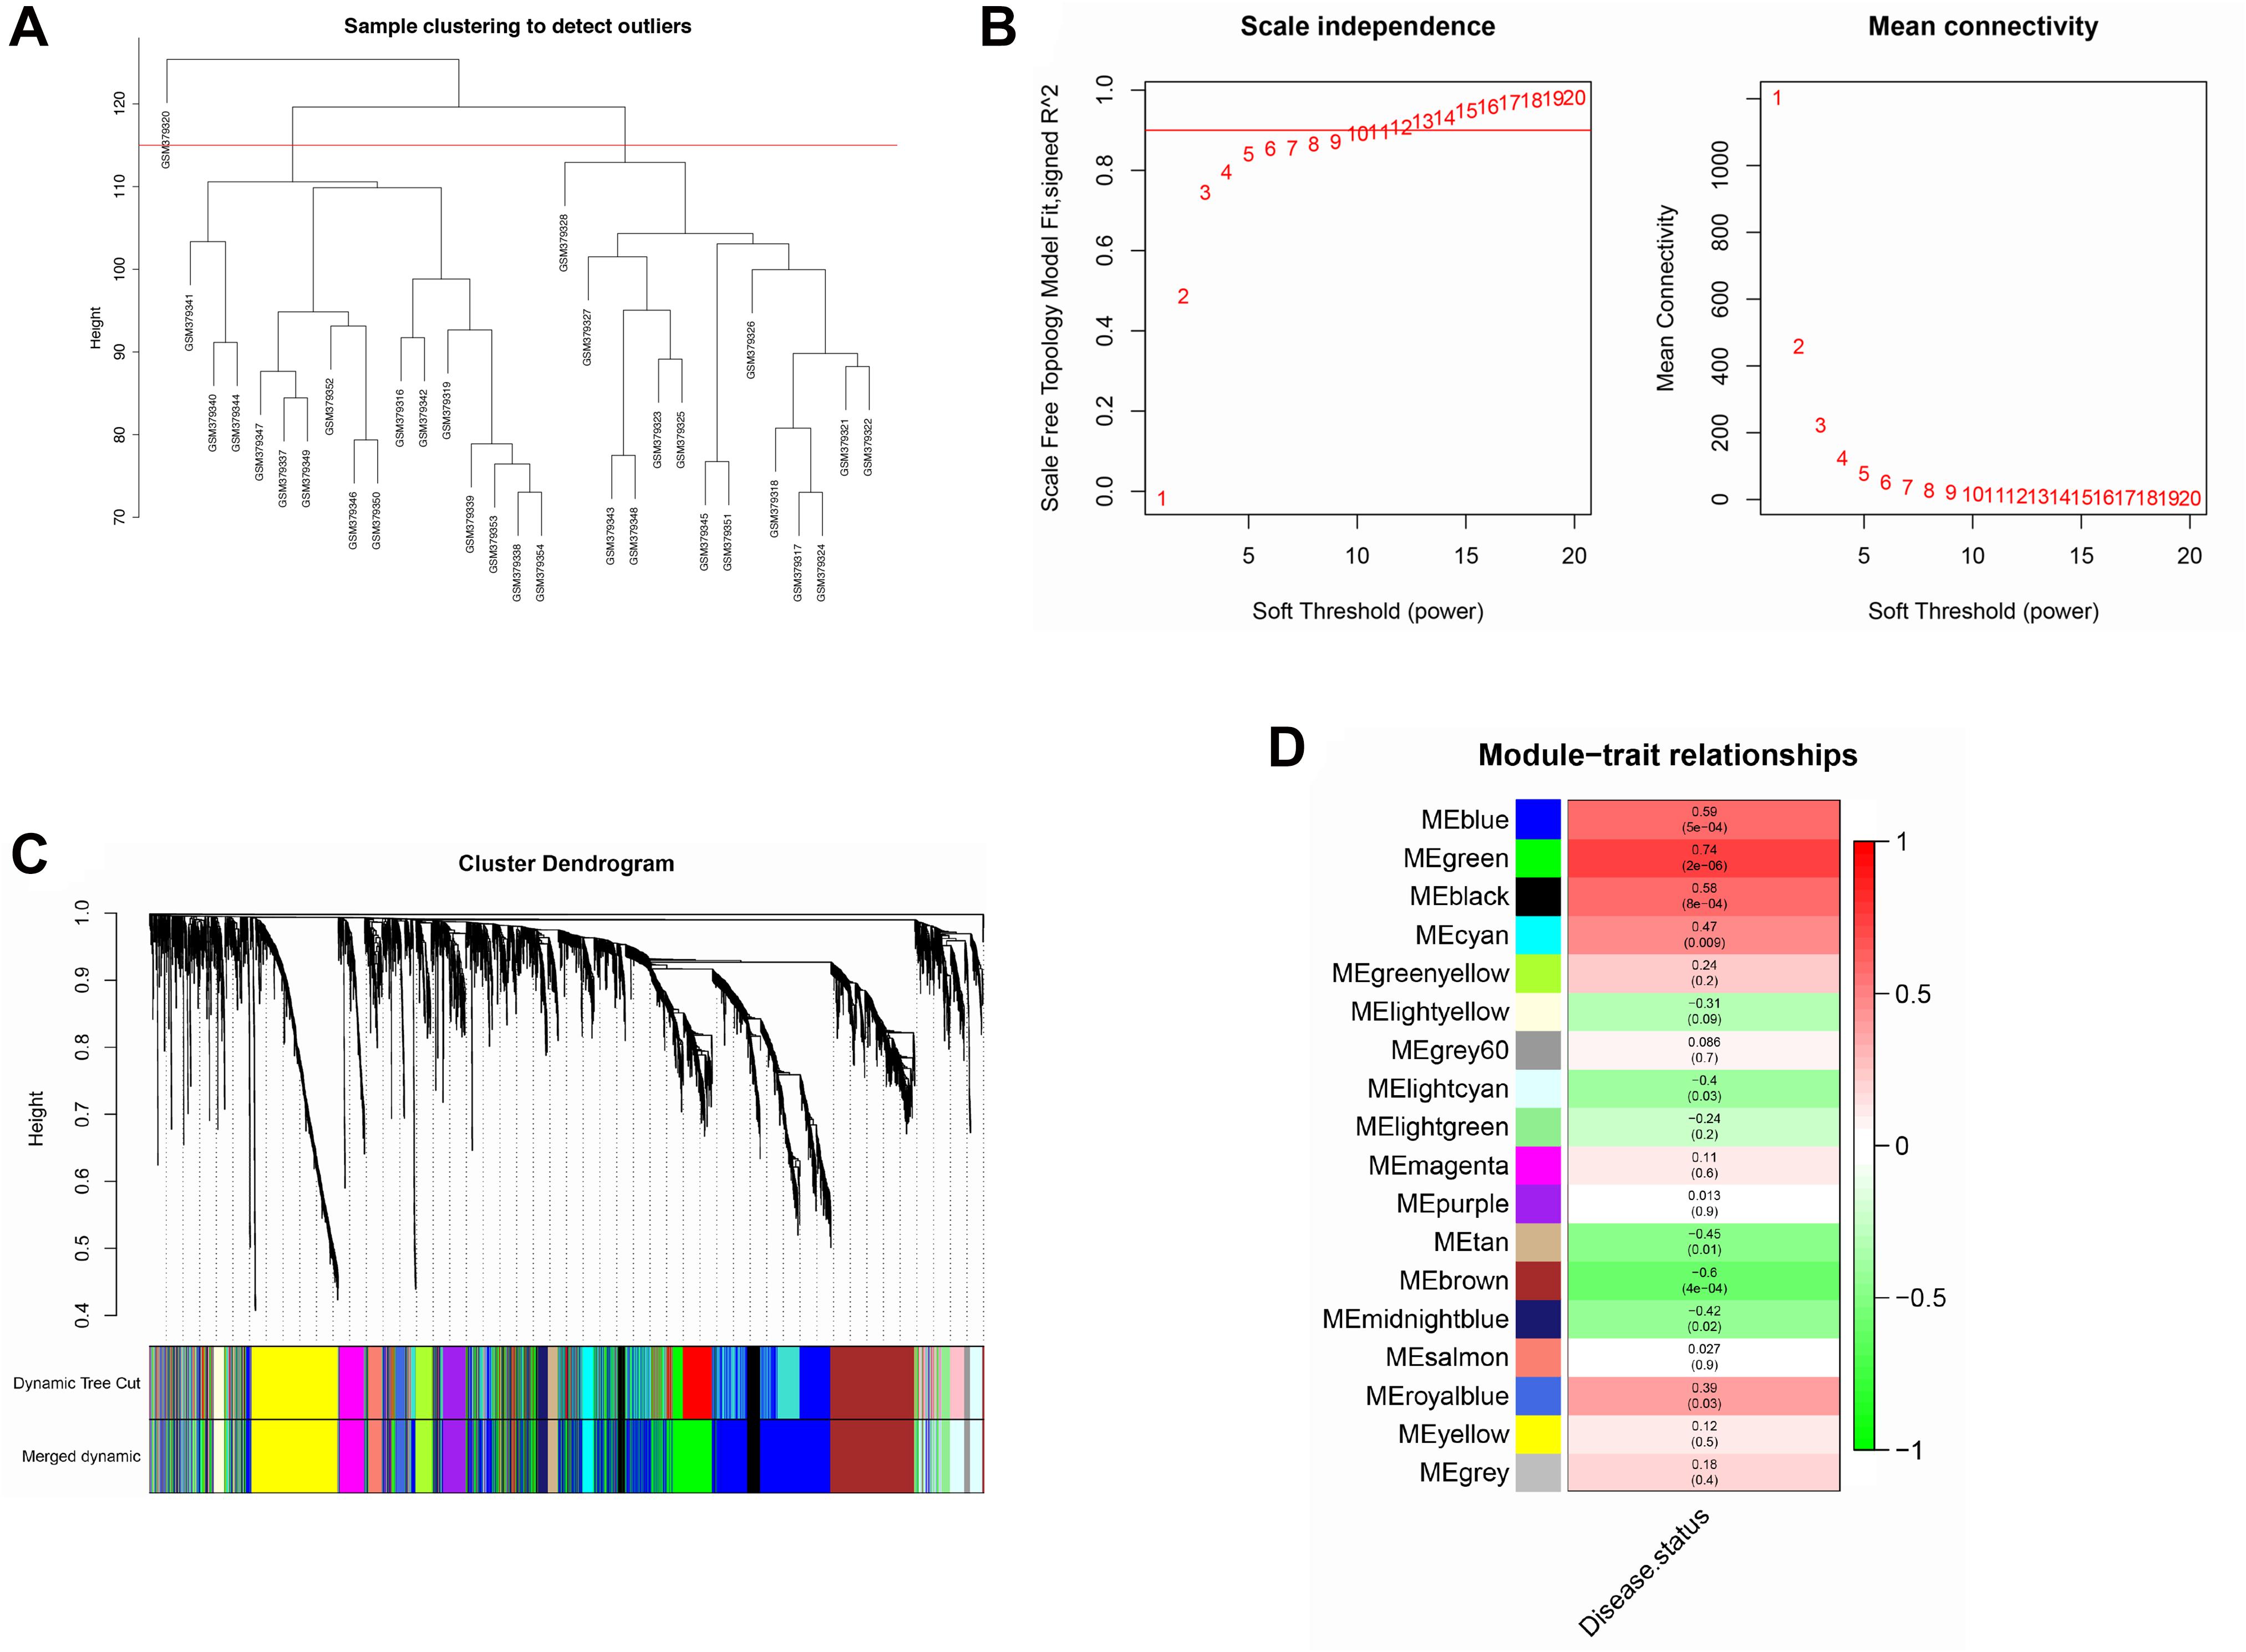
Figure 2. Construction of co-expression network. (A) Sample clustering analysis based on GSE15197. (B) Analysis of network topology for various soft-thresholding powers. (C) Clustering dendrogram of genes. Genes with similar expression patterns divided into same module. Each line of hierarchical clustering represents one gene. (D) Module–trait associations. Each cell contains the corresponding correlation and P-value.
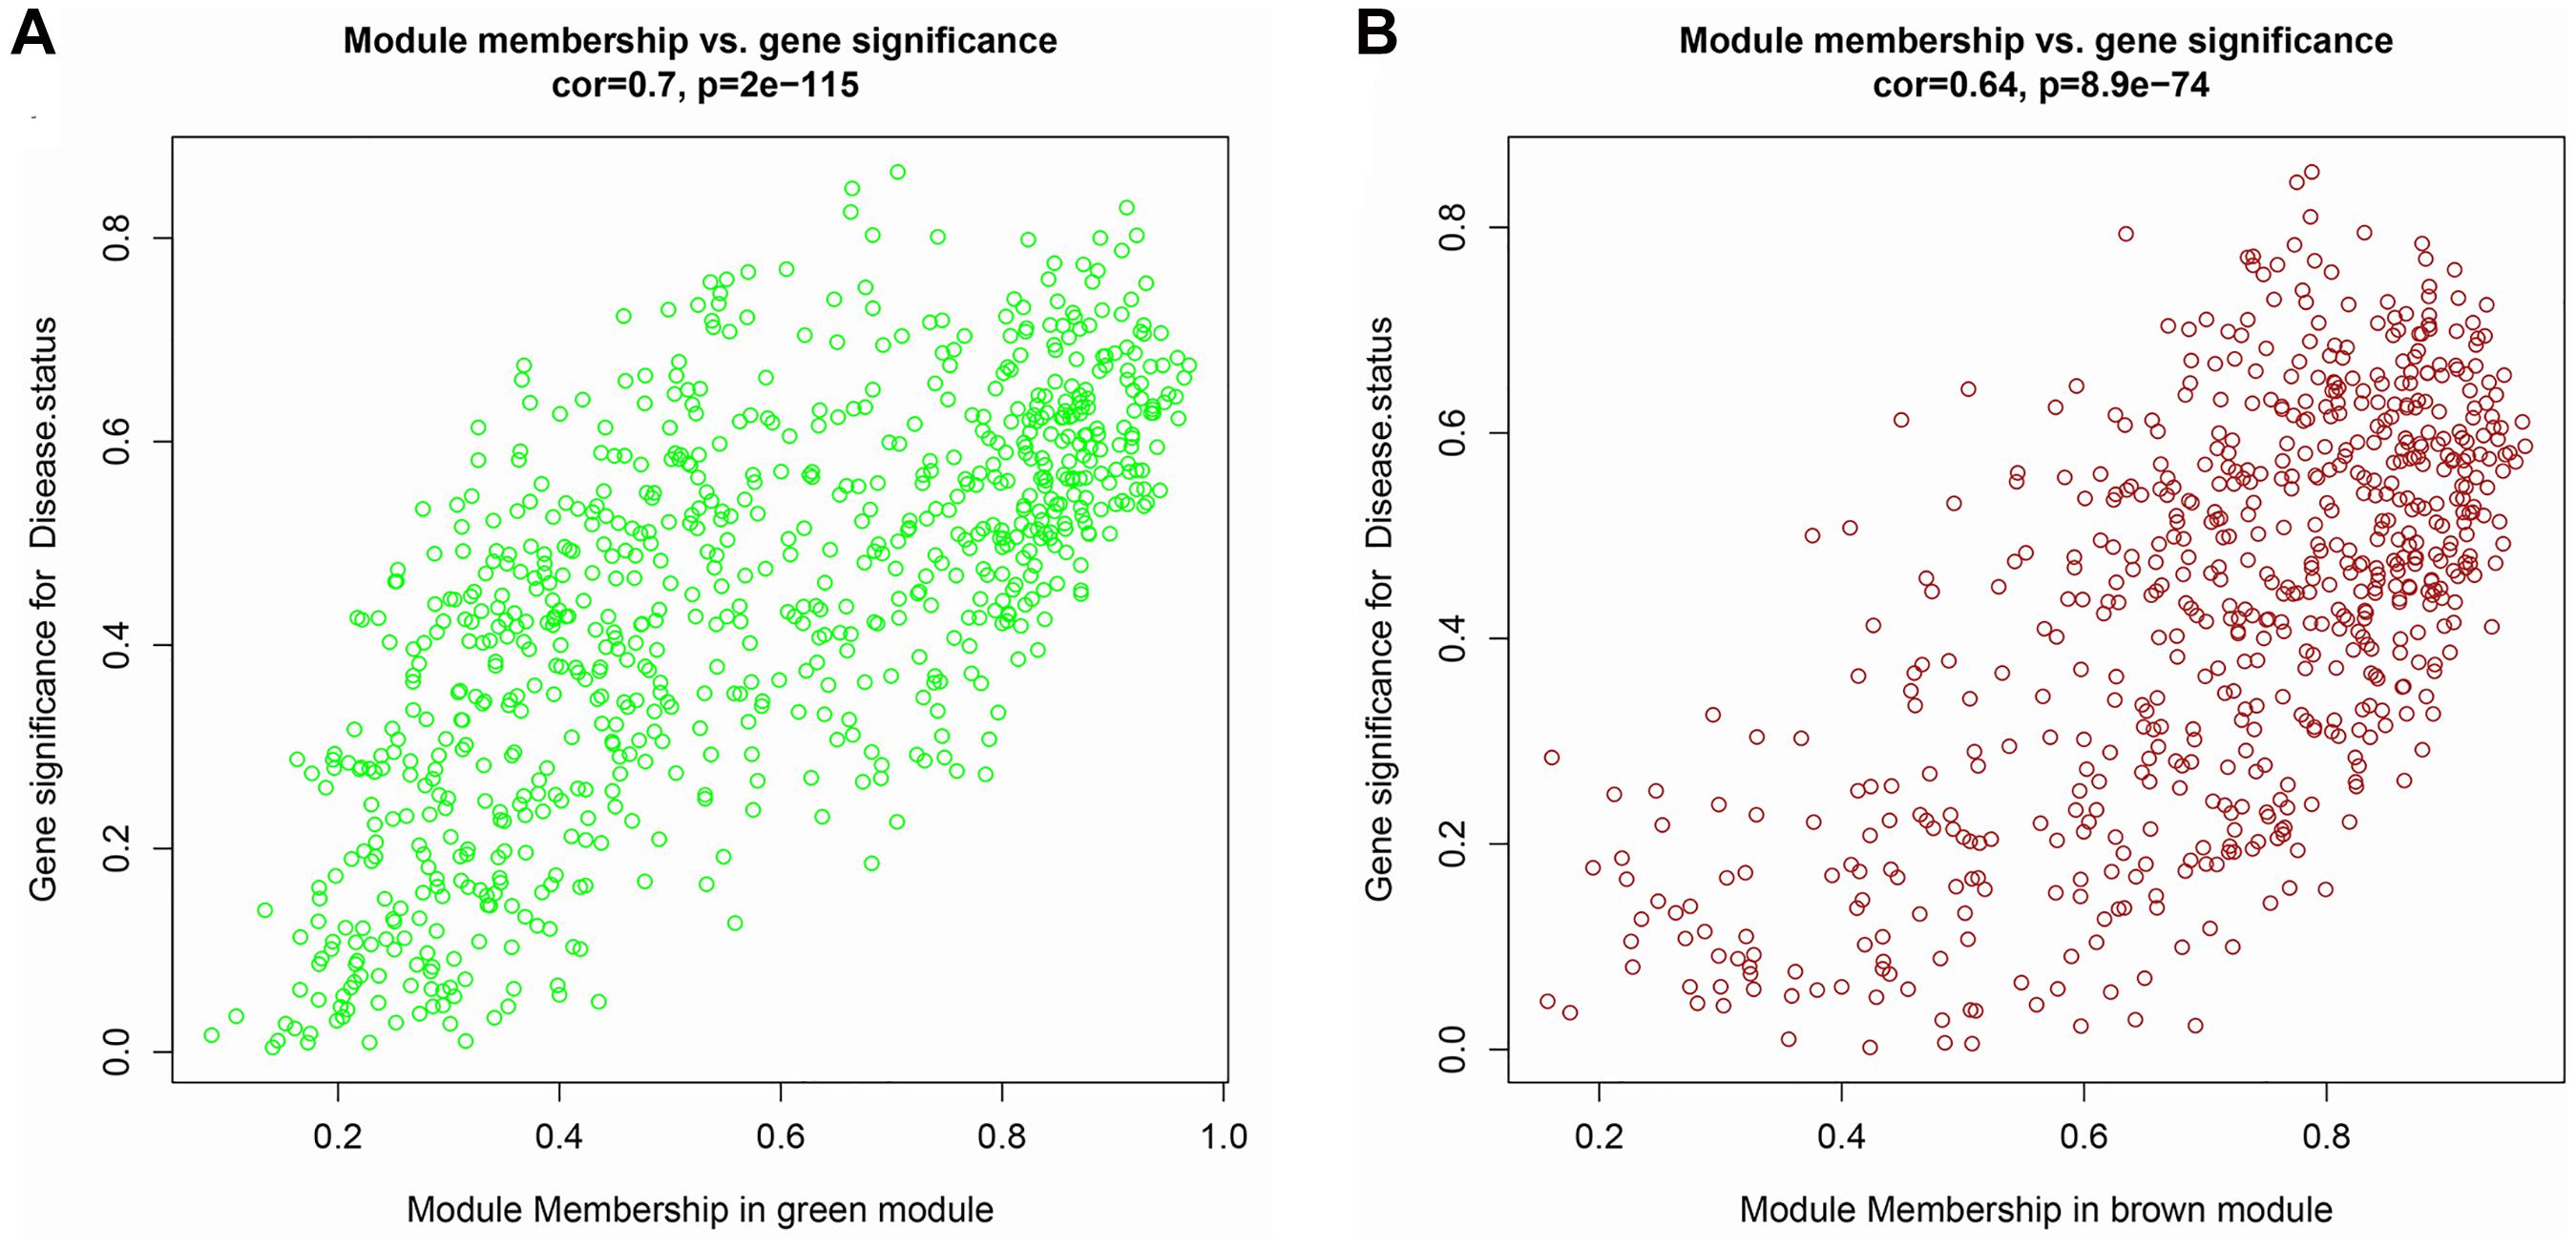
Figure 3. Scatter plot of module membership (MM) vs. gene significance (GS) in (A) green and (B) brown modules. MM presents the correlation between gene expression and each module eigengene. GS represents the association between gene expression and each trait. In both modules, GS and MM have a high correlation.
Functional Enrichment Analysis of Genes in the Green and Brown Modules
Genes in the green and brown modules were analyzed using GO and KEGG enrichment analysis. As shown in Figure 4, the results of GO analysis indicated that the green module genes were primarily associated with tissue development, extracellular matrix, and signaling receptor binding. KEGG analysis suggested that the green module genes were mainly enriched with protein digestion and absorption. GO enrichment results indicated that the brown module genes were significantly associated with kinetochore organization, the perinuclear region of the cytoplasm, and DNA-binding transcription factor activity. Moreover, KEGG analysis suggested that the brown module genes were mainly enriched in proteoglycans in cancer (Figure 5).
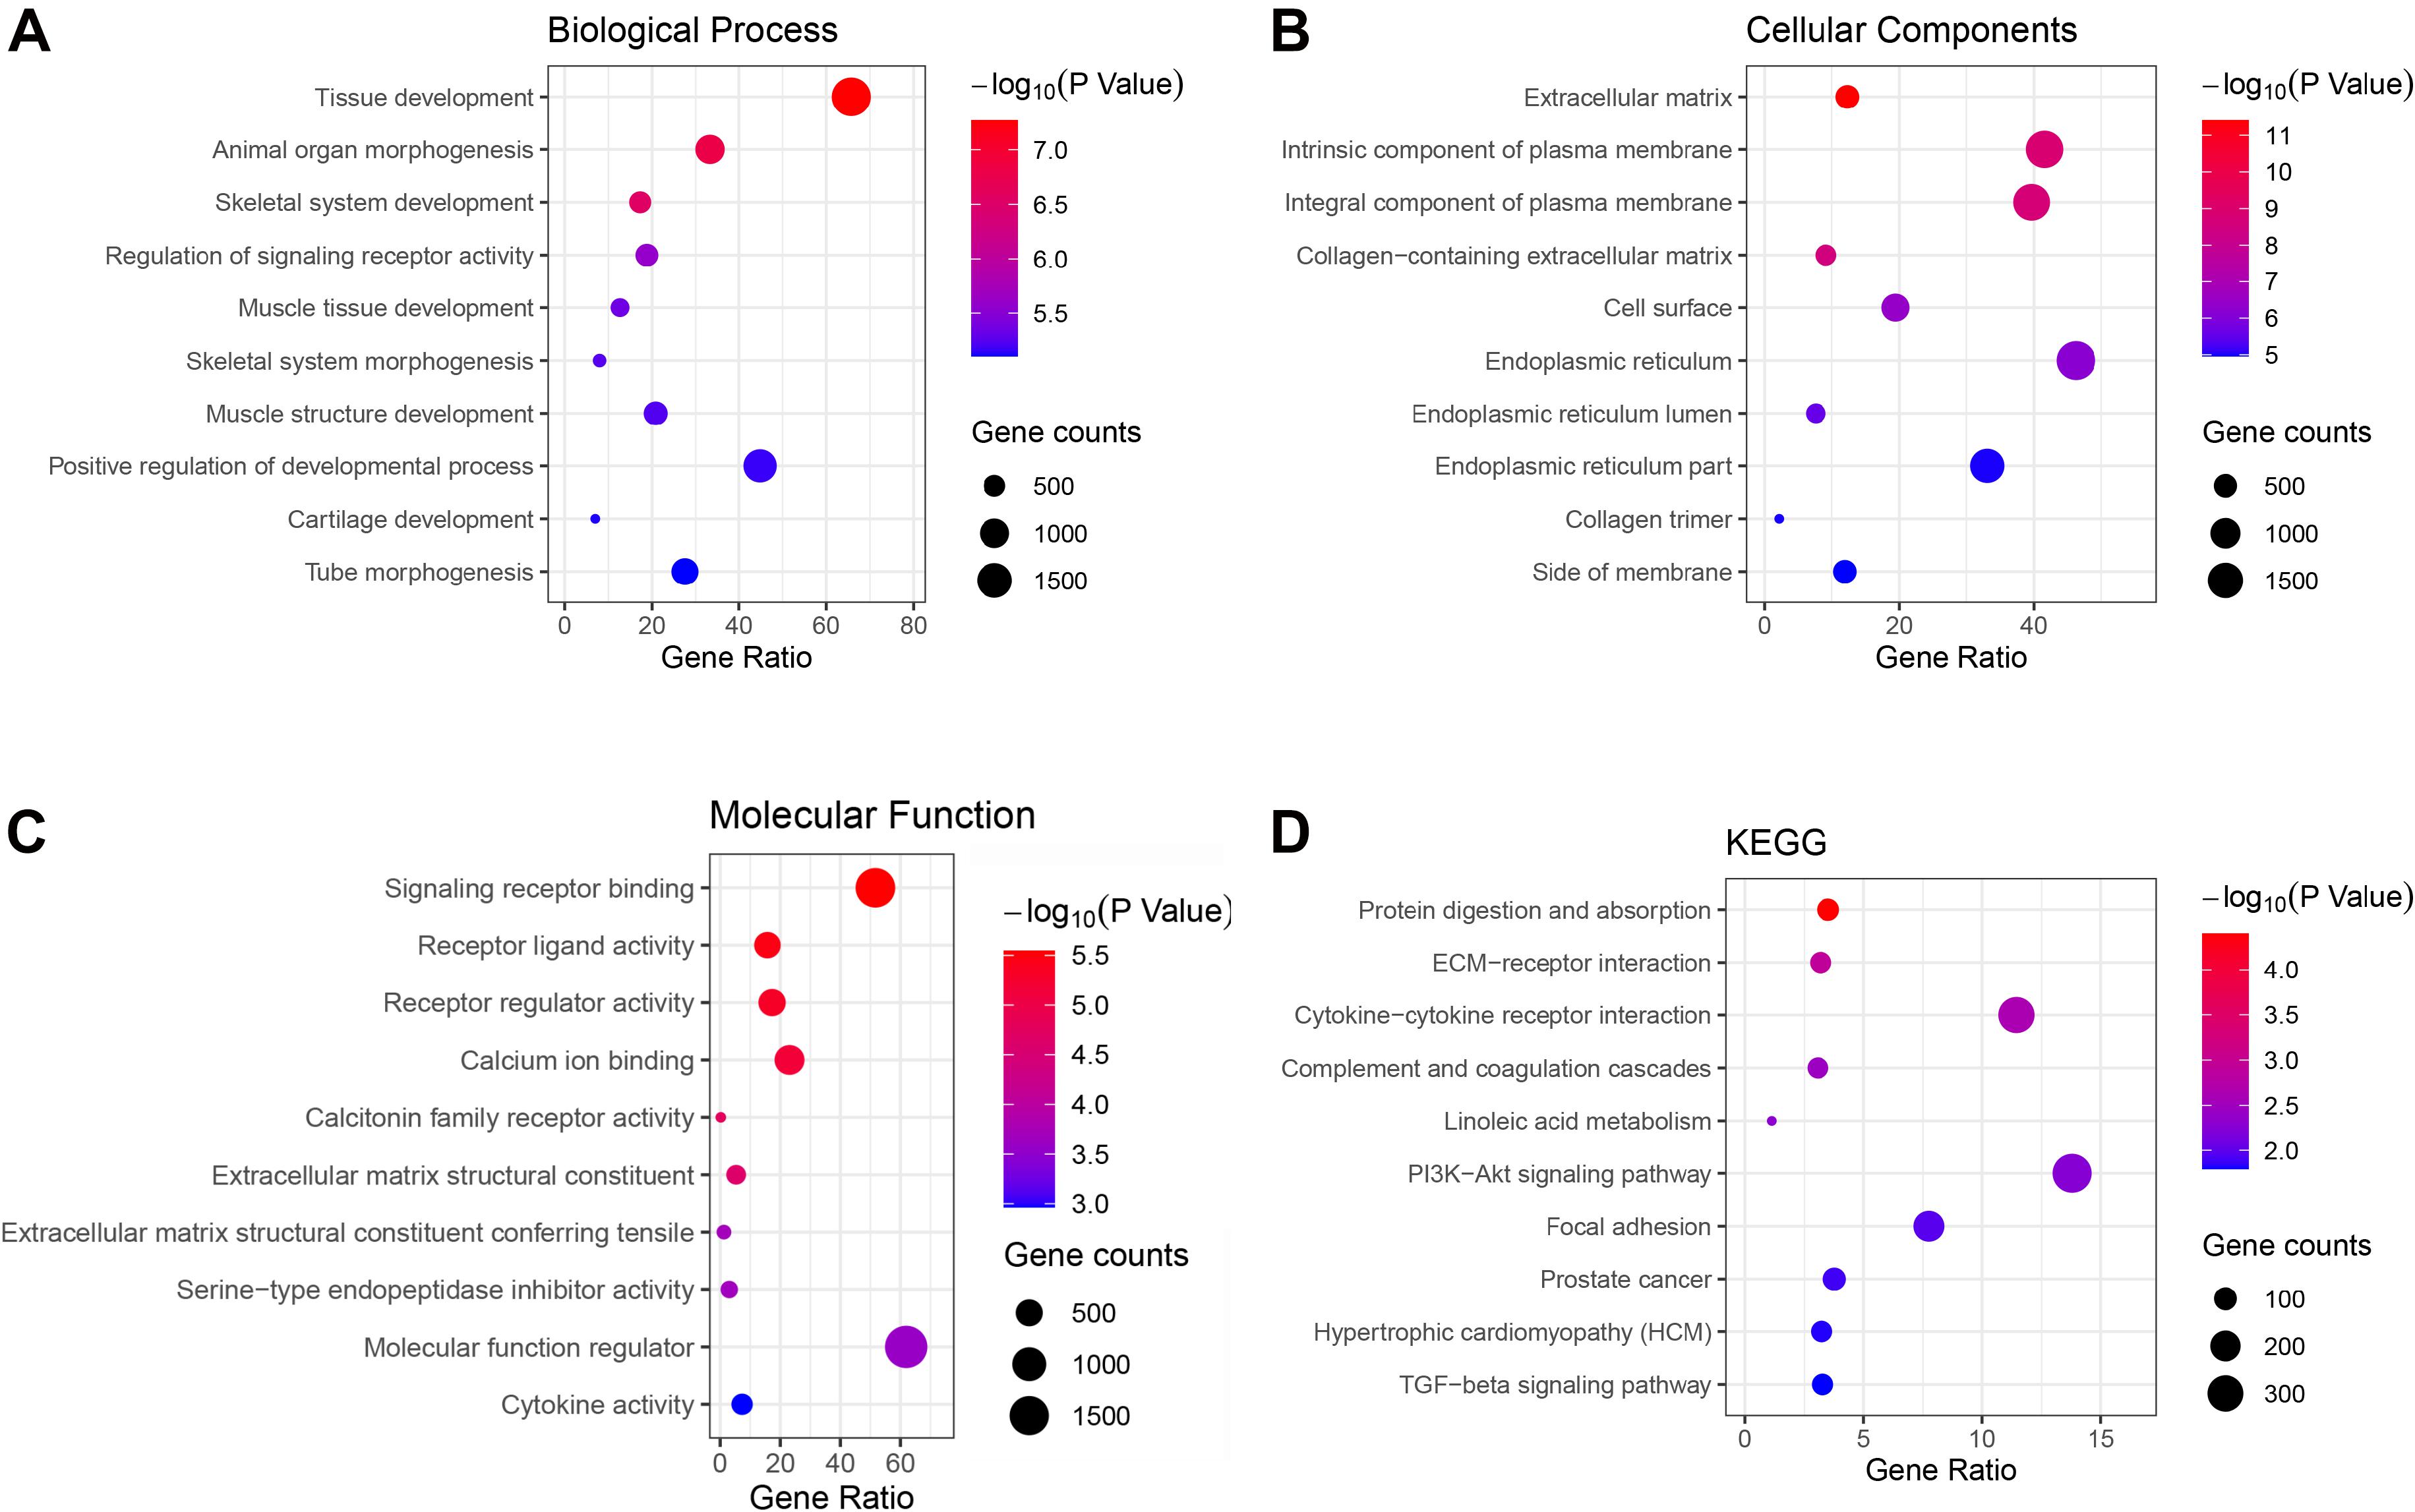
Figure 4. Gene Ontology (GO) terms in (A) biological process, (B) cellular component, (C) molecular function, and (D) the Kyoto Encyclopedia of Genes and Genomes (KEGG) pathway of genes in the green module.
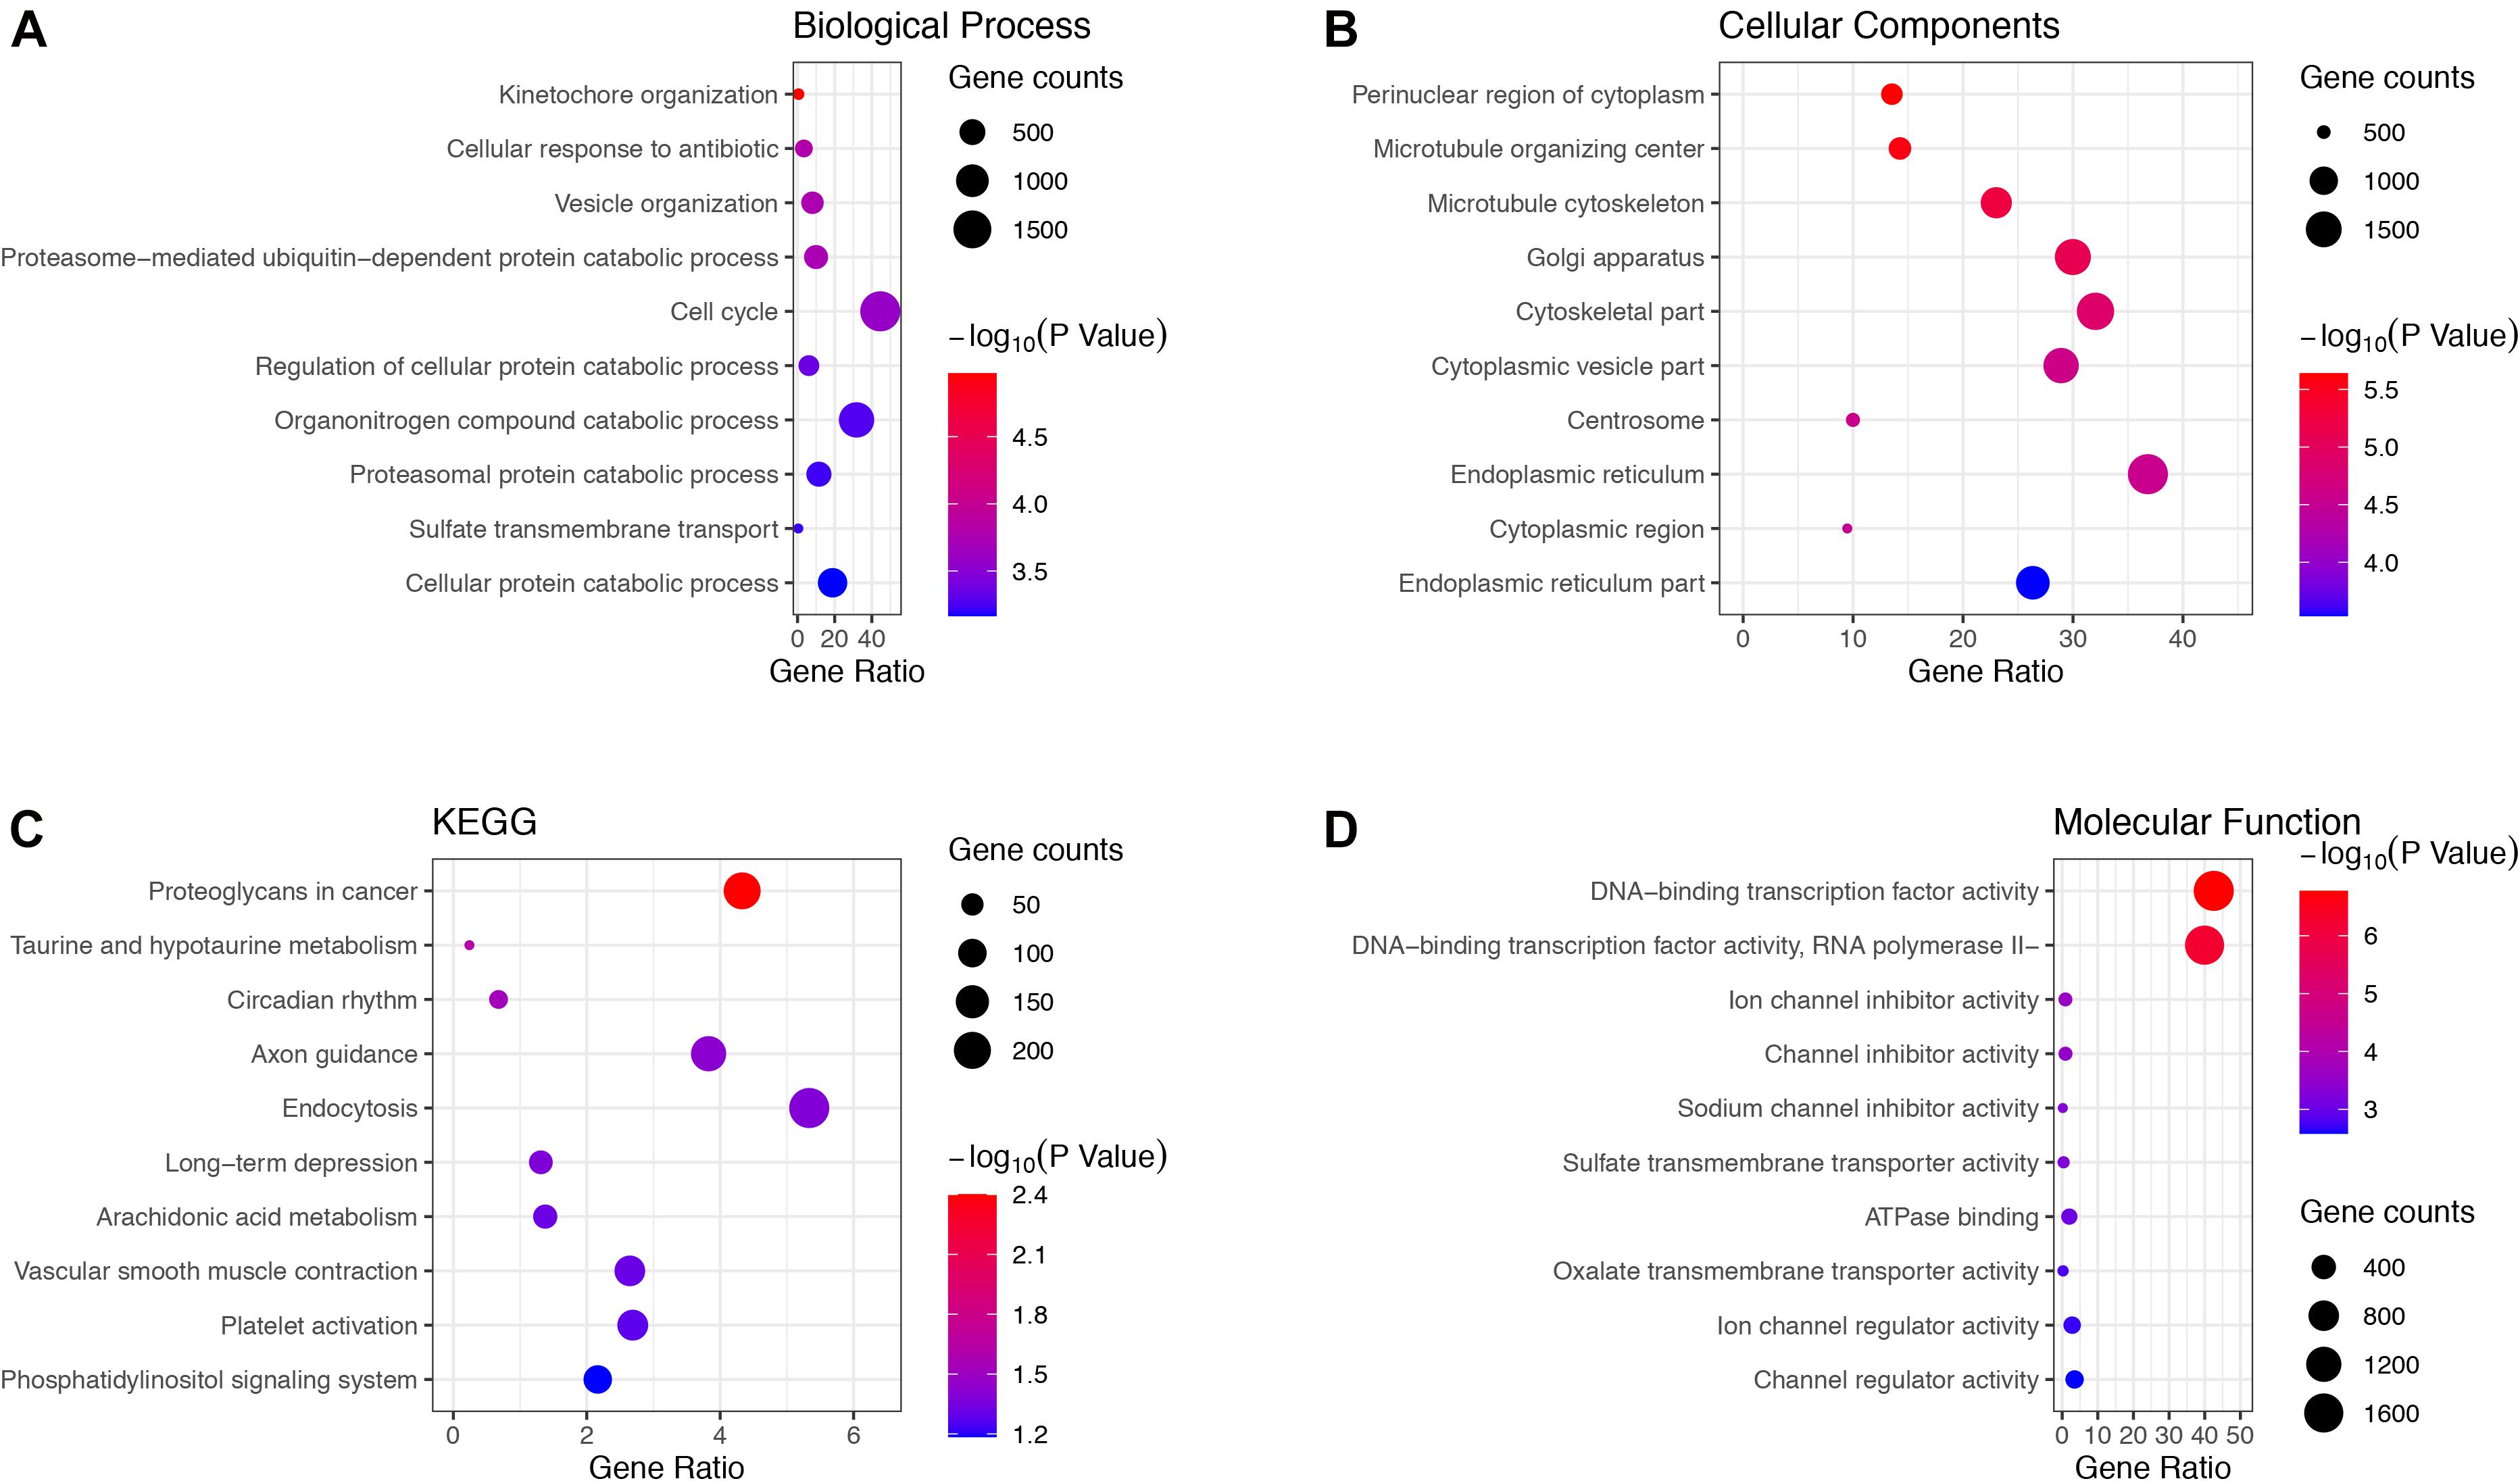
Figure 5. Gene Ontology terms in (A) biological process, (B) cellular component, (C) molecular function and, (D) KEGG pathway of genes in the brown module.
PPI Network Analysis of Genes in the Green and Brown Modules
Green and brown module genes were used to construct a PPI network using the STRING database. The combined score was > 0.4. The top 100 genes from the green and brown modules as ranked by degree were visualized using Cytoscape3.6.1 (Figure 6). The 10 genes with the highest degree from each module were considered candidate IPAH hub genes.
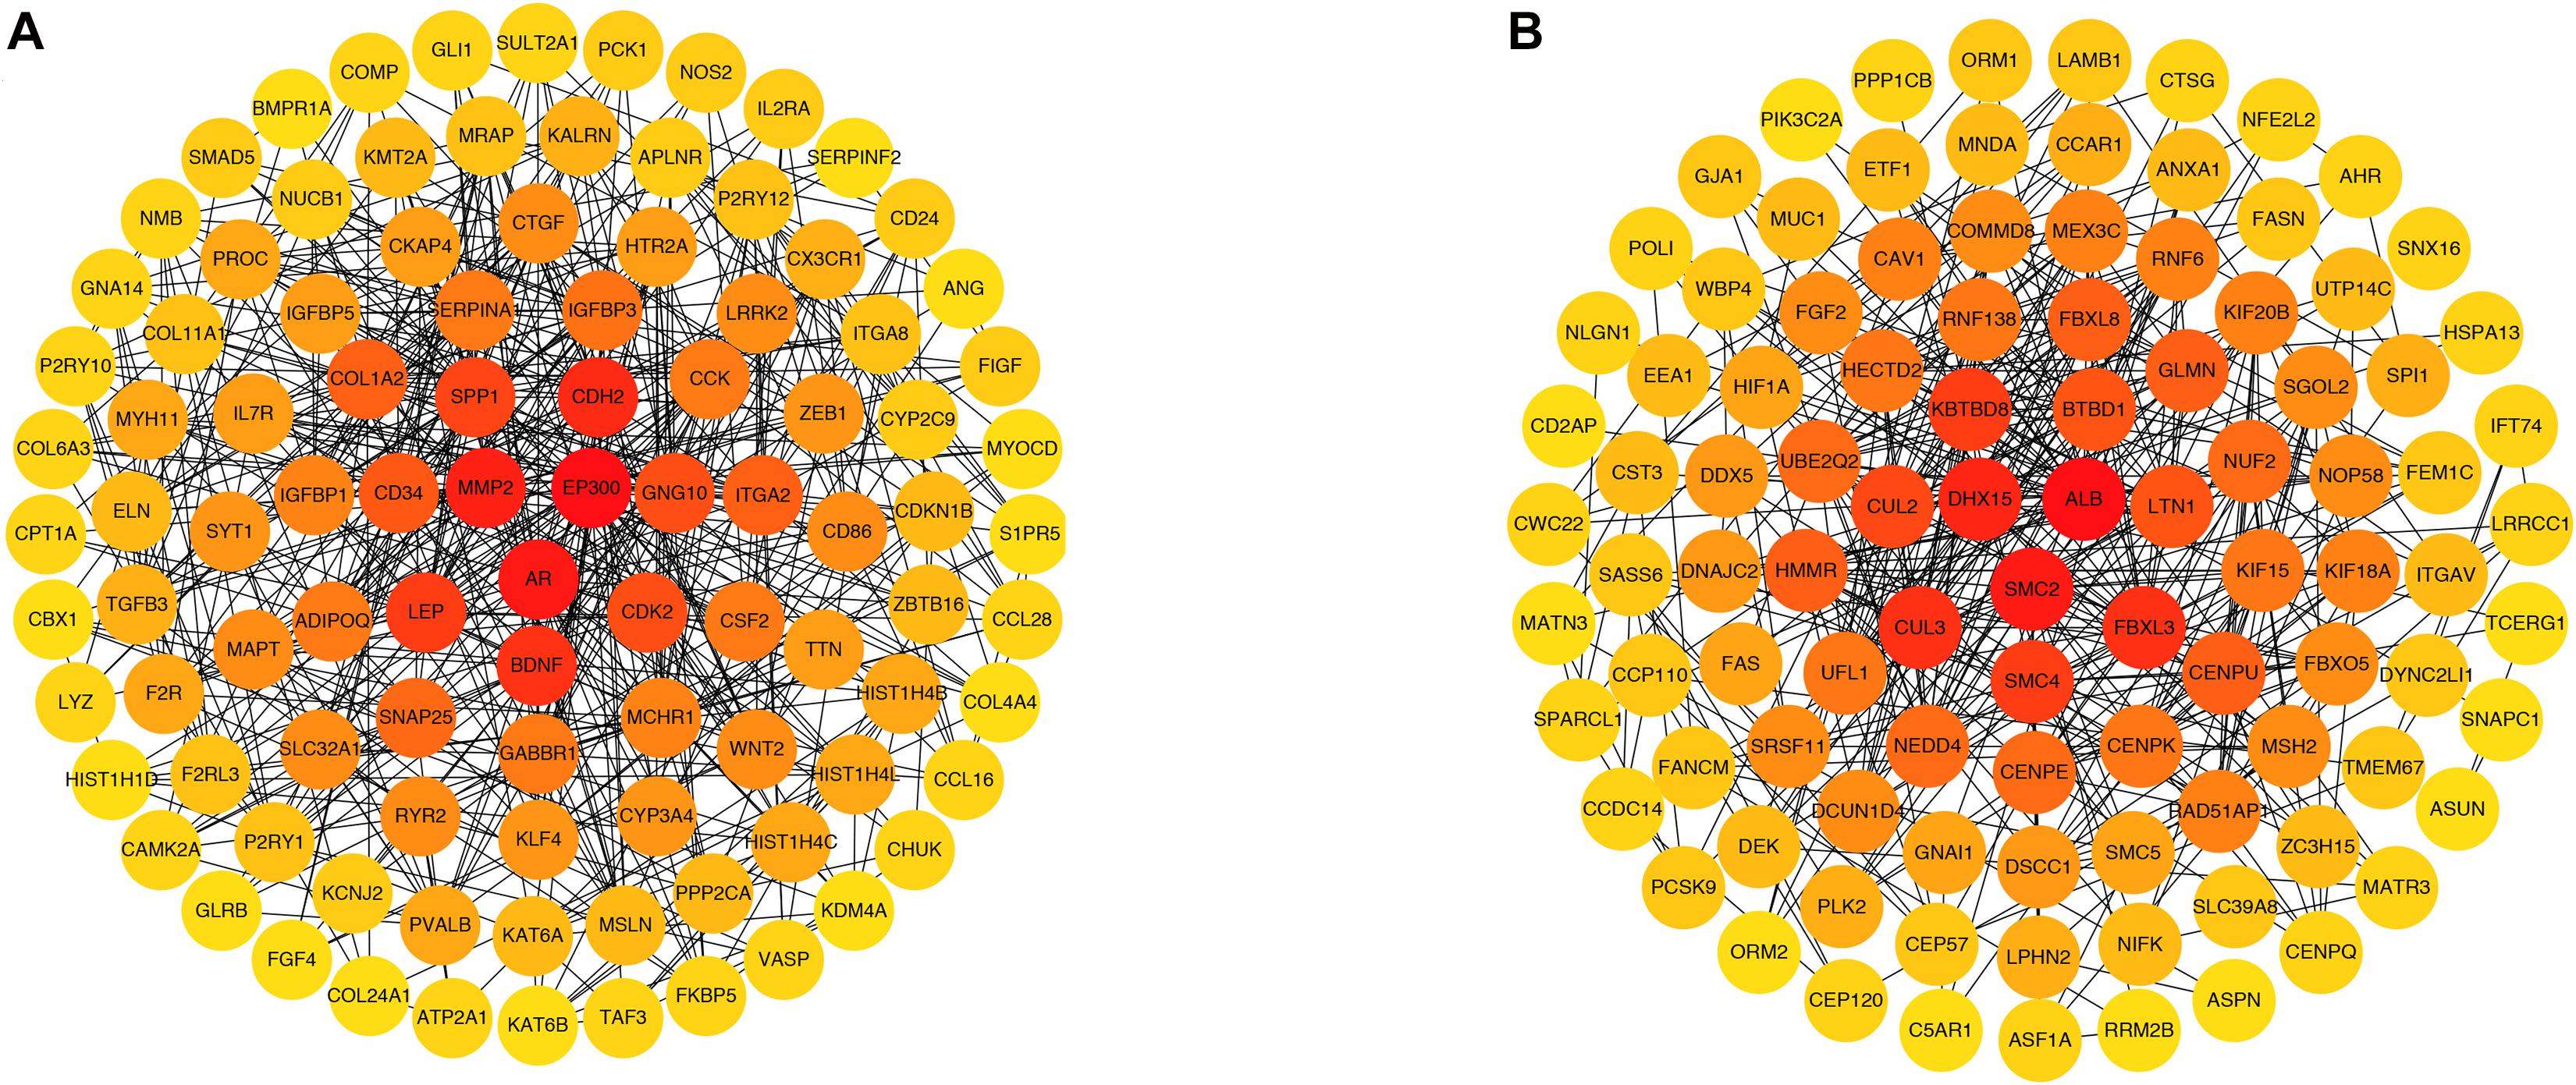
Figure 6. Protein–protein interaction networks of genes in (A) green and (B) brown modules. Each node represents a gene, and each node is connected by a degree. The color changes from red to yellow as one moves from the inside toward the outside, and the degree decreases from red to yellow. The genes with top 100 degrees and genes with the same degrees as the 100th gene were also presented.
In the green module, candidate hub genes were as follows: E1A binding protein p300 (EP300, degree 51); androgen receptor (AR, degree 39); matrix metallopeptidase 2 (MMP2, degree 36); cadherin 2 (CDH2, degree 35); brain-derived neurotrophic factor (BDNF, degree 33); leptin (LEP, degree 32); secreted phosphoprotein 1 (SPP1, degree 30); cyclin-dependent kinase 2 (CDK2, degree 27); G protein subunit gamma 10 (GNG10, degree 27); and CD34 (CD34, degree 26).
In the brown module, the candidate hub genes included the following: albumin (ALB, degree 37), structural maintenance of chromosomes 2 (SMC2, degree 24); DEAH-box helicase 15 (DHX15, degree 22); cullin 3 (CUL3, degree 21); F-box and leucine rich repeat protein 3 (FBXL3, degree 21); kelch repeat and BTB domain containing 8 (KBTBD8, degree 20); structural maintenance of chromosomes 4 (SMC4, degree 20); cullin 2 (CUL2, degree 19); BTB domain containing 1 (BTBD1, degree 18); and listerin E3 ubiquitin protein ligase 1 (LTN1,degree 18).
Identification and Verification of Real Hub Gene Expression and ROC Curve Analysis
After overlapping with DEGs, we selected 11 real hub genes: EP300, MMP2, CDH2, CDK2, GNG10, ALB, SMC2, DHX15, CUL3, BTBD1, and LTN1 (see Supplementary Table 3). As shown in Figure 7, the expression level differences in real hub genes were statistically significant. EP300 and CDH2 were highly expressed in IPAH patients. Other hub genes showed a greater expression in controls. ROC curve analysis indicated that 11 real hub genes discriminated strongly between IPAH patients and controls (Figure 8). Real hub genes might have important roles in IPAH pathogenesis and development.

Figure 7. Scatter diagrams for the expressions of real hub genes in GSE15197. (A) EP300, (B) MMP2, (C) CDH2, (D) CDK2, (E) GNG10, (F) ALB, (G) SMC2, (H) DHX15, (I) CUL3, (J) BTBD1, and (K) LTN1. Each point represents a sample. In GSE15197, there are 18 IPAH samples and 12 normal samples. EP300, E1A binding protein p300; MMP2, matrix metallopeptidase 2; CDH2, cadherin 2; CDK2, cyclin-dependent kinase 2; GNG10, G protein subunit gamma 10; ALB, albumin; SMC2, structural maintenance of chromosomes 2; DHX15, DEAH-box helicase 15; CUL3, cullin 3; BTBD1, BTB domain containing 1; LTN1, listerin E3 ubiquitin protein ligase 1.

Figure 8. ROC curves of the hub genes. (A) EP300, (B) MMP2, (C) CDH2, (D) CDK2, (E) GNG10, (F) ALB, (G) SMC2, (H) DHX15, (I) CUL3, (J) BTBD1, and (K) LTN1. ROC, receiver operating characteristic; EP300, E1A binding protein p300; MMP2, matrix metallopeptidase 2; CDH2, cadherin 2; CDK2, cyclin-dependent kinase 2; GNG10, G protein subunit gamma 10; ALB, albumin; SMC2, structural maintenance of chromosomes 2; DHX15, DEAH-box helicase 15; CUL3, cullin 3; BTBD1, BTB domain containing 1; LTN1, listerin E3 ubiquitin protein ligase 1.
Prediction of Potential miRNA-Target Regulatory Networks
We searched for miRNAs targeting real hub genes using the miRNet 2.0 database. The resulting miRNA-target network was visualized using miRNet 2.0 (Figure 9). Only miRNAs with a degree of 3 or over were displayed. We found that hsa-mir-1-3p had the highest degree (degree 8). We speculated that hsa-mir-1-3p could be the most crucial miRNA in IPAH pathogenesis and development.

Figure 9. miRNA–target regulatory network. The blue square represents miRNAs targeting the real hub genes, and the red circle represents the real hub genes. The bigger the circle or square, the higher the degree.
Discussion
IPAH is a rare but severe cardiopulmonary disease associated with progressive deterioration. There are many molecular mechanisms underlying IPAH, and extant treatments for IPAH are limited (Yanai et al., 2017). To find new targets or therapies, it is essential to explore IPAH hub genes. Bioinformatics analysis of microarray data has been used widely to identify disease-associated hub genes (Yin et al., 2018).
In this study, DEGs from GSE15197 were analyzed. There were 4,395 significantly differentially expressed genes identified in IPAH and normal lung tissue. These DEGs may play important biological roles. We undertook WGCNA on GSE15197, identifying the green and brown modules as key modules. We also conducted GO and KEGG analyses of these modules. The GO analysis showed that the green and brown module genes were enriched, respectively, in tissue development and kinetochore organization. The KEGG analysis indicated that the green and brown modules genes were involved, respectively, in protein digestion and absorption and proteoglycans in cancer. By overlapping DEGs and candidate hub genes obtained from WGCNA, we found 11 real hub genes associated with IPAH: EP300, MMP2, CDH2, CDK2, GNG10, ALB, SMC2, DHX15, CUL3, BTBD1, and LTN1.
Among the 11 hub genes, EP300 and CDH2 are upregulated hub genes. EP300 encodes histone acetyltransferase, which regulates gene transcription by binding chromatin in the cell nucleus (Sen et al., 2019). It has been linked to arterial stiffness prior to hypertension, increase of pulse pressure, and structural vessel wall changes (Herrera et al., 2014). EP300 can function as a regulatory factor during vascular endothelial growth factor A-induced angiogenesis (Sacilotto et al., 2016). The overexpression of EP300 increases lung fibrotic hallmarks in a bleomycin mouse model (Rubio et al., 2019). Cardiac miR-133a overexpression in diabetes inhibits EP300, preventing early cardiac fibrosis (Chen et al., 2014). We reason that EP300 may promote IPAH development. Although much evidence supports a role for EP300 in vascular disease, its mechanism in IPAH remains unclear. Further studies are required to explore how EP300 participates in IPAH progression.
CDH2 encodes cadherin 2 or N-cadherin (Mayosi et al., 2017). Significant CDH2 expression promotes endothelial cell proliferation and vascular smooth muscle cell migration (Lyon et al., 2010; Zhuo et al., 2019), causing intimal thickening, and could drive vascular remodeling in IPAH. Moreover, CDH2 mutations are associated with arrhythmogenic cardiomyopathy (Mayosi et al., 2017; Ghidoni et al., 2021).
MMP2 is a proteolytic enzyme that contributes to vascular protein degradation and aortic wall destruction (Longo et al., 2002; Li et al., 2019). Much evidence suggest that MMP2 is associated with an increased risk of cardiovascular diseases, such as myocardial infarction (Alp et al., 2011) and degenerative mitral valve disease (Balistreri et al., 2016). Rat vascular smooth muscle cell migration can be inhibited by the c-Myc/MMP2 and ROCK/JNK signaling pathways (Luo et al., 2019). Higher ratios of MMP2/TIMP4 in plasma predict a significantly higher risk of death or clinical deterioration in IPAH patients (Wetzl et al., 2017). Activation of MMP2 is increased in smooth muscle cells of IPAH patients, contributing to smooth muscle cell migration and proliferation (Lepetit et al., 2005).
CDK2 encodes a form of protein-dependent kinases (Nathans et al., 2021), involved in cell cycle regulation, with a critical role during the G1 to S phase transition. Decreased CDK2 expression can block cell cycle progression and inhibit the proliferation of pulmonary artery smooth muscle cells. Proliferative PASMCs exist in PAH patients and are closely related to vascular remodeling (Yue et al., 2020).
ALB encodes albumin, the most abundant protein in human blood, which plays a key role in regulating blood plasma colloid osmotic pressure. In IPAH, pulmonary vascular pressure is considerably elevated, leading to endothelial dysfunction and capillary leakage easily. In turn, this leads to loss of plasma proteins including serum albumin levels. Lower albumin levels may reflect disease progression and predict worse survival rates (Snipelisky et al., 2018).
CUL3 encodes cullin 3, a cullin protein family member, critical to maintaining the integrity of the endothelial barrier (Kovačević et al., 2018). Decreased expression of CUL3 may occur in IPAH, resulting in the destruction of blood vessel architecture, cell proliferation, and vascular remodeling (Sakaue et al., 2017). Rats with CUL3 mutations exhibit arterial hypertension, while patients with CUL3 mutations present severe early-onset hypertension, vascular dysfunction, and arterial stiffness due to deficiency of vascular smooth muscle (Abdel Khalek et al., 2019).
GNG10 encodes a subtype of the G-protein γ subunit involved in suppressing heart rate (Senarath et al., 2018) and regulating the cell cycle (Clapham and Neer, 1997). The protein encoded by SMC2 belongs to the condensin complex, which maintains chromosome stability (Feng et al., 2019). DHX15, a member of the DEAH-box RNA helicase family, participates in modulating pre-mRNA splicing (Jing et al., 2018). BTBD1 encodes a 482-amino-acid protein involved in protein–protein interactions. The expression of BTBD1 in the heart is enhanced (Carim-Todd et al., 2001; Xu et al., 2002). LTN1 encodes listerin E3 ubiquitin protein ligase 1, which functions as an E3 ubiquitin ligase (Chu et al., 2009). However, there is no research indicating a relationship between these five genes and IPAH. We propose that these genes are novel genes related to IPAH, suggesting the need for future study.
miRNAs represent novel potential therapeutic targets for many diseases including heart failure (Akat et al., 2014), acute myocardial infarction (Gupta et al., 2016), arrhythmias (den Hoed et al., 2013), and pulmonary hypertension (Zhou et al., 2018). We created a miRNA-target network to explore potential miRNAs in IPAH. The network suggested that hsa-mir-1-3p might regulate gene expression in IPAH. Previous studies have shown elevated hsa-mir-1-3p in perioperative myocardial injury patients (May et al., 2020). Further research is needed to verify the mechanism linking hsa-mir-1-3p to IPAH.
We also examined expression levels in IPAH versus controls and the diagnostic power of the 11 identified hub genes using the ROC curve analysis. The expression of the 11 hub genes showed significant differences between IPAH and controls. A previous work has identified diagnostic IPAH biomarkers in plasma (Wang T. et al., 2019). Here, we used lung microarray data, not plasma, to identify hub genes using WGCNA. We consider that this result is more reliable for spatial specificity of gene expression. The 11 genes may all have a considerable diagnostic ability and be better candidate targets, although lung tissues cannot be obtained as easily as plasma samples.
The principal limitation of our study is the lack of independent experimental validation. Although 11 hub genes were identified, their involvement in IPAH pathogenesis has not been experimentally validated using in vivo or in vitro experimentation, and their possible mechanisms of action remain unclear. Further research is needed to validate our results and to explore the specific mechanisms of action for each gene.
Conclusion
In conclusion, our results indicate that the 11 real hub genes may play critical roles in IPAH. EP300 and CDH2 are the upregulated hub genes, while MMP2, CDK2, GNG10, ALB, SMC2, DHX15, CUL3, BTBD1, and LTN1 are the downregulated hub genes. Predicted miRNA hsa-mir-1-3p might regulate gene expression in IPAH. These hub genes could contribute to the pathology and progression of IPAH and may be candidate targets for IPAH treatment.
Data Availability Statement
Publicly available datasets were analyzed in this study. This data can be found here: GSE15197.
Author Contributions
XQ, JL, and JZ designed the research, analyzed the data, and wrote the manuscript. BL, YC, and GL participated in data preparation, analysis of data, and figures preparation. JZ revised the manuscript. All authors read and approved the manuscript for publication.
Conflict of Interest
The authors declare that the research was conducted in the absence of any commercial or financial relationships that could be construed as a potential conflict of interest.
Acknowledgments
We acknowledge the GEO database for providing the platform and the contributors for uploading their meaningful datasets.
Supplementary Material
The Supplementary Material for this article can be found online at: https://www.frontiersin.org/articles/10.3389/fgene.2021.636934/full#supplementary-material
Footnotes
- ^ https://www.ncbi.nlm.nih.gov/geo/
- ^ http://www.webgestalt.org/
- ^ https://string-db.org
- ^ https://www.mirnet.ca/
References
Abdel Khalek, W., Rafael, C., Loisel-Ferreira, I., Kouranti, I., Clauser, E., Hadchouel, J., et al. (2019). Severe arterial hypertension from cullin 3 mutations is caused by both renal and vascular effects. J. Am. Soc. Nephrol. 30, 811–823. doi: 10.1681/asn.2017121307
Akat, K. M., Moore-McGriff, D., Morozov, P., Brown, M., Gogakos, T., Correa Da Rosa, J., et al. (2014). Comparative RNA-sequencing analysis of myocardial and circulating small RNAs in human heart failure and their utility as biomarkers. Proc. Natl. Acad. Sci. U.S.A. 111, 11151–11156. doi: 10.1073/pnas.1401724111
Alp, E., Menevse, S., Tulmac, M., Yilmaz, A., Yalcin, R., and Cengel, A. (2011). The role of matrix metalloproteinase-2 promoter polymorphisms in coronary artery disease and myocardial infarction. Genet. Test. Mol. Biomarkers. 15, 193–202. doi: 10.1089/gtmb.2010.0113
Balistreri, C. R., Allegra, A., Crapanzano, F., Pisano, C., Triolo, O. F., Argano, V., et al. (2016). Associations of rs3918242 and rs2285053 MMP-9 and MMP-2 polymorphisms with the risk, severity, and short- and long-term complications of degenerative mitral valve diseases: a 4.8-year prospective cohort study. Cardiovasc. Pathol.: Off. J. Soc. Cardiovasc. Pathol. 25, 362–370. doi: 10.1016/j.carpath.2016.05.004
Barnes, J. W., Tian, L., Krick, S., Helton, E. S., Denson, R. S., Comhair, S. A. A., et al. (2019). O-GlcNAc transferase regulates angiogenesis in idiopathic pulmonary arterial hypertension. Int. J. Mol. Sci. 20:6299. doi: 10.3390/ijms20246299
Carim-Todd, L., Sumoy, L., Andreu, N., Estivill, X., and Escarceller, M. (2001). Identification and characterization of BTBD1, a novel BTB domain containing gene on human chromosome 15q24. Gene 262, 275–281. doi: 10.1016/s0378-1119(00)00513-8
Chen, S., Puthanveetil, P., Feng, B., Matkovich, S. J., Dorn, G. W. 2nd, and Chakrabarti, S. (2014). Cardiac miR-133a overexpression prevents early cardiac fibrosis in diabetes. J. Cell. Mol. Med. 18, 415–421. doi: 10.1111/jcmm.12218
Chu, J., Hong, N. A., Masuda, C. A., Jenkins, B. V., Nelms, K. A., Goodnow, C. C., et al. (2009). A mouse forward genetics screen identifies LISTERIN as an E3 ubiquitin ligase involved in neurodegeneration. Proc. Natl. Acad. Sci. U.S.A. 106, 2097–2103. doi: 10.1073/pnas.0812819106
Clapham, D. E., and Neer, E. J. (1997). G protein beta gamma subunits. Annu. Rev. Pharmacol. Toxicol. 37, 167–203.
den Hoed, M., Eijgelsheim, M., Esko, T., Brundel, B. J., Peal, D. S., Evans, D. M., et al. (2013). Identification of heart rate-associated loci and their effects on cardiac conduction and rhythm disorders. Nat. Genet. 45, 621–631.
Fan, Y., Siklenka, K., Arora, S. K., Ribeiro, P., Kimmins, S., and Xia, J. (2016). miRNet - dissecting miRNA-target interactions and functional associations through network-based visual analysis. Nucleic Acids Res. 44, W135–W141.
Feng, Y., Liu, H., Duan, B., Liu, Z., Abbruzzese, J., Walsh, K. M., et al. (2019). Potential functional variants in SMC2 and TP53 in the AURORA pathway genes and risk of pancreatic cancer. Carcinogenesis 40, 521–528. doi: 10.1093/carcin/bgz029
Fu, G., Saunders, G., and Stevens, J. (2014). Holm multiple correction for large-scale gene-shape association mapping. BMC Genet. 15(Suppl. 1):S5. doi: 10.1186/1471-2156-15-S1-S5
Gallo de Moraes, A., Vakil, A., and Moua, T. (2016). Patent foramen ovale in idiopathic pulmonary arterial hypertension: long-term risk and morbidity. Respiratory Med. 118, 53–57. doi: 10.1016/j.rmed.2016.07.007
Ghidoni, A., Elliott, P. M., Syrris, P., Calkins, H., James, C. A., Judge, D. P., et al. (2021). Cadherin 2-Related arrhythmogenic cardiomyopathy: prevalence and clinical features. Circ. Genom. Precis Med. doi: 10.1161/CIRCGEN.120.003097 [Epub ahead of print].
GraphPad Statistics Guide. (2020). GraphPad Statistics Guide. Available online at: http://www.graphpad.com/guides/prism/8/statistics/index.htm (accessed November 30, 2020).
Gupta, S. K., Foinquinos, A., Thum, S., Remke, J., Zimmer, K., Bauters, C., et al. (2016). Preclinical development of a MicroRNA-Based therapy for elderly patients with myocardial infarction. J. Am. College Cardiol. 68, 1557–1571. doi: 10.1016/j.jacc.2016.07.739
Herrera, V. L., Decano, J. L., Giordano, N., Moran, A. M., and Ruiz-Opazo, N. (2014). Aortic and carotid arterial stiffness and epigenetic regulator gene expression changes precede blood pressure rise in stroke-prone Dahl salt-sensitive hypertensive rats. PLoS One 9:e107888. doi: 10.1371/journal.pone.0107888
Hu, X., Bao, M., Huang, J., Zhou, L., and Zheng, S. (2020). Identification and validation of novel biomarkers for diagnosis and prognosis of hepatocellular carcinoma. Front. Oncol. 10:541479. doi: 10.3389/fonc.2020.541479
Iancu, O. D., Colville, A., Oberbeck, D., Darakjian, P., McWeeney, S. K., and Hitzemann, R. (2015). Cosplicing network analysis of mammalian brain RNA-Seq data utilizing WGCNA and Mantel correlations. Front. Genet. 6:174. doi: 10.3389/fgene.2015.00174
Jing, Y., Nguyen, M. M., Wang, D., Pascal, L. E., Guo, W., Xu, Y., et al. (2018). DHX15 promotes prostate cancer progression by stimulating Siah2-mediated ubiquitination of androgen receptor. Oncogene 37, 638–650. doi: 10.1038/onc.2017.371
Kovačević, I., Sakaue, T., Majoleé, J., Pronk, M. C., Maekawa, M., Geerts, D., et al. (2018). The Cullin-3-Rbx1-KCTD10 complex controls endothelial barrier function via K63 ubiquitination of RhoB. J. Cell. Biol. 217, 1015–1032. doi: 10.1083/jcb.201606055
Langfelder, P., and Horvath, S. (2008). WGCNA: an R package for weighted correlation network analysis. BMC Bioinform. 9:559. doi: 10.1186/1471-2105-9-559
Lepetit, H., Eddahibi, S., Fadel, E., Frisdal, E., Munaut, C., Noel, A., et al. (2005). Smooth muscle cell matrix metalloproteinases in idiopathic pulmonary arterial hypertension. Eur. Respiratory J. 25, 834–842. doi: 10.1183/09031936.05.00072504
Li, T., Jing, J., Sun, L., Jiang, B., Xin, S., Yang, J., et al. (2019). TLR4 and MMP2 polymorphisms and their associations with cardiovascular risk factors in susceptibility to aortic aneurysmal diseases. Biosci. Rep. 39:BSR20181591.
Li, W., Wang, L., Wu, Y., Yuan, Z., and Zhou, J. (2020). Weighted gene coexpression network analysis to identify key modules and hub genes associated with atrial fibrillation. Int. J. Mol. Med. 45, 401–416.
Longo, G. M., Xiong, W., Greiner, T. C., Zhao, Y., Fiotti, N., and Baxter, B. T. (2002). Matrix metalloproteinases 2 and 9 work in concert to produce aortic aneurysms. J. Clin. Investigation. 110, 625–632. doi: 10.1172/jci0215334
Luo, Z., Deng, H., Fang, Z., Zeng, A., Chen, Y., Zhang, W., et al. (2019). Ligustilide inhibited rat vascular smooth muscle cells migration via c-Myc/MMP2 and ROCK/JNK signaling pathway. J. Food Sci. 84, 3573–3583. doi: 10.1111/1750-3841.14936
Lyon, C. A., Koutsouki, E., Aguilera, C. M., Blaschuk, O. W., and George, S. J. (2010). Inhibition of N-cadherin retards smooth muscle cell migration and intimal thickening via induction of apoptosis. J. Vasc. Surg. 52, 1301–1309. doi: 10.1016/j.jvs.2010.05.096
May, S. M., Abbott, T. E. F., Del Arroyo, A. G., Reyes, A., Martir, G., Stephens, R. C. M., et al. (2020). MicroRNA signatures of perioperative myocardial injury after elective noncardiac surgery: a prospective observational mechanistic cohort study. Br. J. Anaesth. 125, 661–671. doi: 10.1016/j.bja.2020.05.066
Mayosi, B. M., Fish, M., Shaboodien, G., Mastantuono, E., Kraus, S., Wieland, T., et al. (2017). Identification of cadherin 2 (CDH2) mutations in arrhythmogenic right ventricular cardiomyopathy. Circ. Cardiovasc. Genet. 10:e001605.
Nathans, J. F., Cornwell, J. A., Afifi, M. M., Paul, D., and Cappell, S. D. (2021). Cell cycle inertia underlies a bifurcation in cell fates after DNA damage. Sci. Adv. 7:eabe3882. doi: 10.1126/sciadv.abe3882
Pahal, P., and Sharma, S. (2020). Idiopathic Pulmonary Artery Hypertension. StatPearls. Treasure Island, FL: StatPearls Publishing Copyright ©.
Ritchie, M. E., Phipson, B., Wu, D., Hu, Y., Law, C. W., Shi, W., et al. (2015). limma powers differential expression analyses for RNA-sequencing and microarray studies. Nucleic Acids Res. 43:e47. doi: 10.1093/nar/gkv007
Rubio, K., Singh, I., Dobersch, S., Sarvari, P., Günther, S., Cordero, J., et al. (2019). Inactivation of nuclear histone deacetylases by EP300 disrupts the MiCEE complex in idiopathic pulmonary fibrosis. Nat. Commun. 10:2229.
Sacilotto, N., Chouliaras, K. M., Nikitenko, L. L., Lu, Y. W., Fritzsche, M., Wallace, M. D., et al. (2016). MEF2 transcription factors are key regulators of sprouting angiogenesis. Genes Dev. 30, 2297–2309. doi: 10.1101/gad.290619.116
Sakaue, T., Maekawa, M., Nakayama, H., and Higashiyama, S. (2017). Prospect of divergent roles for the CUL3 system in vascular endothelial cell function and angiogenesis. J. Biochem. 162, 237–245.
Sarrion, I., Milian, L., Juan, G., Ramon, M., Furest, I., Carda, C., et al. (2015). Role of circulating miRNAs as biomarkers in idiopathic pulmonary arterial hypertension: possible relevance of miR-23a. Oxid Med. Cell Longev. 2015:792846.
Schoonjans, F., Zalata, A., Depuydt, C. E., and Comhaire, F. H. (1995). MedCalc: a new computer program for medical statistics. Comput. Methods Programs Biomed. 48, 257–262. doi: 10.1016/0169-2607(95)01703-8
Sen, P., Lan, Y., Li, C. Y., Sidoli, S., Donahue, G., Dou, Z., et al. (2019). Histone acetyltransferase p300 induces de novo super-enhancers to drive cellular senescence. Mol. Cell. 73, 684.e8–698.e8.
Senarath, K., Kankanamge, D., Samaradivakara, S., Ratnayake, K., Tennakoon, M., and Karunarathne, A. (2018). Regulation of G protein betagamma Signaling. Int. Rev. Cell. Mol. Biol. 339, 133–191.
Shannon, P., Markiel, A., Ozier, O., Baliga, N. S., Wang, J. T., Ramage, D., et al. (2003). Cytoscape: a software environment for integrated models of biomolecular interaction networks. Genome Res. 13, 2498–2504. doi: 10.1101/gr.1239303
Shi, M., Dai, W. Q., Jia, R. R., Zhang, Q. H., Wei, J., Wang, Y. G., et al. (2021). APC(CDC20)-mediated degradation of PHD3 stabilizes HIF-1a and promotes tumorigenesis in hepatocellular carcinoma. Cancer Lett. 496, 144–155. doi: 10.1016/j.canlet.2020.10.011
Snipelisky, D., Jentzer, J., Batal, O., Dardari, Z., and Mathier, M. (2018). Serum albumin concentration as an independent prognostic indicator in patients with pulmonary arterial hypertension. Clin. Cardiol. 41, 782–787. doi: 10.1002/clc.22954
Tutorials for Wgcna R package. (2020). Tutorials for WGCNA R Package. Available online at: https://labs.genetics.ucla.edu/horvath/CoexpressionNetwork/Rpackages/WGCNA/Tutorials/ (accessed November 1, 2020).
Wang, T., Zheng, X., Li, R., Liu, X., Wu, J., Zhong, X., et al. (2019). Integrated bioinformatic analysis reveals YWHAB as a novel diagnostic biomarker for idiopathic pulmonary arterial hypertension. J. Cell. Physiol. 234, 6449–6462. doi: 10.1002/jcp.27381
Wang, X. J., Lian, T. Y., Jiang, X., Liu, S. F., Li, S. Q., Jiang, R., et al. (2019). Germline BMP9 mutation causes idiopathic pulmonary arterial hypertension. Eur. Respiratory J. 53:1801609. doi: 10.1183/13993003.01609-2018
Wang, Y., Chen, S., and Du, J. (2019). Bosentan for treatment of pediatric idiopathic pulmonary arterial hypertension: state-of-the-art. Front. Pediatr. 7:302. doi: 10.3389/fped.2019.00302
Wetzl, V., Tiede, S. L., Faerber, L., Weissmann, N., Schermuly, R. T., Ghofrani, H. A., et al. (2017). Plasma MMP2/TIMP4 ratio at follow-up assessment predicts disease progression of idiopathic pulmonary arterial hypertension. Lung 195, 489–496. doi: 10.1007/s00408-017-0014-5
Wu, D., Talbot, C. C. Jr., Liu, Q., Jing, Z. C., Damico, R. L., Tuder, R., et al. (2016). Identifying microRNAs targeting Wnt/beta-catenin pathway in end-stage idiopathic pulmonary arterial hypertension. J. Mol. Med. (Berl). 94, 875–885. doi: 10.1007/s00109-016-1426-z
Xu, L., Yang, L., Hashimoto, K., Anderson, M., Kohlhagen, G., Pommier, Y., et al. (2002). Characterization of BTBD1 and BTBD2, two similar BTB-domain-containing Kelch-like proteins that interact with Topoisomerase I. BMC Genomics 3:1. doi: 10.1186/1471-2164-3-1
Yanai, S., Wakayama, M., Nakayama, H., Shinozaki, M., Tsukuma, H., Tochigi, N., et al. (2017). Implication of overexpression of dishevelled-associated activator of morphogenesis 1 (Daam-1) for the pathogenesis of human Idiopathic Pulmonary Arterial Hypertension (IPAH). Diagnostic Pathol. 12:25.
Yin, L., Cai, Z., Zhu, B., and Xu, C. (2018). Identification of key pathways and genes in the dynamic progression of HCC based on WGCNA. Genes 9:92. doi: 10.3390/genes9020092
Yue, Y., Li, Y. Q., Fu, S., Wu, Y. T., Zhu, L., Hua, L., et al. (2020). Osthole inhibits cell proliferation by regulating the TGF-beta1/Smad/p38 signaling pathways in pulmonary arterial smooth muscle cells. Biomed. Pharmacother. 121:109640. doi: 10.1016/j.biopha.2019.109640
Zhang, B., and Horvath, S. (2005). A general framework for weighted gene co-expression network analysis. Stat. Appl. Genet. Mol. Biol. 4:17.
Zhang, H., Xu, M., Xia, J., and Qin, R. Y. (2013). Association between serotonin transporter (SERT) gene polymorphism and idiopathic pulmonary arterial hypertension: a meta-analysis and review of the literature. Metabolism 62, 1867–1875. doi: 10.1016/j.metabol.2013.08.012
Zheng, J. N., Li, Y., Yan, Y. M., Shi, H., Zou, T. T., Shao, W. Q., et al. (2020). Identification and validation of key genes associated with systemic sclerosis-related pulmonary hypertension. Front. Genet. 11:816. doi: 10.3389/fgene.2020.00816
Zhou, S. S., Jin, J. P., Wang, J. Q., Zhang, Z. G., Freedman, J. H., Zheng, Y., et al. (2018). miRNAS in cardiovascular diseases: potential biomarkers, therapeutic targets and challenges. Acta Pharmacologica Sinica. 39, 1073–1084. doi: 10.1038/aps.2018.30
Keywords: idiopathic pulmonary arterial hypertension, differentially expressed genes, functional enrichment analysis, weighted gene co-expression network analysis, hub genes
Citation: Qiu X, Lin J, Liang B, Chen Y, Liu G and Zheng J (2021) Identification of Hub Genes and MicroRNAs Associated With Idiopathic Pulmonary Arterial Hypertension by Integrated Bioinformatics Analyses. Front. Genet. 12:667406. doi: 10.3389/fgene.2021.636934
Received: 02 December 2020; Accepted: 22 March 2021;
Published: 29 April 2021.
Edited by:
Sascha Meyer, Saarland University Hospital, GermanyReviewed by:
Duy Ngoc Do, Dalhousie University, CanadaMaria Do Carmo Costa, University of Michigan, United States
Copyright © 2021 Qiu, Lin, Liang, Chen, Liu and Zheng. This is an open-access article distributed under the terms of the Creative Commons Attribution License (CC BY). The use, distribution or reproduction in other forums is permitted, provided the original author(s) and the copyright owner(s) are credited and that the original publication in this journal is cited, in accordance with accepted academic practice. No use, distribution or reproduction is permitted which does not comply with these terms.
*Correspondence: Jing Zheng, z2003jing@163.com