Large-Scale Nutrient Dynamics in the Baltic Sea, 1970–2016
 Oleg P. Savchuk
- Baltic Nest Institute, Stockholm University Baltic Sea Centre, Stockholm University, Stockholm, Sweden
The Baltic Sea is one of the world's marine areas well-covered by both long-term observations and oceanographic studies. It is also a large coastal area in which eutrophication had already been recognized half a century ago. While the mechanisms of eutrophication are largely understood, several features are less recognized and sometimes neglected, including: (a) natural and anthropogenic North-South and East-West nutrient gradients within the drainage basin and marine ecosystems; (b) the compensatory potential of the interconnectivity between the Baltic Sea basins; (c) long nutrient residence times and high buffer capacity of the system, resulting in slow responses to nutrient load reductions. Particularly important is the interaction of (d) naturally occurring saltwater inflows sporadically ventilating deep water layers and (e) a partly man-made intensification of biological oxygen consumption. Resulting redox alterations of biogeochemical nitrogen and phosphorus cycles are locked in a “vicious circle” that promotes cyanobacterial nitrogen fixation, thereby hindering nitrogen load reduction and sustaining an elevated trophic state. This tight coupling of natural environmental variation and human impacts complicates both scientific studies and management recommendations. Our primary objective is to describe all these features and mechanisms with the best available data on nutrient loads, and unique estimates of the basin-wide nutrient pools. These data are presented as both long-term time series and empirical nutrient budgets. The analysis is supplemented by results of biogeochemical modeling. A second, more practical objective is to make these time series available to the community.
Introduction
Oceanographic measurements in the Baltic Sea began about 140 years ago: its marine ecosystem is consequently the most observed and studied in the world (e.g., Voipio, 1981; Fonselius and Valderrama, 2003; Feistel et al., 2008; Leppäranta and Myrberg, 2009; Snoeijs-Leijonmalm et al., 2017b). From a global perspective, this relatively shallow enclosed sea with a surface area and water volume of about 412 × 103 km2 and 21 × 103 km3, respectively, could be considered as a large estuary or fjord belonging to the coastal zone of the Atlantic Ocean. The signs of offshore eutrophication, such as increasing nutrient concentrations, were recognized in the Baltic Sea earlier (e.g., Fonselius, 1969, 1976; Grasshoff and Voipio, 1981; Nehring, 1987) than in many other coastal areas (Cloern, 2001). The highest winter surface concentrations of 5–6 μM N-Nox and 0.6–0.8 μM P-PO4 were recorded in the Baltic Proper (Figure 1) in the 1980s and also more recently for phosphates. However, it should be stressed that these maximal values are lower than concentrations routinely measured in the neighboring North Sea and in the non-eutrophic Northeastern Atlantic (e.g., Rodhe et al., 2004). Also, the annual phytoplankton primary production of 50–150 g C m−2 yr−1 (and rarely exceeding 200 g C m−2 yr−1 in the open sea; Elmgren, 1989; Sandberg et al., 2000; Wasmund and Siegel, 2008; Cloern et al., 2014) corresponds to mesotrophic (100–300 g C m−2 yr−1) rather than eutrophic (300–500 g C m−2 yr−1) conditions in Nixon's (1995) classification. Yet, as has been noted by others and further discussed below, the unique geographical and biogeochemical features of the Baltic Sea make its ecosystem particularly vulnerable to external nutrient inputs and subject to eutrophication (e.g., Jansson, 1980; Voipio, 1981; Elmgren, 1989, 2001; Jansson and Dahlberg, 1999). The symptoms and consequences of eutrophication at different scales and within different domains have been described and analyzed in hundreds of publications (e.g., Larsson et al., 1985; Davidan and Savchuk, 1989; Wulff et al., 2001b; Feistel et al., 2008; Cloern et al., 2016; Kuosa et al., 2017; Snoeijs-Leijonmalm et al., 2017b). From a mechanistic, explanatory point of view the eutrophication has also implicitly (Sjöberg et al., 1972; Stigebrandt and Wulff, 1987; Wulff and Stigebrandt, 1989) or explicitly (Savchuk, 1986, 2002; Savchuk and Wulff, 2009) been considered as an imbalance in biogeochemical cycles, resulting in nutrient accumulation when external inputs exceed permanent removals. Hence, long-term studies of nutrient dynamics should focus on integral nutrient levels (total storage), the changes of which are determined by integral nutrient fluxes. Yet, such a large-scale system perspective of eutrophication is still insufficiently recognized in scientific discussions and accounted for in management considerations (e.g., Elmgren et al., 2015).
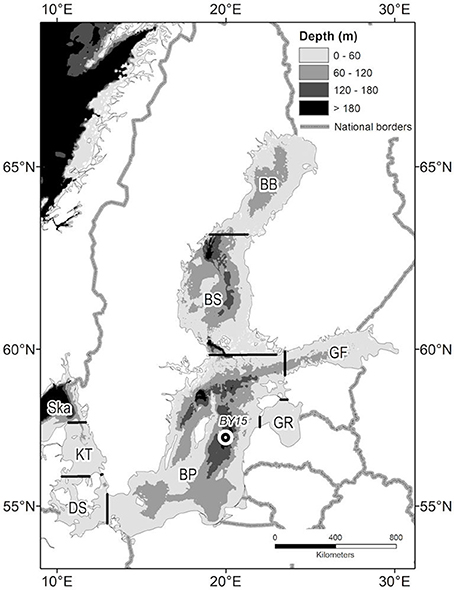
Figure 1. Major basins of the Baltic Sea: BB, Bothnian Bay; BS, Bothnian Sea; BP, Baltic Proper; GF, Gulf of Finland; GR, Gulf of Riga; DS, Danish Straits; KT, Kattegat; Ska, Skagerrak boundary, BY15–marks position of long-term oceanographic station.
The mechanisms of nutrient dynamics as a complex interplay between external inputs and internal transports and transformations are best described by biogeochemical models. In studies of the Baltic Sea, such models have been developed almost in parallel with the growth of eutrophication (Sjöberg et al., 1972; Savchuk, 1984, 1986; Stigebrandt and Wulff, 1987; Savchuk and Wulff, 1999, 2001, 2007, 2009; Neumann, 2000; Eilola et al., 2009, 2011). Nowadays, the models are used in a variety of scenario simulations, including those needed for support of nutrient management decisions (e.g., Savchuk, 2000; Gustafsson et al., 2008, 2012; Neumann, 2010; Friedland et al., 2012; Meier et al., 2012, 2014; Ryabchenko et al., 2016; Meier et al., in preparation). Such support was instrumental in the development (Wulff et al., 2007) and revision (HELCOM, 2013a) of the eutrophication segment of the Baltic Sea Action Plan (HELCOM, 2007, 2013b; Backer et al., 2010). The model development and implementation have depended on the accumulation of oceanographic data, collected since the end of nineteenth century (e.g., Fonselius and Valderrama, 2003). Besides simulation modeling, the data have also been used to construct empirical nutrient budgets (e.g., Wulff and Stigebrandt, 1989; Wulff et al., 2001a; Savchuk, 2005) and in ecological-economics studies aimed at cost optimisation of management solutions (e.g., Gren and Wulff, 2004; Gren et al., 2013). Yet, some important results of both mathematical modeling and empirical data analyses have not been assimilated enough by the scientific and, especially, environmental management and administrative communities.
Two comprehensive assessments of Baltic climate change produced by the scientific community (BACC Author Team, 2008; BACCII Author Team, 2015) did not detect direct signals in Baltic marine systems, except of the warming of sea-surface waters during recent decades. After the two assessments were released, changes in the duration of vegetation season and the intensity of phytoplankton development related to warming have been detected in satellite measurements (Kahru et al., 2016). Similar changes in seasonal dynamics of the surface water temperature (SST) are reconstructed from the field observations and presented in this study for the first time. Furthermore, a positive correlation is found between the total area of cyanobacteria accumulations and summer SST. Yet, besides such straightforward temperature-related effects, no other interactions between climate variability and nutrient dynamics have been reliably detected and attributed.
The final goal of this study is to revisit the challenges facing mitigation of the Baltic Sea eutrophication considered from a large scale perspective. Revised conclusions and new insights are presented, based on both total amounts and fluxes of nutrients, spanning all the major Baltic Sea basins. Long-term (1970–2016) nutrient dynamics are studied, using basin-wide integrated nitrogen and phosphorus pools reconstructed from all available observations, instead of traditionally analyzed concentrations measured at fixed monitoring stations. Previously, these time series have been shown only in graphs for comparison with simulations (e.g., Savchuk and Wulff, 2009; Eilola et al., 2011; Gustafsson et al., 2017). Here, they are made available for the community in digital form for the first time. The integral nutrient fluxes are derived from both empirical nutrient budgets and biogeochemical models. This new hybrid analysis focuses on interactions determining nutrient dynamics primarily in a hindcasting mode. Speculative projection of these interactions into the future, more pertinent to a forecasting mode, has already been covered by numerous publications (e.g., BACC Author Team, 2008; Suikkanen et al., 2013; BACCII Author Team, 2015; Cloern et al., 2016; Tamelander et al., 2017).
The paper is structured as follows. Presentation of data and methods of their analysis starts with a description of the massive amount of observations available, and an introduction to two convenient tools for their extraction and processing: the Data Assimilation System (DAS, http://nest.su.se/das), and the decision support system Baltic Nest (http://nest.su.se/nest). This description of the sources of raw material is followed by a presentation of more sophisticated tools for data analysis and interpretation, including empirical nutrient budgeting and biogeochemical modeling. Advancement toward management considerations requires a brief review of existing results presenting different perspectives (e.g., pools instead of concentrations, updated nutrient budgets, and interactions between hypoxia and nutrient cycles) as well as new findings (long-term changes of seasonal dynamics, estimates of degradability of organic nutrients, empirical relationships between cyanobacteria, SST, and nutrients). Concluding remarks stress important insights, concerns and implications.
Materials and Methods
Marine Observations and Nutrient Loads
Field measurements of temperature, salinity, oxygen, and concentration of nutrients have been compiled in the publicly available Baltic Environmental Database (BED, http://nest.su.se/bed), initiated in 1991 at Stockholm University by Prof. Fredrik Wulff. Since 2009, these data can also be merged conveniently online with both recent and historical data from Denmark, Finland, Germany, and Sweden, due to the inter-institutional agreement on distributed databases (http://nest.su.se/dataPortal). The earliest hydrographic measurements date from 1877; today the total number of available oceanographic stations is almost 400,000 and has grown annually by 5,000–8,000 stations during recent decades. The database has issues common to large aggregate databases. Data quality varies, from the most reliable long-term observations of temperature, salinity, oxygen, and nitrite, to nitrate measurements that have become reliable since the 1970s, to the still-problematic analyses of total nitrogen. There are also differences in measured values reported by different laboratories. For instance, a statistical analysis of Swedish monitoring data indicated that an abrupt increase has occurred in the concentration of organic phosphorus since 2005, thus implying systematic errors in its determination (Elam and Grimvall, 2013). Furthermore, the DAS reconstructions of nutrient fields and pools (see explanation on procedure in section Data Analysis Tools below) produce differing results depending on which data are used and how they are distributed in time and space. For example, time series of annual mean pools reconstructed from the national vs. combined data (Figure 2) show systematic distinction: differences between the oxidized nitrogen dynamics reconstructed from all the data (BED) and a subset taken from German stations are larger than differences between all data and a subset taken from Swedish stations; for phosphate dynamics the picture is the opposite. Considering such inter-laboratory differences, some researchers prefer using only data from their respective national monitoring programmes (e.g., Raateoja, 2013; Rolff and Elfwing, 2015). In contrast, in this study, which covers the entire Baltic Sea, I use all the available data pooled together, as in Figure 2C, both to increase data coverage and in the hope of reducing overall error.
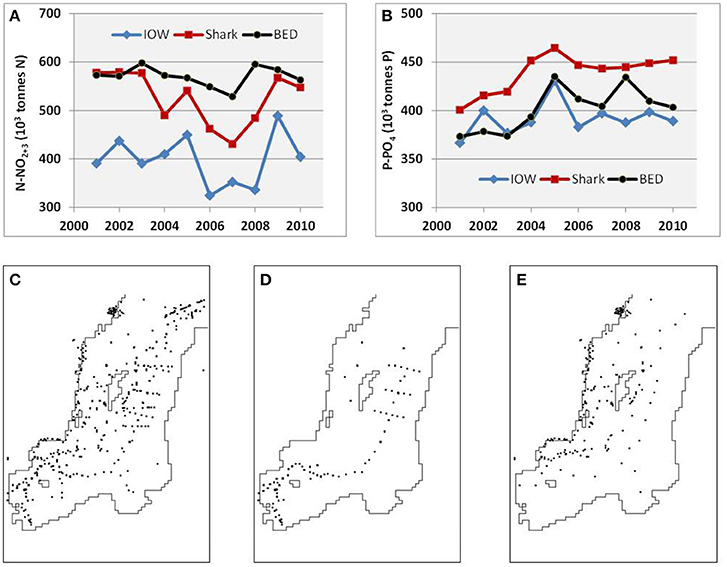
Figure 2. Differences in (A) oxidized nitrogen and (B) phosphate pools (103 tons) in the Baltic Proper with example of station distributions in 2005 showing (C) all the data combined (BED, 1968 stations), (D) only German (IOW, 400 stations), and (E) only Swedish (Shark, 1117 stations including coastal) data. Time (years) in (A,B) is on the horizontal axis.
The best available estimates of external nutrient inputs generated by terrestrial sources (from rivers, direct point, and diffuse sources) and atmospheric deposition have been compiled by Savchuk et al. (2012b) for 1970–2006 and updated for this study over 1995–2014 from available sources (HELCOM, 2015; Bartnicki and Benedictow, 2016; Svendsen et al., 2017). Unfortunately, only information on total nutrients, but not on inorganic fractions, is available at this time. As suggested in our previous reconstructions (Savchuk, 2005; Savchuk et al., 2012b), the reported amounts of inorganic nitrogen atmospheric deposition are increased by 20% to account for the organic nitrogen fraction, while the atmospheric P deposition is assumed to deliver 15 kg P km−2 yr−1, invariably and uniformly distributed over the entire Baltic Sea.
Data Analysis Tools
Along with the long-term observations made at fixed national and international monitoring stations, a large amount of data has also been acquired in numerous national and multi-national oceanographic surveys irregularly covering various marine areas of the Baltic Sea. Correspondingly, two specific tools accessing data via Internet and exploiting either temporal or spatial aspects of their distribution have been developed, also at the instigation of Prof. Fredrik Wulff.
The Data Assimilation System (Sokolov et al., 1997) extracts desired data for a user-specified area and time interval, and constructs the three-dimensional gridded field of the selected oceanographic variable by interpolation. Then, in addition to visualizing its spatial distribution, the field can be used to compute integral amounts and volume-weighted averages of the gridded variable within a specified domain, together with the corresponding water volume and the area of its enveloping surface. The domain may be bounded by space coordinates (latitude, longitude, and depth interval) and by specified range of interpolated variables. In this study, DAS is used for reconstruction of the temporally averaged means and integral amounts of nutrients and hydrographic variables in the different areas of Baltic Sea, including area and volume of the hypoxic zone containing waters with oxygen concentration no more than 2 mL L−1. Following Baltic tradition (Fonselius, 1969), hydrogen sulfide concentration is presented in BED and will be analyzed here for convenience in terms of its “negative oxygen” equivalent: 1 mL of H2S L−1 = −2 mL O2 L−1.
The SwingStations tool (Sokolov and Wulff, 1999), further developed and incorporated into the Baltic Nest (Wulff et al., 2013), constructs time-series of oceanographic parameters by aggregating into a single vertical column all the measurements from a user-defined area and step-wise averaging them within consecutive time windows. The area may extend from surroundings of a single monitoring station to a basin-wide polygon of arbitrary shape.
The procedure and peculiarities of implementation of these tools are discussed in detail by Savchuk (2010); some obtained results are presented, for instance, in the following studies (Conley et al., 2002; Savchuk, 2005; Savchuk and Wulff, 2009; Gustafsson et al., 2017; Lehtoranta et al., 2017).
Nutrient Budgets
Under the steady state assumption, empirical nutrient budgets in the seven interconnected Baltic Sea basins are described by a system of linear algebraic equations:
where Li, ci, and Si (i≠j = 1, …, 7) are, respectively, the basin-wise annual external inputs comprising land loads and atmospheric deposition, average nutrient concentration, and sink/source terms accounting for how much nutrient is “lost/received” annually due to internal biogeochemical processes in each of the seven basins shown in Figure 1. Qij is the annual water flow from ith to jth basin (Qij = 0 for unconnected basins). The long-term mean water flows Qij were calculated using the classical Knudsen approach, considering salt as a conservative tracer (Knudsen, 1899), that specifies which saline inflows are needed to maintain basin salt content against dilution by freshwater inputs.
As in previous analysis of nutrient budgets (Savchuk, 2005), the interconnectivity of the basins, making their pools interdependent, is characterized by the effects matrices calculated using algorithms of network analysis (e.g., Wulff et al., 1989). The effects matrix shows how a one-unit change of external input to jth basin Lj would result in a change of the total input to ith basin (Li + Qjicj) due to the inter-basin transports.
Mathematical Models
In addition to empirical characteristics and patterns acquired from the field measurements, the results of simulations made with two biogeochemical models are used to interpret observations and expand conclusions. Both mechanistic models account for major sources and sinks that determine the size of internal nutrient pools. The Simple As Necessary BALTic Sea model (SANBALTS, Savchuk and Wulff, 2007, 2009; Savchuk et al., 2008) highly aggregates variables (organic and inorganic forms of nutrients without explicit description of biota) resulting in correspondingly high spatial-temporal averaging (annual within seven homogeneous basins). The BAltic Long-Term large Scale Eutrophication Model (BALTSEM, Gustafsson et al., 2012, 2017; Savchuk et al., 2012a) describes long-term seasonal dynamics of the lower levels of marine ecosystem (from hydrography to zooplankton) within 13 sub-basins, considered horizontally homogeneous but having a high vertical resolution. Both models have been sufficiently validated and used for quantification of the eutrophication segment of the Baltic Sea Action Plan (Wulff et al., 2007; Backer et al., 2010; Anonymous, 2013).
Results
Long-Term Dynamics of Nutrient Pools and Loads
Long-term time series of the annual mean pools of total and inorganic nitrogen and phosphorus were reconstructed from all the available data for 1970–2016 with DAS for the seven major basins of the Baltic Sea (see Figure 1). The dissolved inorganic nitrogen (DIN) pool is the sum of oxidized nitrogen and ammonium pools. Reconstructed dynamics of annual- and basin-wide-averaged nutrient pools are shown in Figure 3, together with annually integrated external nutrient inputs. The original time series are provided in Supplementary Material, while some statistics derived from them are presented in Table 1. Analysis of these “stacked” amounts alone allows us to demonstrate several system-scale properties of Baltic Sea biogeochemistry that are sometimes overlooked when considering only local variations of concentrations at fixed monitoring stations:
1) On a long-term average, over 80% of the total Baltic Sea nutrient stocks reside in two open, flow-through basins, the Baltic Proper and Bothnian Sea, whereas external nutrient inputs to these basins do not exceed 60% of the total load. The proportions of inorganic nutrients found in these two basins are slightly different depending upon the nutrient—about 75% for DIN and 92% for DIP with 85% contained in the Baltic Proper alone. As these two basins comprise about 82% of the total Baltic Sea volume, their storage capacity is not surprising. Less expected is the differing content of “organic” fractions, calculated as the differences between total and inorganic nutrient amounts. In contrast to an almost invariable fraction of “organic” nitrogen, contributing ~80% to the total nitrogen pool in all basins except for the Kattegat (71%) and the Bothnian Bay (68%), the proportion of “organic” phosphorus fraction greatly differs between basins, from 73% in the Bothnian Bay to 25% in the Baltic Proper. Apparently, the inter-basin mass exchange is important for ”homogenizing” the “organic” nitrogen distribution, compared to the case of “organic” phosphorus, in which intra-basin biogeochemical processes create an inhomogeneous distribution. Similar conclusions could also be reached from the BALTSEM simulations (Gustafsson et al., 2017).
2) In spite of a significant reduction of external nutrient inputs, the total nutrient content of the Baltic Sea waters has remained remarkably steady in recent decades, especially since the 2000s. Comparing between the 1980s and 2010s, the total input of nitrogen decreased by about a quarter and phosphorus input halved. In contrast, the total nitrogen (TN) pool of about 6 million tons is rather invariant, while the total phosphorus (TP) pool has slightly increased recently, to over 0.7 million tons. The long-recognized reason for such high buffer capacity is the historical accumulation of pools of nutrients in the water column and sediments, which are large compared to the storage increments due to their annual inputs. As can be estimated from reconstructed time series for the entire Baltic Sea system (cf. Table 1), the basin-wise water-column residence times for TN and TP are, on average, 5 and 11 years, respectively. Accounting for nutrients accumulated in the biogeochemically active layer of sediments results in an increase of these estimates, especially significant for phosphorus (Savchuk and Wulff, 2001; Savchuk, 2002). According to the recent computations with BALTSEM (Gustafsson et al., 2017), residence times for TN and TP in the water and sediments of the Baltic Sea combined are of 9 and 49 years, respectively. The absence of an immediate causal relationship between the nutrient pools and annual external inputs manifests itself in low correlation coefficients of linear regression (R) between the two, being even negative at the entire Baltic Sea scale (R = −0.05 for nitrogen; R = −0.45 for phosphorus) mainly because of negative correlations in the Baltic Proper (Table 1).
3) The N:P ratio in total nutrient inputs is always higher than the Redfield ratio of 16, ranging from N:P = 83 ± 18 (mol:mol, mean ± standard deviation) in the Kattegat to N:P = 34 ± 10 in the Gulf of Finland. Both in the river load and atmospheric deposition, the contribution of inorganic fraction to total input is much higher for nitrogen than for phosphorus, 67 vs. 49%, respectively, in the integral inputs to the entire Baltic Sea (Savchuk et al., 2012b). As a result, the N:P ratio of the inorganic nutrient input (N:P = 68 ± 9) is even higher than that in the total nutrient input (N:P = 48 ± 5); both ranges are calculated over 1970–2006. In contrast to these uniformly high values, the N:P ratio estimated from the basin-wide inorganic pools decrease from the very high values in the Bothnian Bay, indicating severe phosphorus limitation, to almost “Redfield” values in the Bothnian Sea and Gulf of Riga, to extremely low values in the strongly nitrogen-limited Baltic Proper (Table 1). Such inter-basin distribution of nutrient limitation is well-known from analyses of the winter nutrient maxima in surface water layers (e.g., Granéli et al., 1990; Nausch G. et al., 2008; Schneider et al., 2017; Snoeijs-Leijonmalm and Andrén, 2017a). Here, it is demonstrated on the whole-basin annual scale.
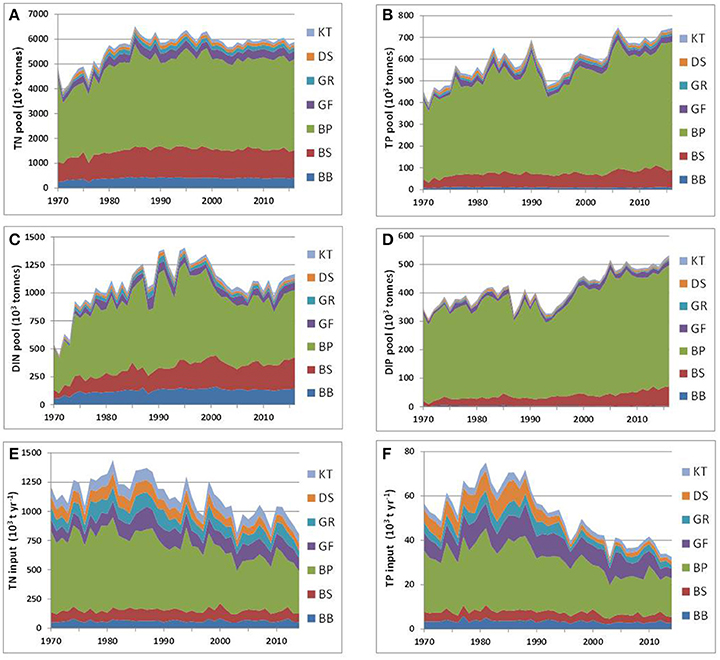
Figure 3. Long-term dynamics of internal nutrient pools (1970–2016) and external nutrient inputs (1970–2014) in the major Baltic Sea basins: total (A) nitrogen TN and (B) phosphorus TP, dissolved inorganic (C) nitrogen DIN, and (D) phosphorus DIP, integral annual input of (E) nitrogen, and (F) phosphorus. Time (years) is on the horizontal axis. For abbreviated basin names see Figure 1. Note different scales.
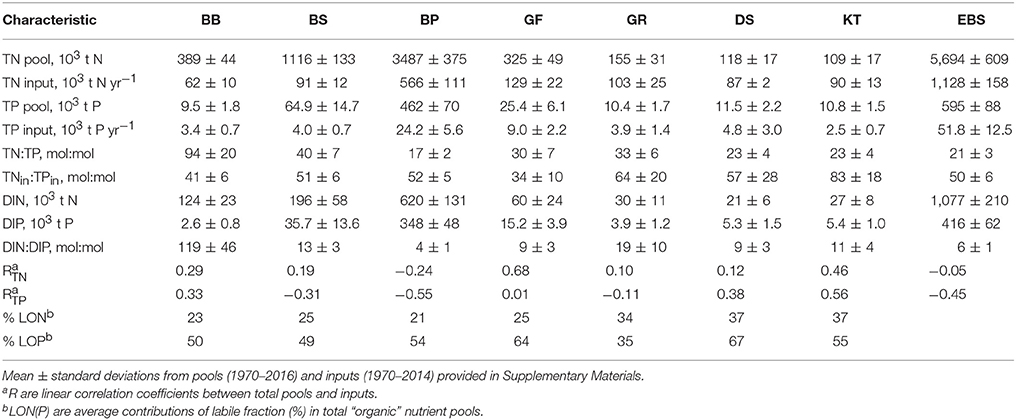
Table 1. Characteristics of the nutrient biogeochemical cycles in the major basins (Figure 1) and the entire Baltic Sea (EBS).
Degradability of Organic Nutrients
Both the spatial distribution and long-term dynamics of organic nitrogen are less variable than those of organic phosphorus. Apparently, an important reason for that is the different composition of refractory and mobile fractions. Humic substances have a higher proportion of nitrogen; easily degradable “organic” fractions have a higher proportion of phosphorus (Nausch and Nausch, 2011), part of which, in oxic conditions, can be associated with iron-humic complexes as well as phosphates adsorbed on particles (e.g., Ylöstalo et al., 2016; Li et al., 2017). Unfortunately, the existing information on organic nutrients, especially on their degradability is rather fragmentary (e.g., Nausch G. et al., 2008; Hoikkala et al., 2015; Knudsen-Leerbeck et al., 2017; Seidel et al., 2017). Therefore, first-order estimates of the degradable fraction of organic nutrients were made as follows. The monthly average vertical distributions of the total and inorganic nutrients were calculated with the option “Seasonal” of the “Marine distributed databases” module of the Baltic Nest over 2005–2014 for all the major basins as a whole except Baltic Proper, where data were extracted within 10 NM (nautical miles) radius around oceanographic station BY-15. Depending on the data availability and avoiding the effects of redox variations in the bottom layers, only data for the upper layer were used in further analysis: 0–60 m in BS, GF, KT and at BY15, 0–40 m in BB, and 0–30 m in GR and DS. Next, the basin-wise decadal mean seasonal dynamics of “organic” nutrients were calculated as the difference between vertical profiles of total and inorganic nutrients averaged within each of 12months. Then every “organic” nutrient field was inspected for a minimum that usually was expected to be found in winter time and in deeper layers. That minimum value was further decreased by 10%, a value assumed to representing the refractory, very slowly degradable fraction, and subtracted as a constant from the original “organic” field. The time-depth concentration fields obtained were considered to represent labile fractions; their statistics are found in Table 1. Although such estimates should be considered as rather simplified, semi-qualitative approximations, the time depth variations obtained look rather plausible (see examples in Supplementary Material): the lower values are found in the deeper parts of upper layers, while in the surface layers the effects of extracellular excretion from spring and summer phytoplankton blooms, followed by sedimentation and lysis of degrading seston, could be recognized with a little imagination. The main result of this large-scale exercise, performed in every basin on thousands of measurements, is similar to deductions made from scarcer data (Hoikkala et al., 2015; Seidel et al., 2017): the share of the labile fraction of organic nitrogen (21–37%) increases toward the Baltic Entrance area and is significantly lower than that of phosphorus (35–67%).
Changes in Seasonal Dynamics
Long-term, vertically resolved time-series of the water temperature, dissolved oxidized nitrogen (nitrite + nitrate), and phosphate were extracted with the “Marine distributed databases” module of the Baltic Nest with a 15-day resolution at a time span 1976–2015 for the Arkona basin in the south-western Baltic Sea and within 10 NM radius around oceanographic station BY-15. The resulting15 day means obtained were further averaged over the surface water layer from 0 to 15 m. Finally, the average seasonal dynamics with half-month resolution were calculated for two decades separated by a thirty-year gap, 1976/85 and 2006/15. For the Bothnian Sea similar time series were obtained from three-dimensional fields reconstructed with DAS as decadal averages for consecutive half-months. Such a basin-wide approach also made it possible to demonstrate changing seasonality in the field measurements (Figure 4), in addition to that revealed by remote sensing and numerical simulation (Kahru et al., 2016). The general warming of the Baltic Sea surface waters (Figures 4A,D,G), from the Kattegat to the Bothnian Bay (not shown), could also imply an earlier start to the productive season. However, the corresponding changes in nutrient dynamics are not evident. Even earlier decline of nutrient concentrations in the Baltic Proper (Figures 4E,H) could not be unequivocally attributed to the warming. Here, the winter surface maximum of nitrate concentration has markedly decreased (Figure 4E) because of denitrification (see Figure 5 below), while the maximum of phosphate concentration remained about the same (Figure 4F). In contrast, the winter maximum of nitrate concentration in the Bothnian Sea has slightly increased (Figure 4B), thus shifting nutrient limitation toward “Redfield equilibrium,” on average, from N:P = 13 to N:P = 14.2, estimated over three winter months (January to the beginning of April). However, the summer (July-August) N:P levels still indicate strong nitrogen limitation despite a slight increase, from N:P = 2.8 to N:P = 4.2 in 30 years. The spring drawdown of nitrate, from winter maximum to summer levels, has also increased in the Bothnian Sea implying larger incorporation of nitrogen into organic matter that might explain increased chlorophyll “a” concentration (Kuosa et al., 2017).
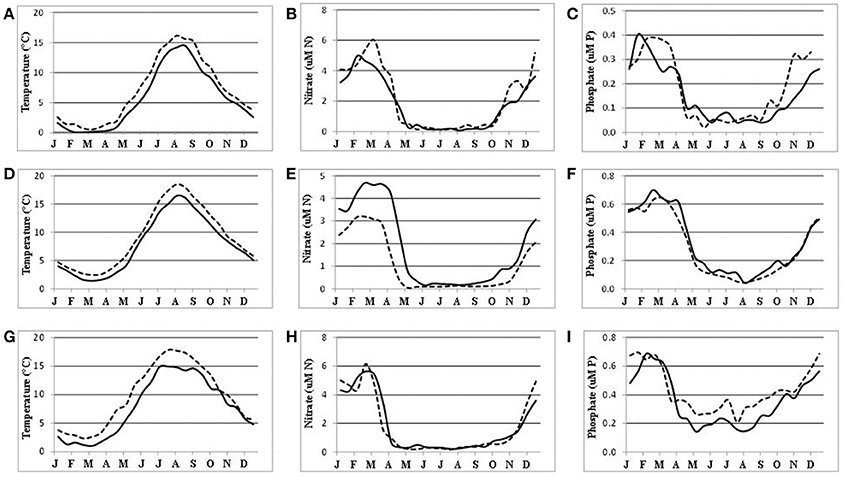
Figure 4. Seasonal dynamics of the water temperature (A,D,G left column), nitrate (B,E,H middle column), and phosphate (C,F,I right column) in the surface (0–15 m) water layers of the Bothnia Sea (A,B,C upper row), at oceanographic station BY-15 (D,E,F middle row), and in the Arkona basin (G,H,I bottom row) averaged over 1976/85 (solid curves) and 2006/15 (dashed curves). Time (months) is on the horizontal axis. Note different scales.
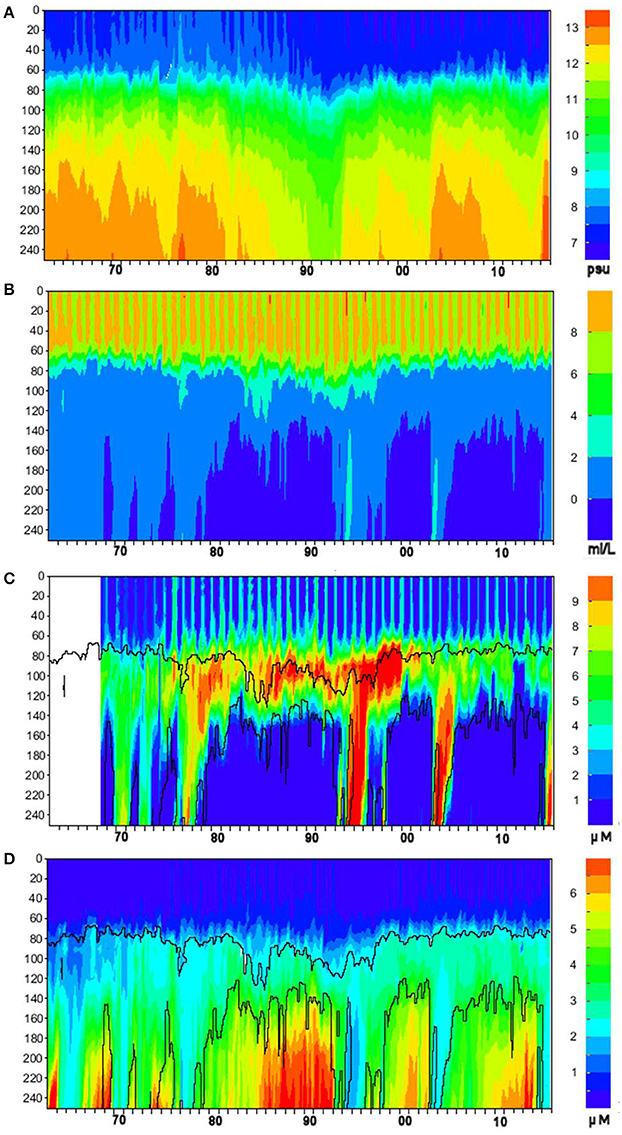
Figure 5. Time-depth dynamics of (A) salinity (psu), (B) oxygen (mL L−1), (C) nitrite + nitrate (μM N–NO2+3), and (D) phosphate (μM P–PO4) concentration for 1963–2015 at oceanographic station BY-15. Time (years) is on the horizontal axis, depth (meters) is on the vertical axis, color scale is shown in the palettes to the right. Contour plots of nitrate and phosphate are overlaid with oxygen isopleths of 2 mL L−1 (upper curves) and 0 mL L−1 (lower curves).
Redox Alterations of Nutrient Pools
Long-term time-series of salinity, oxygen, dissolved oxidized nitrogen (nitrite + nitrate), and phosphate were extracted with the “Marine distributed databases” module of the Baltic Nest with a 30-day resolution over the period 1963–2015 within 10 NM radius around oceanographic station BY-15 (Figure 5). For plotting, missing values due to gaps in observations longer than a month but shorter than half a year were replaced by interpolation. Despite the lack of data indicated by the empty strip in Figure 5C, the plot's temporal range is kept the same as other plots for visual comparability. These plots demonstrate one of the most important features of the Baltic Sea hydrography and nutrient dynamics: the ventilation of deep layers by sporadic intrusions of heavy saline waters from the Kattegat, the so-called Major Baltic Inflows (MBIs) described and analyzed in detail in abundant literature (e.g., Fonselius, 1969; Matthäus et al., 2008). In the absence of such deeply-penetrating advective inflows, the rate of oxygen consumption for oxidation of organic matter exceeds the rate of ventilation by other mixing processes, the oxygen content is depleted as at first hypoxia (oxygen deficiency) and then anoxia (absence of oxygen, which is replaced by hydrogen sulfide) gradually develops until the next MBI. As clearly seen in Figure 5, these redox alterations bring about opposite changes in nutrient concentrations: nitrate is denitrified in the hypoxic zone, while phosphate is released in the water because of destruction of particulate iron-humic complexes in the anoxic environments of sediments and water column (e.g., (Conley et al., 2009a; Savchuk, 2010) and references therein). As denitrification stops in anoxic conditions and remineralized nitrogen is released in reduced form, the ammonium dynamics (not shown) looks very similar to that of phosphate, reaching in the near-bottom layers up to 30–40 μM N–NH4 just before the arrival of inflowing waters.
These changes, generated by redox alterations in the deep layers, gradually envelop the entire water body and result in large variations of inorganic nitrogen and phosphorus pools reaching hundreds of thousand tons (Figure 6). In contrast to similar analyses by Savchuk (2010), which cover the period up to 2005 and consider only variations in waters deeper than 60 m, DIN, and DIP pools in Figure 6 are calculated for the entire water body of the Baltic Proper. As seen in Figure 7, these additional 11 years of reliable data not only confirm the previous findings with even slightly higher correlation coefficients (R = −0.64 vs. −0.60 and 0.75 vs. 0.67 for the deep-water DIN and DIP pools, respectively) but demonstrate similar relationships at a whole-basin scale. Naturally, such oppositely-directed changes of DIN and DIP pools result in a strong relationship between the basin-wide DIN:DIP ratio and hypoxic area with R = −0.53. Considering a 2-year lag between the DIN:DIP ratio and annual extension of hypoxic area results in a decrease of the coefficient down to R = −0.83, most likely due to the delay needed for the expansion of deep-water changes over the entire basin.
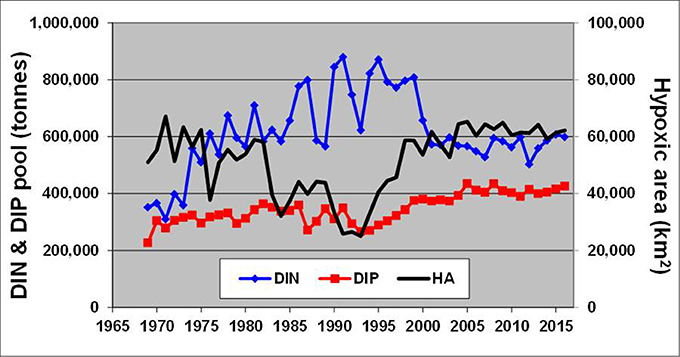
Figure 6. Long-term dynamics of hypoxic area (km2) calculated from annually-averaged three-dimensional oxygen fields reconstructed from observations in the Baltic Proper shown together with DIN and DIP pools (tons). Time (years) is on the horizontal axis.
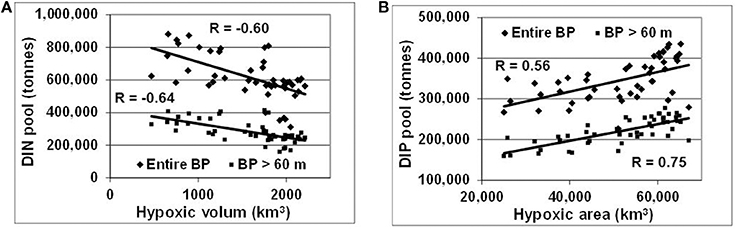
Figure 7. Relationships between hypoxia and nutrient pools in the entire water body and deep layers (>60m) of the Baltic Proper. (A) DIN and (B) DIP pools are related to hypoxic volume (km3) and area (km2), respectively. R is correlation coefficient placed near corresponding regression lines.
Nutrient Budgets
Empirical nitrogen and phosphorus budgets (Figure 8) were assembled from the nutrient pools and external inputs averaged over the 2005–2014 time interval. Basin-wide salinities used for computation of the water flows transporting nutrients between basins were extracted from BED and averaged with DAS for the same period. This time interval was chosen not simply based on the latest availability of external loads but also because the total nutrient content of the Baltic Sea during this decade was relatively constant (cf. Figure 3), which supports a steady state assumption used in budgeting. For the entire Baltic Sea, the coefficients of variation (CV, the ratio of the standard deviation to the average, %) of the integral amount of total nitrogen (CVN = 1.4%) and total phosphorus (CVP = 3.6%) are significantly lower than those estimated for 1991–1999, the time interval of previous budget composition, (i.e., CVN = 3.0% and CVP = 9.9%; Savchuk, 2005). In the current budgeting procedure, three important assumptions have been changed from the study described in detail by Savchuk (2005). First, the external terrestrial loads are no longer retained in the coastal zone, which increases nutrient load to the water body and, consequently, results in higher internal “sinks” found by the difference between integral input and output to every basin. Second, there are no prescribed nitrogen inputs assumed to be generated by nitrogen fixation. Consequently, the nitrogen “sink” is interpreted here not as an integral output from the system due to denitrification and sediment burial but rather as a difference between nitrogen fixation and the integral output that follows the LOICZ interpretation (Gordon et al., 1996). Third, nutrient concentrations needed for calculation of advective transport between the Baltic Proper and surrounding basins were not taken to be equal to the basin-wide averages but are estimated from the special polygons in the northern Baltic Proper and near the entrances to the Gulf of Riga and Danish Straits, that is for the same areas used for computation of boundary salinities required to calculate the water flows (see further details in Savchuk, 2005).
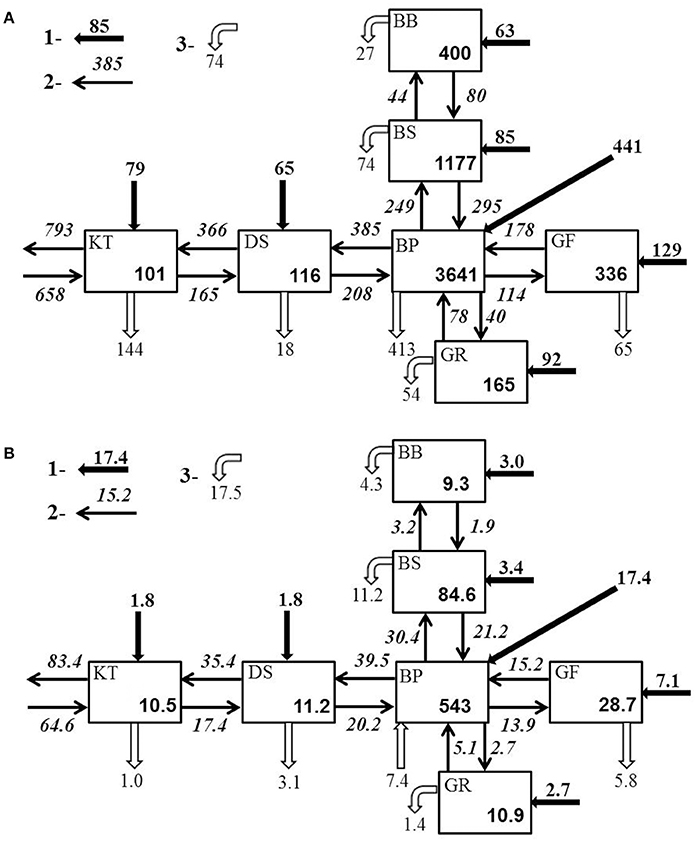
Figure 8. Total (A) nitrogen and (B) phosphorus budgets of the Baltic Sea for 2005–2014. Average total amounts are in 103 tons. Average external inputs (1), transport flows (2), and sink/source fluxes (3) are in 103 tons yr−1.
As demonstrated by the budgets, the nitrogen and phosphorus transport between the Baltic Sea basins are quite comparable to- and often significantly larger than external loads to the basins. As a result, summing the internal advective inputs and the local external inputs significantly reduces nutrient residence time and retention capacity estimated for individual basins. Conversely, this compensatory potential of inter-basin nutrient transport increases total buffer capacity of the entire Baltic Sea ecosystem and has a dual meaning relevant to management considerations. On the one hand, local changes of watershed nutrient loads into any basin would inevitably affect all other basins and become amplified in this basin due to the “advective feedback” determined by the change of concentration in neighboring basins. As can be estimated from the nitrogen effects matrix (Table 2), if the annual external input to the Baltic Proper (for instance, because of the nitrogen fixation) would increase by 10,000 tons N yr−1, the total nitrogen input into the Bothnian Sea and Danish Straits would eventually increase by 3,560 and 5,310 tons N yr−1, respectively. Similarly, as follows from the phosphorus effects matrix (Table 3), the reduction of watershed phosphorus load to the Gulf of Finland by 1,000 tons P yr−1 would eventually lead to a decrease of the total phosphorus input to the Baltic Proper and Gulf of Riga by 1,755 and 60 tons P yr−1, respectively. Unfortunately, such feedbacks might be overlooked when presenting and considering only the “net” effect of inter-basin exchange. On the other hand, the key word in such basin-wise estimates is “eventually” because an initial response to changing input in the managed basin would be counteracted by slower changes in the adjacent basin(s). The information in these matrices also indicates the importance of the Baltic Proper for understanding spatial nutrient distributions over the entire sea.
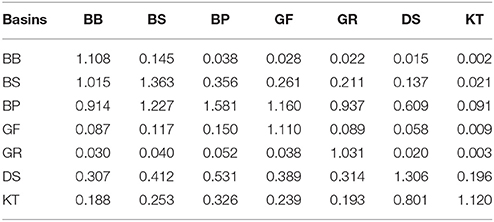
Table 2. Nitrogen load effects matrix: changes of the total input into “row” basins due to a one-unit changes of the local load to the “column” basin.
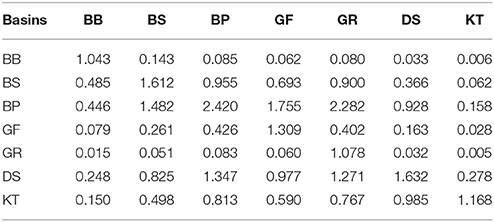
Table 3. Phosphorus load effects matrix: changes of the total input into “row” basins due to a one-unit changes of the local load to the “column” basin.
Comparison of the annual external inputs to the entire Baltic Sea of 953 × 103 tons N and 37 × 103 tons P to the annual net exports to the Skagerrak of 135 × 103 tons N and 18.8 × 10³ tons P indicates a large retention (“filter”) capacity of the Baltic Sea in a global perspective. The higher efficiency of nitrogen retention of 86% comparing to phosphorus retention of 49% is well-explained by the massive nitrogen removal mainly due to denitrification occurring ubiquitously in the sediments and hypoxic water.
Discussion
Nutrient Budgets
Nutrient budgets, both empirical (e.g., Figure 8) and simulated with biogeochemical models are convenient tools for (a) integration of specific data and knowledge obtained in different marine disciplines, (b) examination of consistency and, finally, (c) presentation of results to a diverse audience, from the scientific community to decision makers to the general public. Particularly important for the management applications is the compensatory role of interconnectivity resulting from transport across basin boundaries and the retention capacity determined by the internal sinks. The plausibility of different components of the assembled budgets is discussed below.
Nutrient Budgets: External Inputs and Advective Transports
External inputs
The prescribed nutrient inputs are based on a careful compilation of historical data (Savchuk et al., 2012b) and dedicated work of an international expert group (Svendsen et al., 2017) within the continuous HELCOM process of periodic load compilation (e.g., HELCOM, 2015). Although further improvements in data availability and reliability can be expected (i.e., filling minor data gaps and publishing time series on inorganic fractions), the time series presented here should be considered as the best available at this time.
Inter-basin water flows and boundary concentrations
Another important component of the budgets is the nutrient exchange between basins. Generated by the water flows that can be considered as natural driving forces, the advective nutrient transports are responsible for the internal connectivity of the Baltic Sea ecosystem and its high buffer capacity. Together with external inputs, the exchange determines empirical estimates of nutrient sinks that determine the filtering capacity of sea. The annual transport of nutrients is calculated as a product of water flow and concentration, hence, the reliability of the estimates depends on both factors.
Although more detailed investigations of the exchange between sub-basins are still needed (Omstedt et al., 2014), the annual water flows used here for the budgeting are comparable to the independent estimates of the water exchange and consistent with the associated water ages and residence times derived in numerous publications for similar long-term basin-wide scales (Andrejev et al., 2004; Savchuk, 2005 and references therein; Meier, 2007; Leppäranta and Myrberg, 2009). As no climate-driven changes in the large-scale circulation of the Baltic Sea have been detected so far (BACCII Author Team, 2015), the water flow estimates from different time intervals over the last half century show no long-term unidirectional trends. On the other hand, according to similar estimates made with Knudsen formulae (not shown), during wetter decades of 1980s−1990s the inter-basin water flows were about 5–20% larger than during 2005–2014. Within such uncertainty, the implemented water flows can be considered as realistic as the external inputs.
In contrast to other basins, where “export” concentrations are just taken as decadal integral basin-wide averages, nutrient exports from the Baltic Proper are here determined by the choice of concentrations in the vicinity of entrances to neighboring basins. If their values were similarly prescribed as the basin-wide averages (see also Savchuk, 2005), then nitrogen exports to the gulfs and Danish Straits would change by 2–6% with correspondingly insignificant changes in the nitrogen sinks, while phosphorus imports from the Baltic Proper and phosphorus sinks in the neighboring basins would increase drastically. As a compensation for augmented export, the phosphorus “source” in the Baltic Proper would increase up to 35 × 103 tons P yr−1. Prescription of “export” concentration as an average for the Baltic Proper surface layer (0–60 m) as was done, for instance, by Wulff et al. (2001b), would again result in only minor changes of nitrogen budget but the phosphorus budget would change even qualitatively with gulfs importing much less phosphorus and the “source” in the Baltic Proper becoming a sink of 5.7 × 10³ tons P yr−1.
The weak response of the nitrogen budget to these arbitrarily choices can be explained by the comparatively homogeneous distribution of total nitrogen, with a very high proportion of refractory fraction (see sections Long-Term Dynamics of Nutrient Pools and Loads and Degradability of Organic Nutrients and Table 1) less subject to internal biogeochemical transformations. But because of much stronger and divergent responses of the phosphorus budget components, in this study I chose specific boundary concentrations as an intermediate option between two extremes described above - the basin-wide or surface layer averages. On the one hand, the basin-wide average (2005–2014) concentration of 1.38 μM TP-P is determined by the extremely high phosphorus content in the deep layers (cf. Figures 3, 5) and could hardly be considered as representative for the water flowing out over sills toward the gulfs and Danish Straits. On the other hand, the average surface (0–60 m) TP concentration of 0.88 μM would underestimate phosphorus contents in the waters outflowing from the northern Baltic Proper through rather deep entrances to the Gulf of Finland and Bothnian Sea. Occurrences of the net phosphorus imports to these basins are also suggested by careful regional analyses (e.g., Rolff and Elfwing, 2015; Lehtoranta et al., 2017). In addition, estimating both salinity and nutrient concentrations from the same boundary domains seems more consistent.
Comparison to recent estimates
Quantitative comparison to recently simulated nutrient inter-basin exchanges is complicated by two factors: averaging over different time intervals (Gustafsson et al., 2017) and, considering only the bioavailable fraction of nutrients (Liu et al., 2017). Nevertheless, the empirical (Figure 8) and simulated (Gustafsson et al., 2017) net nutrient transports agree within a factor of two. However, in the budgets constructed with the three-dimensional biogeochemical model, in which simulated nutrient concentrations are drastically corrected by the data assimilation procedure (Liu et al., 2017), the net nutrient exchanges are generally smaller by an order of magnitude and, in some straits, have the opposite direction to fluxes in the budgets presented here and simulated by Gustafsson et al. (2017). As a result, in the simulation by Liu et al. (2017) the entire Baltic Sea appears to be less interconnected and exhibits more nutrient retention.
Role of Skagerrak
Estimates of the advective transports are particularly important at the Skagerrak boundary, where nutrient imports should be considered as external inputs, which are often overlooked or neglected in the management considerations (e.g., HELCOM, 2015) even though their contribution could be quite substantial. As was estimated with the SANBALTS model, if all the other external inputs were cut off, the import from Skagerrak alone of 356 × 103 tons TN yr−1 could eventually sustain over 600 × 103 tons of DIN in the entire Baltic Sea, which is about half that of the pools found in contemporary (cf. Table 1) or simulated for pre-industrial conditions (Savchuk et al., 2008). The corresponding phosphorus import and pool would be 30 × 103 tons TP yr−1 and 85 × 103 tons of DIP, respectively. In more realistic simulations considering all external inputs, the resulting effects of nutrient import, estimated either using a nutrient-tagging technique (Radtke and Maar, 2016) or by scenario reductions of the Skagerrak concentrations (Meier et al., in preparation), are less significant and more pronounced in phosphorus cycling relative to nitrogen cycling.
Nutrient Budgets: Internal Sinks
Large-scale eutrophication occurs when nutrient inputs (sources) exceed nutrient outputs (sinks) over the long term. Usually, nutrient inputs, determined by terrestrial and atmospheric contributions as well as by the water exchanges between neighboring basins, are accounted for more reliably than nutrient sink/source terms calculated by the difference (see section Nutrient Budgets). Therefore, particular attention should be paid to the reliability of estimated internal sinks representing intra-basin biogeochemical processes.
Coastal retention
In the budgets presented above, in which coastal retention is ignored, quantitative changes in estimates of total sinks could be introduced by prescribing nutrient retention in the coastal zone, as was done by Savchuk (2005). There, basin-wise nitrogen and phosphorus coastal retention were provided from the compilation by Sjoberg et al. (2002). Fifteen years later, a new compilation was made by Asmala et al. (2017). These estimates of nutrient removal in the coastal zone by denitrification and phosphorus burial could be subtracted directly from the total basin-wise sinks calculated here (cf. Figure 8). Such reductions of the offshore sinks constitute from 10–15% (gulfs) to 24% (BP) and 49% (DS) of basin-wide nitrogen sinks estimated from empirical budgets, and appear plausible. The suggested phosphorus removal in the coastal zone of about 17 × 103 tons P yr−1 that amounts to nearly half of contemporary external phosphorus input (cf. Figure 3F) seems to be more questionable. Subtracting these coastal removals from basin-wide phosphorus sinks estimated by budgeting, would convert the overall P sink in the Gulf of Riga into an annual P bottom release of 0.4 × 10³ tons P yr−1 and almost double the internal P release in the BP (up to 15.4 × 10³ tons P yr−1). Moreover, the suggested phosphorus removal in the coastal Bothnian Sea of 3.4 × 10³ tons P yr−1 is about twice the terrestrial load of P, thus implying a significant import from the offshore areas. Phosphate transport from deeper into shallower areas has also been estimated by budgeting (Witek et al., 2003) and simulated with biogeochemical models (Savchuk, 2000; Savchuk et al., 2009; Eilola et al., 2012). Such transport is even projected to increase in the future due to reduced terrestrial loading and enhanced phosphorus bottom release in warmer environments (Eilola et al., 2012; Almroth-Rosell et al., 2016). Still, the simulated annual phosphate imports into the coastal areas are on the order of hundreds, rather than thousands, of tons, as suggested by Asmala et al. (2017).
Phosphorus burial
At the long-term basin scale, the removal of nutrients from active biogeochemical cycling due to permanent burial can be considered as proportional to the sediment accumulation rate, nutrient content, and total area of accumulation bottoms. From this simple perspective on the actual mosaic of sediment distributions (e.g., Carman and Cederwall, 2001; Winterhalter, 2001; Leipe et al., 2017), the inter-basin differences in annual burial fluxes of phosphorus (cf. Figure 8B) look rather plausible: the higher area-specific rates of 0.12–0.19 g P m−2 yr−1 are found in the northern gulfs with well-oxidized bottoms (Raateoja, 2013; Ahlgren et al., 2017) and thicker annually accumulating layers (Mattila et al., 2006; Slomp et al., 2013). An exception is the phosphorus “source” in the Baltic Proper that is discussed separately below.
Denitrification
As phosphorus sinks obtained by budgeting are pretty similar to estimates made by the simulation (Savchuk and Wulff, 2007; Gustafsson et al., 2017), the modeling results can also be used to deconstruct nitrogen sinks (cf. Figure 8A) into their components. From mass balance considerations, the empirical nitrogen sink is a difference between nitrogen input due to nitrogen fixation and nitrogen removal due to the combined action of burial and denitrification. Here, the basin-wise denitrification rates can be estimated by altering empirical sinks with nitrogen fixation and burial fluxes borrowed from the SANBALTS simulation (Savchuk and Wulff, 2007). The integral denitrification of 1.18 × 10⁶ tons N yr−1 obtained using this hybrid approach compares well to simulated fluxes of 1.20 × 10⁶ tons N yr−1 (Savchuk and Wulff, 2007) and 1.15 × 10⁶ tons N yr−1 (Gustafsson et al., 2017). Almost two thirds of this removal (757 × 103 tons N yr−1) occurs in the Baltic Proper. Furthermore, expressed in conventional units, the denitrification rate of 0.13 mmol N m−2 day−1 in the oligotrophic Bothnia Bay is, as expected, smaller than the rates of 0.72 and 1.3 mmol N m−2 day−1, estimated here for the hypoxic and eutrophic Baltic Proper and Kattegat, respectively. These rates are still lower than median of 1.5 mmol N m−2 day−1 of the range for sediment denitrification rates compiled for hundreds of sites by Fennel et al. (2009).
Recent estimates of denitrification, obtained by up-scaling field measurements, fell in the ranges of 426–652 × 103 tons N yr−1 for the entire Baltic Sea sediments (Deutsch et al., 2010) and 132–547 × 103 tons N yr−1 for the Baltic Proper pelagic system (Dalsgaard et al., 2013). The sediment denitrification of 150–200 × 103 tons N yr−1 was estimated for the deeper (>60 m) sediments occupying less than a half of the entire Baltic Proper bottom area (Noffke et al., 2016; Hall et al., 2017; Sommer et al., 2017). Thus, our hybrid estimates reasonably match the upper bounds for both the entire Baltic Sea and Baltic Proper. The necessity of massive nitrogen removal follows also from simple mass balance considerations at a system scale. As there are no significant variations either in TN or DIN pools in recent times (cf. Supplementary Tables 1, 3, Figures 3A,C), the total input has to be balanced by the total output. Consequently, with an annual total input of about 2 × 10⁶ tons N, composed of the external loads (0.95 × 10⁶ tons N), import from the Skagerrak (0.65 × 10⁶ tons N), and nitrogen fixation (0.4 × 10⁶ tons N), the total remaining TN to be removed before export to the Skagerrak (0.8 × 10⁶ tons N) is some 1.2 × 10⁶ tons N.
Release of phosphate
Compared to nitrogen, the total phosphorus “output” of 18 × 103 tons P yr−1 calculated here using a budgeting approach is less effective not simply because it occurs only by the slow phosphorus burial in sediments but also because of the internal “source” of 7.4 × 10³ tons P yr−1 in the Baltic Proper which tends to balance the estimated net export (cf. Figure 8B). In conventional units, this amounts to about 0.01 mmol P m−2 day−1 released from an average (2005–2014) hypoxic area of 61 × 103 km2 (cf. Figure 6). This is dozens of times lower than the measured rates of “internal loading” (e.g., Viktorsson et al., 2013; Noffke et al., 2016; Hall et al., 2017; Sommer et al., 2017). Extrapolating (by these authors) up to the basin scale, this “internal load” is up to 100–150 × 103 tons P yr−1. This estimate exceeds by many times not only the external load of 37 × 103 tons P yr−1 but also the combined output by the burial of 25–30 × 103 tons P yr−1 and the net export to Skagerrak of 11–17 × 103 tons P yr−1, obtained both in empirical budgets (cf. Figure 8B; Wulff et al., 2001a; Savchuk, 2005) and simulated (Savchuk and Wulff, 2007; Gustafsson et al., 2017). The resulting imbalance, on the order of × 105 tons P yr−1, would have caused a pelagic accumulation of total phosphorus 10 times faster than occurred during the last quarter of century (cf. Figure 3B). As a term, “internal loading” is erroneous and misleading not only because it gives a false idea of some “alchemical generator” of phosphorus inherent to the sediments, but also because its interpretation ignores sedimentation of phosphorus from the pelagic system. Therefore, we should always compare the phosphate release with the pelagic sedimentation and then consider how the sediment retention and eventual burial of deposited phosphorus could be weakened by anoxia or enhanced by re-oxygenation.
The Vicious Circle
The inorganic nitrogen removal due to denitrification and release of accumulated phosphate from anoxic bottoms (cf. Figures 5–7) result in a Redfield excess of inorganic phosphorus (eDIP = DIP–DIN/16; Janssen et al., 2004; Deutsch et al., 2007; Kahru et al., 2007; Raateoja et al., 2011). This excess forces dinitrogen into biotic cycling via nitrogen-fixing cyanobacteria, thus increasing primary production, sedimentation and decomposition of organic matter, which, in turn, leads to further expansion of the hypoxic zone with increased denitrification and DIP release. Shrinking of the hypoxic zone after sporadic Major Baltic Inflows of saline oxygen-replete waters causes opposite changes in the N and P pools, but today the improved oxygen conditions do not last long (Neumann et al., 2017). All the major components of this large-scale feedback loop in the biogeochemical cycles of the Baltic Sea have been known throughout history (Richards, 1965; Fonselius, 1969; Grasshoff and Voipio, 1981) and continue being studied and demonstrated in increasing detail, from paleo-reconstructions and large-scale considerations to laboratory experiments (e.g., Conley et al., 2002, 2009a; Vahtera et al., 2007b, 2010; Nausch M. et al., 2008, 2012; Savchuk, 2010; Ploug et al., 2011; Raateoja et al., 2011; Funkey et al., 2014; Adam et al., 2016; Olofsson et al., 2016; Motwani et al., 2018). Nutrient fluxes generated by these processes have also been plausibly described in our biogeochemical models for over 30 years (e.g., Savchuk, 1986; Savchuk and Wulff, 1999, 2001, 2009; Gustafsson et al., 2012, 2017; Savchuk et al., 2012a). However, the term “vicious circle” was given to this feedback loop that self-sustains Baltic Sea eutrophication only a decade ago (Vahtera et al., 2007a).
Recent long-term reconstruction of the summer cyanobacterial accumulations (Kahru and Elmgren, 2014; updated until 2016 according to personal communication from Mati Kahru) enables an empirical illustration of the full vicious circle, from varying hypoxia and redox alterations of nutrients to cyanobacterial variations (Figure 9A), in which the Redfield phosphate excess is calculated from the average nutrient pools integrated over the entire Baltic Proper (cf. Figure 6). Interestingly, this rather strong relationship (R = 0.76) between eDIP and total area of cumulative (over July–August) cyanobacteria coverage (TCA) emerges only at a large, whole-basin annual scale, whereas several attempts to establish similar relationships with winter surface nutrient concentrations at local and regional scales were generally less successful (e.g., Kahru et al., 2007; Raateoja et al., 2011; Schneider et al., 2014). Water temperature is considered another important ecological factor favoring summer cyanobacterial blooms (e.g., Wasmund, 1997; Wasmund and Siegel, 2008), as can be justified by the relationship between TCA (103 km2) and average summer (July-August) temperature (TJA, °C) in the surface (0–15 m) layer at BY-15 (Figure 9B). Taken together, these necessary (eDIP) and sufficient (TJA) conditions for cyanobacterial blooms result in a statistically significant multiple linear regression: TCA = 0.6*eDIP + 20.9*TJA – 395 that describes variations of the total cyanobacterial accumulations TCA (R2 = 0.7).
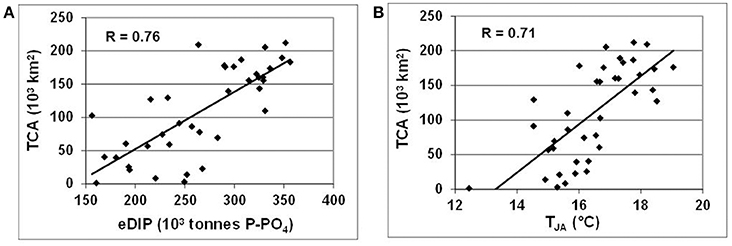
Figure 9. Relationships between total area of cyanobacterial accumulations (TCA, 103 km2) and (A) Redfield excess of inorganic phosphorus (eDIP, 103 tons P) in the entire Baltic Proper, and (B) average summer (July-August) surface (0–15 m) water temperature at oceanographic station BY-15.
According to both empirical estimates and results of simulations (e.g., Wasmund and Siegel, 2008; Meier et al., 2012; Savchuk et al., 2012a; Gustafsson et al., 2017), cyanobacterial nitrogen fixation can add up to 400–600 thousand tons of nitrogen annually that is readily available to primary producers and the supported food chain (Svedén et al., 2016; Motwani et al., 2018). This amount is comparable in magnitude to the external nitrogen input (cf. Table 1). Thus, apart from such harmful effects of cyanobacteria blooms as degradation of recreational potential and increased water toxicity, this self-supporting vicious circle (Vahtera et al., 2007a,b) counteracts nitrogen load reduction efforts and causes other ecosystem effects generated and sustained by hypoxia, including damage to cod reproduction and condition (MacKenzie et al., 2000; Casini et al., 2016). On the other hand, the cyanobacteria blooms stimulate summer production in the entire food web, from zooplankton and benthos to fish (Karlson et al., 2015; Svedén et al., 2016).
The major direct impact of global warming on the Baltic Sea vicious circle is exerted by the increasing water temperatures (cf. Figure 4). In the surface layer, TJA have been increasing since 1979 on average by 0.08°C yr−1 (R = 0.65) that may cause a prolongation of the blooming period (Kahru et al., 2016), while inter-annual variations may play a role in fluctuations of TCA (cf. Figure 9B). In the deep layers (>60 m) of the Baltic Proper, the annual average temperature computed with DAS has been increasing since 1979 on average by 0.04°C yr−1 (R = 0.8); that growth in temperature will accelerate oxygen consumption as organic matter is oxidized.
Management Considerations
Although the fundamental large-scale properties described above have been known for decades (e.g., Wulff et al., 2001b; Feistel et al., 2008; Snoeijs-Leijonmalm et al., 2017b) and much of this knowledge had already been used to develop and revise the eutrophication segment of BSAP (HELCOM, 2007, 2013b), efficient ecosystem management of the Baltic Sea still suffers from some confusion of concepts and misinterpretation of data.
In both the severely phosphorus-limited oligotrophic Bothnian Bay (cf. Table 1) and in the well-oxygenated Bothnian Sea, the entire offshore areas show no signs of eutrophication (e.g., Raateoja, 2013; Rolff and Elfwing, 2015; Kuosa et al., 2017). Therefore, neither basin has been considered as requiring nutrient load reductions in the BSAP (HELCOM, 2007, 2013b). Yet, according to some criteria implemented within a formalized approach, both basins are indicated as eutrophic (e.g., Fleming-Lehtinen et al., 2015; Andersen et al., 2017; HELCOM, 2017b). This creates a false impression about the real trophic state of the entire Gulf of Bothnia. Apparently, further development and careful adjustment of the methodology is needed to avoid such confusion.
The compensatory inter-basin nutrient exchanges (cf. section Nutrient Budgets: External Inputs and Advective Transports) and large nutrient pools that have already accumulated in the water body and bottom sediments (cf. Table 1, Figure 3) determine the very limited response of the entire nutrient pools to any likely changes in nutrient loading or oceanographic conditions caused by climate changes. Clear statements about sluggish responses to different scenarios of nutrient load reductions, based on mathematical modeling, have been made for decades (e.g., Wulff and Stigebrandt, 1989; Savchuk and Volkova, 1990; Wulff and Niemi, 1992; Savchuk and Wulff, 1999, 2007, 2009). Higher water temperatures are projected to exacerbate the vicious circle, thus weakening the BSAP management impacts (Meier et al., 2012). The latest simulations made for the first BSAP revision of 2013 indicate that even after fully reducing external nutrient inputs to the “maximum allowable” levels it would take 20–30 years until the winter surface nutrient concentrations would creep down to half of the desired reduction (HELCOM, 2013a). Yet, in many documents HELCOM continues to reiterate its “ambitious goal” about achieving a good ecological and environmental status for the Baltic Sea, i.e., to be unaffected by eutrophication by as early as 2021 (e.g., HELCOM, 2007, 2017a; Backer et al., 2010). Apparently, such a major delay between stated obligations and their actual fulfillment can be harmful to the credibility of expensive management policies, particularly of their accounting for scientific recommendations.
Nutrient-carrying flows from neighboring basins that can counteract local nutrient reduction measures are sometimes overlooked. For instance, linear correlations between local loads and basin-wide nutrient pools are comparatively strong in the Baltic Straits (cf. Table 1), where decades of local nutrient load reductions have indeed resulted in some water quality improvements in the shallow coastal ecosystems (Riemann et al., 2016). However, the importance of nutrient advection from the Skagerrak and Baltic is also evident from very short residence times of 2–3 months that can be calculated from the total nutrient inputs and basin-wide pools (cf. Figure 8). The contribution of advection is further supported by the nutrient effects matrices (cf. Tables 2, 3) showing how nutrient load reductions to the Baltic Proper would cause comparable or even higher reductions to the nutrient inputs to the Baltic Straits. Fortunately, the initial failure to account for this impact on nutrient transports from the Baltic Proper through the Danish Straits and Kattegat (Carstensen et al., 2006; Conley et al., 2007) has been replaced with a careful accounting of contributions from both the local nutrient inputs and exchanges with the Skagerrak and Baltic Proper (Maar et al., 2016). Intensification of the vicious circle in the twenty-first century (Figures 6, 7) decreased nitrate import and increased phosphate import from the northern Baltic Proper into the Bothnian Sea (Rolff and Elfwing, 2015). The resulting phosphorus excess has made cyanobacteria accumulations a permanent feature since 2004–2005 (Kahru and Elmgren, 2014).
Although the local nutrient dynamics of diverse types of coastal water bodies are beyond the scope of this paper, one important feature at the large scale, which is often neglected, is the nutrient exchange between nearshore and adjacent offshore waters. At the open coasts, like those extending along the south-eastern coastline from the Danish Straits in the west to the easternmost Gulf of Finland, intensive nutrient exchange sustained by variety of water movement mechanisms (Omstedt et al., 2014) can maintain nutrient concentrations and trophic conditions at levels similar to the open sea. Consequently, if the trophic state offshore changes more slowly than at the local coast, local nutrient reduction measures would eventually be overcome by nutrient import from the open sea (Eilola et al., 2012; Almroth-Rosell et al., 2016).
From above perspectives, eutrophication in both neighboring basins and local coastal areas are most strongly maintained by the huge phosphorus reserves that have accumulated in the Baltic Proper (cf. Table 1, Figure 3), where they are also self-sustained by the vicious circle. Mitigation of these effects requires a resolution of the two issues that are still being discussed in the context of management decisions (Ahtiainen et al., 2014): (a) N vs. P load reductions (e.g., Conley et al., 2009b and subsequent discussion in Science, vol. 324) and (b) patience vs. geoengineering. As the response of different Baltic Sea ecosystems to load reductions depends on the scales and locations of implemented measures, the general N vs. P reduction debate seem rather pointless (Savchuk and Wulff, 1999). Considering basin scales, the long-term DIN dynamics (cf. Figures 3C, 5C, 6, 7A) show that due to denitrification augmented by expanded hypoxia, the total amount of inorganic nitrogen has been reduced by some 200–300 × 103 tons N, and also resulted in about 30% reduction of winter surface maximum of nitrate (cf. Figure 4E). The amplified nitrogen removal could be to a certain extent counteracted by the increased fixation of dinitrogen implied by the increased accumulation of summer cyanobacteria in recent decades (Kahru and Elmgren, 2014; Figure 9). Therefore, the priority should be given to weakening the vicious circle by substantial reduction of the marine phosphorus pool. Such reduction could eventually be achieved by continuing extensive (and expensive) measures decreasing terrestrial phosphorus loads (HELCOM, 2015, 2017a; McCrackin et al., under revision), which would require decades of patiently tolerating the unpleasant effects of cyanobacteria blooms, from impaired recreation and toxicity to poor food and spawning conditions for cod (e.g., Casini et al., 2016). The reduction might be accelerated by geoengineering methods (e.g., Gustafsson et al., 2008; Rydin et al., 2017; Stigebrandt, 2018), but despite all the achievements in ecosystem modeling of the Baltic Sea (e.g., Meier et al., 2014; Tedesco et al., 2016) there are still no biogeochemical and ecosystem models capable of producing reliable long-term scenario simulations with the required engineering precision to assess these options. Thus, the further development of adequate parameterizations followed by the necessary computations should be considered as one of the most urgent needs in the contemporary study and ecosystem management of the Baltic Sea.
Conclusions
1. Nitrogen and phosphorus dynamics in the major basins of the Baltic Sea during almost half a century (1970–2016) are presented as time series of basin-wide, annually-averaged integral nutrient pools.
2. In contrast to traditionally discussed variations of concentrations, such an approach allows graphical demonstration of the leading contributions of the Baltic Proper to total nutrient reserves and, comparing these reserves to external nutrient inputs, to illustrate the nature of long residence times for TN and TP, on the order of many years.
3. The combination of long residence times and compensatory inter-basin nutrient exchanges determines the high buffer capacity of both the Baltic Sea as a whole and its major basins, attenuating the responses to changes in natural forcing and anthropogenic impacts.
4. Especially important for the present trophic state in Baltic Sea basins is the positive feedback loop (“vicious circle”), driven in the Baltic Proper by excessive phosphorus accumulation, that supports cyanobacterial nitrogen fixation. This, in turn, counteracts nitrogen load reductions and maintains deep-water hypoxia with all its detrimental effects.
5. Because the major share of nitrogen removal occurs via denitrification, while relatively small reductions of the external nitrogen inputs can largely be compensated by cyanobacterial N-fixation fuelled by the presence of excess phosphorus, the depletion of this excess should be prioritized among the management actions.
6. Because of both the high buffer capacity and the vicious circle, ecosystem management faces two choices, albeit not mutually exclusive ones: either continue expensive terrestrial phosphorus load reductions for decades or attempt to accelerate the removal of excess phosphorus by uncertain geoengineering measures, starting from reliable scientific assessments (= scenario simulations) of the consequences of their implementation.
Author Contributions
The author confirms being the sole contributor of this work and approved it for publication.
Funding
The Baltic Nest Institute is supported by the Swedish Agency for Marine and Water Management through their grant 1:11—Measures for marine and water environment.
Conflict of Interest Statement
The author declares that the research was conducted in the absence of any commercial or financial relationships that could be construed as a potential conflict of interest.
Acknowledgments
I would like to thank my long-term colleagues and friends at the Stockholm University Baltic Sea Centre for many years of fruitful cooperation. I thank Dennis Peter Swaney (Cornell University) for his valuable advice on the grammar and style of my English. The data extensively used in our studies have over years been delivered to BED by many individuals, institutions, and agencies, whose contribution is very much appreciated (http://nest.su.se/bed/ACKNOWLE.shtml).
Supplementary Material
The Supplementary Material for this article can be found online at: https://www.frontiersin.org/articles/10.3389/fmars.2018.00095/full#supplementary-material
References
Adam, B., Klawon, I., Svedén, J. B., Bergkvist, J., Nahar, N., Walve, J., et al. (2016). N2-fixation, ammonium release and N-transfer to the microbial and classical food web within a plankton community. ISME J. 10, 450–459. doi: 10.1038/ismej.2015.126
Ahlgren, J., Grimvall, A., Omstedt, A., Rolff, C., and Wikner, J. (2017). Temperature, DOC level and basin interactions explain the declining oxygen concentrations in the Bothnian Sea. J. Mar. Syst. 170, 22–30. doi: 10.1016/j.jmarsys.2016.12.010
Ahtiainen, H., Artell, J., Elmgren, R., Hasselström, L., and Håkansson, C. (2014). Baltic Sea nutrient reductions-what should we aim for? J. Environ. Manag. 145, 9–23. doi: 10.1016/j.jenvman.2014.05.016
Almroth-Rosell, E., Edman, M., Eilola, K., Meier, H. E. M., and Sahlberg, J. (2016). Modelling nutrient retention in the coastal zone of an eutrophic sea, Biogeosciences 13, 5753–5769. doi: 10.5194/bg-13-5753-2016
Andersen, J. H., Carstensen, J., Conley, D. J., Dromph, K., Fleming-Lehtinen, V., Gustafsson, B. G., et al. (2017). Long-term temporal and spatial trends in eutrophication status of the Baltic Sea. Biol. Rev. 92, 135–149. doi: 10.1111/brv.12221
Andrejev, O., Myrberg, K., and Lundberg, P. F. (2004). Age and renewal time of water masses in a semi-enclosed basin—application to the Gulf of Finland. Tellus A Dynamic Meteorol. Oceanogr. 56, 548–558. doi: 10.1111/j.1600-0870.2004.00067.x
Anonymous (2013). Summary Report on the Development of Revised Maximum Allowable Inputs (MAI) and updated Country Allocated Reduction Targets (CART) of the Baltic Sea Action Plan. Available online at: http://www.helcom.fi/baltic-sea-action-plan/nutrient-reduction-scheme/background-on-target-setting/ (Accessed October 24, 2017).
Asmala, E., Carstensen, J., Conley, D. J., Slomp, C. P., Stadmark, J., and Voss, M. (2017). Efficiency of the coastal filter: nitrogen and phosphorus removal in the Baltic Sea. Limnol. Oceanogr. 62, S222–S238. doi: 10.1002/lno.10644
BACC Author Team (2008). Assessment of Climate Change for the Baltic Sea Basin. Regional Climate Studies. Berlin; Heidelberg: Springer Verlag.
BACCII Author Team (2015). Second Assessment of Climate Change for the Baltic Sea Basin. Regional Climate Studies. Berlin; Heidelberg: Springer Verlag.
Backer, H., Leppänen, J.-M., Brusendorff, A. C., Forsius, K., Stankiewicz, M., Mehtonen, J., et al. (2010). HELCOM Baltic Sea action plan–a regional programme of measures for the marine environment based on the ecosystem approach. Mar. Poll. Bull. 60, 642–649. doi: 10.1016/j.marpolbul.2009.11.016
Bartnicki, J., and Benedictow, A. (2016). Atmospheric nitrogen depositions to the Baltic Sea during 1995-2014. HELCOM Baltic Sea Environment Fact Sheet 2016. Available online at: http://www.helcom.fi/baltic-sea-trends/environment-fact-sheets (Accessed September 26, 2017).
Carman, R., and Cederwall, H. (2001). “Sediments and macrofauna in the Baltic Sea–characteristics, nutrient contents and distribution,” in A System Analysis of the Baltic Sea, Ecological Studies, Vol. 148, eds F. Wulff, L. Rahm, and P. Larsson (Berlin; Heidelberg: Springer-Verlag), 289–327.
Carstensen, J., Conley, D. J., Andersen, J. H., and Ærtebjerg, G. (2006). Coastal eutrophication and trend reversal: a Danish case study. Limnol. Oceanogr. 51, 398–408. doi: 10.4319/lo.2006.51.1_part_2.0398
Casini, M., Käll, F., Hansson, M., Plikshs, M., Baranova, T., Karlsson, O., et al. (2016). Hypoxic areas, density-dependence and food limitation drive the body condition of a heavily exploited marine fish predator. R. Soc. Open Sci. 3:160416. doi: 10.1098/rsos.160416
Cloern, J. E. (2001). Our evolving conceptual model of the coastal eutrophication problem. Mar. Ecol. Progr. Ser. 210, 223–253. doi: 10.3354/meps210223
Cloern, J. E., Abreu, P. C., Carstensen, J., Chauvaud, L., Elmgren, R., Grall, J., et al. (2016). Human activities and climate variability drive fast-paced change across the world's estuarine-coastal ecosystems. Glob. Change Biol. 22, 513–529. doi: 10.1111/gcb.13059
Cloern, J. E., Foster, S. Q., and Kleckner, A. E. (2014). Phytoplankton primary production in the world's estuarine-coastal ecosystems. Biogeosciences 11, 2477–2501. doi: 10.5194/bg-11-2477-2014
Conley, D. J., Björck, S., Bonsdorff, E., Carstensen, J., Destouni, G., Gustafsson, B. G., et al. (2009a). Hypoxia-related processes in the Baltic Sea. Environ. Sci. Technol. 43, 3412–3420. doi: 10.1021/es802762a
Conley, D. J., Carstensen, J., Ærtebjerg, G., Christensen, P. B., Dalsgaard, T., Hansen, J. L. S., et al. (2007). Long-term changes and impacts of hypoxia in Danish coastal waters. Ecol. Appl. 17, S165–S184. doi: 10.1890/05-0766.1
Conley, D. J., Humborg, C., Rahm, L., Savchuk, O. P., and Wulff, F. (2002). Hypoxia in the Baltic Sea and basin-scale changes in phosphorus biogeochemistry. Environ. Sci. Technol. 36:5315–5320. doi: 10.1021/es025763w
Conley, D. J., Paerl, H. W., Howarth, R. W., Boesch, D., Seitzinger, S., Havens, K. E., et al. (2009b). Controlling eutrophication: nitrogen and phosphorus. Science 323, 1014–1015. doi: 10.1126/science.1167755
Dalsgaard, T., De Brabandere, L., and Hall, P. O. J. (2013). Denitrification in the water column of the central Baltic Sea. Geochim. Cosmochim. Acta 106, 247–260. doi: 10.1016/j.gca.2012.12.038
Davidan, I. N., and Savchuk, O. P. (eds.) (1989). “Baltica” Project. Problems of Research and Mathematical Modelling of the Baltic Sea Ecosystem Vol. 4. Main Tendencies of the Ecosystem Evolution. Leningrad: Hydrometeoizdat (in Russian).
Deutsch, B., Forster, S., Wilhelm, M., Dippner, J. W., and Voss, M. (2010). Denitrification in sediments as a major nitrogen sink in the Baltic Sea: an extrapolation using sediment characteristics. Biogeosciences 7, 3259–3271. doi: 10.5194/bg-7-3259-2010
Deutsch, C., Sarmiento, J. L., Sigman, D. M., Nicolas Gruber, N., and Dunne, J. P. (2007). Spatial coupling of nitrogen inputs and losses in the ocean. Nature 445, 163–167. doi: 10.1038/nature05392
Eilola, K., Almroth-Rosell, E., Dieterich, C., Fransner, F., Höglund, A., and Meier, H. E. M. (2012). Modeling nutrient transports and exchanges of nutrients between shallow regions and the open Baltic Sea in present and future climate. Ambio 41, 586–599. doi: 10.1007/s13280-012-0322-1
Eilola, K., Gustafsson, B. G., Kuznetsov, I., Meier, H. E. M., Neumann, T., and Savchuk, O. P. (2011). Evaluation of biogeochemical cycles in an ensemble of three state-of-the-art numerical models of the Baltic Sea. J. Mar. Syst. 88, 267–284. doi: 10.1016/j.jmarsys.2011.05.004
Eilola, K., Meier, H. E. M., and Almroth, E. (2009). On the dynamics of oxygen, phosphorus and cyanobacteria in the Baltic Sea; a model study. J. Mar. Syst. 75, 163–184. doi: 10.1016/j.jmarsys.2008.08.009
Elam, J., and Grimvall, A. (2013). Kvalitetsgranskning av Regionala Miljöövervakningsdata. Havsmiljöinstitutets Rapport.
Elmgren, E., Blenckner, T., and Andersson, A. (2015). Baltic Sea management: successes and failures. Ambio 44(Suppl. 3), S335–S344. doi: 10.1007/s13280-015-0653-9
Elmgren, R. (1989). Man's impact on the ecosystem of the Baltic Sea: energy flows today and at the turn of the century. Ambio 18, 326–332.
Elmgren, R. (2001). Understanding human impact on the Baltic ecosystem: changing views in recent decades. Ambio 30, 222–231. doi: 10.1579/0044-7447-30.4.222
Feistel, R., Nausch, G., and Wasmund, N. (eds.). (2008). State and Evolution of the Baltic Sea, 1952–2005: A Detailed 50-Year Survey of Meteorology and Climate, Physics, Chemistry, Biology, and Marine Environment. Hoboken, NJ: Wiley.
Fennel, K., Brady, D., DiToro, D., Fulweiler, R. W., Gardner, W. S., Giblin, A., et al. (2009). Modeling denitrification in aquatic sediments. Biogeochemistry 93, 159–178. doi: 10.1007/s10533-008-9270-z
Fleming-Lehtinen, V., Andersen, J. H., Carstensen, J., Łysiak-Pastuszak, E., Murray, C., Pyhälä, M., et al. (2015). Recent developments in assessment methodology reveal that the Baltic Sea eutrophication problem is expanding. Ecol. Ind. 48, 380–388. doi: 10.1016/j.ecolind.2014.08.022
Fonselius, S. H. (1969). Hydrography of the Baltic Deep Basins. III. Fishery Board of Sweden Series Hydrography.
Fonselius, S. H. (1976). Eutrophication and other pollution effects in North European waters. Medd. Havsfiskelab. Lysekil 202, 1–9.
Fonselius, S., and Valderrama, J. (2003). One hundred years of hydrographic measurements in the Baltic Sea. J. Sea Res. 49, 229–241. doi: 10.1016/S1385-1101(03)00035-2
Friedland, R., Neumann, T., and Schernewski, G. (2012). Climate change and the Baltic Sea action plan: model simulations on the future of the western Baltic Sea. J. Mar. Syst. 105–108, 175–186. doi: 10.1016/j.jmarsys.2012.08.002
Funkey, C. P., Conley, D. J., Reuss, N. S., Humborg, C., Jilbert, T., and Slomp, C. P. (2014). Hypoxia sustains cyanobacteria blooms in the Baltic Sea. Environ. Sci. Technol. 48, 2598–2602. doi: 10.1021/es404395a
Gordon, D. C. Jr., Boudreau, P. R., Mann, K. H., Ong, J.-E., Silvert, W. L., Smith, S. V., et al. (1996). LOICZ Biogeochemical Modelling Guidelines. LOICZ Rep. Stud. Available online at: https://www.futureearthcoasts.org/report-study-series
Granéli, E., Wallstrfm, K., Larsson, U., Granéli, W., and Elmgren, R. (1990). Nutrient limitation of primary production in the Baltic Sea area. Ambio 19, 142–151.
Grasshoff, K., and Voipio, A. (1981). “Chemical oceanography”, in The Baltic Sea, ed A. Voipio (Amsterdam: Elsevier), 187–218.
Gren, I.-M., Savchuk, O. P., and Janson, T. (2013). Cost-effective spatial and dynamic management of a eutrophied Baltic Sea. Mar. Resour. Econ. 28, 263–284. doi: 10.5950/0738-1360-28.3.263
Gren, I.-M., and Wulff, F. (2004). Cost-effective nutrient reductions to coupled heterogeneous marine water basins: an application to the Baltic Sea. Reg. Environ. Change 4, 159–168. doi: 10.1007/s10113-003-0063-6
Gustafsson, B. G., Meier, H. E. M., Savchuk, O. P., Eilola, K., Axell, L., and Almroth, E. (2008). Simulation of Some Engineering Measures Aiming at Reducing Effects from Eutrophication of the Baltic Sea. Report C82; Earth Sciences Centre, Göteborg University, Göteborg.
Gustafsson, B. G., Schenk, F., Blenckner, T., Eilola, K., Meier, H. E. M., Müller-Karulis, B., et al. (2012). Reconstructing the development of Baltic Sea eutrophication 1850-2006. Ambio 41, 534–548. doi: 10.1007/s13280-012-0318-x
Gustafsson, E., Savchuk, O. P., Gustafsson, B. G., and Muller-Karulis, B. (2017). Key processes in the coupled carbon, nitrogen, and phosphorus cycling of the Baltic Sea. Biogeochemistry 134, 301–317. doi: 10.1007/s10533-017-0361-6
Hall, P. O., Almroth Rosell, E., Bonaglia, S., Dale, A. W., Hylén, A., Kononets, M., et al. (2017). Influence of natural oxygenation of Baltic proper deep water on benthic recycling and removal of phosphorus, nitrogen, silicon and carbon. Front. Mar. Sci. 4:27. doi: 10.3389/fmars.2017.00027
HELCOM (2007). Baltic Sea Action Plan. Adopted at HELCOM Ministerial Meeting in Krakow, Poland on 15 November 2007. Available online at: http://helcom.fi/Documents/Baltic%20sea%20action%20plan/BSAP_Final.pdf (Accessed December 18, 2017).
HELCOM (2013a). Summary Report on the Development of Revised Maximum Allowable Inputs (MAI) and Updated Country Allocated Reduction Targets (CART) of the Baltic Sea Action Plan. Available online at: http://helcom.fi/Documents/Ministerial2013/Associated%20documents/Supporting/Summary%20report%20on%20MAI-CART.pdf
HELCOM (2013b). HELCOM Copenhagen Ministerial Declaration: Taking Further Action to Implement the Baltic Sea Action Plan - Reaching Good Environmental Status for a Healthy Baltic Sea. Copenhagen. Available online at: http://helcom.fi/Documents/Ministerial2013/Ministerial%20declaration/2013%20Copenhagen%20Ministerial%20Declaration%20w%20cover.pdf (Accessed December 18, 2017).
HELCOM. (2015). Updated Fifth Baltic Sea Pollution Load Compilation (PLC-5.5). Baltic Sea Environment Proceedings No. 145.
HELCOM. (2017a). Sustainable Development Goals: Measuring Progress for the Same Targets in the Baltic Sea. Baltic Sea Environment Proceedings No. 150.
HELCOM (2017b). First version of the ‘State of the Baltic Sea’ Report – June 2017–to be Updated in 2018. Available online at: http://stateofthebalticsea.helcom.fi
Hoikkala, L., Kortelainen, P., Soinne, H., and Kuosa, H. (2015). Dissolved organic matter in the Baltic Sea. J. Mar. Syst. 142, 47–61. doi: 10.1016/j.jmarsys.2014.10.005
Janssen, F., Neumann, T., and Schmidt, M. (2004). Inter-annual variability in cyanobacteria blooms in the Baltic Sea controlled by wintertime hydrographic conditions. Mar. Ecol. Prog. Ser. 275, 59– 68. doi: 10.3354/meps275059
Jansson, B.-O., and Dahlberg, K. (1999). The environmental status of the Baltic Sea in the 1940s, today, and in the future. Ambio 28, 312–319.
Kahru, M., and Elmgren, R. (2014). Multidecadal time series of satellite-detected accumulations of cyanobacteria in the Baltic Sea. Biogeosciences 11, 3619–3633. doi: 10.5194/bg-11-3619-2014
Kahru, M., Elmgren, R., and Savchuk, O. P. (2007). Satellite measurements of cyanobacterial bloom frequency in the Baltic Sea: interannual and spatial variability. Mar. Ecol. Prog. Ser. 343, 15–23. doi: 10.3354/meps06943
Kahru, M., Elmgren, R., and Savchuk, O. P. (2016). Changing seasonality of the Baltic Sea. Biogeosciences 13, 1009–1018. doi: 10.5194/bg-13-1009-2016
Karlson, A. M. L., Duberg, J., Motwani, N. H., Hogfors, H., Klawonn, I., Ploug, H., et al. (2015). Nitrogen fixation by cyanobacteria stimulates production in Baltic food webs. Ambio 44 (Suppl. 3), S413–S426. doi: 10.1007/s13280-015-0660-x
Knudsen, M. (1899). De hydrografiske Forhold i de danske Farvande inden Skagen i 1894–1898. Beretning fra Komissionen for videnskabelig Undersbgelse af de danske Farvande 2, 19–79.
Knudsen-Leerbeck, H., Mantikci, M., Bentzon-Tilia, M., Traving, S. J., Riemann, L., Hansen, J. L. S., et al. (2017). Seasonal dynamics and bioavailability of dissolved organic matter in two contrasting temperate estuaries. Biogeochemistry 134, 217–236. doi: 10.1007/s10533-017-0357-2
Kuosa, H., Fleming-Lehtinen, V., Lehtinen, S., Lehtiniemi, M., Nygård, H., Raateoja, M., et al. (2017). A retrospective view of the development of the Gulf of Bothnia ecosystem. J. Mar. Syst. 167, 78–92. doi: 10.1016/j.jmarsys.2016.11.020
Larsson, U., Elmgren, R., and Wulff, F. (1985). Eutrophication and the Baltic Sea: causes and consequences. Ambio 14, 9–14.
Lehtoranta, J., Savchuk, O. P., Elken, J., Dahlbo, K., Kuosa, H., Raateoja, M., et al. (2017). Atmospheric forcing controlling inter-annual nutrient dynamics in the open Gulf of Finland. J. Mar. Syst. 171, 4–20. doi: 10.1016/j.jmarsys.2017.02.001
Leipe, T., Naumann, M., Tauber, F., Radtke, H., Friedland, R., Hiller, A., et al. (2017). Regional distribution patterns of chemical parameters in surface sediments of the south-western Baltic Sea and their possible causes. Geo Mar. Lett. 7, 593–606. doi: 10.1007/s00367-017-0514-6
Li, J., Reardon, P., McKinley, J. P., Joshi, S. R., Bai, Y., Bear, K., et al. (2017). Water column particulate matter: a key contributor to phosphorus regeneration in a coastal eutrophic environment, the Chesapeake Bay. J. Geophys. Res. Biogeosci. 122, 737–752. doi: 10.1002/2016JG003572
Liu, E., Meier, H. E. M., and Eilola, K. (2017). Nutrient transports in the Baltic Sea – results from a 30-year physical–biogeochemical reanalysis. Biogeosciences 14, 2113–2131. doi: 10.5194/bg-14-2113-2017
Maar, M., Markager, S., Madsen, K. S., Windolf, J., Lyngsgaard, M. M., Andersen, H. E., et al. (2016). The importance of local versus external nutrient loads for Chl a and primary production in the Western Baltic Sea. Ecol. Mod. 320, 258–272. doi: 10.1016/j.ecolmodel.2015.09.023
MacKenzie, B. R., Hinrichsen, H. -H., Plikshs, M., Wieland, K., and Zezera, A. (2000). Quantifying environmental heterogeneity: estimating the size of habitat for successful cod Gadus morhua egg development in the Baltic Sea. Mar. Ecol. Progr. Ser. 193, 143–156. doi: 10.3354/meps193143
Matthäus, W., Nehring, D., Feistel, R., Nausch, G., Mohrholz, V., and Lass, H.-U. (2008). “The inflow of highly saline water into the Baltic”, in State and Evolution of the Baltic Sea, 1952–2005, eds R. Feistel, G. Nausch, and N. Wasmund (Hoboken, NJ: Wiley), 265–309.
Mattila, J., Kankaanpää, H., and Ilus, E. (2006). Estimation of recent sediment accumulation rates in the Baltic Sea using artificial radionuclides 137-Cs and 239,240-Pb as time markers. Boreal Environ. Res. 11, 95–107.
Meier, H. E. M. (2007). Modelling the pathways and ages of infowing salt- and freshwater in the Baltic Sea. Estuar. Coast. Shelf Sci. 74, 610–627. doi: 10.1016/j.ecss.2007.05.019
Meier, H. E. M., Andersson, H. C., Arheimer, B., Donnelly, C., Eilola, K., Gustafsson, B. G., et al. (2014). Ensemble modeling of the Baltic Sea ecosystem to provide scenarios for management. Ambio 43, 37–48. doi: 10.1007/s13280-013-0475-6
Meier, H. E. M., Müller-Karulis, B., Andersson, H. C., Dieterich, C., Eilola, K., Gustafsson, B. G., et al. (2012). Impact of climate change on ecological quality indicators and biogeochemical fluxes in the Baltic Sea: a multi-model ensemble study. Ambio 41, 558–573. doi: 10.1007/s13280-012-0320-3
Motwani, N., Duberg, J., Sved, J. B., and Gorokhova, E. (2018). Grazing on cyanobacteria and transfer of diazotrophic nitrogen to zooplankton in the Baltic Sea. Limnol. Oceanogr. 63, 672–686. doi: 10.1002/lno.10659
Nausch, G., Nehring, D., and Nagel, R. (2008). “Nutrient concentrations, trends and their relation to eutrophication”, in State and Evolution of the Baltic Sea, 1952–2005, eds R. Feistel, G. Nausch and N. Wasmund (Hoboken, NJ: Wiley), 337–366.
Nausch, M., and Nausch, G. (2011). Dissolved phosphorus in the Baltic Sea—Occurrence and relevance. J. Mar. Syst. 87, 37–46. doi: 10.1016/j.jmarsys.2011.02.022
Nausch, M., Nausch, G., Mohrholz, V., Siegel, H., and Wasmund, N. (2012). Is growth of filamentous cyanobacteria supported by phosphate uptake below the thermocline? Estuar. Coast. Shelf Sci. 99, 50–60. doi: 10.1016/j.ecss.2011.12.011
Nausch, M., Nausch, G., Wasmund, N., and Nagel, K. (2008). Phosphorus pool variations and their relation to cyanobacteria development in the Baltic Sea: a three-year study. J. Mar. Syst. 71, 99–111. doi: 10.1016/j.jmarsys.2007.06.004
Nehring, D. (1987). Temporal variations of phosphate and inorganic nitrogen compounds in central Baltic deep waters. Limnol. Oceanogr. 32, 494–499. doi: 10.4319/lo.1987.32.2.0494
Neumann, T. (2000). Towards a 3D-ecosystem model of the Baltic Sea. J. Mar. Syst. 25, 405–419. doi: 10.1016/S0924-7963(00)00030-0
Neumann, T. (2010). Climate-change effects on the Baltic Sea ecosystem: a model study. J. Mar. Syst. 81, 213–224. doi: 10.1016/j.jmarsys.2009.12.001
Neumann, T., Radtke, H., and Seifert, T. (2017). On the importance of Major Baltic Inflows for oxygenation of the central Baltic Sea. J. Geophys. Res. Oceans 122, 1090–1101. doi: 10.1002/2016JC012525
Nixon, S. W. (1995). Coastal marine eutrophication: a definition, social causes, and future concerns. Ophelia 41, 199–219. doi: 10.1080/00785236.1995.10422044
Noffke, A., Sommer, S., Dale, A. W., Hall, P. O. J., and Pfannkuche, O. (2016). Benthic nutrient fluxes in the Eastern Gotland Basin (Baltic Sea) with particular focus on microbial mat ecosystems. J. Mar. Syst. 158, 1–12. doi: 10.1016/j.jmarsys.2016.01.007
Olofsson, M., Egardt, J., Singh, A., and Ploug, H. (2016). Inorganic phosphorus enrichments in Baltic Sea water have large effect on growth, carbon fixation and N2 fixation by Nodularia spumigena. Aquat. Microb. Ecol. 77, 111–216. doi: 10.3354/ame01795
Omstedt, A., Elken, J., Lehmann, A., Leppäranta, M., Meier, H. E. M., Myrberg, K., et al. (2014). Progress in physical oceanography of the Baltic Sea during the 2003–2014 period. Progr. Oceanogr. 128, 139–171. doi: 10.1016/j.pocean.2014.08.010
Ploug, H., Adam, B., Musat, N., Kalvelage, T., Lavik, G., Wolf-Gladrow, D., et al. (2011). Carbon, nitrogen, and O2 fluxes associated with the cyanobacterium Nodularia spumigena in the Baltic Sea. ISME J. 5, 1549–1558. doi: 10.1038/ismej.2011.20
Raateoja, M. (2013). Deep-water oxygen conditions in the Bothnian Sea. Boreal Environ. Res. 18, 235–249.
Raateoja, M., Kuosa, H., and Hällfors, S. (2011). Fate of excess phosphorus in the Baltic Sea: a real driving force for cyanobacterial blooms? J. Sea Res. 65, 315–321. doi: 10.1016/j.seares.2011.01.004
Radtke, H., and Maar, M. (2016). Estimating the effective nitrogen import: an example for the North Sea-Baltic Sea boundary. J. Geophys. Res. Biogeosci. 121, 2562–2575. doi: 10.1002/2016JG003516
Richards, F. A. (1965). “Anoxic basins and fjords,” in Chemical Oceanography Vol. 1, eds J. P. Riley and G. Skirrow (London: Acad Press), 611–645.
Riemann, B., Carstensen, J., Dahl, K., Fossing, H., Hansen, J. W., Jakobsen, H. H., et al. (2016). Recovery of Danish coastal ecosystems after reductions in nutrient loading: a holistic ecosystem approach. Estuar. Coast. 39, 82–97. doi: 10.1007/s12237-015-9980-0
Rodhe, J., Tett, P., and Wulff, F. (2004). “The Baltic and North seas: a regional review of some important physical-chemical-biological interaction processes,” in The Sea, Vol. 14, eds A. R. Robinson and K. H. Brink (Cambridge: Harvard University Press), 1033–1075.
Rolff, C., and Elfwing, T. (2015). Increasing nitrogen limitation in the Bothnian Sea, potentially caused by inflow of phosphate-rich water from the Baltic Proper. Ambio 44, 601–611. doi: 10.1007/s13280-015-0675-3
Ryabchenko, V. A., Karlin, L. N., Isaev, A. V., Vankevich, R. E., Eremina, T. R., Molchanov, M. S., et al. (2016). Model estimates of the eutrophication of the Baltic Sea in the contemporary and future climate. Oceanology 56, 36–45. doi: 10.1134/S0001437016010161
Rydin, E., Kumblad, L., Wulff, F., and Larsson, P. (2017). Remediation of a eutrophic bay in the Baltic Sea. Environ. Sci. Technol. 51, 4559–4566. doi: 10.1021/acs.est.6b06187
Sandberg, J. R., Elmgren, R., and Wulff, F. (2000). Carbon flows in the Baltic Sea food webs – a re-evaluation using a mass balance approach. J. Mar. Syst. 25, 253–280. doi: 10.1016/S0924-7963(00)00019-1
Savchuk, O. (2000). Studies of the assimilation capacity and effects of nutrient load reductions in the eastern Gulf of Finland with a biogeochemical model. Boreal Environ. Res. 5, 147–163.
Savchuk, O. P. (1984). “A simulation model of nitrogen cycle and oxygen dynamics in the Gulf of Finland ecosystem,” in Proceedings 12th Conference Baltic Oceanographers, Vol. 3 (Leningrad: Hydrometeoizdat), 66–76.
Savchuk, O. P. (1986). The study of the Baltic Sea eutrophication problems with the aid of simulation models. Baltic Sea Environ. Proc. 19, 52–61.
Savchuk, O. P. (2002). Nutrient biogeochemical cycles in the Gulf of Riga: scaling up field studies with a mathematical model. J. Mar. Syst. 32, 253–280. doi: 10.1016/S0924-7963(02)00039-8
Savchuk, O. P. (2005). Resolving the Baltic Sea into seven subbasins: N and P budgets for 1991-1999. J. Mar. Syst. 56, 1–15. doi: 10.1016/j.jmarsys.2004.08.005
Savchuk, O. P. (2010). “Large-Scale Dynamics of Hypoxia in the Baltic Sea,” in Chemical Structure of Pelagic Redox Interfaces: Observation and Modeling, ed E. V. Yakushev (Berlin; Heidelberg: Hdb Env Chem; Springer Verlag), 137–160.
Savchuk, O. P., Eremina, T. R., Isaev, A. V., and Neelov, I. A. (2009). Response of eutrophication in the eastern Gulf of Finland to nutrient load reduction scenarios. Hydrobiologia 629, 225–237. doi: 10.1007/s10750-009-9776-y
Savchuk, O. P., and Wulff, F. (2009). Long-term modeling of large-scale nutrient cycles in the entire Baltic Sea. Hydrobiologia 629, 209–224. doi: 10.1007/s10750-009-9775-z
Savchuk, O. P., Gustafsson, B. G., and Muller-Karulis, B. (2012a). BALTSEM—A Marine Model for the Decision Support within the Baltic Sea Region, BNI Techn. Rep.
Savchuk, O. P., Gustafsson, B. G., Rodríguez Medina, M., Sokolov, A. V., and Wulff, F. V. (2012b). External Nutrient Loads to the Baltic Sea, 1970-2006. BNI Techn. Rep.
Savchuk, O. P., and Volkova, V. N. (1990). “Forecasting the future state of the Baltic Sea eutrophication,” in Proceedings of the 17th Conference of Baltic Oceanographers (Norrköping).
Savchuk, O. P., and Wulff, F. (1999). Modelling regional and large-scale response of Baltic Sea ecosystems to nutrient load reductions. Hydrobiologia 393, 35–43. doi: 10.1023/A:1003529531198
Savchuk, O. P., and Wulff, F. (2007). Modeling the Baltic Sea eutrophication in a decision support system. Ambio 36, 141–148. doi: 10.1579/0044-7447(2007)36[141:MTBSEI]2.0.CO;2
Savchuk, O. P., Wulff, F., Hille, S., Humborg, C., and Pollehne, F. (2008). The Baltic Sea a century ago - a reconstruction from model simulations, verified by observations. J. Mar. Syst. 74, 485–494. doi: 10.1016/j.jmarsys.2008.03.008
Savchuk, O., and Wulff, F. (2001). “A model of the biogeochemical cycles of nitrogen and phosphorus,” in A System Analysis of the Baltic Sea, Ecological Studies, Vol. 148, eds F. Wulff, L. Rahm, and P. Larsson (Berlin; Heidelberg: Springer-Verlag), 371–415.
Schneider, B., Dellwig, O., Kulinski, K., Omstedt, A., Pollehne, F., Rehder, G., et al. (2017). “Biogeochemical cycles,” in Biological Oceanography of the Baltic Sea, eds P. Snoeijs-Leijonmalm, H. Schubert and T. Radziejewska (Dordrecht: Springer Science+Business Media), 87–122.
Schneider, B., Gustafsson, E., and Sadkowiak, B. (2014). Control of the mid-summer net community production and nitrogen fixation in the central Baltic Sea: an approach based on pCO2 measurements on a cargo ship. J. Mar. Syst. 136, 1–9. doi: 10.1016/j.jmarsys.2014.03.007
Seidel, M., Manecki, M., Herlemann, D. P. R., Deutsch, B., Schulz-Bull, D., Jürgens, K., et al. (2017). Composition and transformation of dissolved organic matter in the Baltic Sea. Front. Earth Sci. 5:31. doi: 10.3389/feart.2017.00031
Sjoberg, B., Humborg, C., and Savchuk, O. (2002). A First Estimate of Coastal Retention in the Baltic. MARE (MArine Research on Eutrophication)—A Scientific Base for the Cost-Effective Measures for the Baltic Sea. Synth. Rep. Phase 1 (unpublished).
Sjöberg, S., Wulff, F., and Wåhlström, P. (1972). The use of computer simulations for ecological studies in the Baltic. Ambio 1, 217–222.
Slomp, C. P., Mort, H. P., Jilbert, T., Reed, D. C., Gustafsson, B. G., and Wolthers, M. (2013). Coupled dynamics of iron and phosphorus in sediments of an oligotrophic coastal basin and the impact of anaerobic oxidation of methane. PLoS ONE 8:e62386. doi: 10.1371/journal.pone.0062386
Snoeijs-Leijonmalm, P., and Andrén, E. (2017a). “Why is the Baltic Sea so special to live in?” in Biological Oceanography of the Baltic Sea, eds P. Snoeijs-Leijonmalm, H. Schubert, and T. Radziejewska (Dordrecht: Springer Science+Business Media), 23–84.
Snoeijs-Leijonmalm, P., Schubert, H., and Radziejewska, T. (eds.). (2017b). Biological Oceanography of the Baltic Sea. Dordrecht: Springer Science+Business Media.
Sokolov, A., Andrejev, O. F., and Wulff Rodriguez Medina, M. (1997). The Data Assimilation System for Data Analysis in the Baltic Sea. Stockholm University.
Sokolov, A., and Wulff, F. (1999). SwingStations: a web-based client tool for the Baltic environmental database. Comput. Geosci. 25, 863–871. doi: 10.1016/S0098-3004(99)00011-4
Sommer, S., Clemens, D., Yücel, M., Pfannkuche, O., Hall, P. O. J., Almroth-Rosell, E., et al. (2017). Major bottom water ventilation events do not significantly reduce basin-wide benthic N and P release in the Eastern Gotland Basin (Baltic Sea). Front. Mar. Sci. 4:18. doi: 10.3389/fmars.2017.00018
Stigebrandt, A. (2018). On the response of the Baltic proper to changes of the total phosphorus supply. Ambio 47, 31–44. doi: 10.1007/s13280-017-0933-7
Stigebrandt, A., and Wulff, F. (1987). A model for the dynamics of nutrients and oxygen in the Baltic proper. J. Mar. Res. 45, 729–759. doi: 10.1357/002224087788326812
Suikkanen, S., Pulina, S., Engström-Öst, J., Lehtiniemi, M., Lehtinen, S., and Brutemark, A. (2013). Climate change and eutrophication induced shifts in Northern summer plankton communities. PLoS ONE 8:e66475. doi: 10.1371/journal.pone.0066475
Svedén, J. B., Walve, J., Larsson, U., and Elmgren, R. (2016). The bloom of nitrogen-fixing cyanobacteria in the northern Baltic Proper stimulates summer production. J. Mar. Syst. 163, 102–112. doi: 10.1016/j.jmarsys.2016.07.003
Svendsen, L. M., Gustafsson, B., Larsen, S. E., Sonesten, L., Knuuttila, S., and Frank-Kamenetsky, D. (2017). Inputs of Nitrogen and Phosphorus to the Baltic Sea. HELCOM core indicator report. Available online at: http://helcom.fi/baltic-sea-trends/indicators/inputs-of-nutrients-to-the-subbasins (Accessed Septembar 26, 2017).
Tamelander, T., Spilling, K., and Winder, M. (2017). Organic matter export to the seafloor in the Baltic Sea: drivers of change and future projections. Ambio 46, 842–851. doi: 10.1007/s13280-017-0930-x
Tedesco, T., Piroddi, C., Kämäri, M., and Lynam, C. (2016). Capabilities of Baltic Sea models to assess environmental status for marine biodiversity. Mar. Policy 70, 1–12. doi: 10.1016/j.marpol.2016.04.021
Vahtera, E., Autio, R., Kaartokallio, H., and Laamanen, M. (2010). Phosphate addition to phosphorus-deficient Baltic Sea plankton communities benefits nitrogen-fixing Cyanobacteria. Microb. Ecol. 60, 43–57. doi: 10.3354/ame01408
Vahtera, E., Conley, D. J., Gustafsson, B. G., Kuosa, H., Pitkänen, H., Savchuk, O. P., et al. (2007a). Internal ecosystem feedbacks enhance nitrogen-fixing cyanobacteria blooms and complicate management in the Baltic Sea. Ambio 36, 186–194. doi: 10.1579/0044-7447(2007)36[186:IEFENC]2.0.CO;2
Vahtera, E., Laamanen, M., and Rintala, J.-M. (2007b). Use of different phosphorus sources by the bloom-forming cyanobacteria Aphanizomenon flos-aquae and Nodularia spumigena. Aquat. Microb. Ecol. 46, 225–237. doi: 10.3354/ame046225
Viktorsson, L., Ekeroth, N., Nilsson, M., Kononets, M., and Hall, P. O. J. (2013). Phosphorus recycling in sediments of the central Baltic Sea. Biogeosciences 10, 3901–3916. doi: 10.5194/bg-10-3901-2013
Wasmund, N. (1997). Occurrence of cyanobacterial blooms in the Baltic Sea in relation to environmental conditions. Int. Rev. Gesamten Hydrobiol. 82, 169–184. doi: 10.1002/iroh.19970820205
Wasmund, N., and Siegel, H. (2008). “Phytoplankton,” in State and Evolution of the Baltic Sea, 1952–2005, eds R. Feistel, G. Nausch, and N. Wasmund (Hoboken, NJ: Wiley), 441–481.
Winterhalter, B. (2001). On sediment patchiness at the BASYS coring site, Gotland Deep, Baltic Sea. Baltica 14, 18–23.
Witek, Z., Humborg, C., Savchuk, O., Grelowski, A., and Lysiak-Pastuszak, E. (2003). Nitrogen and phosphorus budgets of the Gulf of Gdansk (Baltic Sea). Estuar. Coastl. Shelf Sci. 57, 239–248. doi: 10.1016/S0272-7714(02)00348-7
Wulff, F., Field, J. G., and Mann, K. H. (eds.) (1989). Network Analysis in Marine Ecology: Methods and Applications. New York, NY: Springer-Verlag.
Wulff, F., and Niemi, Å. (1992). Priorities for the restoration of the Baltic Sea – a scientific perspective. Ambio 21, 193–195.
Wulff, F., Rahm, L., Hallin, A.-K., and Sandberg, J. (2001a). “A nutrient budget model of the Baltic Sea,” in A Systems Analysis of the Baltic Sea, eds. F. Wulff, L. Rahm and P. Larsson (Berlin; Heidelberg: Springer-Verlag), 353–372.
Wulff, F., Rahm, L., and Larsson, P. (eds.). (2001b). A System Analysis of the Baltic Sea, Ecological Studies, Vol. 148. Berlin; Heidelberg: Springer-Verlag.
Wulff, F., Savchuk, O. P., Sokolov, A. V., Humborg, C., and Mörth, C.-M. (2007). Management options and effects on a marine ecosystem: assessing the future of the Baltic Sea. Ambio 36, 243–249. doi: 10.1579/0044-7447(2007)36[243:MOAEOA]2.0.CO;2
Wulff, F., Sokolov, A., and Savchuk, O. (2013). Nest – A Decision Support System for Management of the Baltic Sea. A User Manual. BNI Techn. Rep. Ser.
Wulff, F., and Stigebrandt, A. (1989). A time-dependent budget model for nutrients in the Baltic Sea. Glob. Biogeochem. Cycles 3, 63–78. doi: 10.1029/GB003i001p00063
Ylöstalo, P., Seppälä, J., Kaitala, S., Maunula, P., and Simis, S. (2016). Loadings of dissolved organic matter and nutrients from the Neva River into the Gulf of Finland – Biogeochemical composition and spatial distribution within the salinity gradient. Mar. Chem. 186, 58–71. doi: 10.1016/j.marchem.2016.07.004
Keywords: nitrogen, phosphorus, eutrophication, hypoxia, vicious circle, nutrient budgets, Baltic Sea basins
Citation: Savchuk OP (2018) Large-Scale Nutrient Dynamics in the Baltic Sea, 1970–2016. Front. Mar. Sci. 5:95. doi: 10.3389/fmars.2018.00095
Received: 27 December 2017; Accepted: 07 March 2018;
Published: 22 March 2018.
Edited by:
James E. Cloern, United States Geological Survey, United StatesReviewed by:
Benoit Thibodeau, University of Hong Kong, Hong KongWei-dong Zhai, Shandong University, China
Copyright © 2018 Savchuk. This is an open-access article distributed under the terms of the Creative Commons Attribution License (CC BY). The use, distribution or reproduction in other forums is permitted, provided the original author(s) and the copyright owner are credited and that the original publication in this journal is cited, in accordance with accepted academic practice. No use, distribution or reproduction is permitted which does not comply with these terms.
*Correspondence: Oleg P. Savchuk, oleg.savchuk@su.se
In Memoriam: In memoriam of Fredrik Wulff