Marine Threats Overlap Key Foraging Habitat for Two Imperiled Sea Turtle Species in the Gulf of Mexico
 Kristen M. Hart1*
  Autumn R. Iverson2
  Ikuko Fujisaki3
  Margaret M. Lamont4
  David Bucklin3
  Donna J. Shaver5
- 1Wetland and Aquatic Research Center, U.S. Geological Survey, Davie, FL, United States
- 2CNT, Contracted to Wetland and Aquatic Research Center, U.S. Geological Survey, Davie, FL, United States
- 3Ft. Lauderdale Research and Education Center, University of Florida, Davie, FL, United States
- 4Wetland and Aquatic Research Center, U.S. Geological Survey, Gainesville, FL, United States
- 5Padre Island National Seashore, National Park Service, Corpus Christi, TX, United States
Effective management of human activities affecting listed species requires understanding both threats and animal habitat-use patterns. However, the extent of spatial overlap between high-use foraging areas (where multiple marine species congregate) and anthropogenic threats is not well-known. Our modeling approach incorporates data on sea turtle spatial ecology and a suite of threats in the Gulf of Mexico to identify and map “hot spots” of threats to two imperiled turtle species. Of all 820 “high” threats grid cells, our tracked turtles foraged at least 1 day in 77% of them. Although threat data were not available outside the U.S. Exclusive Economic Zone, our map of turtle and threat “hot spots” can be incorporated in future more comprehensive threat analyses for the region. Knowledge of these shared foraging- and threat-areas can assist managers charged with designing effective conservation and population recovery strategies, in future habitat modeling efforts, and in designations of Gulf of Mexico habitat with high conservation value.
Introduction
Biodiversity hot spots are areas with both high endemism and anthropogenic threat (Myers, 1988). One area that appears to represent a marine hotspot is the Gulf of Mexico (GoM), yet little is known about how species use GoM habitats or co-occur in this region. The GoM contains one of the highest levels of species per unit area in the world, yet its biodiversity is “most threatened” on a global scale with the second highest threat level of all marine areas reviewed (Costello et al., 2010). Recently, the GoM was the site of the largest oil spill in U.S. history (Camilli et al., 2010).
There is a need for systematic marine conservation in the GoM, specifically including the need to understand the scope and scale of human activities occurring in critical habitats for species of conservation concern. Cumulative threats analyses at specific foraging grounds or along high-use migration corridors would allow for risk analyses and risk identification for imperiled marine species. Cumulative effects assessments (CEAs) are holistic evaluations of the combined effects of human activities and natural processes on the environment (Stelzenmüller et al., 2018) that represent a specific type of “impact” assessment. Although CEAs are complex, they can illuminate key stressors and key uncertainties for management.
In the GoM, a focused analysis of threats and occurrence of sea turtles is an excellent case study, given the general need to improve our understanding of population status and threats (Mazaris et al., 2017). This body of water supports many imperiled species including several threatened and endangered sea turtles such as Kemp's ridleys (Lepidochelys kempii) and loggerheads (Caretta caretta). Some sea turtles use the GoM throughout their lives; they nest, grow, forage and breed within this body of water (Lamont et al., 2015), while others spend the majority of their lives or perform vital life functions in the GoM (NMFS et al., 2011).
Recent tracking studies highlighted sea turtle spatial ecology in the GoM for both Kemp's ridleys (Shaver et al., 2013, 2016, 2017) and loggerheads (Foley et al., 2014; Hart et al., 2014). Kemp's ridleys are listed as endangered under the U.S. Endangered Species Act (NMFS et al., 2011) whereas Northwest Atlantic loggerheads are listed as threatened (NMFS and USFWS, 2008). Adult loggerheads are on average two to three times larger than Kemp's ridleys yet they have similar habitat needs for foraging and nesting. Both species use sandy GoM beaches for nesting and both forage in nearshore waters, feeding primarily on benthic invertebrates (Shaver, 1991; Bjorndal, 1997). The co-occurrence of these two species in the GoM meets one of the criteria listed for the determination of a hotspot (Tittensor et al., 2010). Potential hazards to nesting and foraging sea turtles include interactions with fisheries (shrimp trawling and long-lining; Lewison and Crowder, 2007; Finkbeiner et al., 2011), reduced invertebrate abundance (as a result of trawling; Jennings and Kaiser, 1998), dead zones, low dissolved oxygen, shipping channels, oil spills (Bjorndal et al., 2011), and direct harvest (Lutcavage et al., 1997). These hazards combined with documented nest declines within the GoM (Kemp's ridleys: Shaver and Caillouet, 2015; loggerheads: Witherington et al., 2009; Lamont et al., 2012) make identifying both important foraging grounds and threats for these species crucial.
Assignment of cumulative utilization and impact (CUI) scores is one approach for threats analysis that has been used for sea turtles. Scores were determined for marine predators in the California Current Ecosystem by combining electronic tracking data of eight protected species and 24 anthropogenic stressors (Maxwell et al., 2013). This analysis accounted for specific vulnerabilities of each predator species to each identified threat. Here we provide an integrated assessment of the spatial intersection between key foraging areas for two species of sea turtles and a derived index of eight anthropogenic threats with spatially-explicit available layers. Although our threats analysis is limited to those threats occurring within the U.S. Exclusive Economic Zone, our assessment is a first step in designating spatial locations in the GoM where limited conservation resources may be focused to achieve population recovery.
Materials and Methods
This study was carried out in accordance with the recommendations of the USGS Institutional Animal Care and Use committee who also approved the study protocol. In addition, all federal and state permits required were obtained for this research on turtles at Padre Island (Padre Island/USFWS Service Agreement No. 20181-A-J819 and permit TE840727-3; Texas Parks and Wildlife Department Scientific Permits SPR-0190-122 and SPR-0790-004), Rancho Nuevo (Secretaria de Medio Ambiente y Recursos Naturales; Subsecretaria de Gestion para la Proteccion Ambiental; Direccion General de Vida Silvestre Permiso No. SGPA/DGVS/03990/11), Veracruz (SEMARNAT-Direccion General de Vida Silvestre Permiso No. SGPA/DGVS/05559/14), Gulf Shores (USFWS permit TE206903-1 and Bon Secour Special Use Permit 12-006S); and Florida (Marine Turtle Permits #176 (issued to KH) and #118 (issued to ML); Dry Tortugas National Park permits DRTO-2008-SCI-0008, DRTO-2010-SCI-0009, and DRTO-2012-SCI-0008 (issued to KH). Turtle handling and sampling was performed according to Institutional Animal Care Protocol NPS IACUC 2011-15 (Padre Island) and USGS-SESC-IACUC-2011-05 (Gulf Shores and Dry Tortugas).
Turtle Tracking and Modeling
We tagged turtles with satellite transmitters after they nested throughout the GoM (Figure 1; Appendix). All tagging followed established protocols (NMFS-SEFSC, 2008). Before satellite-tagging turtles, we tagged each one with a passive integrated transponder (PIT) and individually numbered flipper tags and we took curved (CCL) and straight (SCL) carapace lengths. Kemp's ridleys were tagged at Padre Island National Seashore, Texas, USA (n = 41, 1998–2013), Rancho Nuevo, Tamaulipas, Mexico (n = 10, 2010–2011), Veracruz, Mexico (n = 12, 2012–2013), and at Gulf Shores, Alabama, USA (n = 1, 2012). Loggerheads were tagged at Gulf Shores, Alabama, USA (n = 30, 2011–2013), Dry Tortugas National Park, Florida, USA (n = 15, 2008-2013), St. Joseph Peninsula, Florida, USA (n = 16, 2010 and 2012–2013) and Eglin Air Force Base, Florida, USA (n = 2, 2012). We fitted a platform terminal transmitter (PTT) to each turtle. We used Kiwisat 101 PTTs from Havelock North, New Zealand for some Kemp's ridleys (25 tagged 2010–2013). Other tags for both species were from Wildlife Computers, Redmond WA, USA and included SPOT-5 tags (22 turtles tagged 2008–2013) SPLASH-10 tags (29 tagged in 2009 and 2011–2013), ST-6 (2 tags, one in 1998 and the other in 2000), ST-20 (7 turtles tagged from 2004 to 2007), MK-10A (5 tagged in 2011), and MK-10AF (14 tagged from 2010 to 2013).
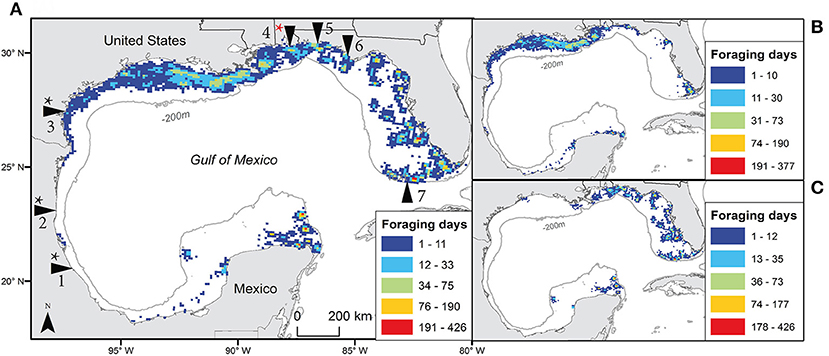
Figure 1. The number of days individual turtles used each 10 km grid cell throughout the Gulf of Mexico during foraging periods using filtered satellite locations for both species (A), Kemp's ridley (B), and loggerhead (C). Tagging sites are indicated in main panel with arrows: from the bottom left moving clockwise they include Veracruz (Mexico); Rancho Nuevo, Tamaulipas (Mexico); Padre Island National Seashore, Texas (USA); Gulf Shores, Alabama (USA); Eglin Air Force Base, Florida (USA); St. Joseph Peninsula, Florida (USA); and Dry Tortugas National Park, Florida (USA). Black * indicates sites where Kemp's ridleys were tagged; red * indicates site where both species were tagged (n = 1 Kemp's ridley), 1-7 added for locations as in text.
Tags were attached in the same way as in previous studies (e.g., Kemp's ridleys: Shaver et al., 2013; loggerheads: Hart et al., 2014). The anticipated battery life of each tag was 1 year or longer. Tags were programmed variously for loggerheads (continuously in 2008–2010, continuously then every 3rd day November-April for 2011–2013) and Kemp's ridleys (6 h on/6 h off for 1998–2007, continuously for 106 days than 6 h on/6 h off for 2008, and either continuously or 6 h on/6 h off for 2010–2013).
Movement of each turtle was tracked using the Argos satellite system. Argos accuracy estimates (CLS, 2011) for location class (LC) are as follows: LC 3, < 250 m; LC 2, 250 to < 500 m; LC 1, 500 to < 1500 m; LC 0, >1500 m; LC A and LC B, unknown; LC Z, failed Argos plausibility test. From 1998 to 2010, Argos performed traditional least-squares location processing and then from 2011 on, conducted Kalman-filtering (Kalman, 1960). The Kalman-filtering algorithm provides more estimated positions and significantly improves accuracy, especially for LC A and LC B (Lopez and Malardé, 2011). Foraging periods generally begin in June for Kemp's ridleys (Shaver et al., 2013) and by August for loggerheads (Hart et al., 2014). We used location data with Argos location classes (LCs) 3, 2, 1, 0, A, and B for all analyses.
Satellite-location data are often received at irregular time intervals and can have large temporal gaps and positional errors. Filtering locations based on quality will not remove all erroneous locations and can result in less information (Jonsen et al., 2005). To account for this, we used switching state-space modeling (SSM) to estimate location and behavioral mode at regular time intervals, accounting for satellite positional errors, and dynamics of the animal movement pattern (Jonsen et al., 2005). The SSM model has previously been applied to marine animals including turtles (e.g., Breed et al., 2009; Shaver et al., 2013; Hart et al., 2014). Following Breed et al. (2009) we estimated model parameters by Markov Chain Monte Carlo (MCMC) using WinBUGS via the software program R (R Development Core Team, 2014). We estimated location and behavioral mode every 8 h from two independent and parallel chains of MCMC. Our samples from the posterior distribution were based on 10,000 iterations after a burn-in of 7000 and were thinned by five. The behavioral mode output from SSM was defined as “area-restricted search” (e.g., Kareiva and Odell, 1987) or “migration” (Jonsen et al., 2005). Since we tagged animals during nesting seasons, we further split ‘area-restricted search’ into “foraging” or “inter-nesting.” We defined ‘area-restricted search’ locations after a migration as “foraging,” unless high-quality locations on land indicated the turtle was still in the inter-nesting period. If a turtle did not enter migration mode (i.e., their foraging area was near their inter-nesting area), we determined the beginning of foraging as the mean foraging start date for SSM-identified foraging dates for conspecifics (i.e., July 30th for loggerheads).
With SSM-defined foraging dates, we used original (filtered) satellite locations from within those time periods for further analysis. We removed points that were on land, extremely distant, or required speeds >5 kph. For loggerheads, we removed locations deeper than −200 m (neritic zone cutoff); adult female loggerheads in the southeast U.S. did not generally leave the continental shelf (Hawkes et al., 2011). Kemp's ridley locations were filtered using a bathymetry cut-off of −200 m or −100 m, as a −100 m cutoff is generally accepted for Kemp's ridley turtles (Fritts et al., 1983; Shaver et al., 2013; see Supplemental methods). As further justification for these cutoffs, mean depth for loggerhead foraging areas in the Gulf was shallower than 33 m (Hart et al., 2014, 44 turtles) and restricted to depths less than 100 m (Foley et al., 2014). Mean depths of primary Kemp's ridley foraging areas in the Gulf were less than 18 m. For turtles that were recaptured and tagged a second time, we used only the longest tracking period in these analyses.
Anthropogenic Threats
We collected spatial data layers to represent the extent of a suite of proximate threats for sea turtles in the GoM, including during the tracking period examined. The temporal span of threats layers varies due to the nature of the available data (from 2000 to 2015), however, both isotopic and tracking data have revealed that these species display site-fidelity in the GoM (loggerheads: Hart et al., 2014, 2015; Vander Zanden et al., 2015, 2016; Kemp's ridleys: Shaver et al., 2013, 2016; Reich et al., 2017). Therefore, while we include layers that did not perfectly coincide temporally with tracking periods, we assume that both threats and turtle locations are generally spatially consistent over time. These layers included oil-extraction related threats (areas affected by the Deepwater Horizon oil spill, oil platform locations), threats related to human presence (shrimping effort, areas of commercial line fishing, commercial shipping density, and marina locations), and threats related to biological events affecting habitat quality (harmful algal blooms (HABs) of Karenia brevis, hypoxic zones). Other anthropogenic impacts not considered here may threaten sea turtle populations, such as plastic pollution ingestion, entanglement with derelict fishing gear, and direct harvest. However, not all threat data is available or spatially-referenced. Thus, we consider our threat index a minimum or conservative representation of anthropogenic pressure, not a full CEA. See below for more details on each threat layer (Table 1).
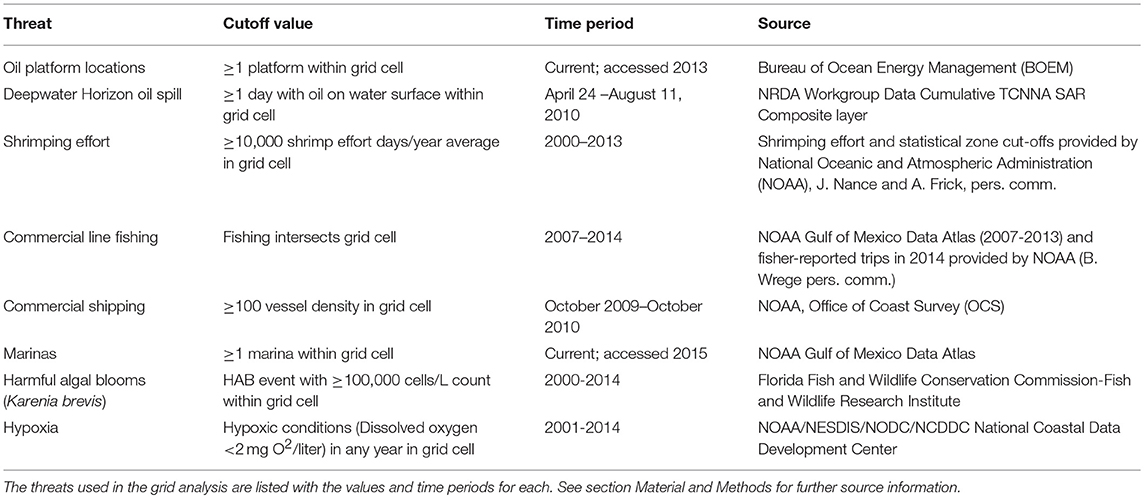
Table 1. Anthropogenic threats in the Gulf of Mexico.
Oil platforms included all platforms existing in the Bureau of Ocean Energy Management (BOEM) database; these are all located in federal USA waters. For the Deepwater Horizon oil spill, we mapped the surface oiling layer Cumulative TCNNA SAR Oiling—Days of Oiling (PDARP) (Environmental Response Management Application, Web application, ERMA Deepwater Gulf Response, National Oceanic and Atmospheric Administration, 20141 Web.19 December 2013). Shrimping effort and statistical zone cut-offs were provided by the National Oceanic and Atmospheric Administration (NOAA), J. Nance & A. Frick, pers. comm. For commercial line fishing, we mapped the Catch per Unit Effort (CPUE) from the red grouper bottom longline fishery, and from both the red snapper and vermillion snapper vertical line commercial fisheries with 2007–2013 NOAA gridded data. Because our turtle locations are spread throughout the GoM, we also added line fishing (e.g., longline, hook and line, hand lines) fisher-reported trips in 2014 provided by NOAA; data included areas fished and primary gear used (B. Wrege pers. comm.). All fishing layers were combined to represent commercial fishing in the GoM. For commercial shipping, we obtained data from the yearlong survey for October 2009–October 2010 available from the NOAA Gulf of Mexico Data Atlas (Commercial Vessel Density October 2009–2010 AIS National). We mapped marinas and Boat Ramps (U.S. only) from the Gulf of Mexico Data Atlas. HABs were based on the probability of fish die-offs. For hypoxic zones, we used data provided by NOAA of bottom dissolved oxygen measured during summer groundfish surveys throughout western and north-central GoM. Hypoxia occurs when the oxygen concentrations are below 2 mg/L.
For each layer, we intersected the spatial extent of the threat with a pre-defined 10-km2 grid, so that each grid cell was either affected (1) or unaffected (0) by the threat. For layers with data describing differing intensities of a threat (e.g., vessel density in the commercial shipping layer), we used simple cutoff values to classify the cell as affected or not, related to the intensity and/or occurrence of the threat within the cell (see Table 1 for data sources, time periods used and more details). Specifically, we marked each grid cell as containing a threat if, (1) any Deepwater Horizon oil day occurred, (2) any oil platform was present, (3) hypoxic conditions in any year 2000–2014, (4) ≥100 (class 5) vessel density (2009-2010 layer), (5) ≥ an average 10,000 shrimp effort days/ year (2000–2013), (6) intersection with HAB point locations after year 2000 with point count > 100,000 cells/liter of Karenia brevis (the lower limit for “medium” concentration used by NOAA HABSOS), (7) intersection with a marina, and (8) intersection with commercial line fishing. Because the data sources used to create the threat index were available only for U.S. waters, we limited this analysis to within the U.S. Exclusive Economic Zone.
Turtle and Threats Spatial Intersection
We calculated the number of days each grid cell was used by individual turtles (turtle-days) and eliminated duplicated observations for each turtle per each day. We also summed the total number of threats within each cell to create a threat index value, with a potential range from zero (no threats occur in the cell) to eight (all identified threats occur in the cell), however the maximum threat value in any given cell was six. Therefore, we classified a cell to have a high threat value if it had 4–6 threats present. We then multiplied the two grids together (turtle-days grid and threats grid) to get a representation of potential anthropogenic impacts to sea turtles in each grid cell. Using ArcMap10.4 (ESRI, 2011), we mapped these turtle-threat values into 6 categories using the Natural Break (Jenks) classification system that splits data ranges. Based on this output, we defined the upper two categories (values 161–570) as “hot spots” of turtle-use and anthropogenic threats. Finally, we conducted a Spearman's rank test to assess the association between level of use and threat in each grid cell in the U.S. EEZ. We performed all statistical calculations in R (R Development Core Team, 2014).
Results
From 1998 to 2013, we obtained foraging areas for 127 turtles (64 Kemp's ridleys and 63 loggerheads) tagged at various locations around the GoM (n = 7 sites), including Padre Island National Seashore, Texas, USA (n = 41), Rancho Nuevo, Tamaulipas, Mexico (n = 10), Veracruz, Mexico (n = 12), Gulf Shores, Alabama, USA (n = 31), Dry Tortugas National Park, Florida, USA (n = 15), St. Joseph Peninsula, Florida, USA (n = 16) and Eglin Air Force Base, Florida. USA (n = 2) (Figure 1).
Over all turtles, foraging periods totaled 18,167 days, ranging from 1 to 424 d (mean ± SD = 50.5 ± 71.2 d) for Kemps and 2 to 780 d (mean ± SD = 103.3 ± 127.4 d) for loggerheads. These foraging locations provided 58,492 filtered locations (28,338 for Kemp's ridleys and 30,154 for loggerheads; Table 2). High numbers of foraging turtle-days per grid cell occurred at locations spread across the GoM, with Kemp's ridleys primarily foraging in the western GoM and loggerheads in the eastern GoM (Figure 1).
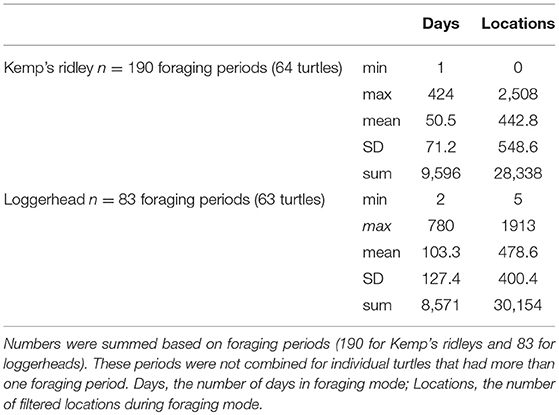
Table 2. Foraging days and filtered locations.
“Hot spots” of turtle-use and anthropogenic threats (see Figure 2) were concentrated primarily off the coast of Louisiana (i.e., red and orange cells, values 161–570 in Figure 3A), but smaller areas occurred across neritic areas of the GoM. Considering only grid cells with both Kemp's ridleys and loggerhead turtle-days, the number of threats in these overlap areas was also highest on the Louisiana coast but a high number of threats (i.e., four) were also observed in overlap areas along Alabama and northern Florida coasts (Figure 3B).
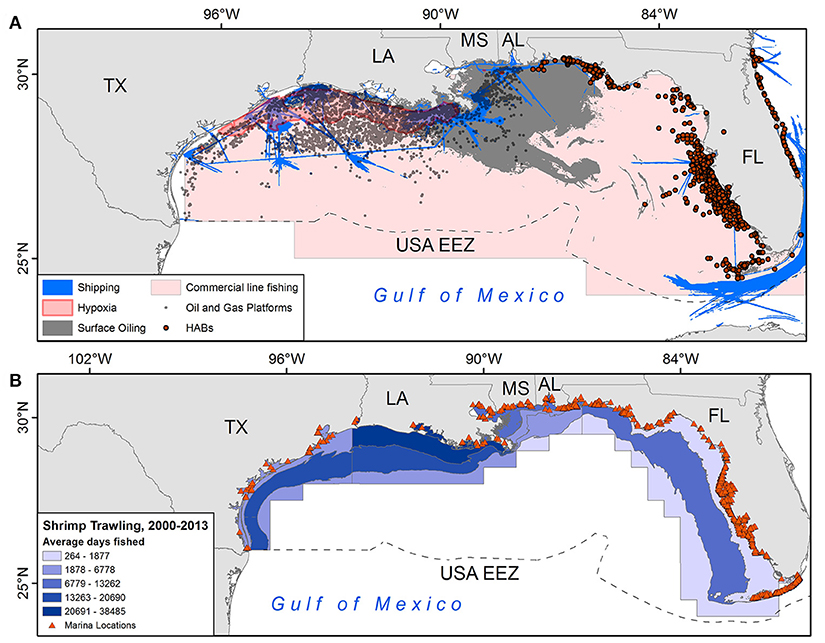
Figure 2. (A) Spatial depiction of six anthropogenic threats in the GoM; (B) intensity of shrimp trawling by National Marine Fisheries Service (NMFS) statistical zone and locations of marinas. See supplemental methods for details on each layer.
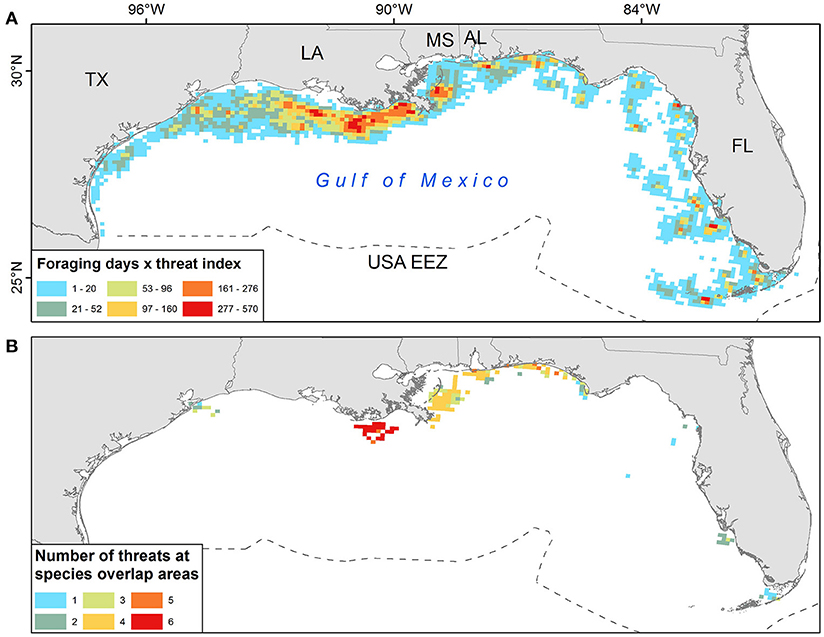
Figure 3. (A) Foraging days for both Kemp's ridley and loggerhead turtles multiplied by an anthropogenic threat index in 10 km grid cells within the U.S. Exclusive Economic Zone (EEZ). “Hot spots” of turtle-use and anthropogenic threats are shown with red and orange cells (values 161- 570) (B) The number of threats in each grid cell for which foraging locations of both species were observed. “High” threats are shown by cells with 4–6 threats occurring (yellow, orange, red).
Analysis of the derived threats grid for the GoM (Figure 2) revealed a moderately strong positive association between (1) levels of threats and (2) use of foraging grounds (Spearman's ρ = 0.47, p < 0.001), suggesting that turtles tend to forage in areas with higher levels of threats (4–6 identified threats). Of all 820 high threats grid cells (4–6 identified threats), our sampled turtles foraged at least 1 day in 77% of them (635 grid cells). Further, 635/1679 (38%) of cells with both threats and turtle-days were classified as high threat.
Discussion
We demonstrate locations in the GoM where two imperiled sea turtle species co-occur during their foraging periods with a suite of anthropogenic threats. Further, we identified critical areas, such as off the coast of Louisiana, USA where both species and almost all assessed threats occur. These results provide guidance for conservation of GoM habitats. By identifying these turtle- and threat-co-occurrence hot spots, optimization of limited conservation resources is possible (Piacenza et al., 2015).
Anthropogenic Threats
Pelagic longlines are a substantial cause of sea turtle mortality and management actions have been suggested for any ships that encounter turtles (Lewison and Crowder, 2007). We found that commercial line fisheries occur across virtually the entire GoM. While we looked at broad-scale data on line fisheries, this wide distribution demonstrates that they could be a significant threat in this region.
In addition to line fisheries, shrimp trawling takes place to varying degrees across the entire US coast of the GoM. Annual bycatch numbers for Atlantic fisheries, which includes both the southeast and GoM areas, has been estimated at 98,300 Kemp's ridleys (with a mortality rate of 2,700) and 26,500 loggerheads (mortality of 1,400; Finkbeiner et al., 2011). Of that total, the SE/GoM trawl fishery made up 98% of interactions and accounted for more than 80% of mortality events. Further, of these, the GoM alone comprised most interactions (73%) and mortality events (96%; Finkbeiner et al., 2011). Although these numbers represented decreases from pre-2003 (attributed to turtle exclusion devices and trawling reduction), loggerhead interactions increased from 2007 to 2009 (Finkbeiner et al., 2011), and the predicted exponential increase in nesting for Kemp's ridleys (NMFS et al., 2011) ended in 2010 and has not resumed (Shaver and Caillouet, 2015).
We used spatial layers for marinas and shipping lane density as indicators for potential boat strikes with turtles. In the Mediterranean, boat strikes were a common cause for sea turtle mortality (second only to fisheries), including loggerheads (Casale et al., 2010). The high amount of shipping lanes in the western GoM and south of Florida, USA, as well as recreational boat traffic close to shore could therefore pose a significant threat to sea turtles and even other marine megafauna such as sperm whales Physeter macrocephalus (Watwood et al., 2006) in the GoM.
Karenia brevis blooms in the Gulf of Mexico can cause large-scale fish kills, kill large vertebrates and damage benthic communities (Landsberg et al., 2009). Loggerheads and Kemp's ridleys stranded off the Florida (USA) coast in 2005-2006 were linked to Karenia brevis red tide events (Fauquier et al., 2013). While acute deaths from these toxins is possible, Capper et al. (2013) found that turtles can be non-lethally exposed to HABs chronically over long periods of time possibly harming their health. In addition, hypoxic zones may affect the distribution of sea turtles as demersal prey species may disperse from hypoxic areas to those with intermediate dissolved oxygen (Craig et al., 2001). Shifting habitat to follow prey could result in energetic losses for foraging turtles.
After the Deepwater Horizon oil spill, loggerheads maintained foraging site fidelity within the spill footprint, putting them at risk for oil and chemical exposure (Vander Zanden et al., 2016). In one study, >50% of sampled Kemp's ridleys may have been exposed to oil, which was implicated as a possible factor in their slowing population growth (Reich et al., 2017). The full extent of biological harm to these species and their prey from the spill is still being determined and the potential for future spills (based on the vast number of oil platforms at >7,000 platforms in the BOEM database for federal GoM waters) maintains this as a serious conservation concern.
Spatial Intersection
The primary hotspot for the two species and anthropogenic threats examined here occurred off the coast of Louisiana, USA. The majority of foraging locations for Kemp's ridley females tracked in our study occurred in the western half of the GoM whereas female loggerhead foraging locations were in the eastern half of the GoM. Loggerhead nest abundance declines significantly west of Florida, USA (NMFS and USFWS, 2008) and Kemp's ridleys primarily nest in Mexico and Texas, USA (Shaver and Caillouet, 2015). Although loggerheads tracked from nesting beaches in the GoM have made long-distance movements, few have moved into the western GoM (e.g., Foley et al., 2014; Hart et al., 2014). Further research is needed into resource availability for Kemp's ridleys and loggerheads in the GoM, as well as whether these spatial habitat-use patterns here hold for other individuals in the populations (i.e., males, subadults).
Conclusion
By delineating foraging areas for two sea turtle species over multiple years in a body of water with many anthropogenic stressors, we identified areas of particular concern for adult females which could provide high conservation dividends. Our derived threat index represents a minimum indicator of anthropogenic pressures in the GoM, and is a first step for a CEA or CUI that includes sea turtles. Our results indicate that, although all threats described here have the potential to impact recovery of these species, commercial line fishing, shrimp trawling, hypoxia, shipping lanes, and oil spills off the southern Louisiana, USA coast and commercial line fishing and HABs off the SW coast of Forida, USA appear to represent the most serious ongoing threats at foraging areas of these two sea turtle species. Resource managers can use this information to direct targeted and effective conservation and monitoring efforts. Research on the impact level of each threat to these species will also help us move toward having a CEA for the GoM. Integrative marine assessments (see Borja et al., 2016) can include this information in future evaluations of the resilience of the GoM marine ecosystem. The particular threat data available are limited regarding quality and quantity of specific pressure data; improvements in the coverage and intensity of these layers (both spatially and temporally) can help to inform key questions in Marine Megafauna Movement Ecology (Hays et al., 2016), including “What Areas Can Be Considered Hot spots for Multiple Species on a Global Scale” and “How Do Anthropogenic Activities Affect Movements?”.
This study is one of the few quantifying threats at foraging areas in the GoM, and we provide key data for a species with limited distribution (i.e., Kemps ridley). We further demonstrate the need for conservation of sites that have key critical foraging habitat for two imperiled sea turtle species (following on Hart et al., 2012). Lastly, another set of major threats not included in this analysis are those currently occurring and predicted from climate change (e.g., Almpanidou et al., 2017). It will be important to track changes and shifts in both sea turtle habitat-use patterns and threat levels in these and other sea turtle foraging “hot spots” as well as to assess how impact weights of existing threats may fluctuate due to climate change in the future. The growing body of literature of vulnerability assessments focused on sea turtles (e.g., Fuentes et al., 2011; Almpanidou et al., 2016) could be expanded from evaluations of nesting beaches to include resilience factors at foraging sites to inform population viability for both of these imperiled species. Environmental conditions at most foraging areas are understudied or unknown, thus a future avenue of research providing ecological correlates of foraging area use with environmental parameters is warranted.
Data Availability Statement
Restrictions apply to the datasets. Raw data is exempt from publication due to sensitivity of endangered species location information. All other data used for analyses are presented in the paper.
Author Contributions
KH, AI, ML, and DS contributed to the conception and design of the study; AI and IF organized the database; IF, AI, and DB performed the statistical analysis; KH and AI wrote the first draft of the manuscript; DS, ML, IF, and DB wrote sections of the manuscript. All authors contributed to manuscript revision, read and approved the submitted version.
Funding
Funding for the field studies and data analysis was provided in part by the National Park Service, USGS Priority Ecosystem Studies program, USGS Ecosystems Program, Deepwater Horizon Natural Resource Damage Assessment, and National Fish and Wildlife Foundation. Acuario de Veracruz, Campamento Tortuguero de Rancho Nuevo, Campamento Tortugero del Totonacapan, Campamento Tortugero Vida Milenaria, Conservacion y Desarollo de Espacios Naturales, S.C., Gladys Porter Zoo, NOAA-Fisheries, and University of Florida provided equipment, funding, or logistical assistance. C. Rubio, P.M. Burchfield, J. Peña, D. Gomez Gamez, R. de Jesus Gonzales Diaz Miron, H.J. Martinez, J. Ortiz, and many others helped deploy transmitters or manage data for Kemp's ridley turtles. We acknowledge use of the satellite-tracking and analysis tool and telemetry data (publicly available from www.seaturtle.org). Any use of trade, product, or firm names is for descriptive purposes only and does not imply endorsement by the U.S. Government.
Conflict of Interest Statement
The authors declare that the research was conducted in the absence of any commercial or financial relationships that could be construed as a potential conflict of interest.
Supplementary Material
The Supplementary Material for this article can be found online at: https://www.frontiersin.org/articles/10.3389/fmars.2018.00336/full#supplementary-material
Abbreviations
GoM, Gulf of Mexico; NMFS, National Marine Fisheries Service; SSM, Switching state-space model; HAB, Harmful Algal Bloom.
Footnotes
1. ^Available online at: http://response.restoration.noaa.gov/erma/. (Accessed 9 January, 2014)
References
Almpanidou, V., Schofield, G., Kallimanis, A. A., Türkozan, O., Hays, G. C., and Mazaris, A. D. (2016). Using climatic suitability thresholds to identify past, present, and future population viability. Ecol. Indicat. 71, 551–556. doi: 10.1016/j.ecolind.2016.07.038
Almpanidou, V., Schofield, G., and Mazaris, A. D. (2017). Unraveling the climatic niche overlap of global sea turtle nesting sites: impact of geographical variation and phylogeny. J. Biogeog. 44, 2839–2848. doi: 10.1111/jbi.13092
Bjorndal, K. A. (1997). “Foraging ecology and nutrition of sea turtles,” in Biol. Sea Turtles, eds P. L. Lutz, and J. A., Musick (Boca Raton, FL: CRC Press), 199–232.
Bjorndal, K. A., Bowen, B., Chaloupka, M. Y., Crowder, L. B., Heppell, S. S., Jones, C. M., et al. (2011). Better science needed for restoration in the Gulf of Mexico. Science 331, 537–538. doi: 10.1126/science.1199935
Borja, A., Elliott, M., Andersen, J. H., Berg, T., Carstensen, J., Halpern, B. S., Heiskanen, A.-S., et al. (2016). Overview of integrative assessment of marine systems: the ecosystem approach in practice. Front. Mar. Sci. 3:20. doi: 10.3389/fmars.2016.00020
Breed, G. A., Jonsen, I. D., Myers, R. A., Bowen, W. D., and Leonard, M. L. (2009). Sex-specific, seasonal foraging tactics of adult grey seals (Halichoerus grypus) revealed by state–space analysis. Ecology 90, 3209–3221. doi: 10.1890/07-1483.1
Camilli, R., Reddy, C., Yoerger, D., Van Mooy, B., Jakuba, M., Kinsey, J., et al. (2010). Tracking hydrocarbon plume transport and biodegradation at Deepwater Horizon. Science 330, 201–204. doi: 10.1126/science.1195223
Capper, A., Flewelling, L. J., and Arthur, K. (2013). Dietary exposure to harmful algal bloom (HAB) toxins in the endangered manatee (Trichechus manatus latirostris) and green sea turtle (Chelonia mydas) in Florida, USA. Harmful Algae 28, 1–9. doi: 10.1016/j.hal.2013.04.009
Casale, P., Affronte, M., Insacco, G., Freggi, D., Vallini, C., Pino D'Astore, P., et al. (2010). Sea turtle strandings reveal high anthropogenic mortality in Italian waters. Aquat. Conserv. Mar. Freshw. Ecosyst. 20, 611–620. doi: 10.1002/aqc.1133
CLS (2011). Argos User's Manual: Worldwide Tracking and Environmental Monitoring by Satellite. Available online at: http://www.argos-system.org/web/en/76-user-s-manual.php
Costello, M. J., Coll, M., Danovaro, R., Halpin, P., Ojaveer, H., and Miloslavich, P. (2010). A census of marine biodiversity knowledge, resources, and future challenges. PLoS ONE 5:e12110. doi: 10.1371/journal.pone.0012110
Craig, J. K., Crowder, L. B., Gray, C. D., McDaniel, C. J., Kenwood, T. A., and Hanifen, J. G. (2001). “Ecological effects of hypoxia of fish, sea turtles, and marine mammals in the northwestern Gulf of Mexico,” in Coast Hypoxia Consequences Living Resour Ecosyst, eds N. Rabalais, and R. E. Turner (Washington, DC: American Geophysical Union), 269–291.
Fauquier, D. A., Flewelling, L. J., Maucher, J., Manire, C. A., Socha, V., Kinsel, M. J., et al. (2013). Brevetoxin in blood, biological fluids, and tissues of sea turtles naturally exposed to Karenia brevis blooms in central west Florida. J. Zoo Wildl. Med. 44, 364–375. doi: 10.1638/2012-0164R.1
Finkbeiner, E. M., Wallace, B. P., Moore, J. E., Lewison, R. L., Crowder, L. B., and Read, A. J. (2011). Cumulative estimates of sea turtle bycatch and mortality in USA fisheries between 1990 and 2007. Biol. Conserv. 144, 2719–2727. doi: 10.1016/j.biocon.2011.07.033
Foley, A. M., Schroeder, B. A., Hardy, R., MacPherson, S. L., and Nicholas, M. (2014). Long-term behavior at foraging sites of adult female loggerhead sea turtles (Caretta caretta) from three Florida rookeries. Mar. Biol. 161, 1251–1262. doi: 10.1007/s00227-014-2415-9
Fritts, T. H., Hoffman, W., and McGehee, M. A. (1983). The distribution and abundance of marine turtles in the Gulf of Mexico and nearby Atlantic waters. J. Herpetol. 17, 327–344. doi: 10.2307/1563586
Fuentes, M. M. P. B., Limpus, C. J., and Hamann, M. (2011). Vulnerablity of sea turtle nesting grounds to climate change. Global Change Biol. 17, 140–153. doi: 10.1111/j.1365-2486.2010.02192.x
Hart, K. M., Lamont, M. M., Fujisaki, I., Tucker, A. D., and Carthy, R. R. (2012). Common coastal foraging areas for loggerheads in the Gulf of Mexico: opportunities for marine conservation. Biol. Cons. 145, 185–194. doi: 10.1016/j.biocon.2011.10.030
Hart, K. M., Lamont, M. M., Sartain, A. R., and Fujisaki, I. (2014). Migration, foraging, and residency patterns for northern gulf loggerheads: implications of local threats and international movements. PLoS ONE 9:e103453. doi: 10.1371/journal.pone.0103453
Hart, K. M., Sartain, A. R., and Fujisaki, I. (2015). Bahamas connection: residence areas selected by breeding female loggerheads tagged in Dry Tortugas National Park, USA. Anim. Biotel. 3:3. doi: 10.1186/s40317-014-0019-2
Hawkes, L. A., Witt, M. J., Broderick, A. C., Coker, J. W., Coyne, M. S., Dodd, M., et al. (2011). Home on the range: spatial ecology of loggerhead turtles in Atlantic waters of the USA. Divers. Distrib. 17, 624–640. doi: 10.1111/j.1472-4642.2011.00768.x
Hays, G. C., Ferreira, L. C., Sequeira, A. M. M., Meekan, M. G., Duarte, C. M., Bailey, H., et al. (2016). Key questions in marine megafauna movement ecology. Trends Ecol. Evol. 31, 463–475. doi: 10.1016/j.tree.2016.02.015
Jennings, S., and Kaiser, M. (1998). The effects of fishing on marine ecosystems. Adv. Mar. Biol. 34, 201–352. doi: 10.1016/S0065-2881(08)60212-6
Jonsen, I. D., Flemming, J. M., and Myers, R. A. (2005). Robust state-space modeling of animal movement data. Ecology 86, 2874–2880. doi: 10.1890/04-1852
Kalman, R. E. (1960). A new approach to linear filtering and prediction problems. J. Basic Eng. 82, 35–45. doi: 10.1115/1.3662552
Kareiva, P., and Odell, G. (1987). Swarms of predators exhibit “preytaxis ” if individual predators use area-restricted search. Am. Nat. 130, 233–270.
Lamont, M. M., Carthy, R. R., and Fujisaki, I. (2012). Declining reproductive parameters highlight conservation needs of loggerhead turtles (Caretta caretta) in the northern Gulf of Mexico. Chelonian Conserv. Biol. 11, 190–196. doi: 10.2744/CCB-1006.1
Lamont, M. M., Putman, N. F., Fujisaki, I., and Hart, K. M. (2015). Spatial requirements of different life-stages of the loggerhead turtle (Caretta caretta) from a distinct population segment in the northern Gulf of Mexico. Herpetol. Conserv. Biol. 10, 26–43. doi: 10.1186/s40317-015-0089-9
Landsberg, J. H., Flewelling, L. J., and Naar, J. (2009). Karenia brevis red tides, brevetoxins in the food web, and impacts on natural resources: decadal advancements. Harmful Algae 8, 598–607. doi: 10.1016/j.hal.2008.11.010
Lewison, R. L., and Crowder, L. B. (2007). Putting longline bycatch of sea turtles into perspective. Conserv. Biol. 21, 79–86. doi: 10.1111/j.1523-1739.2006.00592.x
Lopez, R., and Malardé, J.-P. (2011). Improving ARGOS Doppler Location Using Kalman Filtering. France: Ramonville Saint-Agne.
Lutcavage, M. E., Plotkin, P., Witherington, B., and Lutz, P. L. (1997). “Human impacts on sea turtle survival,” in The Biology of Sea Turtles, eds P. L. Lutz and J. A. Musick (Boca Raton, FL: CRC Press), 387–409.
Maxwell, S. M., Hazen, E. L., Bograd, S. J., Halpern, B. S., Breed, G. A., Nickel, B., et al. (2013). Cumulative human impacts on marine predators. Nat. Commun. 4:2688. doi: 10.1038/ncomms3688
Mazaris, A. D., Schofield, G., Gkazinou, C., Almpanidou, V., and Hays, G. C. (2017). Global sea turtle conservation successes. Sci. Adv. 9:e1600730. doi: 10.1126/sciadv.1600730
NMFS and USFWS (2008). Recovery Plan for the Northwest Atlantic Population of the Loggerhead Sea Turtle, 2nd Revision. Silver Spring, MD: National Marine Fisheries Service.
NMFS USFWS, and SEMARNAT. (2011). Bi-National Recovery Plan for the Kemp's Ridley Sea Turtle (Lepidochelys kempii), 2nd Revision. Silver Spring, MD.
NMFS-SEFSC (2008). Sea Turtle Research Techniques Manual. NOAA Technical Memorandum. NMFS-SEFSC-579.
Piacenza, S. E., Thurman, L. L., Barner, A. K., Benkwitt, C. E., Boersma, K. S., Cerny-Chipman, E. B., et al. (2015). Evaluating temporal consistency in marine biodiversity hot spots. PLoS ONE 10:e0133301. doi: 10.1371/journal.pone.0133301
R Development Core Team (2014). R: A language and Environment for Statistical Computing. Vienna: R Foundation for Statistical Computing.
Reich, K. J., López-Castro, M. C., Shaver, D. J., Iseton, C., Hart, K. M., Hooper, M. J., et al. (2017). δ13C and δ15N in the endangered Kemp's ridley sea turtle Lepidochelys kempii after the Deepwater Horizon oil spill. Endanger. Species Res. 33, 281–289. doi: 10.3354/esr00819
Shaver, D. J. (1991). Feeding ecology of wild and head-started Kemp's ridley sea turtles in south Texas waters. J. Herpetol. 25, 327–334.
Shaver, D. J., and Caillouet, C. W. (2015). Reintroduction of Kemp's ridley (Lepidochelys kempii) sea turtle to Padre Island National Seashore, Texas and its connection to head-starting. Herpetol. Conserv. Biol. 10, 378–435.
Shaver, D. J., Hart, K. M., Fujisaki, I., Bucklin, D., Iverson, A. R., Rubio, C., et al. (2017). Inter-nesting movements and habitat-use of adult female Kemp's ridley turtles in the Gulf of Mexico. PLoS ONE 12:e0174248. doi: 10.1371/journal.pone.0174248
Shaver, D. J., Hart, K. M., Fujisaki, I., Rubio, C., Sartain, A. R., Peña, J., et al. (2013). Foraging area fidelity for Kemp's ridleys in the Gulf of Mexico. Ecol. Evol. 3, 1–11. doi: 10.1002/ece3.594
Shaver, D. J., Hart, K. M., Fujisaki, I., Rubio, C., Sartain-Iverson, A. R., Peña, J., et al. (2016). Migratory corridors of adult female Kemp's ridley turtles in the Gulf of Mexico. Biol. Conserv. 194, 158–167. doi: 10.1016/j.biocon.2015.12.014
Stelzenmüller, V., Coll, M., Mazaris, A. D., Giakoumi, S., Katsanevakis, S., Portman, M. E., et al. (2018). A risk-based approach to cumulative effect assessments for marine management. Sci. Tot. Environ. 612, 1132–1140. doi: 10.1016/j.scitotenv.2017.08.289
Tittensor, D., Mora, C., Jetz, W., Lotze, H., Ricard, D., Vanden Berghe, E., et al. (2010). Global patterns and predictors of marine biodiversity across taxa. Nature 466, 1098–1101. doi: 10.1038/nature09329
Vander Zanden, H. B., Bolten, A. B., Tucker, A. D., Hart, K. M., Lamont, M. M., Fujisaki, I., et al. (2015). Determining origin in a migratory marine vertebrate: a novel method to integrate stable isotopes and satellite tracking. Ecol. Apps. 25, 320–335. doi: 10.1890/14-0581.1
Vander Zanden, H. B., Bolten, A. B., Tucker, A. D., Hart, K. M., Lamont, M. M., Fujisaki, I., et al. (2016). Biomarkers reveal sea turtles remained in oiled areas following the Deepwater Horizon oil spill. Ecol. Appl. 26, 2145–2155. doi: 10.1002/eap.1366
Watwood, S. L., Miller, P. J. O., Johnson, M., Madsen, P. T., and Tyack, P. L. (2006). Deep-diving foraging behavior of sperm whales (Physeter microcephalus). J. Anim. Ecol. 75, 814–825, doi: 10.1111/j.1365-2656.2006.-11-1.x
Keywords: anthropogenic threats, co-occurrence, foraging, Gulf of Mexico, sea turtles, movement models, satellite tracking, switching state space modeling
Citation: Hart KM, Iverson AR, Fujisaki I, Lamont MM, Bucklin D and Shaver DJ (2018) Marine Threats Overlap Key Foraging Habitat for Two Imperiled Sea Turtle Species in the Gulf of Mexico. Front. Mar. Sci. 5:336. doi: 10.3389/fmars.2018.00336
Received: 22 December 2017; Accepted: 29 August 2018;
Published: 24 September 2018.
Edited by:
David W. Sims, Marine Biological Association of the United Kingdom, United KingdomReviewed by:
Antonios D. Mazaris, Aristotle University of Thessaloniki, GreeceMariana M. P. B. Fuentes, Florida State University, United States
Copyright © 2018 Hart, Iverson, Fujisaki, Lamont, Bucklin and Shaver. This is an open-access article distributed under the terms of the Creative Commons Attribution License (CC BY). The use, distribution or reproduction in other forums is permitted, provided the original author(s) and the copyright owner(s) are credited and that the original publication in this journal is cited, in accordance with accepted academic practice. No use, distribution or reproduction is permitted which does not comply with these terms.
*Correspondence: Kristen M. Hart, kristen_hart@usgs.gov