Assessment of the Plastic Inputs From the Seine Basin to the Sea Using Statistical and Field Approaches
 Romain Tramoy1*
  Johnny Gasperi1*
  Rachid Dris1,2 Laurent Colasse3
  Cédric Fisson4
  Sarah Sananes5 Vincent Rocher6
  Bruno Tassin1
- 1Université Paris-Est, Laboratoire Eau, Environnement, Systèmes Urbains (LEESU), UMR MA 102 – AgroParisTech, Créteil, France
- 2Animal Ecology I and BayCEER, University of Bayreuth, Bayreuth, Germany
- 3Association SOS Mal de Seine, La Bouille, France
- 4Groupement d’Intérêt Public (GIP) Seine-Aval, Espace des Marégraphes, Rouen, France
- 5Ministère de la Transition Ecologique et Solidaire, Courbevoie, France
- 6Syndicat Interdépartemental pour l’Assainissement de l’Agglomération Parisienne (SIAAP), Direction du Développement et de la Prospective, Colombes, France
Global estimations state that between 0.5 and 12.7 million metric tons of plastic enter the oceans each year. They are, however, associated with great uncertainties due to methodological difficulties to accurately quantify land-based plastic fluxes into the oceans. New studies at basin scale are thus needed for better model calibrations. Here, a modeling approach based on Jambeck’s statistical method and a field approach are compared in order to (i) quantify plastic fluxes in the Seine River and (ii) characterize and constrain uncertainties of both approaches. Despite the simplicity of the statistical approach and rough extrapolations, both methods yield similar results, i.e., between 1,100 and 5,900 t/yr of plastic litter flowing into the Sea of which about 88–128 t/yr are removed by cleaning operations. According to the marine strategy framework directive (2008/56/EC), actions are required to quantify plastic fluxes entering the oceans. Among different methods, a better use of the data from the waste collection should be considered. The development of a national and homogenous platform listing all the collects would be a first step in that direction.
Introduction
Since the 1950s, the production of plastic increased from 1.7 to 335 million of metric tons in 2016 (PlasticsEurope, 2017). Consequently, plastic litter has invaded marine and continental environments worldwide and became in the 2000s a global warning concern. According to global estimations, between 0.5 and 12.7 million metric tons of plastics are entering into the oceans each year, although known stocks are only about 300 thousand metric tons (Eriksen et al., 2014; Jambeck et al., 2015; van Sebille et al., 2015; Lebreton et al., 2017; Schmidt et al., 2017, 2018). Unexplored sea floors could then represent the final reservoir of plastic litter after sinking (Galgani et al., 2000; Kammann et al., 2018; Maes et al., 2018). Plastics constitute between 8 and 15% of waste mass generated by human activities (Hoornweg and Bhada-Tata, 2012). Nonetheless, and even if they are produced in urban areas, their physical and chemical properties make them the predominant part of the litter in natural environments, even on isolated pacific islands, pristine sea ice or sea floors (Barnes et al., 2009). They also constitute an increasing threat for freshwater ecosystems (Eerkes-Medrano et al., 2015; Wilcox et al., 2015; Li et al., 2018). Plastic litter in marine ecosystems largely captured the attention of the scientific community, whereas most plastics would come from the continents via rivers (Schmidt et al., 2017). A better understanding of how plastics are transferred from continents to the oceans and in which amount is therefore of great interest, especially since it seems easier to remove plastic litter from almost unidimensional rivers than from tridimensional oceans.
According to the descriptor 10 of the Marine Framework Directive of 2008, actions are required to reach a good environmental status of ecosystems by 2020 with regard to marine litter1. This also accounts for assessing and monitoring riverine litter as a primary source of marine litter. Several statistical approaches have been developed in the last years to quantify the amount of plastics entering the oceans. They deal with visual counting as proposed by RIMMEL project (González-Fernández and Hanke, 2017), extrapolations from field data limited to punctual opportunistic measurements (Lechner et al., 2014; van der Wal et al., 2015) or statistical analysis at a global scale (Jambeck et al., 2015; Lebreton et al., 2017; Schmidt et al., 2017). Methods differ by their uncertainties and the size of plastic litter taken into account. For example, visual counting is focusing on macroplastics (>2.5 cm), field measurements on microplastics and extrapolation to larger plastic items (van der Wal et al., 2015), while statistics often disregard the size class of plastics. Fields measurements are most of the time focusing on buoyant plastics and ignore a potential plastic load under the surface water (Morritt et al., 2014) and statistical approaches, calibrated with the previous ones, are based on few key parameters poorly improved. To date, many methodological difficulties have prevented the development of a standard method to quantify plastic input entering into the oceans via rivers, because the plastic pollution is scattered, multi-origin and represents only a small fraction of the total waste production. Even in regions known for their inefficient solid waste management, particularly South-East Asia, leaks and losses of plastics to the environment are very low when compared to plastic production and consumption, which reaches several hundreds of millions metric tons (PlasticsEurope, 2017). All global estimations refer to the mismanaged plastic waste index (MPW) to quantify plastic input into the oceans (Jambeck et al., 2015; Lebreton et al., 2017; Schmidt et al., 2017). This index is based on the anthropogenic pressure considering (i) the amount of plastic waste that is not adequately disposed in landfills or incinerator plants according to the economic level of the considered territory (GDP), and (ii) a leakage rate set at 2% of the plastic waste generated, which accounts for accidental loss or littering. This leakage rate is used systematically even though it only relies on one United States report about littering behaviors and costs (MSWCONSULTANTS, 2009; see Supplementary Data of Jambeck et al., 2015). This rate thus constitutes one of the previously mentioned key parameters. Littering being intrinsically unquantifiable because it refers to unobservable loss, its rate of 2% is based on the ratio between the amount of litter generated in the United States in 2008 and the total national waste generation (Supplementary Data of Jambeck et al., 2015). Consequently, calculations at a global scale are linked to statistical weaknesses. These global estimates are nevertheless of main interest because they shed new light on the plastic pollution worldwide by giving orders of magnitude. Better constraining and identifying their limitations is essential to the development of a robust and standardized methodology for measuring plastic inputs entering the oceans.
Over the past 5 years, the microplastic occurrence and distribution of plastic litter in the Seine River were estimated and characterized (Gasperi et al., 2014; Dris, 2016; Dris et al., 2018), but no estimations of fluxes were performed yet. The present paper is a first step toward the construction of innovative methods to accurately estimate plastic fluxes in the Seine River. The Seine basin is relatively small, i.e., 78 600 km2 and its rivers have low water flows, i.e., 300–350 m3/s in average for the Seine river in Paris. They are under significant anthropogenic pressure with 16.7 Million inhabitants into the whole basin, of which ∼12 Million are gathered in Paris megacity. The Seine basin is the most dynamic territory at the national scale with 25% of the population, 50% of the fluvial traffic, 40% of the economic activity, and 30% of agricultural activities (Fisson et al., 2014; Lemoine and Verney, 2015). The seasonal contrast in the catchment is characterized by high water level periods during winter and very low water levels during summer that needs to be managed with dams and water reservoirs. The outlet of the catchment is a 170 km long meandering estuary in which the influence of tides and winds increase as the river mouth becomes closer. All these elements influence the plastic debris dynamics. Coupled with a strong anthropogenic pressure, plastic pollution is highly visible in the estuary – especially at low tide – with countless plastic debris stranded on the riverbanks. This makes the Seine basin a relevant experimental site to analyze plastic debris dynamics and assess the corresponding fluxes according to different approaches. Thanks to environmental associations and a general growing concern of the population, this initiative is supported by the French ministry in charge of the environment, public water agencies, local authorities and NGOs.
Two methods are successively discussed. The first approach is a conceptual modeling approach based on the statistical method developed by Jambeck et al. (2015). The use of regional and departmental data of waste generation per capita and plastic rate in domestic waste enables to better estimate the MPW generation than national data. Even though several key parameters (e.g., Leaking rate to the environment of 2%; Leaking rate to the Sea of 15–40%; GDP as a proxy for not adequately disposed waste) are still used in lack of better options. The second approach is based on field results, i.e., the percentage of plastic in debris captured by a network of floating booms deployed by SIAAP (public sanitation services of Ile de France) upstream and downstream Paris. The two methods are discussed in terms of robustness and sensitivity in order to estimate as much as possible their uncertainties, and in particular those of the key parameters involved. In addition, the impact of clean-up procedures is discussed. Data collected during clean-up campaigns, especially from NGOs, are under-exploited and call for renewed interest in assessing pollution levels in rivers in general and in the Seine River in particular.
The Modeling Approach
Data and Method
In the Seine catchment, the modeling approach was based on the following parameters: (i) the number of inhabitants, (ii) the annual amount of waste produced per capita, (iii) the associated plastic rate, and (iv) a 2% rate of leakage to the environment (Jambeck et al., 2015). The conceptual model is described in Figure 1A. According to Jambeck et al. (2015), the amount of MPW is also based on the GDP of countries to account for the municipal waste that are not well disposed. Since the GDP in France is high, this parameter is neglected because France is believed to manage municipal waste properly according to the world bank (Hoornweg and Bhada-Tata, 2012; Supplementary Data in Jambeck et al., 2015). Finally, only littering was considered, in which 15% to 40% are entering the Seine River to account for municipal street sweeping and other cleaning actions before it reaches the Seine River (Jambeck et al., 2015).
Figure 1. (A) Conceptual model modified from Jambeck et al. (2015) and (B) Results for the Seine catchment. In italics, sources of input data. The red boxes indicate the robustness of the data: the more intense the red, the less robust the output data. MPW, mismanaged plastic waste. ∗This takes into account differences in waste production between the french departments included in the catchment.
The annual waste production per capita was based on domestic residual waste – the fraction which is not sorted at home – and was extracted from the Agence de l’Environnement et de la Maîtrise de l’Energie database (ADEME2). The most recent and consolidated data from 2015 were used. The residual waste data are available at the department scale, which corresponds to the European NUTS-3 scale (NUTS: Nomenclature of Territorial Units for Statistics). Then, the average waste generation at the basin scale is weighted proportionally to the population of each department (see Supplementary Data). For departments partially included in the catchment of the Seine River, only the fraction actually included was considered using GIS layers containing population data for each municipality (GEOFLA® 2016 v2.2 Communes France Métropolitaine, IGN).
In this study, only domestic residual waste was considered, because it is the most important fraction in mass and also the better characterized in terms of amount, typology and plastic proportion (ORDIF, 2017a,b). It provides useful information about life styles of inhabitants living into the catchment and their use guarantees a good homogeneity among data like Jambeck et al. (2015) did at the national level using the world bank data (For France, these authors used the total municipal waste generation per capita and an associated plastic rate of 10%). Based on the domestic residual waste of more than 7.8 Million inhabitants in Paris megacity, the associated plastic rate is 16% (ORDIF, 2017a). This plastic rate was applied to the whole catchment, because there is no plastic rate associated to waste generation by department available. Then, the rate of 2% of littering used by Jambeck et al. (2015) was applied to estimate the amount of MPW since a more accurate rate is still not available. For the same reason, the 15 to 40% of MPW reaching the Seine River was also applied.
Results
Around one quarter of the French population, i.e., 16,7 Million people, is living into the Seine basin, of which ∼12 Million gathered in Paris megacity. The weighted average domestic residual waste generation is 276 kg/cap/yr for 2015, hence a total of plastic waste in the basin of 738,205 t/yr considering a plastic rate of 16% (Figure 1B). It can be noticed that results shows some discrepancies between departments. For example, the average in Paris megacity (288 kg/cap/yr) is 17% higher than the one in the rest of the basin (246 kg/cap/yr). It even goes up to 45% if only Paris city is considered when compared to the rest of the territory. This can be explained by the very high economic and touristic activity in Paris megacity, associated with the “on-the-go” consumption trend, generating much more waste than elsewhere (ORDIF, 2017a,b). The ORDIF reports shed new lights on discrepancies between urban and rural territories by comparing typologies of domestic residual waste between Paris megacity and the national averages. Results show a relatively low proportion of organics into the domestic residual waste from Paris megacity when compared to the national average. Whereas the proportion of plastic packaging (16%) – mainly films and PET bottles – and packaging board is higher than the national average (10% for plastic packaging). In addition, the densest areas suffer of a lack of space for selective collection, which contributes to increasing the amount of domestic residual waste in Paris megacity as well as reducing the recyclability potential.
Using those specific data from 2015 as inputs of the conceptual model, MPW is estimated at 14,760 t/yr, of which 15 to 40%, i.e., 2,200 to 5,900 t/yr entering into the Seine River (Figure 1B). This is less than the 20,000 t/yr of MPW estimated by Lebreton et al. (2017) in their study based on the total waste production for each world catchment using data from the World Bank. However, their calibrated model used to calculate plastic outputs yield only 9 to 45 t/yr of plastics entering the oceans from the Seine catchment. This discrepancy may be related to the lack of consideration for macroplastics and submerged debris due to rough calibrations of the predictive model. Calibrations were based on available and uncomplete local studies, which mainly report microplastic or mesoplastic concentrations measured at the surface. It illustrates the strong influence of input data into models, but also the great discrepancies between models and other methods of estimation coming from calibration issues.
The uncertainties related to the conceptual model approach is entirely based on the hypothesis that 15 to 40% of MPW reach the Seine River. However, those proportions are poorly documented and are linked to many environmental factors and local practices (street sweeping, hydrologic regimes, infrastructures, incivilities, associative cleaning, local policies, etc.). The same remarks are addressed to the 2% of littering, which relies on only one study from a US association of corporations: Keep America Beautiful, Inc. (MSWCONSULTANTS, 2009). This 2% rate is used in every global estimation as a baseline for littering estimates, whereas there is no reason to apply this rate in every country of the world including the Seine River in France. In conclusion, refining those parameters in each territory is of high interest to reduce uncertainties. Thus, another approach has been developped to be compared to the present results.
The Field Approach
Data of the Floating Booms and Extrapolation Methods
The field approach is based on the amount of waste captured by the 26 floating booms of the SIAAP between 2007 and 2017, which are displayed on the Marne and the Seine River in Paris megacity (Figure 2). The covered period of data is larger than the previous method for several reasons. First, the localizations of the floating booms are not relative to the river morphology (e.g., meanders). They were designed and set up to collect macro-debris from combined sewer overflows during rainy events (Gasperi et al., 2012, 2014). Extending the covered period of data enables to account for inter-boom variability as well as inter-annual variability of the mean water flow. Second, we do not have the same resolution of data for the booms and the statistical approach as the oldest available data with the same precision are from 2013. Third, statistics of population and waste generation per capita did not drastically change between 2000 and 2015. The population increased of 10% in Paris megacity, while waste generation per capita decreased by 10% (ORDIF, 2017b). Thus, it still makes sense to compare the two methods, even though the resolution of data and the period considered are different.
Figure 2. (A) Geographical distribution of the floating boom network from SIAAP in Paris megacity with sampled booms by Gasperi et al. (2014) in red, (B) a picture from a floating boom and (C) an example of waste removal by boat. Modified from Gasperi et al. (2014).
Floating booms collect organics and plastic litter. The SIAAP records the monthly total masses collected in annual reports (see Supplementary Data). During the period 2007–2017, the mean annual water flow of the Seine River in Paris-Austerlitz Bridge was 308 m3/s (see Supplementary Data). The plastic rate in those debris has been estimated by Gasperi et al. (2014) using debris collected in 10 booms corresponding to the red points in Figure 2. According to these authors, 1.4% in mass of the debris caught by the floating booms are plastics, with values ranging from 0.8 to 5.1%. The average of 1.4% was used to calculate plastic amounts captured by floating booms. However, the real efficiency of the booms for collecting floating debris is unknown. Then, hypotheses were assumed to estimate plastic fluxes. First, the plastic rate in the collected debris was considered constant for the whole year. Second, it is considered that plastics are uniformly distributed on the cross section of the Seine River. Following these hypotheses, the plastic amount captured by floating booms was extrapolated to a water flow ratio between the booms and the Seine River.
The water flow ratio RQ corresponds to the ratio between water flows crossing the booms and the mean water flow of the Seine River, i.e., 308 m3/s in Paris. Each boom is 7.5 m width for 0.3 m height covering 2.25 m2 of the Seine River. In Paris megacity, the minimum water depth in the shipping line is 3.2 m according to navigation authorities3. With a mean water flow of 0.1 m/s, each boom is crossed by a water flow of 0.225 m3/s, i.e., 5.85 m3/s for the 26 booms. According to the water flow ratio method, booms capture a fraction RQ ∼1/53 of the mean water flow of the Seine River. Based on this ratio and data from the SIAAP, monthly mean concentrations of plastics in water [Pl]monthly (in mg/m3 or in literature in g/1000 m3) were calculated using the following equation for the period 2007–2017:
With MPl, the mass of plastics in mg calculated by multiplying the monthly mass of debris in booms and the rate of plastics in debris (Gasperi et al., 2014), Qmonthly, the monthly mean water flow in m3/s and t(monthly), the number of seconds in one month. Then, a log relation between plastic concentrations and water flow in the Seine River was constructed (Figure 3).
Figure 3. Concentrations (log10) of plastics in the Seine River relative to the monthly mean water flow filtered by 26 floating booms of the SIAAP between 2007 and 2017. Each point corresponds to a monthly mean water flow and associated log10 concentration of plastics during the same period. Minimum and maximum annual water flow for this period is, respectively, X1 and X2. Concentrations of plastics in mg/m3 were calculated using (i) the monthly amount of debris collected by booms, (ii) an average plastic rate in debris of 1.4% (Gasperi et al., 2014), and (iii) a ratio between the mean water flow and water flow filtered by boom, i.e., 1/53. The highest mean water flow of 1,006 m3/s corresponds to the flood of June 2016.
Results
Monthly plastic concentration values in the water filtered by booms were calculated using the equation (1). Between 2007 and 2017, they ranged from 50 to 390 mg/m3, with an average at 173 ± 76 mg/m3 and a median value at 165 mg/m3. Those concentrations in the Seine River are in the range of concentrations compiled by Schmidt et al. (2017) who reported a mean value in worldwide rivers of 864.7 ± 5,461.3 mg/m3, but they also reported a median concentration far smaller at ∼0.3 mg/m3. At sea, mean values of plastic concentrations in accumulation zones in open oceans are between 300 and 600 g/km2, similar to the average concentration (423 g/km2) in surface waters of the Mediterranean Sea (Cozar et al., 2014; Cózar et al., 2015). Assuming a water layer of 30 cm, concentrations in the most polluted areas of the oceans reach 1 to 2 mg/m3, which is two order of magnitude less than our estimations for the Seine River. Cleaning operations on land and in rivers would thus be more effective than in the open sea.
Monthly plastic concentrations in the Seine River are negatively correlated to monthly water flows (Figure 3). The range of plastic load flowing into the Seine River can be approximated using this relation with minimum and maximum annual water flow on the period 2007–2017 (Figure 3), i.e., x1 = 190 m3/s (in 2009) and x2 = 521 m3/s (in 2013), respectively. Assuming a uniform distribution of plastics on the cross section, the plastic load is then between 1,100 and 1,700 t/yr (see Supplementary Data for detailed calculations). This assumption of equal mass of plastic in the vertical profile is selected as best option for rough estimations, since non-floating litter loads remain unknown. Because floating booms cover barely 10% of the Seine river depth (3.2 m in Paris megacity), floating litter would represent between 110 and 170 t/yr.
Concentration-water flow relations are usually used to identify sources and mechanisms of diffusion of pollutants in rivers like for suspended sediments, particulate organic matter, nutrients or metals (e.g., Williams, 1989; Vink et al., 1999; Quilbé et al., 2006). By analogy, the significant relation (p < 0,001) between log concentration values of plastics trapped by booms and associated water flows depicts dilution processes of the plastic pollution with the increase of water flows (Figure 3). However, factors influencing the concentrations of plastics are numerous as suggested by the high inter- and intra-seasonality variability (summer/winter), with roughly 50% of the variance non-explained by this relation. This is probably the result of the combination between event-related plastic pollution, i.e., rain events, and a background pollution accumulation during dry weather periods from Paris megacity. Plastic leaks into the environment through incivilities or unintentional losses related to nomadic consumption would constitute relatively constant inputs, diluted by increasing water flows. For example, summer favors nomadic consumption close to the riverbanks. Then, storms promote the transfer of litters to the Seine River by runoff from their banks or from combined sewer overflows, resulting in event-related pollution. This could explain the wide range of plastic concentration values that is twice as large in summer as in winter. Nevertheless, while plastic amounts increase with water flows, it still remains insufficient to counteract dilution processes (Supplementary Figure S1).
According to internal SIAAP reports and Supplementary Data, no spatial trend (e.g., downstream or upstream Paris; Figure 2) can be highlighted regarding the amount of debris captured by floating booms. This suggests a constant input of debris in the whole area covered by the booms, which is in agreement with a strong and permanent anthropogenic pressure in Paris megacity. Other factors can influence the efficiency of floating booms and therefore the estimation of plastic fluxes. It must be noted that on one hand intense river traffic along the Seine and wind bring waste back to the banks, while on the other hand induced waves can push debris out from the booms. In addition, during high flood episodes, debris can escape from the booms. The flooding of the floodplain also decreases the chance for a boom to catch debris, while the potential amount of plastics increases as evidenced by the winter flood in 2018 (Figure 4). Municipalities downstream of Paris were particularly impacted by the presence of plastic litter on riverbanks or in sluices (e.g., Méricourt, Les Andelys). The real trapping efficiency of the booms is therefore unknown and might be evaluated using tracking waste as markers.
Figure 4. Debris during the winter flood in 2018. Route de Muids, right riverbank, ∼120 km downstream Paris megacity, in February 2018, the 15th.
Discussion
The various approaches lead to estimates ranging from 1,100 to 5,900 t/yr of plastics entering the Seine River. This is much higher than those estimated by Lebreton et al. (2017), i.e., 9–45 t/yr, mostly based on floating microplastic data and therefore lacking information on the macroplastic pool. However, when compared to estimations related to floating litter only, i.e., 110 to 170 t/yr, results are closer to each other suggesting a relatively good reliability of the Lebreton’s model for floating litter flux. When compared to the population of the Seine River catchment, 1,100 to 5,900 t/yr of plastics yields between 66 and 353 g/cap/yr. Uncertainties leading to this wide range have been identified but could not be precisely assessed. However, both methods converge toward similar orders of magnitude, while their uncertainties refer to completely different parameters. In summary, the conceptual modeling approach has the advantage of being systematic, easy to apply, but therefore somewhat abstract and based on almost unverifiable assumptions (e.g., 2% leakage rate). In contrast, the field approach, based on floating booms, is based on very concrete amount of plastic litter collected. However, it is limited in time and space, because floating booms are concentrated in Paris megacity and their efficiency can be very variable. In addition, only floating litter is being collected by booms. Thus, considering plastics as homogeneously distributed into the water column is a very strong hypothesis.
To date, few studies give orders of magnitude of plastic fluxes in rivers. When available, they are often difficult to compare with each other because of methodological issues. Most of the time, estimations are based on trawling devices or similar, with different mesh sizes. For example, estimates of plastic fluxes in the Danube are much lower than those estimated in the Seine with only 17 g/cap/yr (Lechner et al., 2014). But they are based on extrapolations of plastic amount trapped in fish larvae nets (500 μm mesh size) that were settled in Vienna without catching any floating macroplastics. Whereas macroplastics are the most dominant plastics in mass in open oceans (Eriksen et al., 2014). Despite devices used for similar methods are different, plastic load in rivers can often be easily converted in g/cap/yr. In low income countries like Vietnam, between 350 and 7,270 g/cap/yr of plastic debris (>2 cm) have been estimated for Nhieu Loc – Thi Nghe, a canal flowing into the Saigon River (Lahens et al., 2018). The authors estimate a median flow at 1,620 g/cap/year, which is five times higher than our largest estimation for the Seine River. Another study based on particle counting and trawling in the estuary of the Saigon River estimated between 7,500 and 13,700 t/yr of plastics entering the ocean, namely 938 to 1,713 g/cap/year (van Emmerik et al., 2018). At similar economic levels to France, estimated plastic fluxes into the great lakes in the United States are very similar to those estimated for the Seine River with 10,000 t/yr for ∼90 million inhabitants, meaning 111 g/hab/yr (Hoffman and Hittinger, 2017). Sources of plastics are mainly related to the huge lakeside population of Chicago, Detroit, Toronto, and Cleveland. However, the convergence of estimated plastic fluxes for the Great Lakes and the Seine River is not very surprising, as the authors also used the approach of Jambeck et al. (2015). This points to the need of diversity in methods to estimate plastic fluxes otherwise the risk is inter-validation between studies.
The RIMMEL protocol (González-Fernández and Hanke, 2017) proposes to count particles by unit of time and has been updated by van Emmerik et al. (2018) in Vietnam who converted particle counts in masses and coupled results with hydrological data to get annual plastic discharge. Following this method and using a mass per sampled plastic piece of 3.2 g (van Emmerik et al., 2018), 1,100 to 5,900 t/yr of plastics would be equivalent to 343.8 to 1,843.4 Million particles in 1 year. Considering that all plastic litter is buoyant, an observer should count between 11 and 58 particles per second. Even when only considering a floating litter flux, i.e., 110–170 t/yr, an observer should count 1.1 to 1.7 particle per second. Except during floods, such number of items is never reached with the real figure being closer to several items per minutes. This huge discrepancy might be related to the difference between what can be seen at the surface and what is really flowing under the surface water. According to Morritt et al. (2014), plastic flow below the surface water can be important as suggested in the Thames River, but the fraction of plastic remaining nearby to the surface in the Seine River remains unknown. This highlights the need to develop methods more closely connected to the field measurements with greater spatial and temporal representativeness.
One of the ways that should be explored for diversification of methodologies is the use of data collected by the numerous NGOs in charge of bank cleaning. The pollution of the riverbanks by macroplastics is extremely visible and contrast with low visual pollution in the river. This “environmental disorder” tends to raise awareness at economic, social and political levels. The influence of citizens results in the implementation of measures to collect plastic litter through different organizations: public (cleaning boats in the Hauts-de-Seine, SIAAP floating booms), private non-profit organization (Naturaulin in the Seine estuary) or NGO (La-Seine-en-Partage, OSE, SOS Mal de Seine, La Maison de l’Estuaire…). Other private actors, such as hydroelectric power plants, also catch part of the litter out of technical necessity, i.e., protecting the turbines from the presence of debris that could damage them. Although the list of clean-up operations is not exhaustive, the compilation and standardization of the data collected shows that these actors remove 88–128 t/yr of plastic throughout the river (Table 1). However, this estimate faces significant methodological difficulties because the data recovered differ in format or types of cleaning between actors. For example, run-of-river power plants outsource waste treatment, which is charged by the number of containers without any characterization being carried out on the collected litter. These problems of consistency in the data have been regularly pointed out since the macro-waste topic emerged some 20 years ago in France (Lerond, 1997; Poitou, 2003; Galgani et al., 2010).
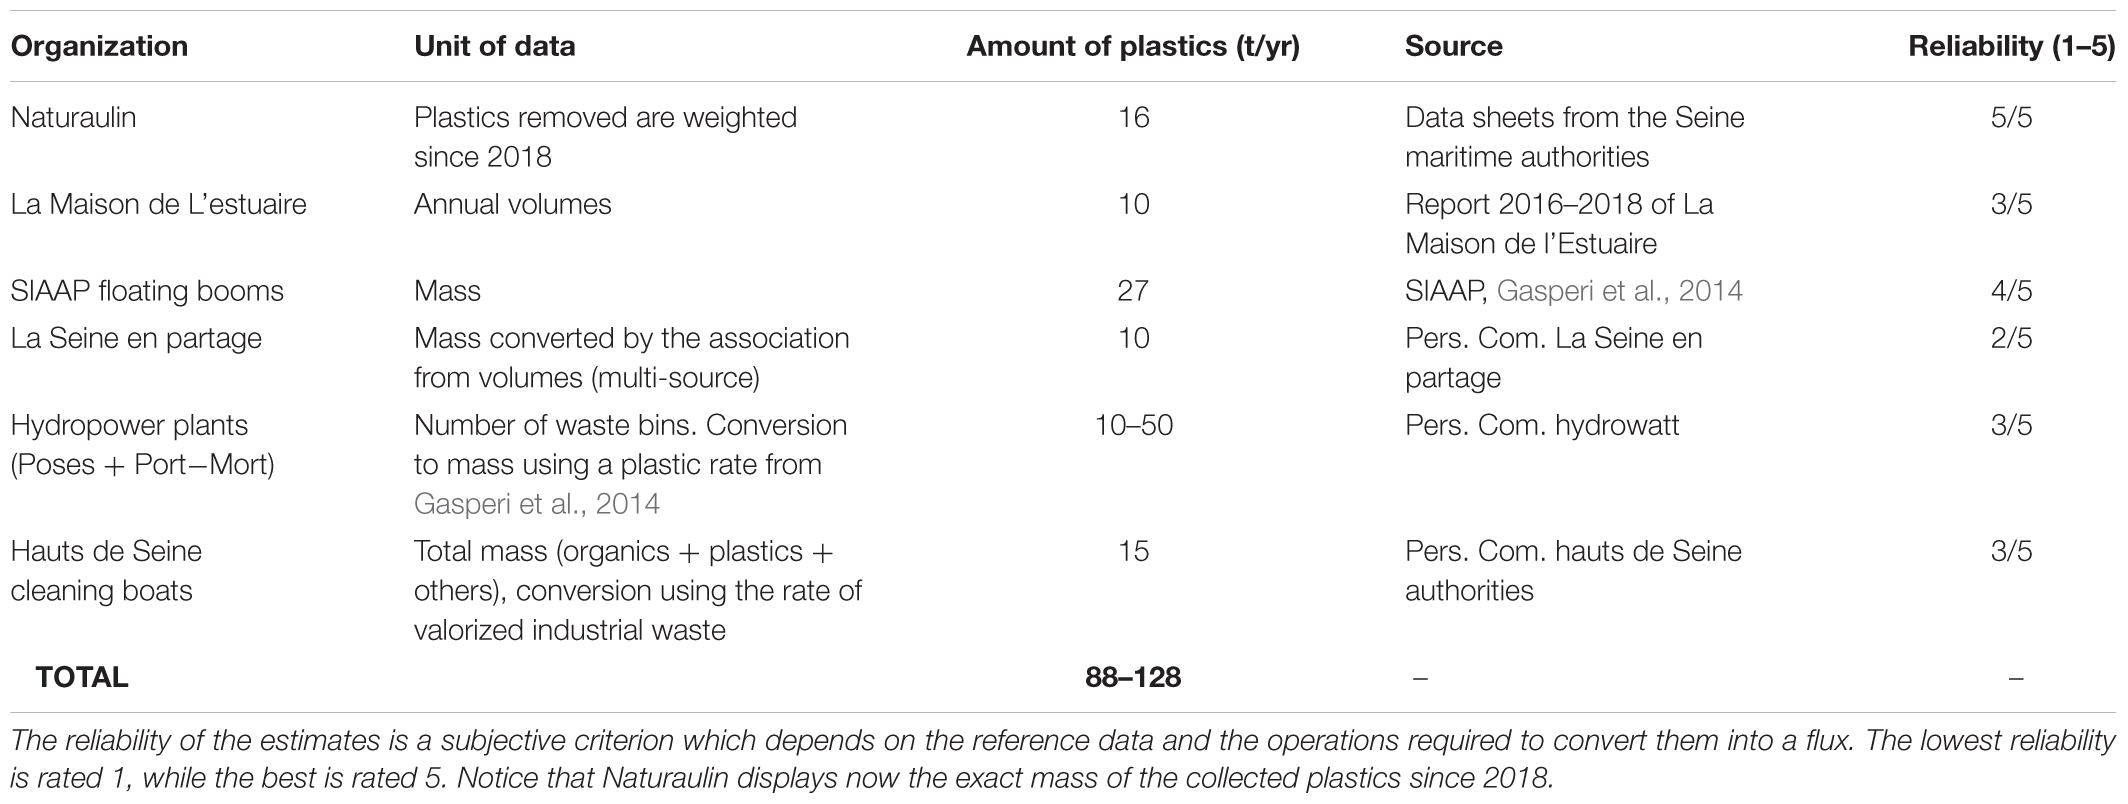
Table 1. Estimates of plastic amounts collected in the Seine river or on river banks.
Converting volumes of litter collected (with organics) into plastic mass or using already transformed data, without the associated methodology, does not facilitate the estimation of the impact of cleaning (Table 1). This figure of 88–128 t/yr should therefore be taken with caution. It is also almost negligible (1–12%) when compared to previous estimations of plastic fluxes. The compilation of a large amount of beach waste collection data from 130 countries shows that 250,000 metric tons of waste have been collected worldwide mostly since the 2000s, or around 12,500 t/yr (Schneider et al., 2018). Assuming that a similar cleaning effort is renewed each year and that all litter collected is plastic, the collection rate would be 0.1 to 2.5% of the estimated 0.5 to 12.7 million metric tons reaching the oceans (Jambeck et al., 2015; Lebreton et al., 2017; Schmidt et al., 2017). Accordingly, although useful from a societal and environmental point of view, these clean-up operations alone would not be able to solve the problem of plastics in the oceans (Schneider et al., 2018). In addition, most cleanings deal with stocks and not fluxes. In the case of the Seine River, regular cleanings in accumulation zones may prevent the development of a considerable litter stock along the river and reduce litter flux to the oceans by renewing the capacity of these zones to act as litter sinks. Consequently, the use of cleaning data could help to evaluate fluxes and even set up an indicator of the pollution rate of rivers by plastic litter. In the Seine Estuary, cleanings make already possible to qualitatively highlight the main impact of floods, rainfall events and great tides (Naturaulin and La Maison de l’Estuaire, pers. com.), in agreement with models that predict the maximum plastic inputs during winter in our latitudes (Lebreton et al., 2017). Such cleanings should be developed in other basins as programs of qualitative and quantitative monitoring measures of riverine litter according to the Descriptor 10 of the marine strategy framework directive (MSFD; see text footnote 1). Cleanings already proved their usefulness leading to restrictions at the European level of single use plastics for the coming years such as cotton bud sticks, cutlery, plates, stirrers, straws, sticks for balloons4.
Conclusion
The combined use of a field approach and a conceptual modeling approach has led to estimates of plastic fluxes exported from the Seine to the Sea of the same order of magnitude, i.e., 1,100 to 5,900 t/yr of which 88–128 t/yr are removed by cleaning operations and dams. However, these estimates are based on strong assumptions and/or suffer from huge uncertainties that remain difficult to constrain in the current state of knowledge. This study also highlighted the role of the various actors involved in waste collection in the river. They can be an important source of data despite the lack of homogeneity and wide discrepancies in collection practices. Nevertheless, this study constitutes a first attempt at the national level. It calls for the development of new and innovative methods facing methodological difficulties discussed in this paper. For example, the transfer dynamics of plastics from the upstream to the downstream of the river should also be considered to accurately evaluate plastic inputs into the oceans but also the impact of mitigation policies.
Other actors in waste collection have yet to be identified. In the future, it would be interesting to set up a homogeneous database common to all actors at the national, European and international level. It could be used to develop an indicator of the pollution of the river by plastic litter and other anthropogenic items. Such an indicator of river pollution by plastic litter would be able to meet the goals of the MSFD on the monitoring and assessment of litter entering the oceans through rivers.
Author Contributions
RT, JG, and BT contributed to conception and design of the study. RT wrote the first draft of the manuscript. All authors contributed to manuscript revision, read and approved the submitted version.
Funding
Sources of founding are entirely supported by the ministry of the ecological and solidary transition.
Conflict of Interest Statement
The authors declare that the research was conducted in the absence of any commercial or financial relationships that could be construed as a potential conflict of interest.
Supplementary Material
The Supplementary Material for this article can be found online at: https://www.frontiersin.org/articles/10.3389/fmars.2019.00151/full#supplementary-material
Footnotes
- ^ http://ec.europa.eu/environment/marine/good-environmental-status/descriptor-10/index_en.htm
- ^ http://carto.sinoe.org/carto/enquete_collecte/flash/#
- ^ http://www.vnf.fr
- ^ http://europa.eu/rapid/press-release_IP-18-6867_en.htm
References
Barnes, D. K. A., Galgani, F., Thompson, R. C., and Barlaz, M. (2009). Accumulation and fragmentation of plastic debris in global environments. Philos. Trans. R. Soc. B Biol. Sci. 364, 1985–1998. doi: 10.1098/rstb.2008.0205
Cozar, A., Echevarria, F., Gonzalez-Gordillo, J. I., Irigoien, X., Ubeda, B., Hernandez-Leon, S., et al. (2014). Plastic debris in the open ocean. Proc. Natl. Acad. Sci. U.S.A. 111, 10239–10244. doi: 10.1073/pnas.1314705111
Cózar, A., Sanz-Martín, M., Martí, E., González-Gordillo, J. I., Ubeda, B., Gálvez, J. Á, et al. (2015). Plastic accumulation in the mediterranean sea. PLoS One 10:e0121762. doi: 10.1371/journal.pone.0121762
Dris, R. (2016). First Assessment of Sources and Fate of Macro- and Micro- Plastics in Urban Hydrosystems: Case of Paris Megacity. Ph.D. thesis, LEESU, Paris.
Dris, R., Gasperi, J., and Tassin, B. (2018). “Sources and Fate of Microplastics in Urban Areas: A Focus on Paris Megacity,” in Freshwater Microplastics: Emerging Environmental Contaminants, eds M. Wagner and S. Lambert (Cham: Springer International Publishing), 69–83. doi: 10.1007/978-3-319-61615-5_4
Eerkes-Medrano, D., Thompson, R. C., and Aldridge, D. C. (2015). Microplastics in freshwater systems: a review of the emerging threats, identification of knowledge gaps and prioritisation of research needs. Water Res. 75, 63–82. doi: 10.1016/j.watres.2015.02.012
Eriksen, M., Lebreton, L. C. M., Carson, H. S., Thiel, M., Moore, C. J., Borerro, J. C., et al. (2014). Plastic pollution in the World’s Oceans: more than 5 trillion plastic pieces weighing over 250,000 tons afloat at sea. PLoS One 9:e111913. doi: 10.1371/journal.pone.0111913
Fisson, C., Leboulenger, F., Lecarpentier, T., Moussard, S., and Ranvier, G. (2014). L’estuaire de la Seine: Etat de santé et évolution. Rouen: GIP Seine-Aval.
Galgani, F., Fleet, D., Van Franeker, J., Katsanevakis, S., Maes, T., Mouat, J., et al. (2010). Marine Strategy Framework Directive Task Group 10 Report Marine Litter. JRC Scientific and Technical Report EUR 24340 EN - 2010.
Galgani, F., Leaute, J., Moguedet, P., Souplet, A., Verin, Y., Carpentier, A., et al. (2000). Litter on the Sea Floor Along European Coasts. Mar. Pollut. Bull 40, 516–527. doi: 10.1016/S0025-326X(99)00234-9
Gasperi, J., Dris, R., Bonin, T., Rocher, V., and Tassin, B. (2014). Assessment of floating plastic debris in surface water along the Seine River. Environ. Pollut. 195, 163–166. doi: 10.1016/j.envpol.2014.09.001
Gasperi, J., Zgheib, S., Cladière, M., Rocher, V., Moilleron, R., and Chebbo, G. (2012). Priority pollutants in urban stormwater: Part 2 – Case of combined sewers. Water Res. 46, 6693–6703. doi: 10.1016/j.watres.2011.09.041
González-Fernández, D., and Hanke, G. (2017). Toward a harmonized approach for monitoring of riverine floating macro litter inputs to the marine environment. Front. Mar. Sci. 4:86. doi: 10.3389/fmars.2017.00086
Hoffman, M. J., and Hittinger, E. (2017). Inventory and transport of plastic debris in the laurentian great lakes. Mar. Pollut. Bull. 115, 273–281. doi: 10.1016/j.marpolbul.2016.11.061
Hoornweg, D., and Bhada-Tata, P. (2012). What a Waste: A Global Review of Solid Waste Managment. Washington, D.C: The world bank.
Jambeck, J. R., Geyer, R., Wilcox, C., Siegler, T. R., Perryman, M., Andrady, A., et al. (2015). Plastic waste inputs from land into the ocean. Science 347, 768–771. doi: 10.1126/science.1260352
Kammann, U., Aust, M.-O., Bahl, H., and Lang, T. (2018). Marine litter at the seafloor – abundance and composition in the North Sea and the Baltic Sea. Mar. Pollut. Bull. 127, 774–780. doi: 10.1016/j.marpolbul.2017.09.051
Lahens, L., Strady, E., Kieu-Le, T.-C., Dris, R., Boukerma, K., Rinnert, E., et al. (2018). Macroplastic and microplastic contamination assessment of a tropical river (Saigon River, Vietnam) transversed by a developing megacity. Environ. Pollut. 236, 661–671. doi: 10.1016/j.envpol.2018.02.005
Lebreton, L. C. M., van der Zwet, J., Damsteeg, J.-W., Slat, B., Andrady, A., and Reisser, J. (2017). River plastic emissions to the world’s oceans. Nat. Commun. 8:15611. doi: 10.1038/ncomms15611
Lechner, A., Keckeis, H., Lumesberger-Loisl, F., Zens, B., Krusch, R., Tritthart, M., et al. (2014). The Danube so colourful: a potpourri of plastic litter outnumbers fish larvae in Europe’s second largest river. Environ. Pollut. 188, 177–181. doi: 10.1016/j.envpol.2014.02.006
Lemoine, J. P., and Verney, R. (2015). Fonctionnement Hydro-sédimentaire de l’estuaire de la Seine. Rouen: GIP Seine-Aval.
Lerond, M. (1997). Définition des conditions de mise en oeuvre du nettoyage de la Seine - Synthèse. Parc Naturel Regional de Brotonne
Li, J., Liu, H., and Paul Chen, J. (2018). Microplastics in freshwater systems: a review on occurrence, environmental effects, and methods for microplastics detection. Water Res. 137, 362–374. doi: 10.1016/j.watres.2017.12.056
Maes, T., Barry, J., Leslie, H. A., Vethaak, A. D., Nicolaus, E. E. M., Law, R. J., et al. (2018). Below the surface: twenty-five years of seafloor litter monitoring in coastal seas of North West Europe (1992–2017). Sci. Total Environ. 630, 790–798. doi: 10.1016/j.scitotenv.2018.02.245
Morritt, D., Stefanoudis, P. V., Pearce, D., Crimmen, O. A., and Clark, P. F. (2014). Plastic in the Thames: a river runs through it. Mar. Pollut. Bull. 78, 196–200. doi: 10.1016/j.marpolbul.2013.10.035
MSWCONSULTANTS (2009). National Visible Litter Survey and Litter Cost Study. Stamford, CT: Keep America Beautiful, Inc.
ORDIF (2017a). Données de caractérisations locales des ordures ménagères résiduelles (OMR) en île de France. Paris: ORDIF, Observatoire Régional des Déchets.
ORDIF (2017b). LA GESTION DES DÉCHETS MÉNAGERS ET ASSIMILÉS EN ÎLE-DE-FRANCE. Paris: ORDIF, Observatoire Régionaldes Déchets.
PlasticsEurope (2017). Plastics - the Facts 2017, an analysis of European plastics production, demand and waste data. Brussels: Association of Plastics Manufacturer.
Poitou, I. (2003). Les macrodéchets littoraux : une gestion publique empirique en région provence-alpes-Côte d’Azur. Méditerranée 100, 17–22. doi: 10.3406/medit.2003.3277
Quilbé, R., Rousseau, A. N., Duchemin, M., Poulin, A., Gangbazo, G., and Villeneuve, J.-P. (2006). Selecting a calculation method to estimate sediment and nutrient loads in streams: application to the beaurivage river (Québec, Canada). J. Hydrol. 326, 295–310. doi: 10.1016/j.jhydrol.2005.11.008
Schmidt, C., Krauth, T., and Wagner, S. (2017). Export of plastic debris by rivers into the sea. Environ. Sci. Technol. 51, 12246–12253. doi: 10.1021/acs.est.7b02368
Schmidt, C., Krauth, T., and Wagner, S. (2018). Correction to export of plastic debris by rivers into the sea. Environ. Sci. Technol. 52, 927–927. doi: 10.1021/acs.est.7b06377
Schneider, F., Parsons, S., Clift, S., Stolte, A., and McManus, M. C. (2018). Collected marine litter — a growing waste challenge. Mar. Pollut. Bull. 128, 162–174. doi: 10.1016/j.marpolbul.2018.01.011
van der Wal, M., van der Meulen, M., Tweehuijsen, G., Peterlin, M., Palatinus, A., Kovac Virsek, M., et al. (2015). Final Report on Identification and Assessment of Riverine Input of (Marine) Litter. Bristol: Eunomia Research &Consulting Ltd.
van Emmerik, T., Kieu-Le, T.-C., Loozen, M., van Oeveren, K., Strady, E., Bui, X.-T., et al. (2018). A methodology to characterize riverine macroplastic emission into the ocean. Front. Mar. Sci. 5:372. doi: 10.3389/fmars.2018.00372
van Sebille, E., Wilcox, C., Lebreton, L., Maximenko, N., Hardesty, B. D., van Franeker, J. A., et al. (2015). A global inventory of small floating plastic debris. Environ. Res. Lett. 10:124006. doi: 10.1088/1748-9326/10/12/124006
Vink, R., Behrendt, H., and Salomons, W. (1999). Development of the heavy metal pollution trends in several European rivers: an analysis of point and diffuse sources. Water Sci. Technol. 39, 215–223. doi: 10.2166/wst.1999.0549
Wilcox, C., Sebille, E. V., and Hardesty, B. D. (2015). Threat of plastic pollution to seabirds is global, pervasive, and increasing. Proc. Natl. Acad. Sci. U.S.A. 112, 11899–11904. doi: 10.1073/pnas.1502108112
Keywords: litter, fluxes, catchment, waste collection, debris
Citation: Tramoy R, Gasperi J, Dris R, Colasse L, Fisson C, Sananes S, Rocher V and Tassin B (2019) Assessment of the Plastic Inputs From the Seine Basin to the Sea Using Statistical and Field Approaches. Front. Mar. Sci. 6:151. doi: 10.3389/fmars.2019.00151
Received: 07 January 2019; Accepted: 08 March 2019;
Published: 10 April 2019.
Edited by:
Juan Bellas, Spanish Institute of Oceanography, SpainReviewed by:
Daniel González-Fernández, University of Cádiz, SpainGiuseppe Suaria, Istituto di Scienze Marine (ISMAR), Italy
Copyright © 2019 Tramoy, Gasperi, Dris, Colasse, Fisson, Sananes, Rocher and Tassin. This is an open-access article distributed under the terms of the Creative Commons Attribution License (CC BY). The use, distribution or reproduction in other forums is permitted, provided the original author(s) and the copyright owner(s) are credited and that the original publication in this journal is cited, in accordance with accepted academic practice. No use, distribution or reproduction is permitted which does not comply with these terms.
*Correspondence: Romain Tramoy, romain.tramoy@enpc.fr Johnny Gasperi, gasperi@u-pec.fr