Ecosystem Service Assessments in Water Policy Implementation: An Analysis in Urban and Rural Estuaries
 Gerald Schernewski
 Philipp Paysen
 Esther Robbe
 Miguel Inácio
 Johanna Schumacher
- 1Coastal Research and Management Group, Leibniz-Institute for Baltic Sea Research, Rostock, Germany
- 2Marine Research Institute, Klaipeda University, Klaipeda, Lithuania
Coastal waters provide a wide range of ecosystem services (ES), but are under intensive human use, face fast degradation and are subject to increasing pressures and changes in near future. As consequence, European Union (EU) water policies try to protect, restore and manage coastal and marine systems in a sustainable way. The most important EU directive in this respect is the Water Framework Directive (WFD) (2000/60/EC). Objective is to reach a “good status” in EU waters, following a stepwise and guided process. Our major objective is to test how an ecosystem service assessment can support WFD implementation in practice. We use the Marine Ecosystem Service Assessment Tool (MESAT) that utilizes spatial definitions, reference conditions and the good status according to the WFD as well as data and information gained during the implementation process. The data-based tool allows comparative analyses between different ecological states and an evaluation of relative changes in ES provision. We apply MESAT to two contrasting systems in the German Baltic Sea region, the rural Schlei and the urban/industrialized Warnow Estuary. These data-based assessments show how the ES provision has changed between the historic, pre-industrial state around 1880 (reference conditions with high ecological status), the situation around 1960 (good ecological status), and today. The analysis separates the estuaries into water bodies. A complementary expert-based ES assessment compares the situation today with a future scenario “Warnow 2040” assuming a good ecological status as consequence of a successful WFD implementation. Strengths and weaknesses of the approaches and their utilization in the WFD are discussed. ES assessments can be regarded as suitable to support public relation activities and to increase the acceptance of measures. Further, they are promising tools in participation and stakeholder processes within the planning of measures. However an ES assessment not only supports the WFD implementation, but the WFD provides a frame for ES assessments larger scale assessments in seascapes, increases the acceptance of the ES approach and the readiness of stakeholders to get involved.
Introduction
Estuaries are highly dynamic, unique, and diverse ecosystems (Elliott and Whitfield, 2011). Already for centuries, these systems are subject to human impacts and utilization. As consequence, important species are largely depleted, ecologically valuable habitats are destroyed, water quality is degraded and alien species invasion is accelerated (Lotze et al., 2006). In many coastal ecosystems, the direct anthropogenic pressures are still increasing and ongoing environmental changes, like climate change and sea level rise, cause additional problems. Globally, an urgent need for a restoration and a sustainable management especially of estuaries still exists.
With respect to environmental quality and restoration of estuaries in the European Union (EU), the Water Framework Directive (European Union Water Framework Directive [EU-WFD], 2000) is the most important policy document. It aims to establish and/or maintain a “good ecological status” for all surface waters in the member states. To reach this objective, a comprehensive, integrated approach with a detailed implementation strategy was provided (European Commission [EC], 2003a). This directive is one of the most concrete and ambitious pieces of environmental legislation worldwide. However, nearly two decades after its adoption it did not reach its objectives and many problems and delays in its implementation are still obvious (e.g., Hering et al., 2010; Bouleau and Pont, 2015; Voulvoulis et al., 2017). Recently, the European Commission concluded that much remains to be done to fully achieve the objectives of the WFD (European Commission [EC], 2019).
Especially in estuarine ecosystems, the restoration and recovery is complex, follows different recovery patterns as well as rates and the restoration effectiveness differs between the ecosystems (Borja et al., 2010). The uncertainty how a system reacts to measures is a problem for WFD implementation and the public acceptance of these measures. Therefore, successful management requires integrating expertise and scientific information on one side with local knowledge and views, on the other, into a joint decision-making process. In this respect, ecosystem service (ES) assessments can be beneficial. Estimating the provision of ES under alternative management scenarios allows to link biogeophysical data, socioeconomic information, and stakeholder views in the policy and management process (Granek et al., 2010; Giakoumis and Voulvoulis, 2018).
The potential benefits of ecosystem service assessments for EU policies and WFD implementation are reflected by many studies (Bastian et al., 2012; Maes et al., 2012; Martin-Ortega, 2012; Reyjol et al., 2014). Hartje and Klaphake (2006) and Blancher et al. (2011) provide general academic and conceptual approaches on the relationship between ES assessment and the WFD. COWI (2014) compiled important potential benefits of ES assessments, e.g., to support the assessment and communication of the benefits of the directive, to encourage open communication of the impacts of the WFD implementation, to better understand changes caused by measures, to avoid unintended impacts of measures on other benefits or to obtain more information on who may benefit or lose from measures or non-action. However, these considerations about potential benefits require a proof in practice.
Grizzetti et al. (2016) explored how ecosystem services (ES) concepts are used in water management, especially in WFD river basin management plans, and provide several case studies. Vlachopoulou et al. (2014) and Giakoumis and Voulvoulis (2018) developed approaches that link ES and water management objectives. However, Heink et al. (2016) state that “Although the concept of ES has thrived over the last 10 years, its operationalization is still in its infancy.” Further, these studies are focussed on river basins and comparable approaches and suitable assessment tools for coastal waters, meeting a concrete WFD demand, are largely lacking.
According to the Millennium Ecosystem Assessment (Millennium Ecosystem Assessment [MEA], 2005), ES are defined as the benefits humans obtain from ecosystems and coastal ecosystems are among the systems with the highest monetary ES provision. Further, most public benefits are non-tradable and are outside the market values (de Groot et al., 2012). Jobstvogt et al. (2014) underline the cultural ES values of marine protected areas and a recent study provides an overview about the importance of ES and their relevance for human welfare and wellbeing in 32 world-wide coastal lagoons (Newton et al., 2018). Angradi et al. (2016) apply the ES concept to Great Lakes estuarine systems in the United States and Canada, and Luisetti et al. (2014) address comparable estuarine systems in England.
An awareness of benefits and potential relevance of coastal and marine ES exists, but this is still not adequately reflected in research. Publications on ES have increased exponentially during the last 15 years. However, Liquete et al. (2013) summarize in their review that most studies focus on terrestrial ecosystems and that a knowledge gap on marine and coastal ES still exists. This view is supported by Maes et al. (2012), who point out the need of additional research to cover marine ecosystems. Barbier et al. (2011) argue in the same direction and conclude that for coastal and estuarine ecosystems, the value for several services still has not been assessed properly. These shortages are especially true for estuarine ecosystems. According to Elliott and Whitfield (2011) the neglect of estuaries is a result of their inhomogeneity and transitional character, so that they were not perceived as one ecosystem for a long time.
While ES assessments in terrestrial urban systems have a long tradition (Luederitz et al., 2015) and the value of the concept is appreciated (Elmqvist et al., 2015), there are only single examples where an ES assessment took place in industrialized surface waters (Jacobs et al., 2015). The few existing assessment results hardly influenced urban planning and management (Piwowarczyk et al., 2013), but Jacobs et al. (2015) point out that they can be beneficial when engaging stakeholders or to inform policy on strategies for the sustainable use of ES, independently of the WFD.
For inner and outer coastal waters, the WFD provides a typology, spatially defines water bodies, defines reference conditions (high ecological status) and a good status. It provides comprehensive background and preparatory work, but it has to be explored, how this can be utilized as a basis for an ES assessment in practice. The ES assessment in the context of the WFD in estuaries in general and in industrialized, urban estuaries in particular, is an urgent task. For example, the WFD defines how a good status for coastal and marine habitats should look like from an ecological perspective. However, it is uncertain, what the consequences of this desired good status means for humans and for services provided by these ecosystems.
Objectives of this study are: (a) to apply and test a tool that builds upon the WFD typology and utilizes the European ES MAES standard; (b) to show how a data-based assessment can utilize and support major ideas of the WFD, for example by carrying out comparative relative ES assessments between different ecosystem states (present, good, high/reference conditions); (c) to provide comparisons between water bodies/sub-types within coastal estuaries as well as between urban and rural estuaries; (d) to test an expert-based future scenario assessment; and (e) to critically evaluate the practical use of ES assessment approaches for supporting WFD implementation on the local level.
Materials and Methods
The Schlei Estuary
The rural Schlei Estuary is a brackish water body with a surface area of 52 km2 and a total length of 43 km (Figure 1). The characteristic shape was formed by subglacial glacio-fluvival erosion processes during the Weichselian glaciation. It is surrounded by a hilly countryside, with altitudes up to 30 m above sea level. The climate is determined by westerly winds with a mean temperature of 8.6°C and a mean annual precipitation of 885 mm in Schleswig (1981–2010, DWD).
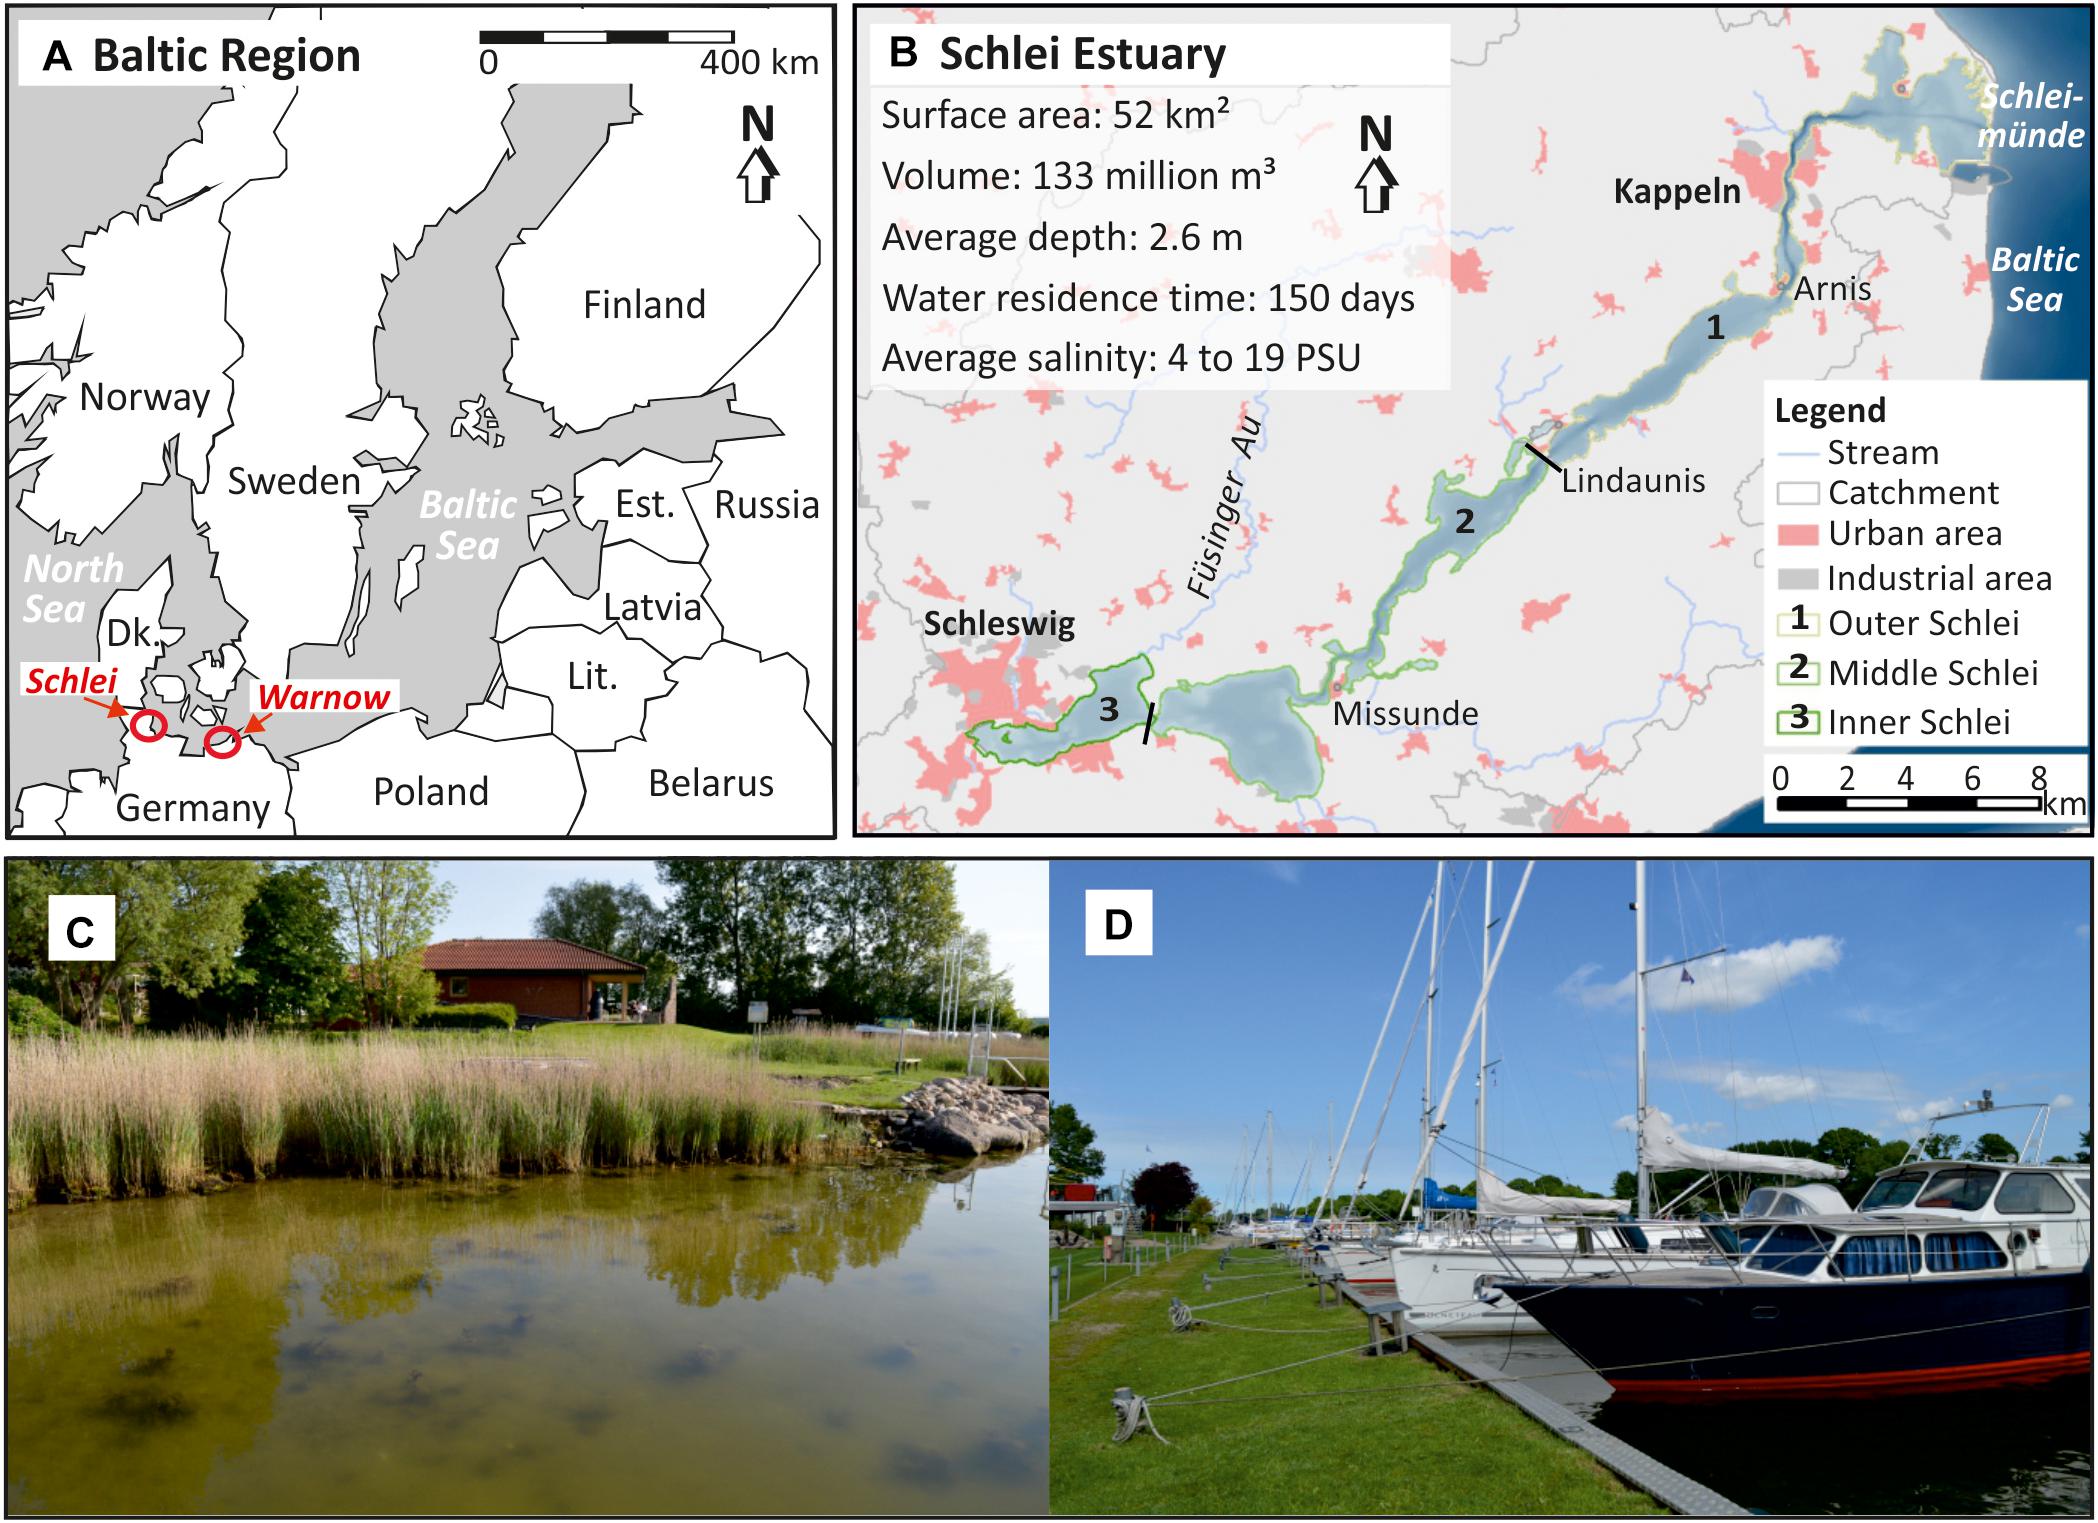
Figure 1. (A) Location of the Schlei and the Warnow Estuary at the Baltic Sea coast of northern Germany, (B) basic geographical information about the rural surrounding of the Schlei Estuary and the boundaries of the inner, middle and outer Schlei, (C) the coastline of the shallow Schlei is accompanied by reed belts, and (D) today, especially water-related tourism determines the visual picture.
Already in the early medieval, Haithabu (near Schleswig) became a major trading center in the Baltic. During Christianization, population and agricultural areas further increased. With industrialization and the connection to the railroad network, fabrics and fish industry experienced economic upswing. In the 1960s and 70s land consolidation and intensification in agriculture changed the landform. In 2015, 53,366 people lived in the connected municipalities around the Schlei concentrated mainly in Schleswig and Kappeln (Statistisches Amt für Hamburg und Schleswig-Holstein, 2014b). Fishery lost its importance as an economic factor, but is still important as cultural heritage and therefore for tourism. However, Kappeln and Maasholm are still considered as important fishery harbors. Already in the 1960s, tourism was an important economic factor (Statistisches Landesamt Schleswig-Holstein, 1964). Nowadays, tourism is a major source of income. In 2014, 84,685 tourist arrivals were recorded (Statistisches Amt für Hamburg und Schleswig-Holstein, 2014a). Furthermore, the Schlei as well as the cities Schleswig and Kappeln are popular tourist destinations for day visitors.
The Schlei can be separated into the inner (near the city of Schleswig), middle and outer (close to the Baltic Sea) Schlei. It is classified as hypertrophic and one of the most eutrophied German Baltic coastal waters (Landesamt für Natur und Umwelt des Landes Schleswig-Holstein [LANU], 2001; Feibicke, 2005). Therefore, the Schlei is in a poor ecological state according to the European Union Water Framework Directive [EU-WFD] (2000). Major source of pollution is the river basin where agricultural causes high nutrient loads (Ohlendieck, 2008). The Schlei catchment covers an area of 667 km2 and with 82% coverage, agriculture is the dominating land-use form. The average riverine water discharge into the Schlei is about 9.5 m3/s. Today, in addition, the waterbody is facing an internal fertilization of phosphorous from accumulated sapropelic sediment layers, covering large areas of the inner and middle Schlei (Ripl, 1986).
High freshwater inflow and limited exchange with the Baltic Sea cause strong gradients. The littoral is dominated by reed belts. Other submerged vegetation, e.g., Zostera marina, can be found only in scattered patches limited to the outer Schlei. In the entire Schlei Ulva intestinalis and Potamogeton pectinatus occur (Meyer et al., 2005). Climate change and accelerated sea level rise cause threats for the historical area of Schleswig and the lowlands along the shore.
The Warnow Estuary
The urban, industrialized Warnow Estuary (including Breitling) is surrounded by the city of Rostock, covers an area of 12.6 km2 and has a total length of 14.4 km (Figure 2). The estuary was formed during the Weichselian glaciation. The climate is characterized by its proximity to the Baltic Sea with a mean temperature of 9.2°C and a mean annual rainfall of 621 mm in Warnemünde (DWD, 1981–2010).
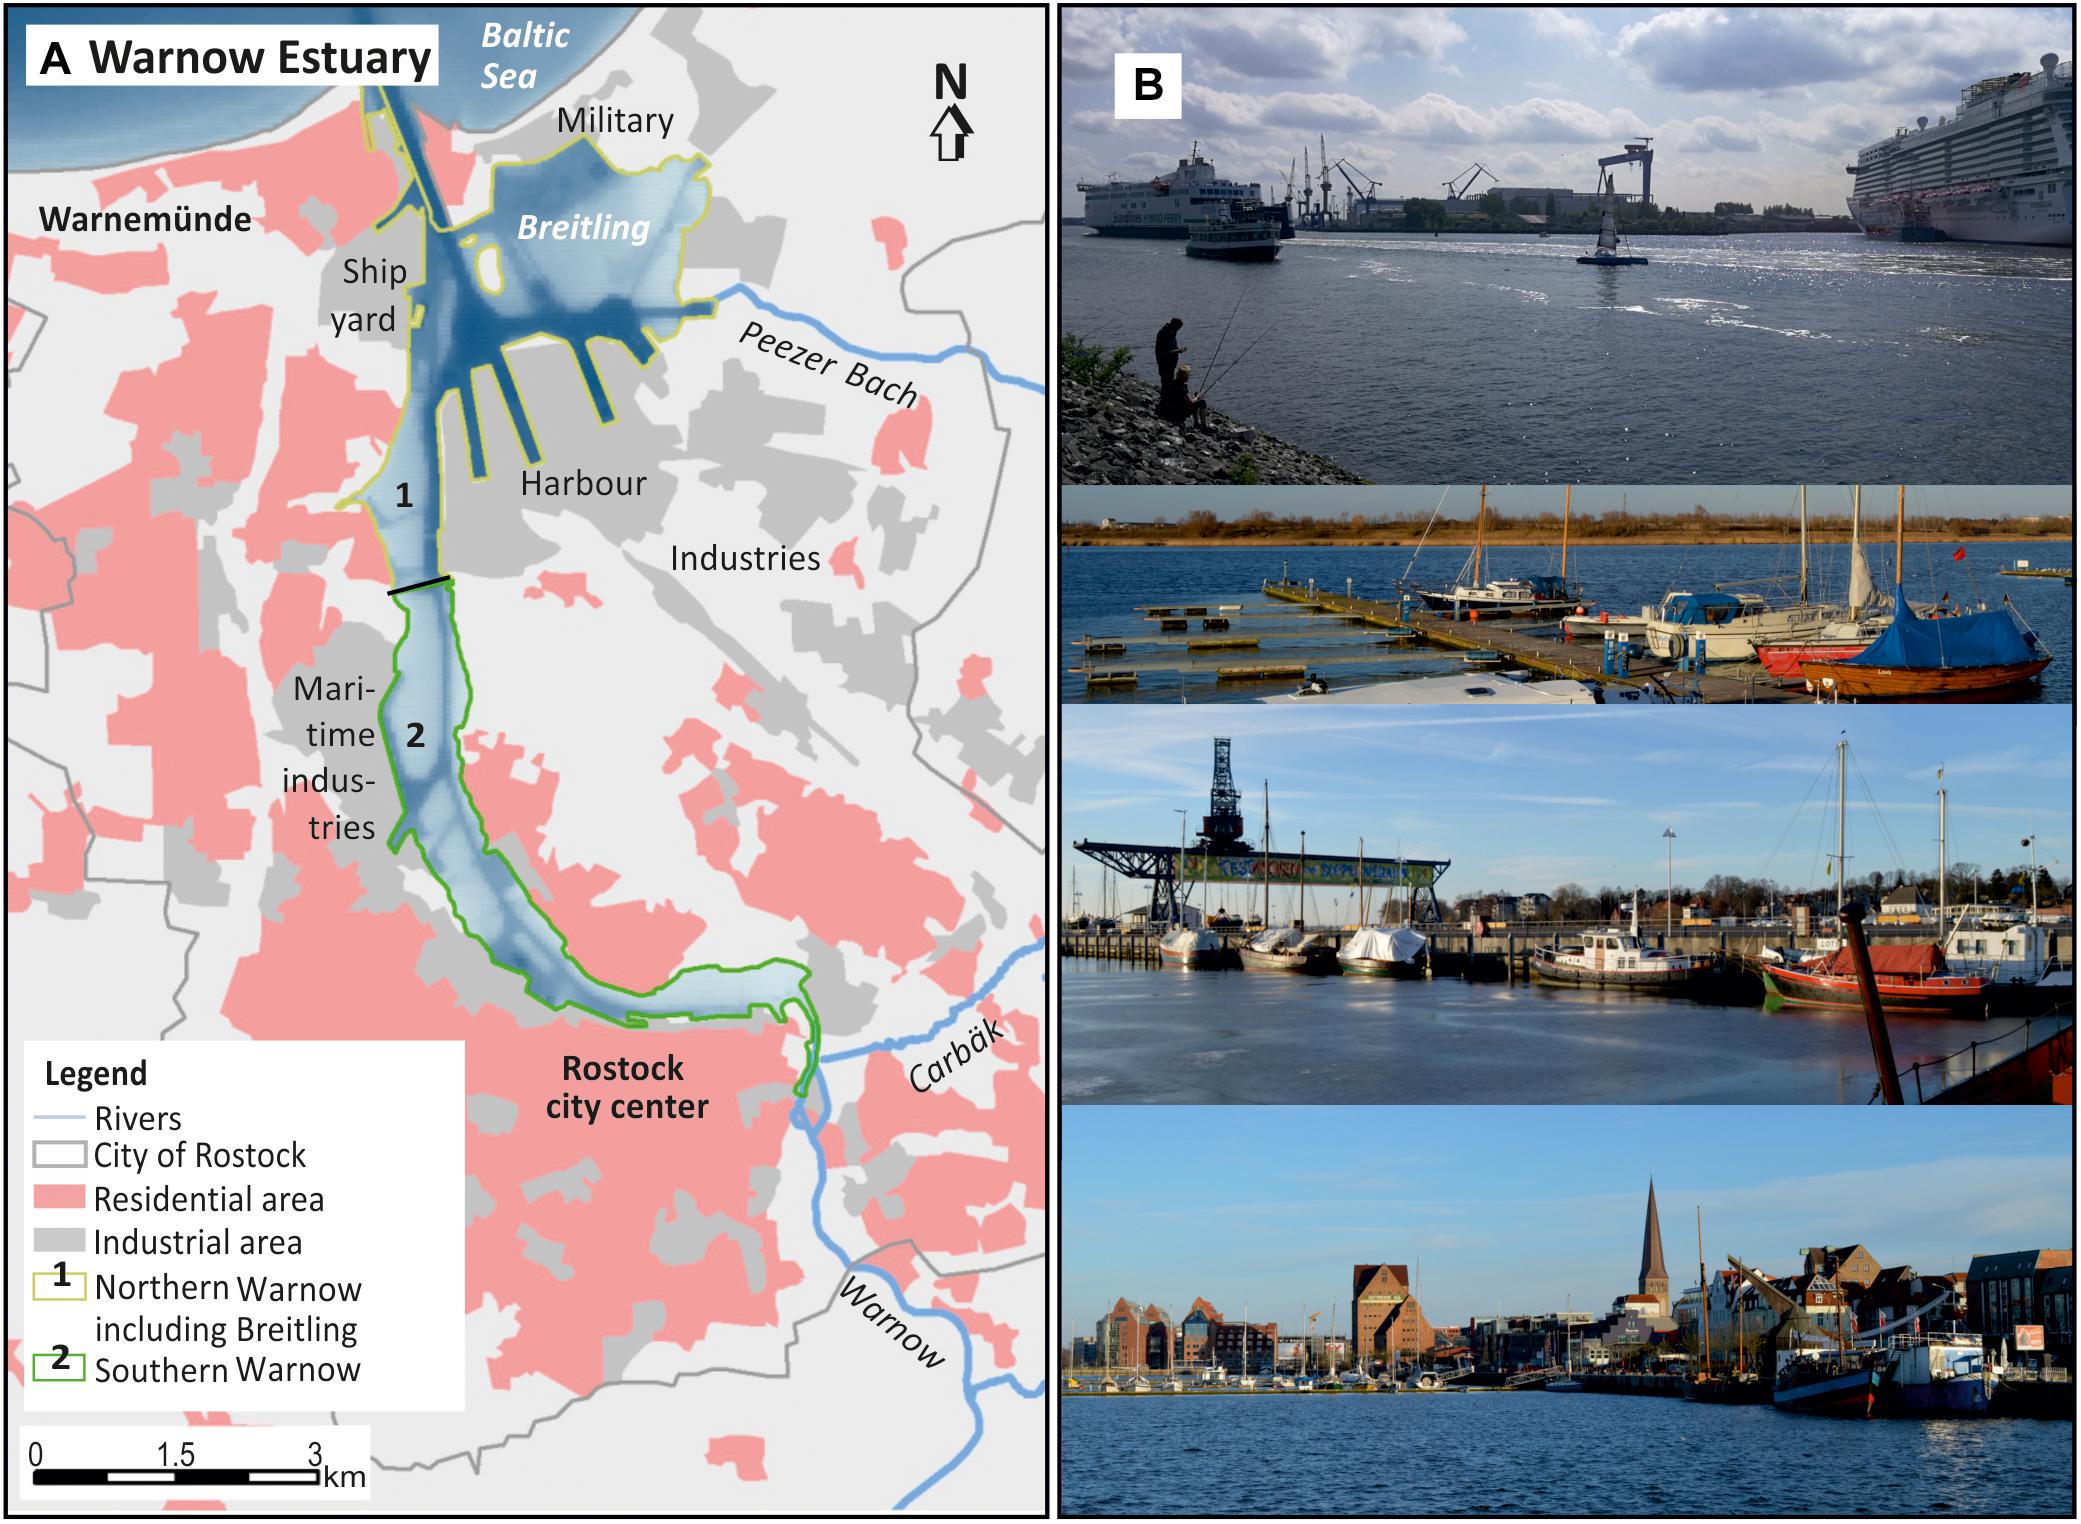
Figure 2. (A) Basic geographical information about the industrial, urban Warnow Estuary and the boundary between northern, industrial and southern, urban Warnow water body, (B) the overseas harbor, a sport boat harbor, the city harbor and the city center of Rostock.
First human settlements date back to the 6th century. In the 12th century Rostock became a Hanseatic city with a peak in prosperity in the 15th century. Industrialization in the 19th century brought an economic upswing. In 1960, the overseas port was opened, leading to a further rise in population, economy and industry. Rostock was shaped by the centrally-planned social and economic system of GDR. After the German reunification in 1990, population and economy first decreased and later increased again. In 2015, Rostock had a population of 206,011 inhabitants and a population density of 1,137 inhabitants per km2 (Hansestadt Rostock, 2016). Nowadays, Rostock functions as transport hub, industry and service centre. Seventy four percent of the Warnow Estuary shore is artificial. Harbor and shipping lanes occupy 37% of the water surface area. Tourism has an increasing economic importance for the region and it became a major Baltic cruise ship harbor. Another reason is that the growing seaside resort Warnemünde belongs to Rostock. In total, 5% of the city zone are nature and landscape protection areas. Fish landings decreased and lost its importance as economic factor. However, traditional small scale fisheries is maintained as a cultural heritage (Landesamt für Umwelt Naturschutz und Geologie Mecklenburg-Vorpommern [LUNG], 2007; Hansestadt Rostock, 2014).
The Warnow Estuary has a water volume is 49.6 million m3 with a mean depth of 4.0 m and its deepest point at 14.5 m (shipping channel). It is highly eutrophied and in a poor ecological condition, according to the European Union Water Framework Directive [EU-WFD] (2000). Eutrophication is a result of high nutrient loads entering the system from the city and especially with the Warnow River. The Warnow River drains a catchment of 3,222 km2 and has a mean discharge of 16.5 m3/s (1989–2009). The sediments in the estuary are sandy and about 10% silty (Müller and Heininger, 1999). The few natural parts of the coast are characterized by low herbaceous vegetation, show a high diversity in (protected) flora and fauna and are accompanied by reed belts and underwater vegetation. The estuary is an important resting and feeding ground for waterfowls and a spawning ground. Ongoing sea level rise together with a sinking coast accelerate coastal erosion (currently 35 cm/year) and increase the risk of storm surges.
Ecosystem Service Assessment Based on the EU Water Framework Directive
For several reasons, an ES assessment in coastal and marine waters is a special challenge compared to terrestrial ecosystems. Terrestrial ecosystems (e.g., forests, fields, urban area) have clearly defined and well visible boundaries, that are largely stable in time. Therefore, the landscape can be subdivided into subsystems. ES can be assessed for each subsystem and compared to each other. Most aquatic ecosystems, like mussel or seagrass beds, are not visible from outside, usually do not have distinct boundaries, and are spatially and temporally variable. Further, the availability of data usually is scarce. On the other hand, the ecology of a water body is relatively homogeneous and defined by major physico-chemical parameters, like depth, tidal range, salinity, temperature, turbidity, residence time, wave exposure and current velocities. In the WFD, these parameters are used for a characterization and classification of all coastal waters, referred to as typology (European Commission [EC], 2003c). The aim of typology is to subdivide the seascape into spatially defined ecological units with similar properties. Coastal waters of one type are subdivided into smaller units, the water bodies, according to pressures and resulting impacts. The water body is the management unit of the WFD. Altogether, the WFD provides a spatial sub-division of the seascape that is well suitable as basis for an ES assessment and forms one major basis for our approach.
Both assessed estuaries are micro-tidal (less than 0.2 m tidal range), have a natural water depth below 30 m and are sheltered with good to moderate water exchange. Therefore, both systems are mesohaline inner coastal waters (type B2) according to the Germany WFD typology (Schernewski et al., 2015). Because of the salinity gradients 5–18‰ (Warnow Estuary) resp. 4–19‰ (Schlei Estuary), both require a sub-division into the subtypes B2a (5–10‰ salinity) and B2b (10–18‰). Often these subtypes define the water bodies, as well. However, because of the complex morphometry, the Schlei Estuary is spatially subdivided into three water bodies (Figure 1). The Warnow Estuary, as heavily modified water body, officially has no further sub-division into water bodies, despite the fact that it covers two sub-types. To follow the WFD strictly, in our approach, we assumed a sub-division into two sub-types and two water bodies (Figure 2).
For each type, the WFD defines reference conditions, which describe the biological quality elements that would exist at high ecological status. It means with no, or very minor disturbance from human activities. Biological quality elements include phytoplankton, macro-algae, angiosperms, benthic invertebrate and fish fauna. If ecosystems with high ecological status do not exist, reference conditions can be defined based on historical data, modeling or expert judgment (European Commission [EC], 2003d). For the southern Baltic, it can be assumed that reference conditions indicating a high ecological status were present until the late 19th century (Schernewski et al., 2015). Objective of the WFD is achieving a good surface water status in the near future. The normative definition of the good status assumes that “the values of the biological quality elements for the surface water body type show low levels of distortion resulting from human activity, but deviate only slightly from those normally associated with the surface water body type under undisturbed conditions” (European Union Water Framework Directive [EU-WFD], 2000). The good status for each type is calculated based on the reference conditions. A pragmatic and commonly used approach, according to the WFD implementation guidelines (European Commission [EC], 2003d), is adding 50% to the reference nutrient concentrations to define the threshold for the good status. As consequence, the good status in the southern Baltic reflects a situation that, in most coastal waters, was still present in the early 1960s (Schernewski et al., 2015). In our ES assessments, we built upon these definitions. For WFD reference conditions, we refer to the period 1880–1900 and assume that a good status was still present in the early 1960s.
A major idea to adapt the WFD-typology for MESAT was, that coastal waters belonging to the same type show many similarities with respect to ecological properties, structures and processes. This is also true for the historic conditions. We assumed that the provision of several ES today is and in the past was largely similar in coastal waters belonging to the same type. In this case, once a coastal water has been assessed in detail, much of this information could be transferred to another coastal water belonging to the same type. This would make the assessment a lot less time consuming.
Ecosystem Service Assessment of Historic States
We adapted the Common International Classification on Ecosystem Services (CICES, version 4.3) (Haines-Young and Potschin, 2013) and partly updated it to CICES, version 5.1 (Haines-Young and Potschin, 2018). CICES sub-divides three sections, provisioning, regulating/maintenance and cultural ES. The ES in each section are further hierarchically sub-divided into divisions, groups and classes. We focus on the most detailed “class” level, to minimize the loss of information. Out of 48 ES classes we selected 31 in MESAT resp. 30 in expert-based assessments to represent coastal water and marine ecosystems. According to Maes et al. (2016), each ES is represented by one or several indicators. Altogether we used 54 indicators (Figure 4). The ES assessment methodology is implemented in Microsoft EXCEL, including application guidelines, automated calculations, data aggregation and visualizations. It is called the Marine Ecosystem Services Assessment Tool (MESAT). More details and the tool itself are provided in Inácio et al. (2018).
The Warnow and the Schlei assessments were done independently by two Master students within a time-period of about 4 months. Both students had a suitable interdisciplinary background and were familiar with the locations. First step in the assessment was the search for suitable information and data for every indicator and the three periods in time: the present state, the years around 1960 and the late 19th century. The data was collected for every spatial sub-system, the WFD water body. In a second step, the data for different periods in time, the late 19th century and the early 1960s were compared with each other and with the present state. For the comparative assessment, we used a relative classification system. It allowed for comparing ES with different units directly and enabled a relatively fast application.
For assessing the quantity of changes, we defined eleven scoring classes. No changes (class zero) and five scoring classes each representing increasing and decreasing service provisions. The class boundaries are non-linear (Figure 3). For the calculation of the score, the indicator value of the present situation was divided by the value of the status of the earlier periods in time. The allocation into scoring classes means that a concrete value is often not needed, but just the expert judgment to which scoring class changes belong.
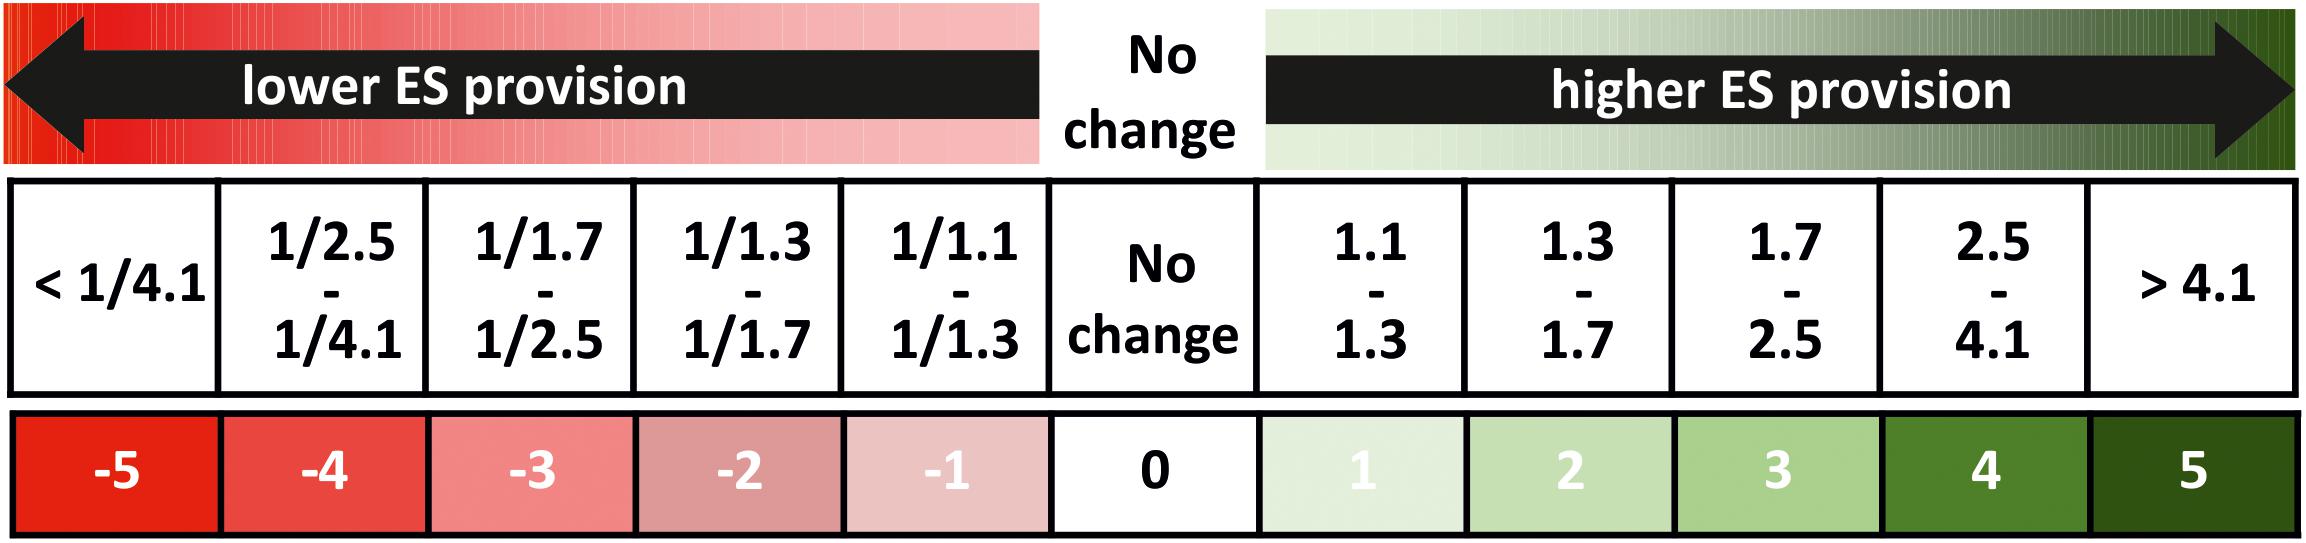
Figure 3. The relative scoring system indicates changes between two different periods in time. For example, the score 1, indicating a slightly higher ES provision, is given when the increase in the present state is higher by a factor of 1.1–1.3 compared to a historic state.
We used field, empirical or statistical data, reports and literature, information derived from models and expert knowledge. The data was categorized according to its reliability. These reliability scores were used in Figure 7, were the score of indicators were multiplied with factors describing data reliability in form of weighting factors. The higher the data quality the higher the weight and the influence of an indicator on the final ES class score. The reliability scores and factors for weighting were (1) very high (factor 2), (2) high (factor 1.5), (3) moderate (factor 0.75), and (4) low (factor 0.5). A definition of data reliability is provided in the Appendix.
Expert Based Assessments of a Future Scenario “Warnow 2040”
In a second application, we provided a future scenario for the year 2040 for the Warnow Estuary, called “Warnow 2040.” Guiding question was how an ES assessment could support the practical implementation of the WFD. The scenario assumed a hypothetical implementation of the WFD including an improved, moderate ecological and a good hydrochemical status of the Warnow Estuary. In an internal background paper of the year 2015, the authorities responsible for WFD implementation (LUNG-MV, pers. com.) defined ecological targets for the Warnow Estuary, taking into account that the Warnow Estuary is a heavily modified water body and offers only limited possibilities for improvements. The suggested programme of measures included reduced external nutrient loads and a restoration of shoreline habitats. In our scenario, we assumed that negative eutrophication effects like algal blooms or hypoxia do not occur anymore in 2040 and that other environmental directives are implemented as well. Most important is the implementation of the EU Bathing Water Directive (European Union Bathing Water Directive [EU-BWD], 2006) that allows re-establishing bathing sites in the estuary.
“Warnow 2040” was sub-divided into one scenario spatially focusing on the northern, outer, industrial and the other on the southern, urban Warnow Estuary. We assumed that these scenarios are realistic and are enabled by WFD implementation and improved ecosystem quality. For the southern scenario, covering the old city harbor, we assumed an innovative, sustainable and maritime development offering a high quality of life. It included seaside housings, green spaces for recreation and public water access, including a beach. The city harbor scenario was based on internal plans of the city of Rostock. It further assumed an implementation of the plans for the national garden exhibition in 2025 and planned subsequent urban developments. For the northern, industrial part of the estuary, the scenario assumed that the deepening of the shipping canal and the harbor extension are realized leading to an increase of industry, construction (shipyard) and services. We assumed that near the seaside resort Warnemünde, maritime tourism and cruise shipping increased. This scenario was based on compiled internal plans of the city of Rostock and the Rostock Port company. The two scenarios were visualized with photographs and maps in a PowerPoint presentation.
The assessment involved 14 scientists with different background as well as 6 experts from different regional authorities, which are responsible or at least familiar with WFD implementation. The assessments were carried out within 4 meetings, face-to-face and via teleconferences. On average, the meetings lasted about 2 h and started with a short introduction including background and objectives, followed by the presentation of the “Warnow 2040” scenarios (altogether about 30 min). After an introduction into the ES assessment tool, the experts were asked to carry out an assessment individually on paper, which took about 35 min. The experts compared both scenarios with the present state of the estuary and scored, based on their perception of the changes, relative differences for each ES class separately using the scoring system shown in Figure 3.
For this assessment, a sub-set of 30 relevant ES classes were pre-selected by the authors, based on MESAT. After the individual assessment, the scores of each expert were entered into an EXCEL sheet. The following discussion gave the experts the possibility to raise questions, settle misunderstandings and, in case, to modify scores. Aim was not to unify the scores and views. Afterward the experts had the possibility to discuss the suitability of the ES and the indicators behind, the approach and the usability of the system within WFD implementation. The discussion on average took nearly 1 h.
Additionally all experts carried out a self-assessment in five classes, ranging from poor to excellent, with respect to geographical knowledge of the Warnow Estuary, knowledge about its ecological state and knowledge about the WFD.
Results
Historic Development: Comparison of Schlei and Warnow
Altogether 31 ES classes were assessed based on 54 indicators. The assessments of the rural Schlei and the urban Warnow Estuary show many similarities. This is especially true for the provisioning and cultural services (Figure 4). The provisioning services in Schlei and Warnow are restricted to animal output, namely fisheries, and materials for processing, e.g., the use of eelgrass and reed, mainly for roofs. While the use of reed steadily declined during the last century in both systems, fishing shows a different development. In the Schlei, Nellen (1967) observed 16 limnic species and 7 marine species occupying habitats according to the salinity gradients. Commercially important fish species are Herring, Roach, Plaice, Cod, Flounder, Perch, European eel, and Sea trout. Using fishing techniques such as wires, eel-wires, gillnets for herring and flounder as well as seine fishing, the total landings were 236 t annually (2013–2015) compared to 109 t in the early 1960s (Nellen, 1963). Fisheries in the 1880s were much more intensive and important, and more fish species, even smaller and bony ones were used. While eutrophication caused an increase in fish landings during the last decades, the industrialization of the Warnow caused a steady decline. In 1880, several other provisioning services were reported for the Warnow, like the use of water for irrigation, the use of seaweed and reed in agriculture and small scale fish and mussel cultivation. Very likely, in 1880, similar uses existed in both systems, but were not documented for the Schlei. A recent new human activity in the Warnow are wind turbines for energy production and plans exist for the Schlei coast, as well. The use of animals or plants from coastal waters does not have a tradition in Germany or, at least, this tradition has been lost already a century ago. As consequence, provisioning services are of minor importance.
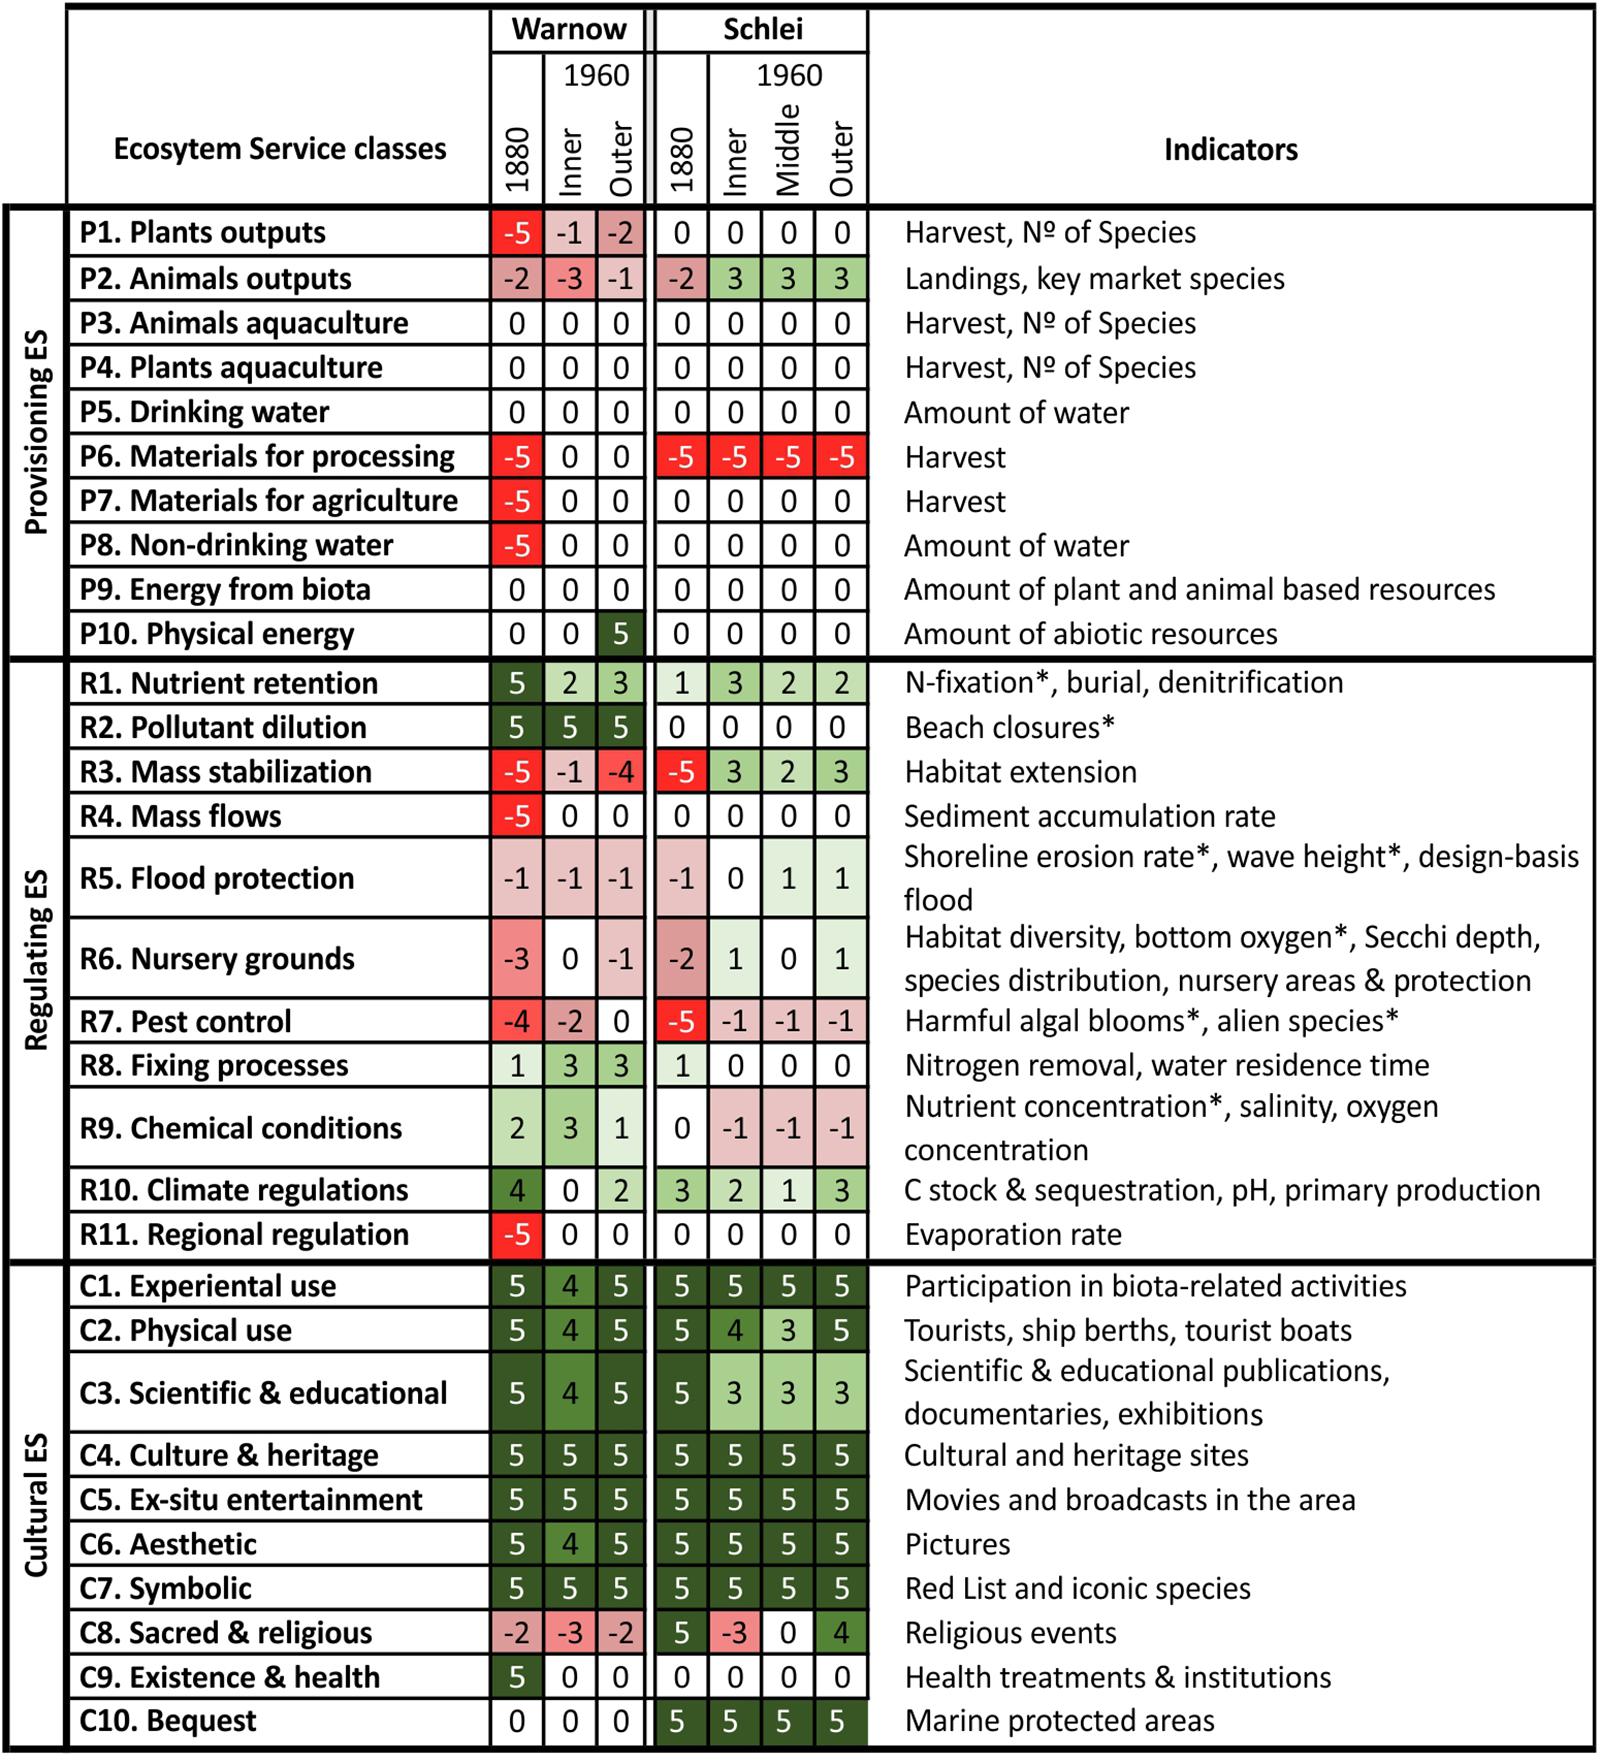
Figure 4. Ecosystem service (ES) classes and underlying indicators based on CICES (Haines-Young and Potschin, 2013, 2018) and MAES (Maes et al., 2016) and the assessment for Schlei and Warnow estuaries (Northern Germany). The assessments compare the ES provision between 1880 (high ecological status according to the WFD) and today for the entire estuary, as well as between 1960 (good ecological status according to the WFD) and today separated into the WFD water bodies. Positive scores indicate an increase in ES provision today (Figure 3). The asterisk (∗) points out indicators where a decrease in the value was interpreted in the sense of an increase in ES provision.
Similar in both systems is the strong increase in cultural services as result of steadily increasing tourism (Figure 4). Around the Schlei, nature-oriented tourism dominates, while in Rostock bathing and culture tourisms play an important role. Examples are the Hanse Sail and the Warnemünde Week, major sailing festivals in the Baltic region. However, the underlying indicators show serious weaknesses for our approach. The service aesthetic and entertainment both show a strong increase. The indicators “number of movies and broadcasts in the area” as well as “number of pictures” are also indicators for the technological development. For example, in the 1960s, only three public broadcast services (ARD, ZDF and regional programs “das Dritte”) existed. The situation is similar with respect to number of pictures taken. In the 1960s, taking a photo was limited because only a few persons owned a camera. Further, most historic photos are not publicly accessible, while today, the popularity of a place can easily be assessed by its tags on e.g., Flickr.com. For the initial status postcards were considered, but this is problematic, because postcards at that time focused on technical and cultural developments rather than documenting the natural aesthetics of an area. The sense of aesthetics is based on individual subjective judgment and changed during the last century (Brook, 2013). In general, the score for cultural services and changes in time very much depend on whether the potential or the real demand is assessed.
Historic Development: The Schlei Estuary
Indicators related to the biological elements of the WFD, are mainly reflected within the regulating services. This is why they require special attention. Several regulating services are of high importance and show changes in time and between inner, middle and outer water bodies. The nutrient retention (R1) indicated by nitrogen fixation, burial, and denitrification mostly shows increases. With increasing eutrophication, the burial of nutrient and denitrification increased. These indicators reflect important ecosystem processes. It is questionable if increasing N-Fixation should be counted similarly, because different to the other processes, it adds nitrogen to the system. Therefore, we inverted the score for N-fixation. However, this process is negligible in the Schlei and did not change significantly in time.
Mass stabilization (R3) indicated by extent of emerged, submerged, and intertidal habitats shows a steep decrease between 1880 and today but an increase after 1960. Reason is that many habitats were lost by intensified human use of the Schlei until 1960. Afterward nature protection helped to increase the areas again. Flood protection (R5) covers shoreline erosion rate, maximum depth, needed for maximum wave height calculation, and the flood protection design basis. The Schlei is protected by regional dykes with slightly different heights, because a universal flood protection design basis does not exist. However, the height of dykes during the last decades steadily increased to deal with sea-level rise risks explaining the increase in ES provision.
Nursery grounds (R6) indicated by submerged and intertidal habitats diversity, occurrences of low oxygen concentrations (<6 mg/l), water transparency (Secchi depth), species distribution, nursery areas and total versus protected nursery areas. The changes in time and between the water bodies are limited, but this is a result of contradicting developments and indicator values. Between the 1960s and today Secchi depth declined, but nursery areas and their protection increased. Changes in chemical conditions are mainly a result of increasing eutrophication. As consequence, the phytoplankton primary production increased. This causes a higher score for climate regulations (R10) today compared to the past.
Lessons learnt from the Schlei assessment are that number, relevance and importance of indicators underlying an ES class differ very much. In some cases, indicator scores are opposing, and after averaging on ES class level, the contradictions result in no changes over time or between water bodies. As consequence, the reality is sometimes hidden. For some indicators, like beach closures, an assessment between two time periods is problematic since the legal framework (European Union Bathing Water Directive [EU-BWD], 2006) and monitoring systems are recent (or have changed in time) and do not allow a historic assessment. Further, it is questionable if all ES classes are of similar and comparable importance.
Important questions were, whether an assessment on water body level makes sense and to what extent information from one water body can be transferred to another one, to save time and resources. Figure 5 shows an averaged result for the entire Schlei compared to the assessment on water body level. It is obvious that the values between water bodies differ significantly, especially for several regulating services. The spatial separation into water bodies reduces the loss of information and provides a more comprehensive picture of a system. Consequently, we tried to apply MESAT on an even smaller spatial scale, the habitat level. We did choose a well defined submerged macrophyte area (Große Breite) and considered only 22 relevant indicators. However, for 10 indicators we did not find any data and the results provided only an incomplete picture. A higher spatial resolution strongly depends on a higher resolution of information and our approach seems not suitable on a habitat level.
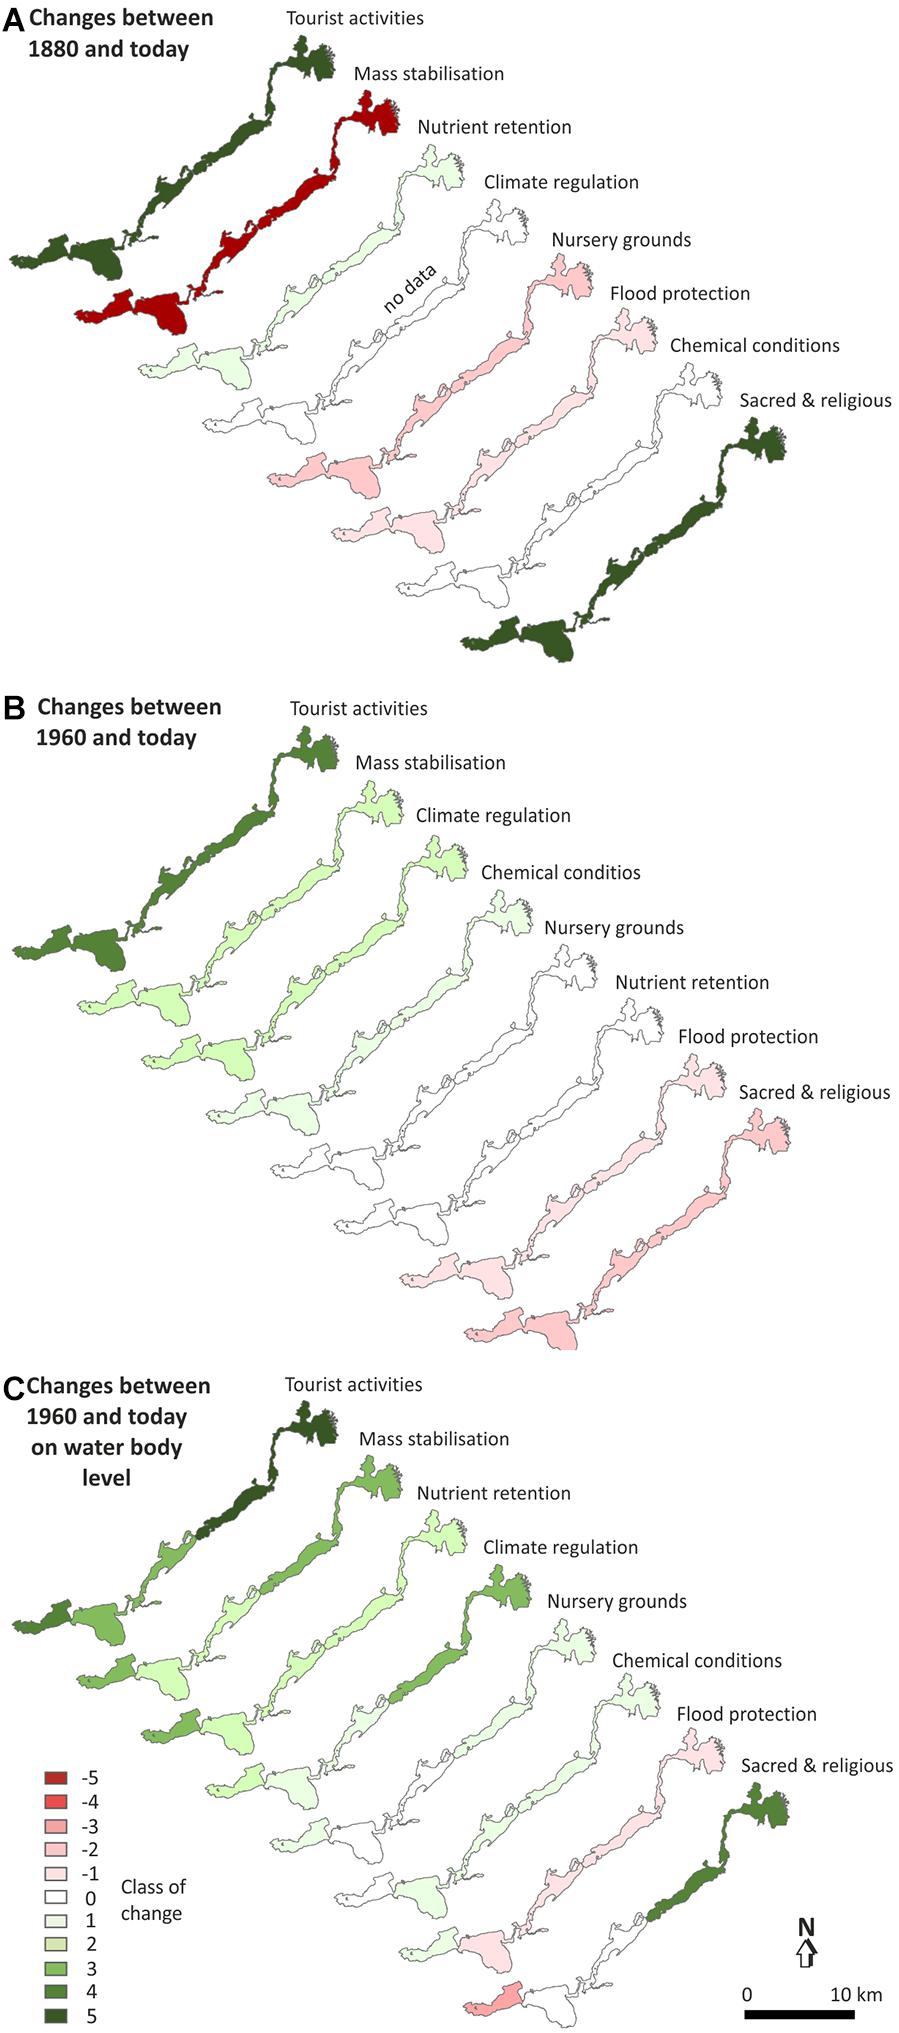
Figure 5. Selected comparative ecosystem service assessments in the Schlei Estuary: (A) changes between 1880 (high ecological status of the WFD) and today, averaged over the estuary, (B) averaged changes between 1960 and today, averaged over the estuary, and (C) changes between 1960 and today on water body level.
Since water bodies are a subdivision of WFD coastal water types and share many properties, a lack of data in a water body largely could be compensated with data from another neighboring water body. Therefore, the spatial transfer of basic data and information is possible and reasonable, however, in detail water bodies within on type differ significantly.
The comparative assessment of two time periods, the 1880s compared to today and the early 1960s compared to today reveals significant differences and developments between the periods. The 1880s were supposed to reflect the reference state (high ecological state) and the early 1960s the good ecological status of the Schlei according the WFD. Especially the changes between the early 1960s and today give an indication on how the ES provision of an ecosystem could look like in future after the full and successful implementation of the WFD.
With respect to the Schlei, it is questionable whether in the early 1960s a good ecological status still existed. Already in the 1950s, the use of fertilizers in agriculture increased by almost 50%, from about 37 kg P (P2O5) kg ha-1 up to 60 kg P (P2O5) kg ha-1 (Ohle, 1965). Until 1956, the sewage water of approximately 35,000–40,000 inhabitants entered the Schlei without any treatment. Therefore, high total phosphor concentrations in rivers above >0.5 mg L-1 were observed (Nellen, 1967). Strong algal blooms in the Schlei were observed already in the 1960s (Nellen, 1967) and the loss of submerged macrophytes started already in the late 1930s (Hoffmann, 1937).
Shallow systems with a long coastline, a relatively large drainage basin and limited water exchange are sensitive to eutrophication. In northern Germany, several systems have to be considered as naturally eutrophic. As consequence, the “good status” according to the WFD is a eutrophic status. This is the case for the Schlei, as well. This limits the possibility for an improved human use of the Schlei, but does not violate our concept.
The quality of an ES assessment depends on availability and quality of data and information. To link the ES assessment to the WFD allows the usage of data that is collected in all EU countries within the WFD monitoring (e.g., Secchi depth, pH, salinity, oxygen, nutrients). Much recent and historic data has been prepared for the first steps in implementing the WFD, for example the development of a typology or the definition of reference conditions. This improves the conditions for an ES assessment. Further, several countries used ecological models for defining historic states and this spatial information on water body level is available, as well. Despite that, data availability and reliability is still a problem for several indicators and this problem increases when addressing the 1960s and especially the 1880s. Usually 35–50% of the information used in our assessment is based on assumptions or expert knowledge (Figure 6). It is considered to be of low reliability and this limits the reliability of our assessment results in general. Further, for 9 out of 31 ES classes no data could be found. The availability and quality of data for 1880 is even much worse and does not allow a separate assessment of single water bodies.
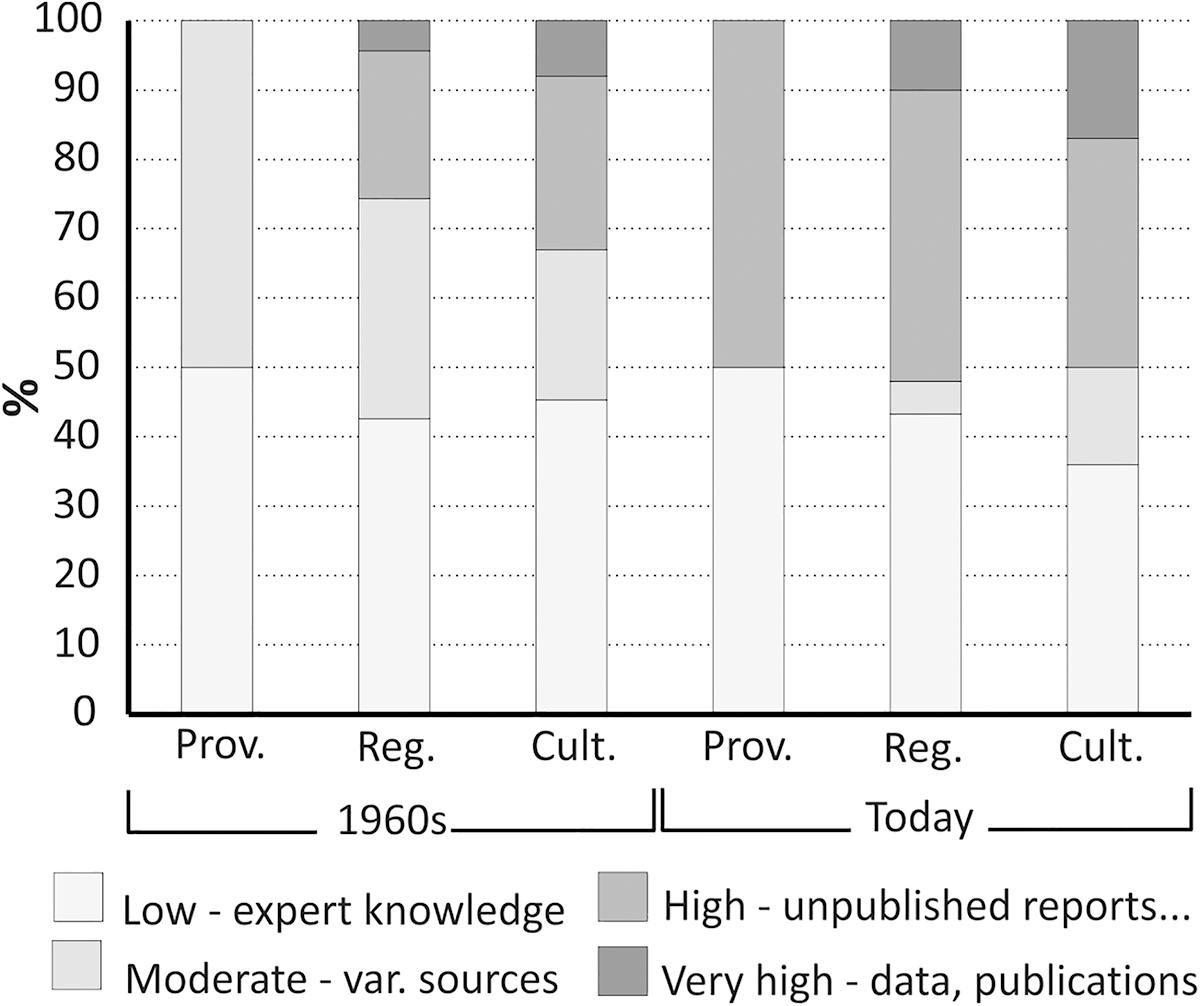
Figure 6. Type and quality of information sources used in the ES assessment in the Schlei Estuary. The assessment includes the indicators of 22 ES classes. For indicators of 9 ES classes no data could be found.
Historic Development: The Warnow Estuary
Already for centuries, the industrialized and urban Warnow Estuary was intensively used and modified by humans. As consequence, comprehensive monitoring datasets, detailed statistics, a large amount of planning documents and experts with specific knowledge exist. The availability and quality of data as basis for an ES assessment is much better compared to a natural system, like the Schlei Estuary. This is true for historic data, as well. Compared to the Schlei Estuary, much information about the state and situation around 1880–1900 is available. It means that from an information availability perspective, industrialized and urban systems are most suitable for an ES assessment. Despite that, serious information gaps for this historic period exist. Even in these systems, historic ES assessments and comparisons are based on a weak information basis and can hardly be regarded as reliable.
While natural systems are hardly affected by political and economic changes, this is different in urban and industrialized systems. After the Second World War until 1990, the Warnow Estuary belonged to the socialistic German Democratic Republic (GDR). During that time, a very specific development took place. Rostock was the only international harbor of the GDR and the most important location for shipbuilding industries. As consequence of the industrialisation, the population increased from about 70,000 after the Second World War to above 250,000 in 1990. During that time, the estuary was heavily modified. For example, the shipping channels were deepened and the coastline became largely artificial. As consequence, pollution increased and water quality declined.
One question is whether the political changes and associated developments are visible in our ES assessment? Some regulating ES classes, like mass stabilization, nursery grounds, fixing processes and chemical conditions, or the provisioning ES classes plant and animal outputs reflect these changes (Figure 4). The cultural ES classes show strong changes but do not reflect the specific situation in the Warnow Estuary. We can summarize that changes are visible in several ES classes. However, in general, these changes are not well visible and not reliable. The results of an ES assessment can hardly be used to visualize political and economic changes and their consequences on the ecosystem.
ES classes are based on one to several indicators. The indicators not only differ with respect to their quality as descriptor of an ES class, but also with respect to the data reliability. A question is, whether changes are possibly hidden by poor data quality. Another question is, whether inverse changes of indicators, describing one ES class, may cause no or only weak changes of ES classes and hide changes. A possible solution to these potential problems could be a weighting of indicators and/or ES classes, taking into account data quality. Figure 7 shows the scores for ES classes calculated using two methods: averaging and weighted averaging of indicators. The weighted averaging takes into account data reliability, which was scored from very high (1) to low (4) by the experts during the evaluation process.
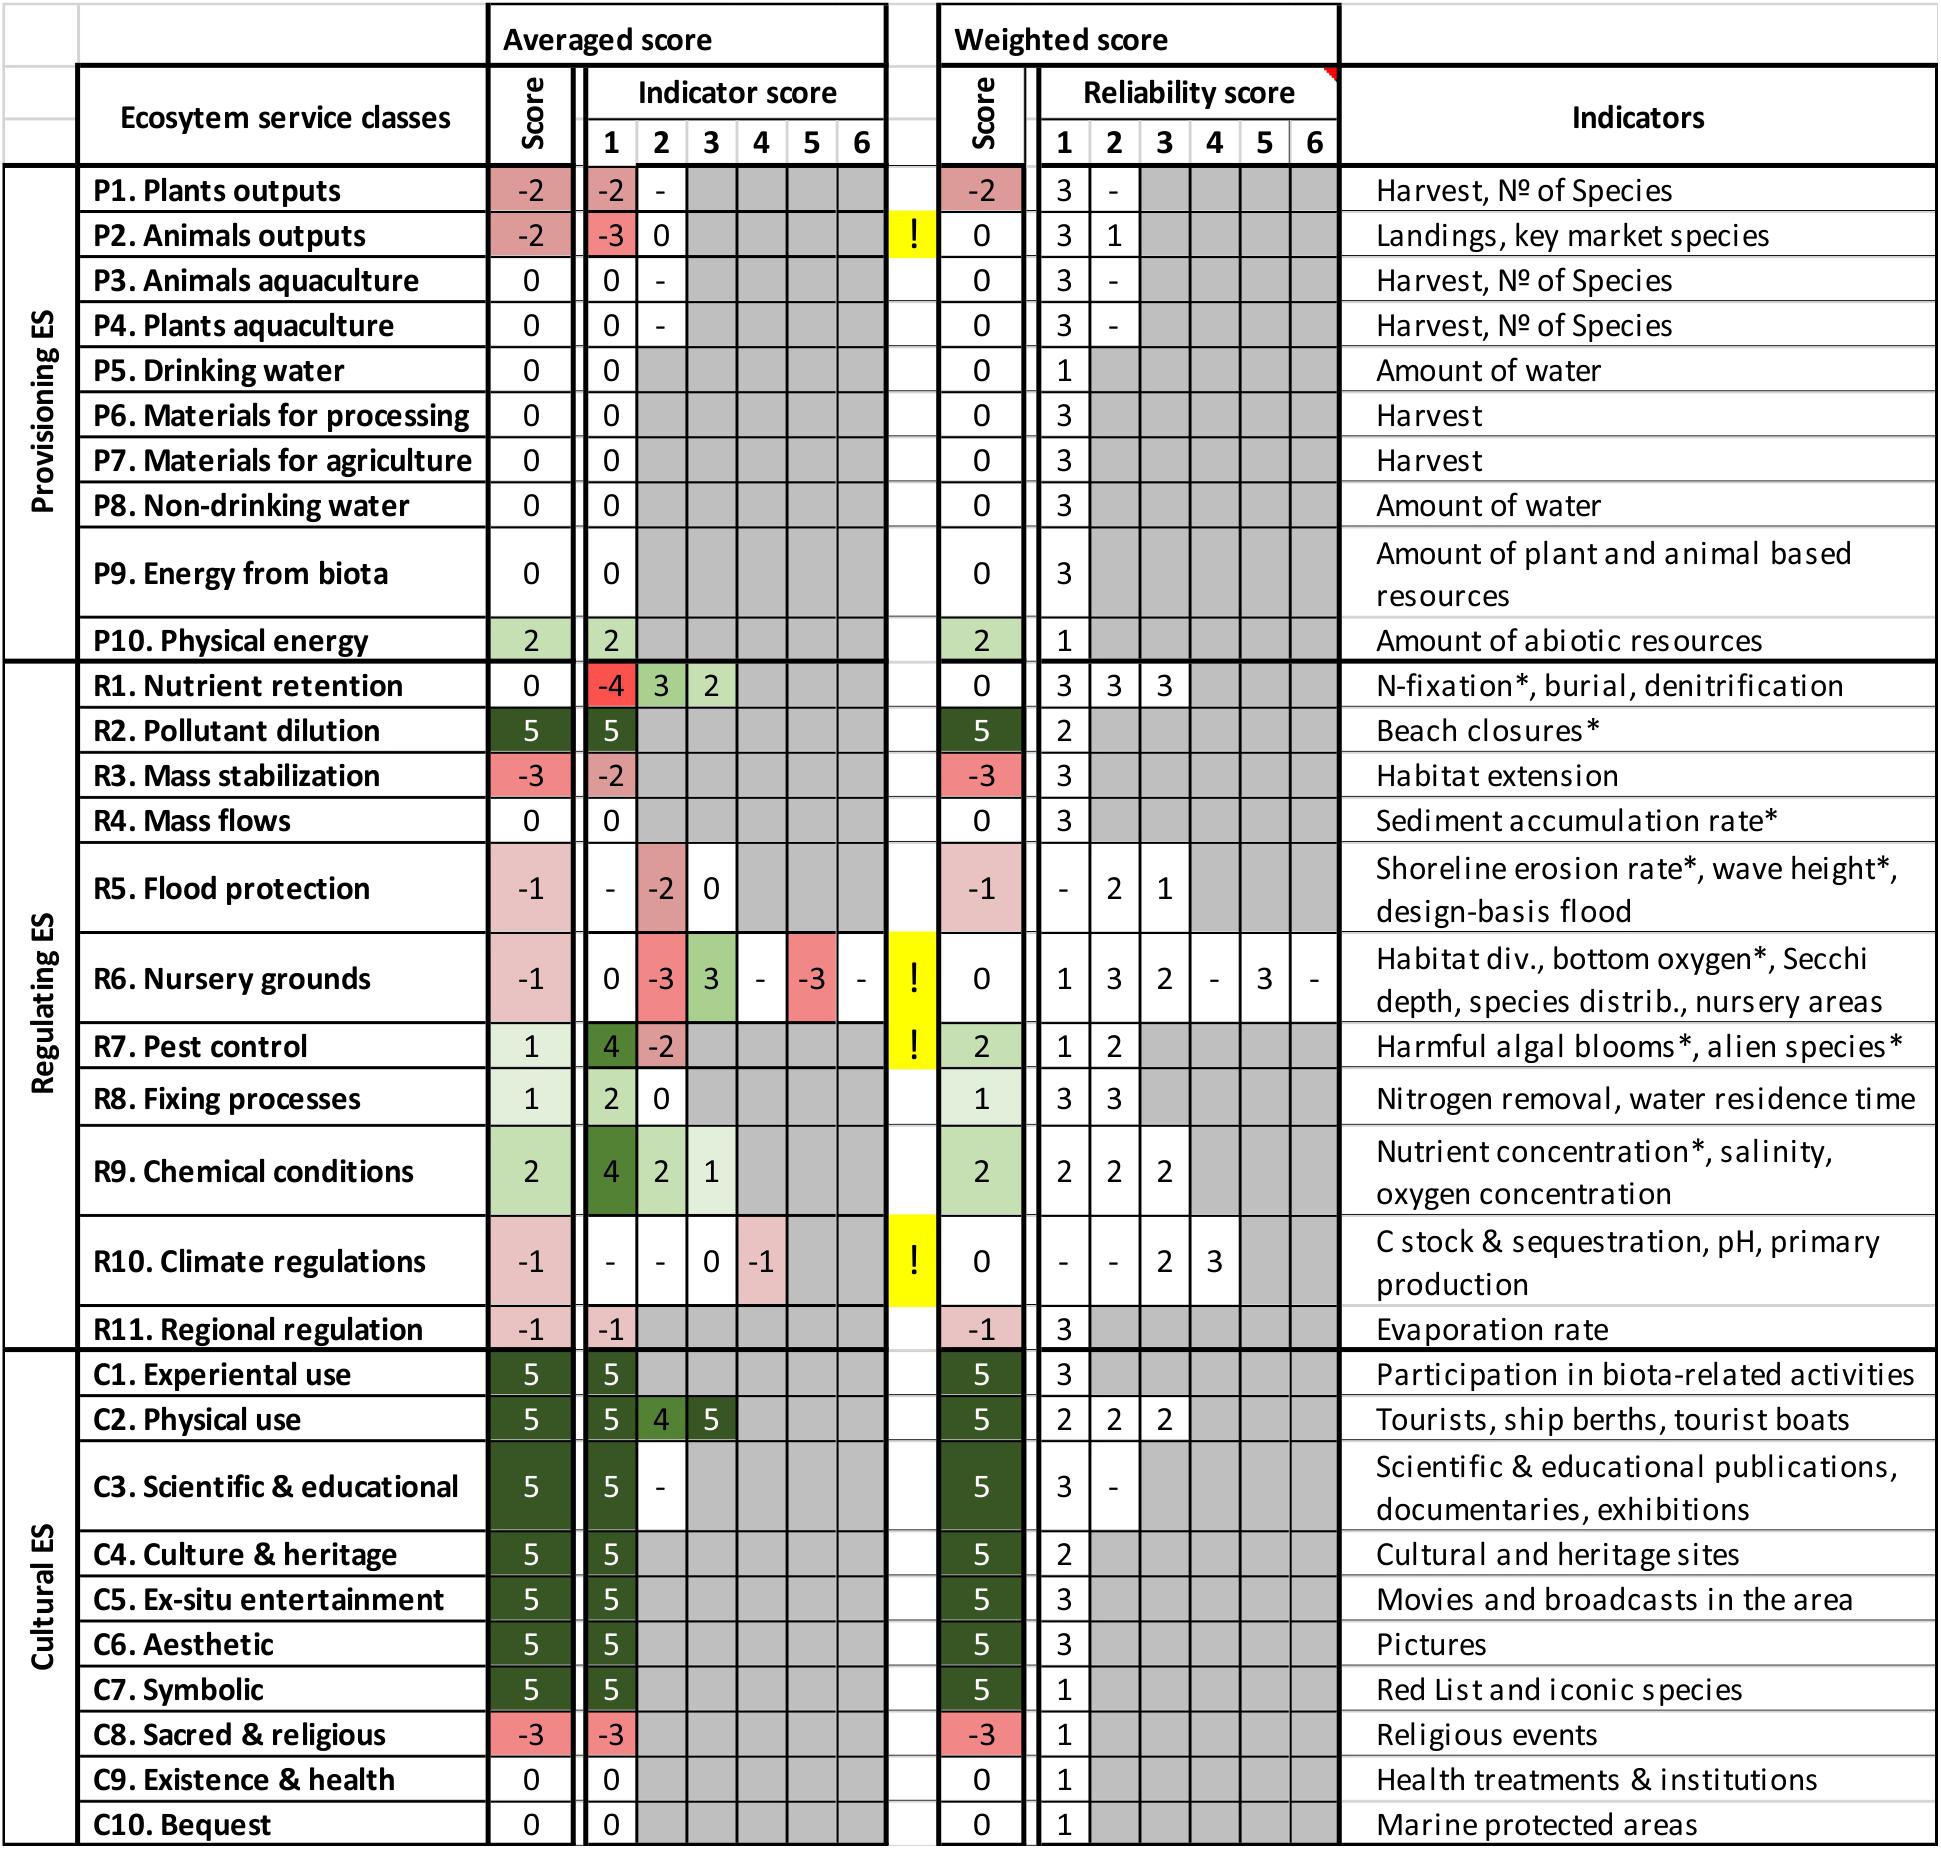
Figure 7. Data based ES assessment for the entire Warnow Estuary provision. Shown are changes between 1960 (WFD good ecological status) and today. The scores for ES classes are calculated with two methods: by averaging and weighted averaging. The latter takes into account data reliability. Reliability scores indicate very high (1, weighting factor 2) to low (4, weighting factor 0.5) data quality. Positive ES class scores indicate an increase in ES provision today (Figure 3). The asterisk (∗) points out indicators where a decrease in the value was interpreted in the sense of an increase in ES provision. The exclamation mark indicates ES classes where differences in scores exist.
Only four ES classes show differences in scores, indicated by exclamation marks, between both methods: animal outputs, nursery grounds, pest control and climate regulation. Only with respect to ES class animal outputs the difference is above one unit and has significant impact on the result. Altogether, the advantage of taking data reliability into account has only negligible effects on the overall assessment and therefore is not beneficial in this study.
The ES classes in Figure 7 show a CICES 5.1 sub-set with relevance for coastal waters. In a system like the Warnow Estuary additional ES classes like navigation, transportation, provision of cooling water, mediation of smell/noise/visual impacts make sense and would allow a more specific assessment. This has been taken into account in the assessment of the future scenario.
Assessing a Future State in the Warnow Estuary
Instead of carrying out an ES assessment for describing and visualizing historic changes, it can be applied to assess possible future states of a system using a tailor-made, expert based system. Usually industrial and urban estuaries, like the Warnow Estuary, are defined as heavily modified water bodies. According to the WFD, this allows defining less strict ecological quality objectives. In the Warnow Estuary, for example, only a moderate ecological state needs to be achieved. However, nearly two decades after WFD adoption its objectives usually have not been reached. This is true for the Warnow Estuary, but also for most coastal waters in Germany and all over Europe (Hering et al., 2010; Bouleau and Pont, 2015). As said before, one reason is that restoration and recovery is complex and takes time (Borja et al., 2010) and in some cases weaknesses in the approach and understanding of the system may be a reason (Voulvoulis et al., 2017). Possibly the most important reason for not reaching the good ecological status according the WFD is the lack of political will. Resistance of stakeholder groups against measures, high costs, or other policy priorities may serve as explanations for that. It seems that a healthy environment is perceived as not important enough or that the public is not aware of the benefits of a good ecological status. Consequently, incentives are needed to support the implementation of the WFD.
The question is whether an ES assessment can provide these incentives by visualizing the human benefits of a healthy coastal water. For this purpose, we developed a future scenario for the year 2040 for the Warnow Estuary and asked altogether 19 experts to compare it to the present state (Figure 8). This approach implements lessons learnt from the historic ES assessment. For example, the set of ES classes are tailor-made for this purpose and the focus is on extraction of knowledge and perceptions of a group of experts instead of using a weak database. On average, the assessors assume no significant overall changes in the ES provision for the northern, industrial, but an increase for the southern, urban water body.
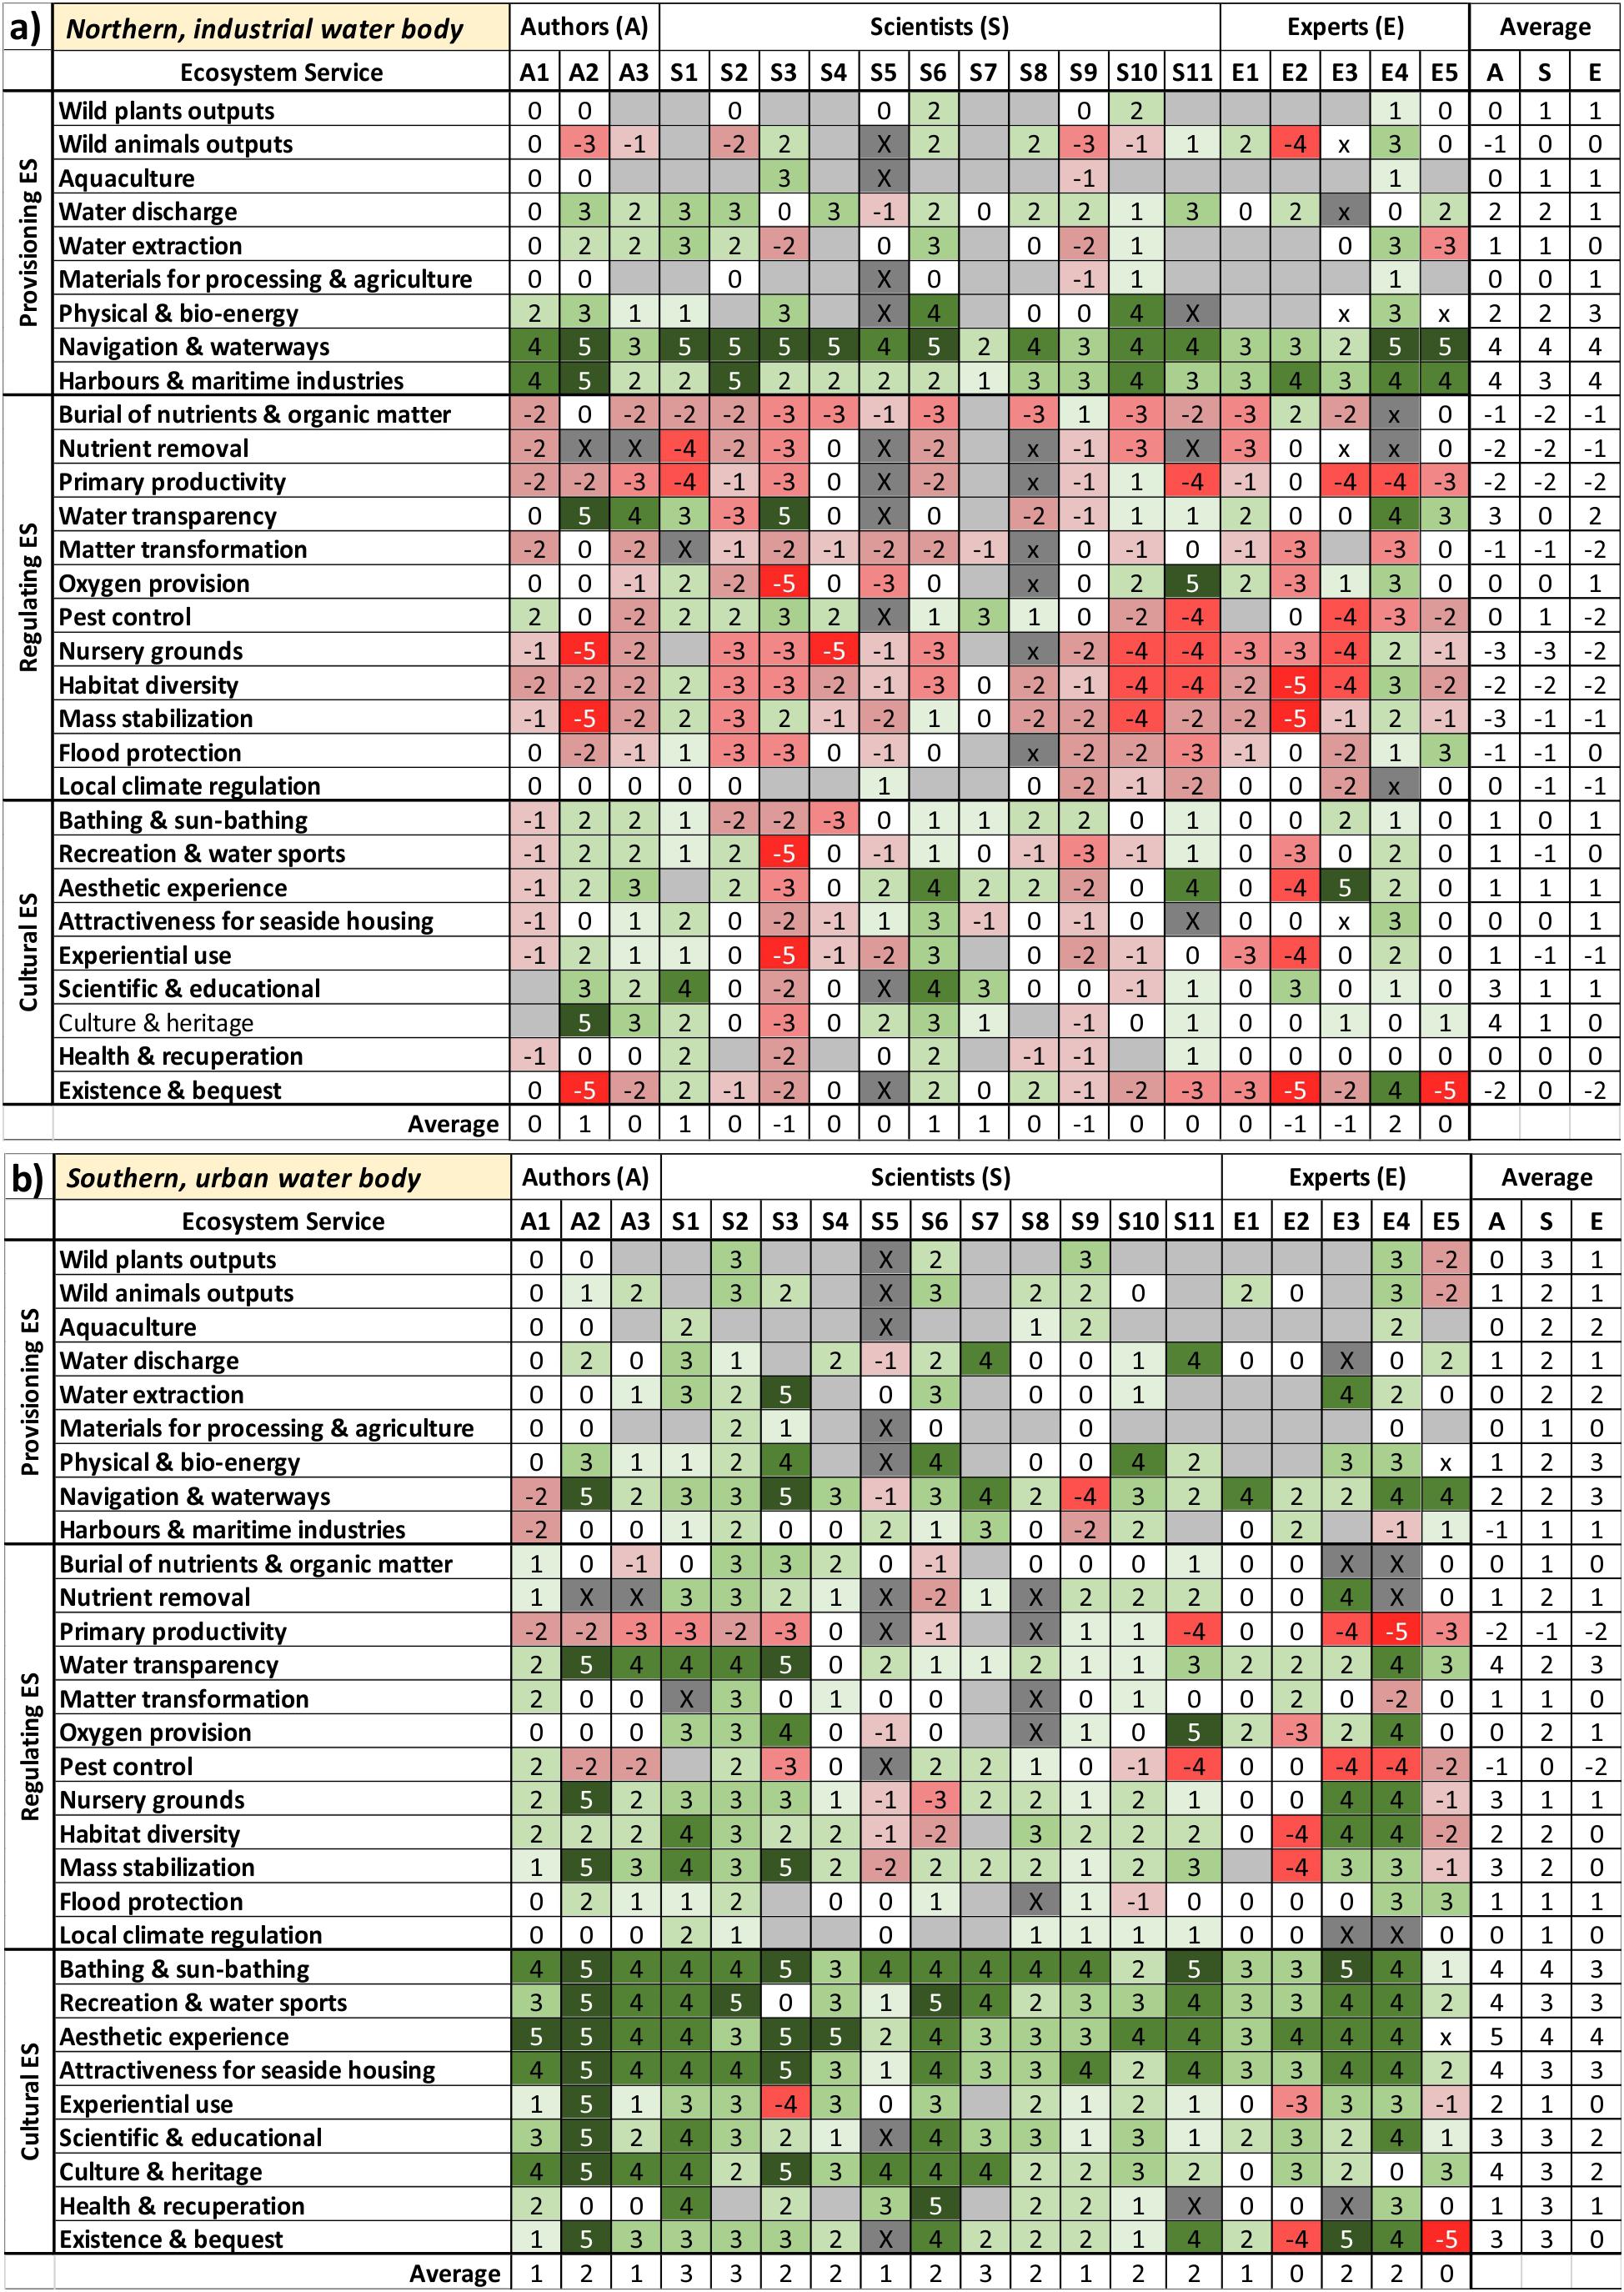
Figure 8. Ecosystem service (ES) classes used in expert-based assessment for the Warnow Estuary. The authors, 11 scientists and 5 experts (persons working at water authorities on the WFD implementation) scored the changes between today and the future scenario “Warnow 2040.” The assessment is separated into two water bodies, the northern industrial (see a) and the southern, urban (see b) part of the estuary. Positive scores indicate that an increase in ES provision in future was assumed (Figure 3). Gray cells indicate that the expert assumed the ES as not relevant. Gray cells with x indicate a lacking answer.
The Warnow and Schlei Estuaries show that the importance of provisioning services is relatively low (Figure 4). By adding the ES classes “space for navigation and waterways” as well as “space for harbors and marine industries,” the importance of provisioning ES increased and more completely reflected the situation in the Warnow Estuary. Further, it better reflects the changes that would result from the scenario “Warnow 2040” implementation (Figure 8). On average, the experts expected that the scenario would increase the provisioning ES in the northern and in the southern water body. Moreover, they expected a decrease of regulating ES in the northern water body and an increase in the south.
Even a strong increase in the provision of provisioning services because of a good ecological status alone would hardly give a convincing justification for improving environmental quality and the required investments. Cultural services and changes in their provision have a most direct impact and relevance to a broad public, especially in urban systems. The ES assessments of cultural services show a slight increase in the industrial, northern and a strong increase in the urban, southern water body (Figure 8). Especially for the urban, southern water body this increase, together with the overall increase in ES provision, can be regarded as a relevant incentive to improve the ecological quality and could support the WFD implementation.
A systematic difference in the perception of changes that would result from an implementation of the scenario “Warnow 2040” between the separately assessed groups of authors, scientists (working at scientific institutions) and experts (working at authorities) is not visible. However, the perception between individual persons differs strongly, even within the three groups. For example, while persons E2 and E5 do not expect an overall increase of ES for the urban water body, persons S1, S2, and S7 expect a strong increase. Some scientists seem to be more positive about the scenario, while some persons working at authorities seem more skeptical.
With respect to single ES classes there are many strong differences and contradicting scores among the assessors. For example, with respect to changes in cultural service provision in the urban water body, namely experiential use and existence and bequest, the majority of persons expects increases, but single persons perceive the change differently and expect strong decreases. These differences point out ES where different perceptions, world-views, understandings or knowledge exist.
On average, the knowledge between the group of scientists and the authority experts did not differ. Based on a self-assessment and with respect to geographical knowledge it was considered good to very good and about the ecological status of the Warnow Estuary medium to good. The authority experts indicated a good to very good knowledge about the WFD and its implementation while the scientists indicated only a medium to good knowledge. Some experts stated only little or moderate knowledge about one of the topics. Either, they only moved recently to the area, or were not professionally dealing with the ecological status of the Warnow Estuary. The group of scientists (including the authors) showed strong differences when asked about their knowledge about the WFD, ranging from little to excellent. However, comparing experts with excellent knowledge (A1, A2, and S3) with the one that indicated little/moderate knowledge (S4, S5, S6, S10), does not show systematic difference in the assessment results (Figure 8). In general, differences in knowledge seem to have no important influence on the result, but it seems that experts with less knowledge are more cautious and hardly ever give very high or very low scores.
The feedback discussions with the involved experts addressed benefits and weaknesses of the approach. The experts saw the need to further improve the definition of several indicators and suggested a narrower scoring system between -3 and 3. They were concerned that the indicators only partly reflect the biological elements of the WFD, about the subjectivity of the individual scoring, limitations of the provided background information or simplifications in the scenario. Further that the scenario goes much beyond the focus of the WFD and the subjective influence resulting from visualization and presentation of the scenario. Especially in the Warnow Estuary, experts were concerned that the potential for improvements in the ecological status is limited and spatially restricted to smaller areas or that improvements resulting from the WFD water quality improvements require measures in the river basin. It means that costs, possible disadvantages and benefits are separated spatially. One expert saw the risk that in other cases a good ecological status may not increase the overall ES provision. Another concern was the possible conflict between harbor development and water quality improvement.
The vast majority of experts saw the potential benefits of an application within the WFD in the possibility to better involve stakeholders in planning of measures and in transferring aims and benefits of the WFD and its implementation to a broader public, and thus increase its acceptance.
Discussion
Previous studies show that an absolute assessment of ES is problematic. This is especially true for monetary assessments, for example ES classes addressing coastal aesthetics. Different approaches for valuation need to be used for different ES and make results difficult to compare. As consequence, Newton et al. (2018) recommended non-monetary evaluation methods and their standardization to ensure that results can be compared. Our ES assessment methodology meets this demand. It does not assess the absolute value of ES, but focusses on classified relative changes between two assessed time periods or alternative situations. This can be done data-based by one assessor or based on experience and knowledge of a group of experts. This approach allows a direct comparison of ES classes with different units, is spatially expandable and transferable, and enables a relatively fast assessment.
Our approach to utilize major elements of the WFD for an ES assessment turned out to be beneficial, because we used a politically and societally accepted normative system as framework, were able to adapt a generally accepted spatial seascape subdivision and were able to utilize large amounts of data that were raised and compiled for the WFD implementation. Another advantage was that it enabled us to involve a defined group of experienced and interested experts in the ES assessment. Therefore, the practical benefit of the WFD approach for an ES assessment in coastal waters goes beyond the conceptual links and synergies compiled by Hartje and Klaphake (2006) or COWI (2014).
An advantage of the data-based comparative assessment between two periods in time is a reduced subjectivity. However, the data basis for the reference (high ecological) state according to the WFD (years around 1880) or the good ecological state (around 1960) is partly weak. Comparisons to the present state are hardly reliable in detail. Comparative historic assessments show general trends and give an idea, how intensified human uses and eutrophication have changed the provision of a broad spectrum of ES in water bodies. Further, these comparisons give an insight in potential benefits (usually increased ES provisions) that may be provided when coastal waters are in a good ecological state again, as result of a full WFD implementation.
The two assessed coastal water systems, the rural Schlei and the urban/industrialized Warnow Estuary can, with respect to structure, problems and challenges for WFD implementation be regarded as representative for a large spectrum of coastal water systems, at least at the southern Baltic Sea. Therefore, major aspects of the approach can be transferred to and applied in other coastal waters. In case of urbanized/industrial estuaries, for example, to Kiel, Lübeck, Flensburg, or Szczecin.
Hering et al. (2010) complained that the WFD monitoring focusses on biological structures, not on functions or ES. Further, that it is not well understood how stressors and biological structure affect ES provision. Both aspects remain problems. Neither the existing monitoring data nor indicators and ES classes according to CICES 5.1 (Haines-Young and Potschin, 2018) are optimal for representing overall state and changes in ES provision. This is especially true for urban/industrial water bodies. In these systems, tailor-made sets of indicators and ES classes, representing the specific features and uses, are recommendable. Further, they have to be tailor-made for the purpose of the assessment, for example the scenarios that shall be compared.
Another aspect is that commonly used ES classes and indicators, like CICES 5.1 (Haines-Young and Potschin, 2018) were mainly developed for and applied to terrestrial and natural systems. They are not optimal for urbanized/industrial systems and coastal waters. In a system like the Warnow Estuary, additional ES classes like navigation, transportation, provision of cooling water, mediation of smell/noise/visual impacts make sense and could allow a more specific assessment. Further, non-optimal ES classes may cause an under-valuation of coastal water systems compared to terrestrial systems. Additionally or alternatively, a weighting of the scores on ES class level according to their relevance for the objective of an assessment could make sense. It would allow to tailor-made the assessment to specific systems and purposes. The choice of additional ES classes, modifications of ES classes or a weighting would have to be done by experts. This would add subjectivity to the results and reduce the possibility of inter-comparisons between systems, but this may make sense for applications within the WFD.
According to European Commission [EC] (2003b) water bodies are coherent units to which the environmental objectives of the directive must apply. They shall enable an accurate description of the status compared to environmental objectives. Against this background, two separate water bodies that subdivide the Warnow Estuary are not necessary. Water retention time may serve as suitable indicator to separate water bodies and assessment units. However, for future scenario assessments, where the good ecological status becomes part of a comprehensive development scenario, sub-divisions are reasonable. In case of the Warnow Estuary, the sub-division of water bodies is necessary because both show a very different utilization and likely, a very different future development. This sub-division is in agreement with the view in the official WFD implementation guideline. European Commission [EC] (2003f) recommends that planning of water management should keep links with other planning processes and that both should support each other. This means that if a sub-division of water bodies into smaller units would be beneficial for planning, it could be done.
The spatial size of a system has strong effects on its accessibility, on the visible details and the overall result. Size-limitations result from availability and spatial resolution of data. What we learnt from our study is that historic assessments need larger spatial units. They should be carried out on estuary level, because of data availability. For expert based assessments, smaller spatial units are preferable, like water bodies that sub-divide an estuary. Smaller, more homogeneous spatial units are more tangible and concrete for the involved external experts and allow a more reliable scoring. Further, smaller spatial units allow more concrete definitions and visualizations of future scenarios.
Relatively low values for provisional ES are not specific for German waters or only observed in industrialized coastal water systems, but are common for most coastal waters world-wide (Jacobs et al., 2015; Newton et al., 2018). Therefore, the monetary value of provisioning services or strong negative changes in provisioning services alone hardly provide a convincing public justification for costly measures aiming at achieving a good ecological status in coastal waters. In coastal water systems, regulating and cultural services are much more important (Jacobs et al., 2015; Newton et al., 2018) and provide a better justification for the implementation of WFD measures.
ES assessments do not provide crisp and reliable data and results. They rather indicate ongoing changes and allow visualizing changes and possible benefits for humans, resulting from an improved ecological status. Especially cultural services have a direct relevance for the local population and changes are directly perceivable. As indicated by our involved experts, ES assessments may play a role in WFD public relations and information.
The WFD integrates economics into water management and water policy decision-making (European Commission [EC], 2003b). To achieve the environmental objectives, the WFD calls for the application of economic principles, approaches, tools and instruments. Economic analyses shall help understanding the economic issues and trade-offs of restoring water quality. For example, water bodies with less stringent environmental objectives can be defined, to account for economic and social impacts (European Commission [EC], 2003b). An ES assessment broadens the view on environmental quality. It adds a human dimension and establishes links to economic aspects. It can be regarded as a complementing “economic” tool in this respect and supports the demanded “search for overall sustainability” (European Commission [EC], 2003b). Especially a more comprehensive view on environmental quality, threats and dependencies became among the involved experts was one benefit. This underlines observations from river basin case studies (e.g., Grizzetti et al., 2016; Giakoumis and Voulvoulis, 2018) and supports assumptions by COWI (2014).
The WFD, Article 14, specifies that European Union member states shall encourage the active involvement of all interested parties in the implementation of the WFD (European Commission [EC], 2003e). Public participation includes information supply, consultation, and active involvement. Active involvement implies that “stakeholders are invited to contribute actively to the planning process by discussing issues and contributing to their solution” (European Commission [EC], 2003e). Most of our involved experts perceived an ES assessment as a suitable approach to involve stakeholders in a guided, coordinated process. Our ES scenario assessment shows that it can serve as a tool to catch the views of experts, can extract disagreements between expert opinions and allows settling misunderstandings in subsequent discussions. Similar to our Warnow 2040 scenario, our assessment approach could be applied to concrete WFD measure plans. ES assessments can help structuring and preparing follow-up participatory meetings and may support and accompany the measure implementation. Similar observations are reported for river basins (e.g., Blancher et al., 2011; Grizzetti et al., 2016; Giakoumis and Voulvoulis, 2018).
Planning within the WFD usually includes current and foreseen scenario assessments, target setting as well as development and implementation of alternative programmes of measures (European Commission [EC], 2003f). Important aspects in this process are, to facilitate the interaction and discussion among managers and stakeholders by providing tools for conflict resolution, knowledge and information management as well as capacity building. Knowledge and information are regarded as the foundation for effective management (European Commission [EC], 2003f). An ES assessment facilitates the interaction between actors, initiates a social learning process as well as supports gathering knowledge and competence beyond the own field of expertise. It can serve as a supporting tool in planning and decision-making (Schernewski et al., 2018).
Conclusion
Our ES assessment approaches turned out to be suitable for the historic and future scenario applications. It utilizes major elements of the WFD for the ES assessment, like the spatial seascape subdivision, allows for a direct comparison of ES classes with different units, is spatially expandable and transferable and enables a relatively fast assessment. The two assessed coastal water systems, the rural Schlei and the urban/industrialized Warnow Estuary share many similarities with other southern Baltic Sea estuaries (historic development, morphogenesis, hydrological conditions) and to a certain degree, the results can be regarded as representative for other Baltic coastal water systems.
In the European WFD implementation, ES assessments can serve as a complementary approach to support the economic analysis of measure programs as well as planning and implementation processes. However, an ES assessment not only supports the WFD implementation, but the WFD provides a frame for larger scale ES assessments in seascapes, increases the acceptance of the ES approach and the readiness of stakeholders to get involved.
Data-based comparative ES assessments of different time periods allow visualizing changes that happened in coastal waters during the last decades and consequences for human uses. They can also visualize potential benefits and costs resulting from urban development plans (Warnow 2040). Expert-based ES assessments allow for comparing sets of measures or scenarios and can serve as a tool in public participation and stakeholder involvement processes. Independently of the approach, ES assessment results hardly can be regarded as reliable information. Strengths are that they facilitate communication processes, broaden the view and the knowledge and support social learning processes. Our study in practice proves that the conceptual considerations by COWI (2014), which are mainly focussed on river basins, are true for coastal waters, as well. ES assessments can support the assessment and communication of the benefits of the directive, can encourage open communication of the impacts of the WFD implementation and can help to better understand changes caused by measures.
Ethics Statement
All experts involved in the assessment were informed about the intention to publish the assessment results and orally agreed to it. They had the possibility to review and comment the results.
Author Contributions
GS, the project leader, developed the manuscript concept, took care of the data analyses and did the manuscript writing. MI provided the assessment tool and graphical visualizations. PP carried out the ES assessment in the Schlei and ER in the Warnow. ER and JS prepared the scenario “Warnow 2040,” largely moderated the meetings with stakeholders and took minutes.
Funding
The work was financially supported by the projects SECOS (03F0666A), funded by the German Federal Ministry for Education and Research, and BONUS BaltCoast (03F0717A). BONUS BaltCoast has received funding from BONUS (Art 185) funded jointly from the European Union’s Seventh Programme for research, technological development and demonstration, and from Baltic Sea National funding institutions. Additionally, this work in part was supported by the Doctorate Study program in Ecology and Environmental Sciences, Klaipėda University (for MI and JS).
Conflict of Interest Statement
The authors declare that the research was conducted in the absence of any commercial or financial relationships that could be construed as a potential conflict of interest.
Acknowledgments
We like to thank Amina Baccar Chaabane, Dr. Ricarda Börner, Dr. Clemens Engelke, Dr. Stefanie Felsing, Dr. René Friedland, Mirco Haseler, Rahel Hauk, Dr. Svenja Karstens, Xaver Lange, Simon Paysen, Lukas Ritzenhofen, Laura Schulz, Dr. Andreas Starmans, Miriam von Thenen and Mario von Weber for supporting the evaluation or providing data and information.
Supplementary Material
The Supplementary Material for this article can be found online at: https://www.frontiersin.org/articles/10.3389/fmars.2019.00183/full#supplementary-material
APPENDIX | Data sources and definition of data quality.
References
Angradi, T. R., Launspach, J. J., Bolgrien, D. W., Bellinger, B. J., Starry, M. A., Hoffman, J. C., et al. (2016). Mapping ecosystem service indicators in a Great Lakes estuarine Area of Concern. J. Great Lakes Res. 42, 717–727. doi: 10.1016/j.jglr.2016.03.01
Barbier, E. B., Hacker, S. D., Kennedy, C., Koch, E. W., Stier, A. C., and Silliman, B. R. (2011). The value of estuarine and coastal ecosystem services. Ecol. Monogr. 81, 169–193. doi: 10.1890/10-1510.1
Bastian, O., Grunewald, K., and Syrbe, R. U. (2012). Space and time aspects of ecosystem services, using the example of the EU water framework directive. Int. J. Biodivers. Sci. Ecosyst. Serv. Manag. 8, 5–16. doi: 10.1080/21513732.2011.631941
Blancher, P., Vignon, C., Catalon, E., Maresca, B., Dujin, A., Mordet, X., et al. (2011). Ecosystem services approach for water framework directive implementation. WIT Trans. Ecol. Environ. 148, 75–85. doi: 10.2495/RAV110081
Borja,Á, Dauer, D. M., Elliott, M., and Simenstad, C. A. (2010). Medium-and long-term recovery of estuarine and coastal ecosystems: patterns, rates and restoration effectiveness. Estuar. Coasts 33, 1249–1260. doi: 10.1007/s12237-010-9347-5
Bouleau, G., and Pont, D. (2015). Did you say reference conditions? ecological and socio-economic perspectives on the european water framework directive. Environ. Sci. Policy 47, 32–41. doi: 10.1016/j.envsci.2014.10.012
Brook, I. (2013). “Aesthetic appreciation of landscape,” in The Routledge Companion to Landscape Studies, eds P. Howard, I. Thompson, E. Waterton, and M. Atha (Abingdon: Routledge), 108–118.
COWI (2014). Support Policy Development for Integration of an Ecosystem Services Approach With WFD and FD Implementation. Resource Document. Available at : https://circabc.europa.eu/sd/a/95c93149-0093-473c-bc27-1a69cface404/Ecosystem%20service_WFD_FD_Main%20Report_Final.pdf (accessed September 8, 2014).
de Groot, R., Brander, L., Van Der Ploeg, S., Costanza, R., Bernard, F., Braat, L., et al. (2012). Global estimates of the value of ecosystems and their services in monetary units. Ecosyst. Serv. 1, 50–61. doi: 10.1016/j.ecoser.2012.07.005
Elliott, M., and Whitfield, A. K. (2011). Challenging paradigms in estuarine ecology and management. Estuar. Coast. Shelf Sci. 94, 306–314. doi: 10.1016/j.ecss.2011.06.016
Elmqvist, T., Setälä, H., Handel, S. N., Van Der Ploeg, S., Aronson, J., Blignaut, J. N., et al. (2015). Benefits of restoring ecosystem services in urban areas. Curr. Opin. Environ. Sustainabil. 14, 101–108. doi: 10.1016/j.cosust.2015.05.001 (accessed on August 7, 2018).
European Commission [EC] (2003a). Common Implementation Strategy for the Water Framework Directive (2000/60/EC). Guidance Document No 1. Economics and the Environment. Available at: http://ec.europa.eu/environment/water/water-framework/facts_figures/guidance_docs_en.htm (accessed on August 7, 2018).
European Commission [EC] (2003b). Common Implementation Strategy for the Water Framework Directive (2000/60/EC). Guidance document No 2. Identification of Water Bodies. Available at: http://ec.europa.eu/environment/water/water-framework/facts_figures/guidance_docs_en.htm (accessed on August 7, 2018).
European Commission [EC] (2003c). Common Implementation Strategy for the Water Framework Directive (2000/60/EC). Guidance document No 4. Identification and Designation of Heavily Modified and Artificial Water Bodies. Available at: http://ec.europa.eu/environment/water/water-framework/facts_figures/guidance_docs_en.htm (accessed on August 7, 2018).
European Commission [EC] (2003d). Common Implementation Strategy for the Water Framework Directive (2000/60/EC), Guidance Document No 5, Transitional and Coastal Waters - Typology, Reference Conditions and Classification Systems. Available at: http://ec.europa.eu/environment/water/water-framework/facts_figures/guidance_docs_en.htm (accessed on August 7, 2018).
European Commission [EC] (2003e). Common Implementation Strategy for the Water Framework Directive (2000/60/EC). Guidance document No 8. Public Participation in relation to the Water Framework Directive. Available at: http://ec.europa.eu/environment/water/water-framework/facts_figures/guidance_docs_en.htm (accessed on August 7, 2018).
European Commission [EC] (2003f). Common Implementation Strategy for the Water Framework Directive (2000/60/EC). Guidance document No 11. Planning process. Available at: http://ec.europa.eu/environment/water/water-framework/facts_figures/guidance_docs_en.htm (accessed on August 7, 2018).
European Commission [EC] (2019). Report from the Commission to the European Parliament and the Council on the implementation of the Water Framework Directive (2000/60/EC) and the Floods Directive (2007/60/EC) Second River Basin Management Plans First Flood Risk Management Plans. COM (2019) 95 Final. Brussels: European Commission.
European Union Bathing Water Directive [EU-BWD] (2006). Directive 2006/7/EC of the European Parliament and of the Council of 15 February 2006 Concerning the Management of Bathing Water Quality and Repealing Directive 76/160/EEC. Official Journal of the European Union L 64/37. Brussels: European Commission.
European Union Water Framework Directive [EU-WFD] (2000). Directive 2000/60/EC of the European Parliament and of the Council of 23 October 2000 Establishing a Framework for Community Action in the Field of Water Policy. Official Journal of the European Communities L 327. Brussels: European Commission.
Feibicke, M. (2005). “Konzept zur Restaurierung des Schlei-Ästuars“,” in Rostocker Meeresbiologische Beiträge, ed. Universität Rostock (Rostock: Institut für Biowissenschaften), 69–82.
Giakoumis, T., and Voulvoulis, N. (2018). A participatory ecosystems services approach for pressure prioritisation in support of the water framework directive. Ecosyst. Serv. 34, 126–135. doi: 10.1016/j.ecoser.2018.10.007
Granek, E. F., Polasky, S., Kappel, C. V., Reed, D. J., Stoms, D. M., Koch, E. W., et al. (2010). Ecosystem services as a common language for coastal ecosystem-based management. Conserv. Biol. 24, 207–216. doi: 10.1111/j.1523-1739.2009.01355.x
Grizzetti, B., Liquete, C., Antunes, P., Carvalho, L., Geamãnã, N., Giucã, R., et al. (2016). Ecosystem services for water policy: Insights across Europe. Environ. Sci. Policy 66, 179–190. doi: 10.1016/j.envsci.2016.09.006
Haines-Young, R., and Potschin, M. B. (2013). Common International Classification of Ecosystem Services (CICES): Consultation on version. Nottingham: EEA Framework Contract No EEA/IEA/09/003.
Haines-Young, R., and Potschin, M. B. (2018). Common International Classification of Ecosystem Services (CICES) V5.1 and Guidance on the Application of the Revised Structure. Nottingham: Fabis Consulting Ltd.
Hansestadt Rostock (2014). Landschaftsplan der Hansestadt Rostock. Erste Aktualisierung 2013. Amt für Stadtgrün: Naturschutz und Landschaftspflege der Hansestadt Rostock.
Hansestadt Rostock (2016). Statistisches Jahrbuch Hansestadt Rostock 2016. Rostock: Presse- und Informationsstelle der Hansestadt Rostock.
Hartje, V., and Klaphake, A. (2006). Implementing the Ecosystem Approach for Freshwater Ecosystems: A Case Study on the Water Framework Directive of the European Union. Bonn: BfN Skripten 183.
Heink, U., Hauck, J., Jax, K., and Sukopp, U. (2016). Requirements for the selection of ecosystem service indicators – The case of MAES indicators. Ecol. Indic. 61, 18–26. doi: 10.1016/j.ecolind.2015.09.031
Hering, D., Borja, A., Carstensen, J., Carvalho, L., Elliott, M., Feld, C. K., et al. (2010). The European Water Framework Directive at the age of 10: a critical review of the achievements with recommendations for the future. Sci. Total Environ. 408, 4007–4019. doi: 10.1016/j.scitotenv.2010.05.031
Hoffmann, C. (1937). “Die Pflanzenwelt,” in Die Schlei & ihre Fischereiwirtschaft, Teil III, eds R. Neubaur and S. Jaeckel (Kiel: Schriften Naturwiss Vereins Schleswig-Holstein), 230–248.
Inácio, M., Schernewski, G., Nazemtseva, Y., Baltranaite, E., Friedland, R., and Benz, J. (2018). Ecosystem services provision today and in the past: a comparative study in two Baltic lagoons. Ecol. Res. 33, 1255–1274. doi: 10.1007/s11284-018-1643-8
Jacobs, S., Wolfstein, K., Vandenbruwaene, W., Vrebos, D., Beauchard, O., Maris, T., et al. (2015). Detecting ecosystem service trade-offs and synergies: a practice-oriented application in four industrialized estuaries. Ecosyst. Serv. 16, 378–389. doi: 10.1016/j.ecoser.2014.10.006
Jobstvogt, N., Watson, V., and Kenter, J. O. (2014). Looking below the surface: the cultural ecosystem service values of UK marine protected areas (MPAs). Ecosyst. Serv. 10, 97–110. doi: 10.1016/j.ecoser.2014.09.006
Landesamt für Natur und Umwelt des Landes Schleswig-Holstein [LANU] (2001). Ergebnisse langjähriger Wasseruntersuchungen in der Schlei. Flintbek: Eine Informations- und Planungsgrundlage.
Landesamt für Umwelt Naturschutz und Geologie Mecklenburg-Vorpommern [LUNG] (2007). Gutachtlicher Landschaftsrahmenplan - Mittleres Mecklenburg. Rostock: Erste Fortschreibung.
Liquete, C., Piroddi, C., Drakou, E. G., Gurney, L., Katsanevakis, S., Charef, A., et al. (2013). Current status and future prospects for the assessment of marine and coastal ecosystem services?: a systematic review. PLoS One 8:e67737. doi: 10.1371/journal.pone.0067737
Lotze, H. K., Lenihan, H. S., Bourque, B. J., Bradbury, R. H., Cooke, R. G., Kay, M. C., et al. (2006). Depletion, degradation, and recovery potential of estuaries and coastal seas. Science 312, 1806–1809. doi: 10.1126/science.1128035
Luederitz, C., Brink, E., Gralla, F., Hermelingmeier, V., Meyer, M., Niven, L., et al. (2015). A review of urban ecosystem services: six key challenges for future research. Ecosyst. Serv. 14, 98–112. doi: 10.1016/j.ecoser.2015.05.001
Luisetti, T., Turner, R. K., Jickells, T., Andrews, J., Elliott, M., Schaafsma, M., et al. (2014). Coastal zone ecosystem services: from science to values and decision making; a case study. Sci. Total Environ. 493, 682–693. doi: 10.1016/j.scitotenv.2014.05.099
Maes, J., Egoh, B., Willemen, L., Liquete, C., Vihervaara, P., Schägner, J. P., et al. (2012). Mapping ecosystem services for policy support and decision making in the European Union. Ecosyst. Serv. 1, 31–39. doi: 10.1016/j.ecoser.2012.06.004
Maes, J., Liquete, C., Teller, A., Erhard, M., Paracchini, M. L., Barredo, J. I., et al. (2016). An indicator framework for assessing ecosystem services in support of the EU biodiversity strategy to 2020. Ecosyst. Serv. 17, 14–23. doi: 10.1016/j.ecoser.2015.10.023
Martin-Ortega, J. (2012). Economic prescriptions and policy applications in the implementation of the European Water framework directive. Environ. Sci. Policy 24, 83–91. doi: 10.1016/j.envsci.2012.06.002
Meyer, T., Reincke, T., Wilken, H., Fürhaupter, K., Krause, S., and Linke, A. (2005). Historische Kartierung mehrjähriger mariner Pflanzen der schleswig-holsteinischen Ostseeküste. GIS-basierte Erfassung und Digitalisierung. Flintbek: Landesamt für Natur und Umwelt des Landes Schleswig-Holstein (LANU).
Millennium Ecosystem Assessment [MEA] (2005). Ecosystems and Human Well-Being: Synthesis. Washington, DC: Island Press.
Müller, A., and Heininger, P. (1999). On sediment pollution in selected German coastal waters of the Baltic Sea. Limnol. Ecol. Manag. Inland Waters 29, 255–261. doi: 10.1016/S0075-9511(99)80010-3
Nellen, W. (1963). Fischereibiologische und Faunistische Brackwasseruntersuchungen in der Schlei einer Ostseeförde Schleswig-Holsteins. Ph.D. thesis, Christian-Albrechts-Universität zu Kiel, Kiel.
Nellen, W. (1967). Ökologie und fauna (makroevertebraten) der brackigen und hypertrophen ostseeförde schlei. Archiv. Hydrobiol. 63, 273–309.
Newton, A., Brito, A. C., Icely, J. D., Derolez, V., Clara, I., Angus, S., et al. (2018). Assessing, quantifying and valuing the ecosystem services of coastal lagoons. J. Nat. Conserv. 44, 50–65. doi: 10.1016/j.jnc.2018.02.009
Ohle, W. (1965). Nährstoffanreicherung der gewässer durch düngemittel und meliorationen. Münchner Beiträge 12, 54–83.
Ohlendieck, U. (2008). Zustand und Verbesserungspotenzial der Schlei. Eine Informations- und Planungsgrundlage für Maßnahmen zur Umsetzung der EG-Wasserrahmenrichtlinie. Flintbek: Landesamt für Landwirtschaft, Umwelt und ländliche Räume (LLUR).
Piwowarczyk, J., Kronenberg, J., and Dereniowska, M. A. (2013). Marine ecosystem services in urban areas: do the strategic documents of polish coastal municipalities reflect their importance? Landsc. Urban Plan. 109, 85–93. doi: 10.1016/j.landurbplan.2012.10.009
Reyjol, Y., Argillier, C., Bonne, W., Borja, A., Buijse, A. D., Cardoso, A. C., et al. (2014). Assessing the ecological status in the context of the European water framework directive: where do we go now? Sci. Total Environ. 497, 332–344. doi: 10.1016/j.scitotenv.2014.07.119
Ripl, W. (1986). Restaurierung der Schlei. Bericht über ein Forschungsvorhaben. Kiel: Landesamt für Wasserhaushalt und Küsten Schleswig-Holstein.
Schernewski, G., Friedland, R., Carstens, M., Hirt, U., Leujak, W., Nausch, G., et al. (2015). Implementation of European marine policy: new water quality targets for German Baltic waters. Mar. Policy 51, 305–321. doi: 10.1016/j.marpol.2014.09.002
Schernewski, G. S., Inacio, M., and Nazemtseva, Y. (2018). Expert based ecosystem service assessment in coastal and marine planning and management: a Baltic lagoon case study. Front. Environ. Sci. 6:19. doi: 10.3389/fenvs.2018.00019
Statistisches Amt für Hamburg und Schleswig-Holstein (2014a). Beherbergung im Reiseverkehr in Schleswig-Holstein 2013. Hamburg: Statistisches Amt für Hamburg und Schleswig-Holstein.
Statistisches Amt für Hamburg und Schleswig-Holstein (2014b). Bevölkerungsentwicklung in den Gemeinden Schleswig-Holsteins 2015. Fortschreibung auf Basis des Zensus 2011. A I 1 - j 15 SH. Hamburg: Statistisches Amt für Hamburg und Schleswig-Holstein.
Statistisches Landesamt Schleswig-Holstein (1964). Statistisches Jahrbuch Schleswig-Holstein 1964. Kiel: Statistisches Landesamt Schleswig-Holstein.
Vlachopoulou, M., Coughlin, D., Forrow, D., Kirk, S., Logan, P., and Voulvoulis, N. (2014). The potential of using the ecosystem approach in the implementation of the EU Water framework directive. Sci. Total Environ. 470, 684–694. doi: 10.1016/j.scitotenv.2013.09.072
Keywords: Water Framework Directive, ecological status, reference conditions, Baltic, Warnow, Schlei, stakeholder involvement, expert assessment
Citation: Schernewski G, Paysen P, Robbe E, Inácio M and Schumacher J (2019) Ecosystem Service Assessments in Water Policy Implementation: An Analysis in Urban and Rural Estuaries. Front. Mar. Sci. 6:183. doi: 10.3389/fmars.2019.00183
Received: 28 August 2018; Accepted: 21 March 2019;
Published: 04 April 2019.
Edited by:
Sebastian Villasante, University of Santiago de Compostela, SpainReviewed by:
Ana Isabel Lillebø, University of Aveiro, PortugalUlisses Miranda Azeiteiro, University of Aveiro, Portugal
Copyright © 2019 Schernewski, Paysen, Robbe, Inácio and Schumacher. This is an open-access article distributed under the terms of the Creative Commons Attribution License (CC BY). The use, distribution or reproduction in other forums is permitted, provided the original author(s) and the copyright owner(s) are credited and that the original publication in this journal is cited, in accordance with accepted academic practice. No use, distribution or reproduction is permitted which does not comply with these terms.
*Correspondence: Gerald Schernewski, gerald.schernewski@io-warnemuende.de; schernewski@eucc-d.de