Analysis of the Thermoplastic Composite Overmolding Process: Interface Strength
 Remko Akkerman
 Mark Bouwman
 Sebastiaan Wijskamp
- 1The ThermoPlastic Composites Research Center, Enschede, Netherlands
- 2Production Technology, Faculty of Engineering Technology, University of Twente, Enschede, Netherlands
Overmolding is a technology in which a thermoplastic composite laminate is thermoformed and subsequently injection overmolded. This near-net-shape manufacturing process is well suited for automated large series production of complex 3D structures with excellent structural performance and a high level of function integration. There is a need for process design tools, which are currently lacking. For this purpose, the bond strength between the overmolded composite laminate and the injected polymer resin was studied by means of process modeling and mechanical testing. Starting from De Gennes' classical reptation theory for reptation and healing of amorphous polymers, an alternative approach was developed to describe the strength development for semi-crystalline materials. A rudimentary description of the degree of melting was implemented to predict the bond strength as a function of the thermo-mechanical history at the interface during forming and subsequent resin injection for PA6 and PEEK, both semi-crystalline matrix materials. Dedicated coupon geometries were developed, manufactured and tested to evaluate the bond strength under tensile and shear loading conditions. Both a single step and a dual step process were evaluated, leading to distinctly different process mechanisms and resulting material structure and mechanical performance of the parts. Suggestions are presented for optimum process conditions and improved design features to further mature this technology.
1. Introduction
Overmolding of thermoplastic composites is a hybrid process that combines thermoforming of a continuous fiber reinforced thermoplastic laminate with an injection or compression molding process. The process allows for complex parts with high structural performance due to the continuous fibers, providing high specific stiffnes and strength. Further advantages are the potential for a high level of function integration, net shape manufacturing and large series production in an automated process. A schematic representation of the overmolding process is shown in Figure 1. The process consists of the melting and forming of a composite laminate, which is subsequently over injected with a polymer that is compatible with the polymer matrix of the composite and which may be reinforced with short fibers. This allows, for example, the addition of reinforcing ribs to increase the geometrical stiffness. Although the feasibility of the process has been demonstrated frequently in recent years, it is acknowledged that there is a lack of proper design tools that can be used for a first-time-right design strategy. Key issues are the predictability of the process induced shape distortions of the overmolded part and of the bond strength between the overmolded composite laminate and the injected polymer resin. Here, we focus on the latter challenge. Currently, there are no design tools available to predict this interface strength, which is critical for the performance of the overmolded part as a whole. Consequently, part and mold design and process optimization largely depend on experience and a trial-and-error process.
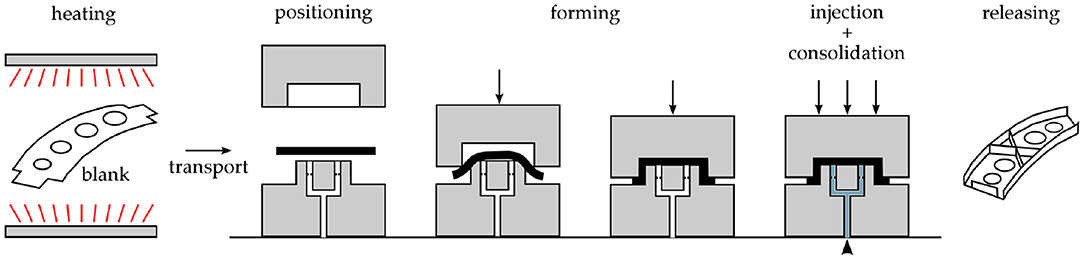
Figure 1. Schematic representation of the overmolding process. Reproduced from Bouwman et al. (2016).
The objective of the current study is to develop and experimentally validate a predictive model for the interface strength between the injected polymer and composite blank. This model will be coupled with commercial composites forming and injection molding simulation software in order to model the overmolding process as part of the mold design procedure. This paper reports on the results obtained with a polyamide 6 (PA6) and a polyaryletherketone (PAEK) polymer resin, reinforced with glass and carbon fibers, respectively.
2. Theory
The overmolding process starts by bringing the fiber reinforced composite laminate, referred to as insert, in the injection molding tool. The laminate can be preformed and inserted in solid state in the injection molds, which is denoted as a dual step overmolding process. Alternatively, in the single step overmolding process, the composite insert is heated above the melting temperature first and subsequently formed during closing of the mold. Once the mold is fully closed, the polymer is injected onto the formed insert. A packing pressure is applied to compensate to some extent for thermal shrinkage of the resin after injection. The interface will usually be heated up by the thermal energy of the injected polymer melt, such that the insert and the injected laminate can be bonded to a certain extent. The time available for bonding during overmolding is limited, since the mold is normally kept at a relatively low temperature to ensure rapid cooling and, consequently, to allow for short cycle times.
The establishment of a bond between the laminate insert and injected polymer comprises two phenomena: (1) development of intimate contact between the insert and injected polymer, and (2) interdiffusion of polymer chains across the interface. The latter is also known as healing or autohesion and can only occur once intimate contact has been achieved. Theoretical descriptions of healing are well established for amorphous polymers, but far less conclusive for semi crystalline materials.
2.1. Intimate Contact Development
The degree of intimate contact is defined as the fraction of the total surface area that has reached full contact (Dara and Loos, 1985). At the start of the bonding process between two substrates, their surfaces will not be perfectly smooth, but contain surface asperities that give the surface a certain roughness. Flattening of these surface asperities is needed to increase the degree of intimate contact and to allow interdiffusion of polymer chains across the interface. The time required to achieve full intimate contact depends on the roughness of the surfaces, the applied pressure and the viscosity of the material. The viscosity is temperature dependent, i.e., an increase in temperature decreases the viscosity and promotes intimate contact development.
A mathematical model for the intimate contact evolution was developed by Dara and Loos (1985), who described the surface roughness as a set of non-uniform rectangles. A simplified model using rectangles of identical size was later introduced by Lee and Springer (1987), and integrated with a healing models by Butler et al. (1998). Yang and Pitchumani (2001) developed a model were the surface roughness can be described in more detail using a fractal cantor set. In general, these models show that the time required to achieve full intimate contact tic is proportional to the viscosity ηo and inversely proportional to the applied pressure P (Lee and Springer, 1987):
During the overmolding process, a high injection and packing pressure is applied while at least one of the two materials is in a molten state with very low viscosity. Therefore, it is assumed that the time required to achieve full intimate contact is negligible compared to the required time to heal the interface. Consequently, only healing is considered for modeling interface strength development during overmolding.
2.2. Non-isothermal Healing of Amorphous Polymers
Once intimate contact between the surfaces is achieved, the polymer chains can diffuse across the interface due to thermal motion. The polymer chains will entangle with those of the adjacent surface, which contributes to the actual interface strength development. The diffusion and entanglement process happen continuously as long as the polymer mobility is high enough and will cause the interface to fade until the material can no longer be distinguished from the bulk polymer.
The reptation theory of De Gennes (1971) is generally accepted for describing the diffusion process of amorphous polymer chains. In this theory, the amorphous polymer chains are considered to be entangled in a random order. The movement of an individual polymer chain is restricted by its neighboring chains that form a virtual tube around the polymer chain. The polymer chain can only move back-and-forth inside this virtual tube; only the chain ends are free to move in a random direction. This allows the head and tail of the polymer chain head to escape from the initial tube and to form so-called minor chains. These minor chains can diffuse across the interface and contribute to the strength development (Kim and Wool, 1983).
The required time for a polymer chain to completely escape from its original tube is defined as the reptation time tr. This reptation time is considered to be the time required to achieve full healing of a polymer interface. For engineering thermoplastics, however, a time shorter than tr is usually needed to complete healing since the molecular weights are high (Tierney and Gillespie, 2006). This required time to achieve full healing is generally referred to as the welding time tw. Since the welding time can only be determined experimentally, the reptation time can be used to obtain a conservative prediction for healing. Both the welding time and reptation time are highly dependent on the temperature: a higher temperature gives a higher polymer chain mobility and hence promotes healing. The degree of healing Dh is defined as the relative strength with respect to the maximum attainable bond strength σ∞. The development of the degree of healing over time t under non-isothermal conditions is described in an integral form by e.g., Yang and Pitchumani (2001):
or in a differential form as (Akkerman et al., 1995)
with T(t) and σ(t) being the time dependent interface temperature and bond strength, respectively, and in which the growth of σ(t) stops once it has reached its maximum value σ∞ such that 0 ≤ Dh ≤ 1. Determination of the degree of healing requires the temperature history and the reptation time of the polymer as a function of the temperature. The reptation time can be considered equal to the relaxation time (Gedde, 1995), which can be derived from viscosity measurements as a function of the shear rate. The reciprocal of the transition point of the Newtonian plateau to the shear thinning region corresponds to the relaxation time which is then used as the reptation time for that specific temperature. After determining the reptation time for different temperatures, an Arrhenius fit can be used to describe the temperature dependency (Ageorges et al., 1998). For amorphous polymers, it is assumed that healing can only occur above the glass transition temperature.
2.3. Non-isothermal Healing of Semi-crystalline Polymers
The healing model for amorphous polymers cannot be used directly for semi-crystalline polymers, as was observed experimentally by Boiko et al. (2001). After performing isothermal bonding experiments in the vicinity of the glass transition temperature for amorphous and semi-crystalline PET, it was found that the strength values of bonded semi-crystalline specimens were one order of magnitude smaller than the strength of bonded amorphous specimens. This was explained not only by the immobility of the crystalline fraction, but also since a part of the amorphous polymer chains is firmly fixed by the surrounding crystalline regions, which severely limits the penetration depth of the polymer chains into the adjacent substrate (Boiko et al., 2001; Awaja and Zhang, 2015). As a result, the crystallinity of the polymer directly influences the concentration of mobile chain ends at the interface. For both PET and PEEK polymers, the interfacial bond strength increased substantially with decreasing crystallinity in the original substrates.
A similar poor interface performance for bonding below the melting temperature was observed by Lamèthe et al. (2005), who studied bonding of PEEK around the melting temperature. Only when the surfaces were melted well, a sudden increase in fracture toughness of the interface was observed. This sudden increase in fracture toughness upon melting was also observed by Smith et al. (2001), Zanetto et al. (2001), and Plummer et al. (2002), who studied bonding of PP and PA6 under isothermal and non-isothermal conditions. Their non-isothermal bonding trials were performed by heating one of the surfaces above the melting temperature, while the other surface remained below the melting temperature. The initial average temperature of the surfaces was considered as the interface temperature, neglecting the temperature dependency of, e.g., the specific heat. For interface temperatures below and above the melting temperature, the non-isothermally bonded specimens performed better than the isothermally bonded specimens at equal interface temperatures. Moreover, the bulk performance was achieved in a shorter time for the non-isothermal trials compared to the isothermal trials. Overmolding experiments using glass reinforced PA6 were performed (Lafranche et al., 2014), who concluded that the temperature of the laminate insert should exceed 150°C to establish sufficient bond strength. In this way, the matrix temperature would exceed from which interdiffusion can occur. Non-isothermal bonding experiments were also performed by Sauer et al. (2016), who examined bonding of PPA, PA66, and PPA-PA66 blends for a short bonding time of 5 s. The peak melting temperature and shape of the melting peak was varied by changing the composition of the PPA-PA66 blends. For a laminate that was initially below its peak melting temperature, it was observed that substantial, but not full melting is needed to establish a reasonable bond with a surface that has a higher temperature. Besides, it was concluded that the onset of melting facilitates the interpenetration of the polymer chains and is, thereby, the onset for bonding.
In literature, there appears to be no consensus on how to model the healing process of semi-crystalline polymers. The non-isothermal healing model (2) developed by Yang and Pitchumani (2001) only applies for amorphous polymers and is, therefore, only applicable for semi-crystalline polymers in a melted state and can continue until the polymer starts to crystallize. Nevertheless, in some studies the healing model for amorphous polymers was directly applied for semi-crystalline polymers without considering the effect of the crystalline structure above the glass transition temperature (Ageorges et al., 1998; Levy et al., 2014). Lee and Springer (1987), Yang and Pitchumani (2002), and Tierney and Gillespie (2006) assumed that healing of semi-crystalline polymers can only occur above the melting temperature, i.e., the melting temperature was used as ‘onset temperature' for healing. More recently, Stokes-Griffin and Compston (2016) used the melting temperature as the onset but allowed healing to continue until the glass transition temperature during cooling. This was justified by the assumption that the PEEK polymer under consideration remained amorphous due to the high cooling rates in the fiber placement process that was modeled. Similarly, Colak et al. (2002) used the healing model for resistance welding of C/PEEK: the healing model was used until a temperature of 270°C was reached during cooling, as this would represent the crystallization temperature in their process. In contrast to the studies mentioned previously, Colak et al. used an onset temperature for healing of 320°C for PEEK, which would represent a “transition temperature between crystallization and melting.” Giusti and Lucchetta (2014) used the healing model to predict the interface strength during the overmolding process and assumed that healing could only occur above a ‘no-flow temperature' of 220°C of the PA66 polymer that was used.
The welding times used in literature can differ by orders of magnitude for the same type of polymer, as was observed by Stokes-Griffin and Compston (2016). However, the reptation times for semi-crystalline polymers are usually very short above the melting temperature, as was reported by Grouve et al. (2013), who found reptation times in the order of 1 ms for PPS above the melting temperature based on rheological experiments. Using such short reptation or welding times in the healing would, thereby, result in instantaneous healing as soon as the onset temperature is reached for the overmolding process considered here. The prediction of healing will then strongly depend on the chosen onset for healing and may be very sensitive to small variations in the temperature prediction around the onset. The use of a single onset temperature can also be questioned, as semi-crystalline polymers show a melting trajectory instead of a single melting temperature.
Therefore, a novel approach is introduced here to predict the degree of healing of semi-crystalline polymers. Instead of using the polymer reptation times to describe the polymer chain mobility, it is assumed that the crystalline fraction, once it is present in sufficient amount dominates the polymer chain mobility. Before the onset of melting, the polymer chain mobility is limited and healing cannot occur. When heated above the melting temperature, the crystalline structure can melt entirely and the polymer can fully heal. The amount of healing will increase gradually with intermediate temperatures.
A DSC analysis at constant heating rate was used to determine the melting trajectory of the polymer, as is visualized in Figure 2A for PA6 heated at 20°C/min. A baseline is fitted to the curve (Wunderlich, 2005) in order to identify the heat flow associated to melting of the crystalline regions, denoted as , and which can be integrated to the total heat associated to the initial degree of crystallinity present before the onset of melting,
with tb and te as the beginning and end of melting, respectively. Accordingly, the degree of melting Dm, which represents the fraction of crystallites that is melted with respect to its original state at room temperature, is defined as
The resulting degree of melting of PA6 is shown as a function of the temperature in Figure 2B, including an exponential fit for numerical implementation. Obviously, the actual chain mobility at a given temperature and location will depend on the process history and hence on the local morphology, of which the rate of change, in turn, depends on the heating rate. As a first approximation, however, we will neglect rate dependency and differences in morphology, assuming a unique relation between the degree of melting and the temperature. In line with the earlier findings on the very short reptation times for semi-crystalline polymers in melt, the time for (partial) healing can be considered negligible for the fraction of crystallites that has melted. Assuming proportionality between melting and healing then leads to the assumption that the degree of healing is equal to this degree of melting at the maximum temperature Tmax reached during the overmolding process. This implies that the degree of healing can increase from its initial value of zero according to
where the constants A and B follow from curve fitting the DSC measurement results on the resin under consideration. An artificial lower limit Tb was introduced to inhibit the prediction of irrelevant but non-zero healing at lower temperatures, here with Dh(Tb) = 0.001. In this first approximation, any potentially continued healing after Tmax has been reached is also neglected. Our experimental data are insufficient to support a more sophisticated model, currently.
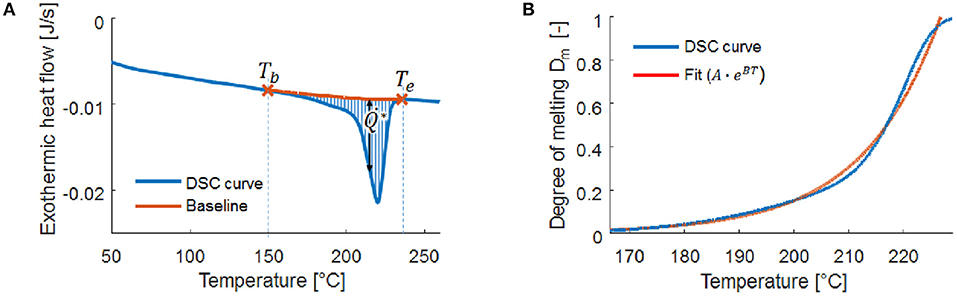
Figure 2. Melting trajectory (A) and degree of melting (B) of PA6 for heating at 20°C/min. Tb and Te denote the temperatures at which melting begins and ends, respectively.
3. Methods
The non-isothermal healing theory of semi-crystalline polymers was implemented in a process simulation workflow, combining commercial software with a dedicated software interface to predict the degree of healing. Next to this, a series of components of increasing complexity was designed and manufactured by overmolding and evaluated by visual inspection, mechanical testing and cross-section microscopy.
3.1. Process Simulation Procedure
The overmolding process was simulated using the commercial injection molding software Autodesk Moldflow (version 2017). The Aniform software (release 3.4.1) was used to simulate the laminate forming process, thus providing the geometry and state of the laminate (thickness and fiber orientation distribution) prior to injection overmolding. The injection simulation was performed using linear three-dimensional tetrahedral elements (TET4). The composite insert and polymer flow domain were meshed separately and were assigned their specific material properties and initial temperatures. A mesh refinement was applied near the interface. The interface temperature between the composite insert and the injected polymer is expected to rise almost instantaneously to the average of the insert and melt temperature, respectively, when the polymer melt flow front reaches the interface. Depending on whether the flow stops or continues after this instant, the local interface temperature may drop or rise, respectively, which is likely to have a large effect on the degree of healing and the resulting interface strength. The degree of healing was simulated in a post processing step of the Moldflow results, determining the maximum temperature during the process from injection to cool down to the ejection temperature on the laminate surface interfacing with the polymer resin and subsequently evaluating Equation (6) at each nodal point of this interface.
3.2. Experimental: Test Coupons and Demonstrator
Two coupon geometries were selected to characterize the interface strength experimentally: the V-notched Iosipescu and the Rib-on-plate geometry (Figure 3). Both were used in tension and shear loading. A local stress analysis of these tests is relatively straightforward, compared to e.g., lap shear tests, which are very sensitive to local geometry variations (edge effects) and non-symmetry of the lay-up. The Iosipescu geometry represents overmolding of laminate edges, which is a means to net-shape manufacturing of continuous fiber composite parts, without the need for trimming after part manufacturing. The Rib-on-plate geometry is an elementary representation of rib stiffened skins, achieving a high specific bending stiffness by means of overmolded ribs.
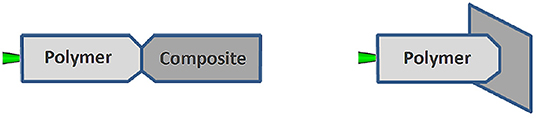
Figure 3. Overmolded Iosipescu (left) and Rib-on-Plate (right) coupon geometries to assess the interface strength.
A rib-stiffened V-shape (Figure 4A) was designed as a test specimen more representative of actual overmolded products, with polymer flow along the interface, rather than arriving normal to it, while still allowing for material characterization. It further provided a convenient geometry for analysing process induced shape distortions. The findings were validated on a doubly curved grid stiffened component, representative for potential applications in an aerospace context (Figure 4B). This demonstrator part features forming induced laminate deformations, flow cavities along the edges of the laminate (edge finishing) as well as normal to the laminate (grid stiffening) and was used in both single and dual step processing (either or not combining forming and overmolding in a single process cycle).
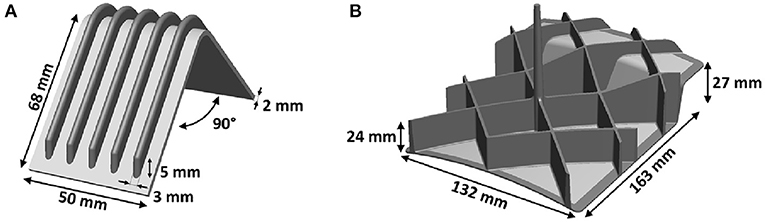
Figure 4. Rib stiffened V-shape (A) and grid stiffened curved panel (B) test specimens.
3.2.1. Iosipescu Geometry
The Iosipescu geometry was developed for shear testing (Walrath and Adams, 1983) and is widely used for composite materials, which is standardized in ASTM D 5379. The specimen dimensions were according to the standard, with the laminate-polymer interface located at the V-notch, such that the shear strength of the overmolding interface can be determined in the plane of the composite laminate. Also a tensile test can be performed quite easily on these specimens, although the V-notch introduces some stress concentrations and might, therefore, provide a lower apparent strength (defined as the force divided by the cross-sectional area at the location of the notch) than an unnotched specimen.
3.2.2. Rib-on-Plate Geometry
The design of the Rib-on-plate geometry was based on the Iosipescu geometry: the overmolded section equals that of the Iosipescu geometry, as is visible in Figure 3. Also this coupon can be used to test the mechanical performance of the overmolding interface in shear and tension, but now in the plane normal to the composite laminate. Similar to the Iosipescu geometry, stress concentrations are present at the notch which are expected to lower the apparent strength.
3.2.3. V-Shape
The simplest coupons to test the interface strength, such as single or double lap shear, Iosipescu and Rib-on-plate specimens, all have their limitations with respect of being representative for actual overmolded grid stiffened composite components. Ideally, the test specimen satisfies the following requirements:
• The specimen geometry represents a stiffener rib;
• The interface is located at the insert surface;
• The injected polymer flows parallel to the interface;
• The differences in interface strength are measurable and standard deviations are low;
• The stresses can be calculated at the instant and location of first failure.
With these requirements in mind, a V-shape specimen with multiple overmolded ribs was designed. After cutting small composite beams from the specimen, their short beam shear performance can be tested by three-point bending of the straight part, whereas their pull-off strength can be assessed by four point bending of the curved section. Inherently, the specimens will encounter a variation in interface temperatures along the length of the ribs. In addition, the shape is well suited to study the process induced distortions, as a function of the processing conditions. The results of this study revealed that a thermoelastic approach already has good predictive capabilities (Bouwman et al., 2016). Considering the scope of the current article, this will be left out of further discussion here.
3.2.4. Grid Stiffened Doubly Curved Panel
In order to further investigate the design and processing challenges in overmolding, a part was designed and manufactured that combines grid stiffening, edge finishing with forming induced laminate deformations (due to double curvature of the laminate skin). The molded components were visually inspected and not subjected to mechanical testing as it would be difficult to generate meaningful results for the more generic purpose of our research.
3.3. Materials
The interface strength after overmolding was characterized for glass filled Polyamide-6 (G/PA6) and carbon filled Polyaryl-ether-ketone (C/PAEK). These semi-crystalline polymers are used in the automotive and aerospace industry, respectively. The material grades and properties of the composite laminate and injection polymer are summarized in Table S1. The continuous fiber reinforced laminates were overmolded with similar polymer resins, reinforced with short fibers. The PAEK matrix material of the laminate insert is also known as low melting PAEK (LMPAEK). This polymer is engineered to have mechanical properties similar to PEEK, but with a lower processing temperature. For the overmolding process simulations, the standard grades BASF Ultramid B3ZG6 and Victrex PEEK 90HMF40 from Autodesk Moldflow's materials database were used. The constants for the degree of melting model were determined by DSC experiments using a Mettler Toledo 822e. The samples of nominally 5 mg were tested under nitrogen purge flow of 50 mL/min at a constant heating rate of 20°C/min, as presented in Table S2. Averaged anisotropic thermal properties were used for simulation of the laminate inserts in the overmolding process (Table S3).
3.4. Equipment
The overmolding experiments of the smaller test coupons (Iosipescu, Rib-on-plate and rib-stiffened V-shape) were performed on a Boy 22E injection molding machine. With its maximum stroke volume of 33.6 cc, this injection molding machine is very suitable for the small research geometries. The machine has a maximum clamp force of 220 kN and was upgraded with a high-temperature extruder for injection temperatures up to 400°C. Moreover, the new wear-resistant extruder allows injection of fiber filled polymers. The molds were heated electrically and are suited for temperatures up to 250°C.
The laminate inserts, press consolidated prior to overmolding, were heated either in the closed injection mold or by using a 200W infrared heater setup containing a 60 × 60 mm2 ceramic IR panel, maintained at a constant temperature of 600°C (with a rated maximum temperature of around 650°C). The laminate insert temperature was controlled by varying the heating time. Positioning and removal of the panel, as well as starting the injection cycle, were performed automatically to ensure a good reproducibility. The time between removal of the IR panel after heating and injection was measured to be approximately 4 s, in which the laminate insert was in contact with the closed mold for approximately 2 s.
The larger size grid stiffened doubly curved panels were manufactured in a KM160 CX injection/overmolding machine from Krauss-Maffei, with 820 × 845 mm2 platens, a maximum stroke volume of 318 cc, injection pressure of 2,336 bar and clamping force of 1,600 kN. The machine allows for combined forming and injection in an integrated process. During this integrated single-step process, the flat composite laminate is heated on both sides by means of 500 × 500 mm2 IR panels with a maximum temperature of 850°C and a rated maximum power of 20 kW, transported by a robot to the injection mold, in which a special gripper system (similar to conventional ejector pins) takes over the laminate until the mold halves are fully closed and the laminate is formed to the shape of the mold. In this machine, the power of the panels is controlled actively, based on laminate temperature measurements using pyrometers. The polymer resin can be injected directly after mold closure, while the laminate is still largely in molten condition. The grid stiffened panels were produced using this single-step process as well as the dual-step process in which the laminate inserts were press-formed prior to the injection stage, and pre-heated in the injection mold before resin injection.
3.5. Processing
Standard injection molding guidelines were followed for the injection process. The injection molding granules were dried according to the datasheet provided by the manufacturer. The laminate inserts were cut to the correct dimensions by using a diamond saw (Rib-on-plate inserts) or waterjet-cutting (Iosipescu inserts). Subsequently, these inserts were dried prior to overmolding under the same conditions as the granules. The interface surface was cleaned with isopropanol before overmolding. A few ‘fully injection molded' specimens were produced and tested for comparison for each geometry/material combination. These specimens can be used to have an indication of the apparent strength of the injected polymer for a specific geometry. Care should be taken, however, to not confuse this strength with the maximum attainable bond strength after overmolding.
The key parameter for overmolding is the interface temperature, which is determined by the insert temperature, injection temperature and mold temperature. The process window for varying the injection temperature and mold temperature is limited due to the process ability of the material. Therefore, the insert temperature was chosen as variable for the overmolding experiments since this parameter can be varied of a wide range of temperatures. Moreover, this approach directly allows for a comparison between a dual step process (for which Tinsert < Tm) and a single step process (Tinsert > Tm). The processing temperatures are listed in Table S4.
A thermocouple measurement was performed for each geometry and material combination to determine the required time to achieve the desired temperature of the insert prior to overmolding. This was done by drilling a hole in the insert such that the thermocouple tip was near the interface within 1 mm accuracy. The insert was then heated by the mold or by using the infrared heater setup. Typical IR heating times ranged from 2 to 3 min, depending on the desired insert temperature. The Krauss-Maffei machine further employed active temperature control using feedback based on pyrometer measurements of the surface temperatures on both sides of the laminate.
3.6. Mechanical Testing
The Iosipescu geometry and Rib-on-plate geometry were both characterized under tensile and shear loading conditions, as shown in Figure 5. The procedure for the shear test was according to the ASTM D 5379 standard (American Society for Testing and Materials, 2012), using the standard fixture for testing the Iosipescu specimens. This fixture was modified to fit also the Rib-on-plate specimens using a semi rigid steel clamping system to minimize flexure of the composite laminate, as illustrated schematically in the same figure. Tensile tests were performed on the Iosipescu specimens using standard clamps. The Rib-on-plate specimens were tested in tension using a bespoke steel fixture to minimize flexural deformations of the laminate during testing and standard grips on the overmolded section. Spacers were used to ensure that the loads were introduced gently and that the failure was well outside the clamping areas. All tests were performed in an Instron 5982 100 kN load frame using a 10 kN load cell, at a testing speed of 2 mm/s until full fracture was reached, using samples of 5 specimens per process setting and test condition. The extension and load were recorded at a sampling rate of 50 Hz, from which the ultimate load and subsequently the averaged ultimate stress were determined, without correcting for the presence of stress concentrations. As the current investigations were directed to the apparent interface strength, we did not pursue any stiffness analysis, so there was no need use extensometers to accurately measure the local deformations.
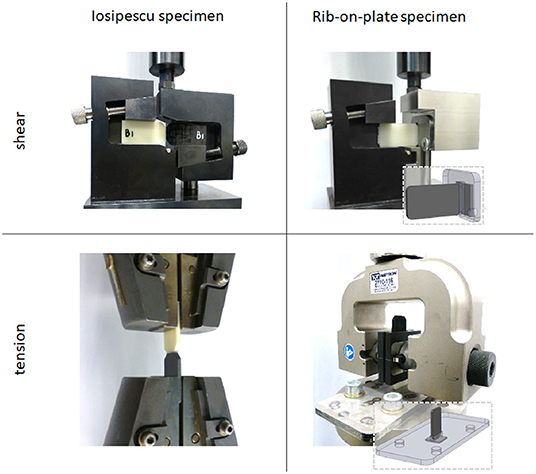
Figure 5. Mechanical testing of the Iosipescu and Rib-on-plate specimens, schematically illustrating the specific fixtures for the Rib-on-plate specimens.
The V-shape specimens were used for dimensional accuracy measurements (not discussed here) and for bending tests. Five curved beams can be cut from each rib-reinforced V-shape, which can be subjected to curved beam testing following ASTM D6415 (American Society for Testing and Materials, 2013), or from which two straight short beams can be obtained (Figure 6). The latter can be tested according to ASTM D2344 (American Society for Testing and Materials, 2016). The 4 point bending tests of the curved beams can be used to assess tensile strength of the interface between the resin and the laminate insert, whereas the short beam shear tests would be expected to relate primarily to the shear strength of the interface.
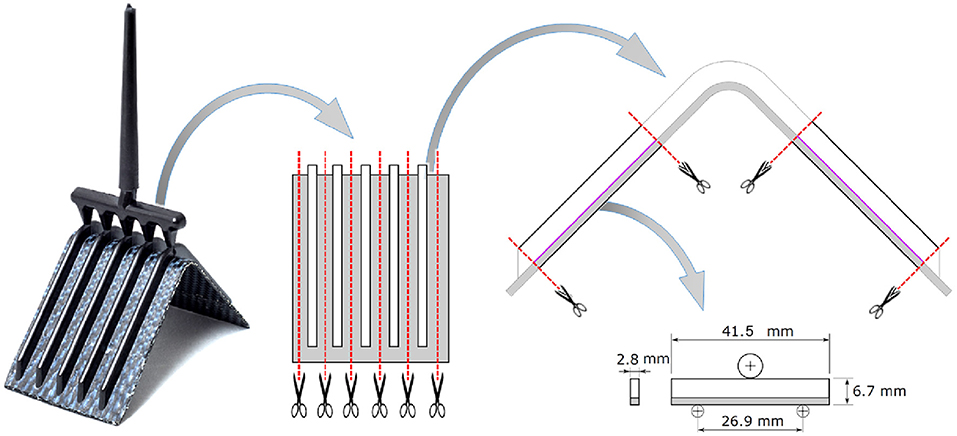
Figure 6. Cutting of the V-shape specimen to curved and straight beams for subsequent bending tests.
4. Results
4.1. Prediction of the Degree of Healing
Process simulations were performed on all geometries, predicting the distribution of the degree of healing on the polymer/laminate interfaces. A typical result is shown in Figure 7, for the Iosipescu specimen with the lowest laminate insert temperature and, correspondingly, the lowest degree of healing. It can be argued that the minimum value of the degree of healing on the interface, , should correlate to its failure load, as the weakest link is expected to induce crack initiation, which is likely to be followed by rapid crack propagation and failure. On the other hand, an interface with may still have significant load bearing capacity when certain parts of the interface have developed sufficient bond strength. Considering the exploratory nature of the research reported here, it was decided to use the surface averaged value of the degree of healing, , for comparison with the measured apparent strength. With this choice comes the advantage of only a moderate mesh and timestep sensitivity of the results. Care was taken to report only converged results, obtained with sufficiently fine discretisations in space and time.
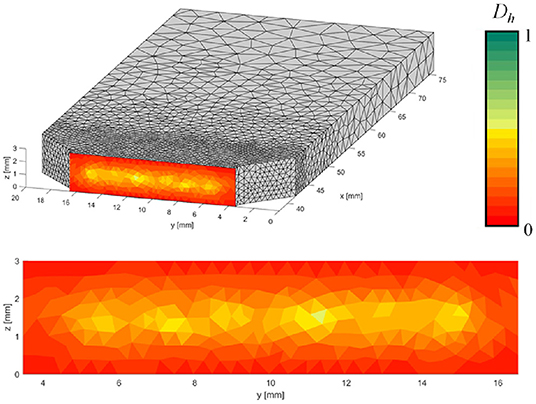
Figure 7. Example of the predicted degree of healing for the PA6 Iosipescu geometry (C, C, C, mold contact time prior to overmolding: 2 s). A detailed view of the interface is shown at the bottom.
4.2. Iosipescu and Rib-on-Plate
All PA6 Iosipescu and Rib-on-plate coupons were manufactured with a mold temperature of 90°C and an injection temperature of 280°C. Both configurations involved a flow front that arrives perpendicularly to the insert. This is different from the general overmolding geometries, which mostly involve polymer melt flow along the length of the interface, keeping the interface temperature high for prolonged time. In this respect, the coupon specimens can be considered to be worst case scenarios for the interface strength development. The Iosipescu specimen, in addition, generated further complexity with respect to geometric tolerances and differential thermal expansion of the laminate inserts vs. the injection mold. As a result, the Iosipescu specimens showed evidence of flash near the interface (see Figure 8), as the injected polymer flows between the edge of the laminate insert and the mold cavity. It was decided not to remove the polymer flash after overmolding, since this will change the insert geometry and is likely to provide an undefined crack-initiator near the interface. The polymer flow in the Rib-on-plate specimens was transverse to the laminate insert, in which case the flash can be prevented by assuring sufficient pressure on the laminate while the overmolding takes place. Furthermore, care was taken to prevent air entrapment, by means of the mold design which allows the air to escape from the cavity during polymer injection. Mold design incorporating venting locations, combined with a high packing pressure ensured negligible voids in the finished products.
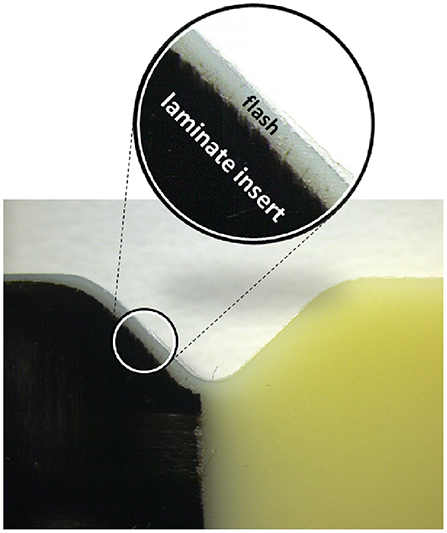
Figure 8. Flash along the edge of the laminate insert in an overmolded PA6 Iosipescu specimen.
Both Iosipescu and Rib-on-plate PA6 specimens were tested in shear and tension. Figure 9 shows exemplary force/displacement curves obtained on Iosipescu specimens with different processing conditions. As a reference, also the curves of the fully injection molded specimens are included in these graphs.
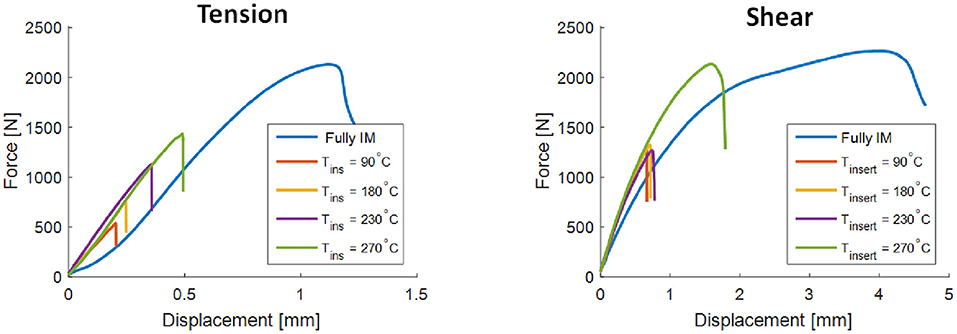
Figure 9. Typical experimental results for the PA6 Iosipescu geometry loaded in tension (left) and shear (right). Process conditions: C, C. The blue curves (Fully IM) were obtained with fully injection molded polymer resin specimens as a reference.
The measured ultimate apparent strength values are presented side by side to the average degree of healing simulation results in Figure 10. The experimental results for the Iosipescu specimens are subject to significant scatter, with relative standard deviations of 20–30%. The specimens produced with the two insert temperatures below Tm, i.e., 90°C and 180°C, showed a brittle failure mode with very similar strength values in the order of 30 MPa for tension and 35 MPa for shear, respectively. The inserts of 230°C showed some signs of plastic deformation prior to ultimate failure, but on average similar strength values as observed for the lower temperatures. For the well-melted inserts at 270°C, the strength values increased to around 60 and 55 MPa in tension and shear, respectively. The fully injection molded specimens outperformed the overmolded specimens, especially in tension.
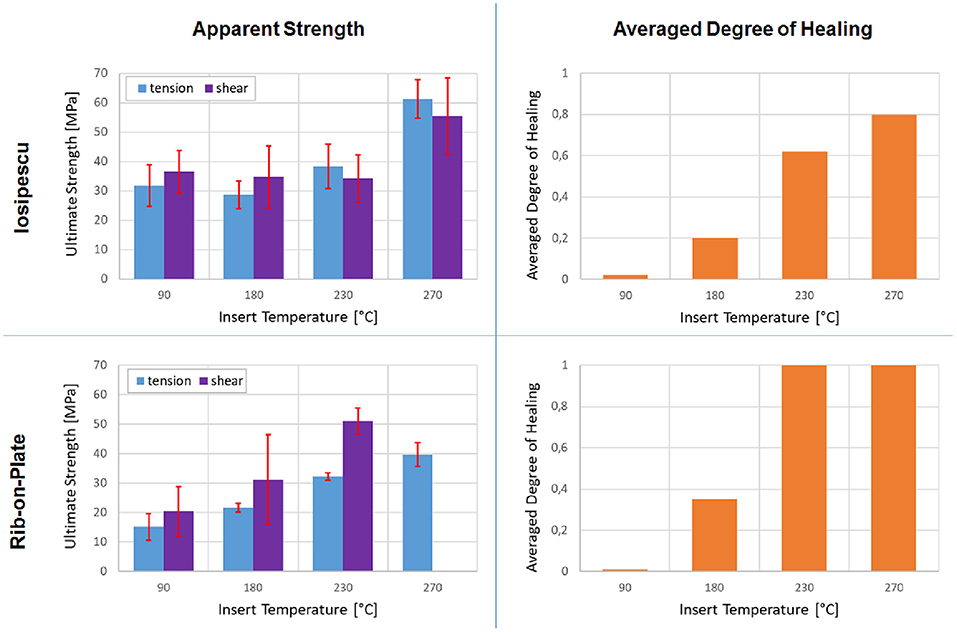
Figure 10. Measured apparent strength in tension and shear (left) and simulated averaged degree of healing results (right) for PA6: Iosipescu geometry (top) and Rib-on-plate (bottom).
The results for the Rib-on-plate specimens show a clear increase of the apparent strength with the insert temperature, for both tensile and shear loading. For logistical reasons no shear tests could be performed on specimens with 270°C insert temperature, so their apparent shear strength could not be reported. The scatter was lowest for the specimens tested in tension, whereas in particular the specimens with 180°C insert temperature showed very large scatter in their apparent shear strength.
The predicted average degree of healing, as to be expected, increases with insert temperature. This trend is partially confirmed by the mechanical testing results. The different coupon geometries and hence different thermal boundary conditions lead to different interface temperatures, from which full healing is predicted in the Rib-on-plate specimens for both higher insert temperatures, whereas the predicted healing is incomplete in all Iosipescu specimens, even for the 270°C inserts.
4.3. V-Shape
The rib-stiffened V-shape specimens were manufactured using the C/PAEK material system with a range of mold temperatures and a constant injection temperature of 380°C. Specimens manufactured with a mold temperature as low as 115°C had negligible interface strength and are left out of consideration here. By maintaining a packing pressure as high as 75 MPa, the specimens did not show any significant voids. In contrast to the simpler coupon specimens, the V-shape specimen does involve polymer flow along the overmolding interface. This causes the degree of healing to decrease from the gate to the final position of the flow front, which is confirmed by the example of the simulated degree of healing results in Figure 11A. As for the coupons before, the predicted degree of healing is higher in the center of the interface than along the edge. Small defects were observed along the edge of the ribs, which were removed by machining the bending specimens to a rectangular cross section. These process induced defects will be addressed in more detail in section 4.4.
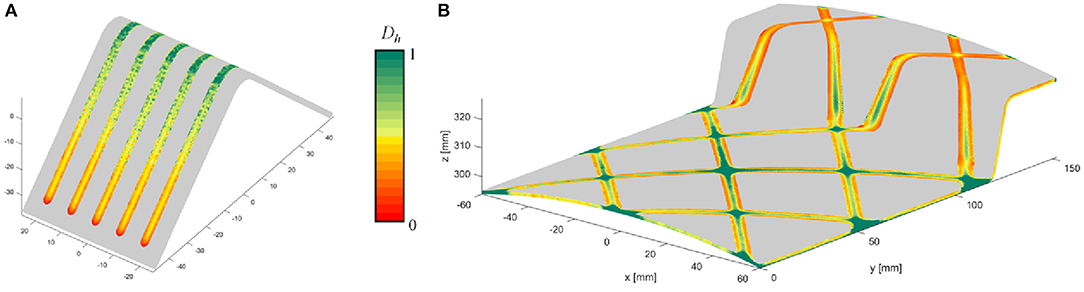
Figure 11. Degree of Healing prediction for the C/PAEK V-shape specimen (A) and grid stiffened curved panel (B). Process conditions: C, C.
The curved beam bending tests were monitored by high speed camera imaging, in order to observe the location of crack initiation. It was found that different types of failure occurred, as not only the interface but also the laminate insert and the overmolded rib can fail (see Figure 12 for a specimen after final failure). The initial fracture mode (as recorded by high speed camera imaging) was found to vary substantially between the test specimens, and correspondingly the scatter in the loads to failure was large. No definite conclusions could be drawn from these results, other than that there was not a significant difference in load for the different fracture mechanisms to initiate, where some mechanisms can and others cannot be related to the strength of the interface between the laminate insert and the over injected polymer.
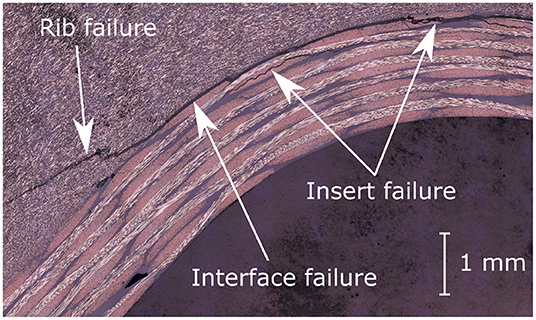
Figure 12. Rib, interface and laminate insert fracture after 4 point bending testing of a curved beam obtained from a V-shape specimen.
Better reproducibility was observed in the 3 point bending results of the beams obtained from the straight part of the V-shape specimens. High speed camera imaging (up to 250,000 frames per second) revealed that the failure started in most of the specimens on the interface between the laminate and the over injected polymer. In certain cases, this was followed by fracture of the insert and/or of the overmolded rib. Final fracture occurred rapidly after crack initiation. The recorded ultimate loads are summarized in Figure 13. It can be observed that the samples manufactured with a high insert temperature have small standard deviations; for the lower insert temperatures the standard deviations are larger. The average ultimate load increases with the insert overmolding temperature up to 220°C. This increase stagnates between 220°C and 240°C. The rib position in the V-shape specimen (“outer,” “middle,” “inner”) has no significant effect on the measured ultimate load. The specimens show a preference to fail at the end of the V-shape leg for the 3 point bending experiments. This indicates a weaker interface at the leg ends, analogous to the degree of healing simulation results shown in Figure 11. Quantitative analysis of the bending tests by means of structural Finite Element simulations showed that the interlaminar shear stress at the interface reaches 60 MPa at the point of failure of the high temperature samples. Due to the inhomogeneity of the specimens, also other stress components are large, especially the tensile stresses in the beam direction. Although acting parallel to the interface (and hence not directly affecting the interface loading), these tensile stresses may play a role in failure of the insert or the rib.
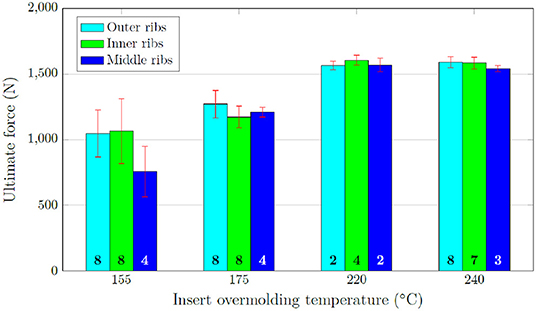
Figure 13. Ultimate loads for the 3 point bending interface characterization of overmolded C/PAEK specimens for different insert temperatures. The number in each bar denotes the amount of specimens in the sample.
4.4. Demonstrator Part
The C/PAEK grid stiffened curved panel was manufactured in both a dual step and a single step process. This demonstrator component was used for measurements of dimensional accuracy and inspection by means of cross-sectional microscopy only. These components were not subjected to mechanical testing. For the dual step process, the laminate was trimmed to size after forming, which was not needed in the single step process where the laminate was supported inside the injection mold by a specially developed clamping system. The simulation result in Figure 11B shows the familiar features: the predicted degree of healing is higher in the center of the interface than along the edge, and decreasing along the flow path. Figure 14 illustrates the observations made by microscopic inspection.
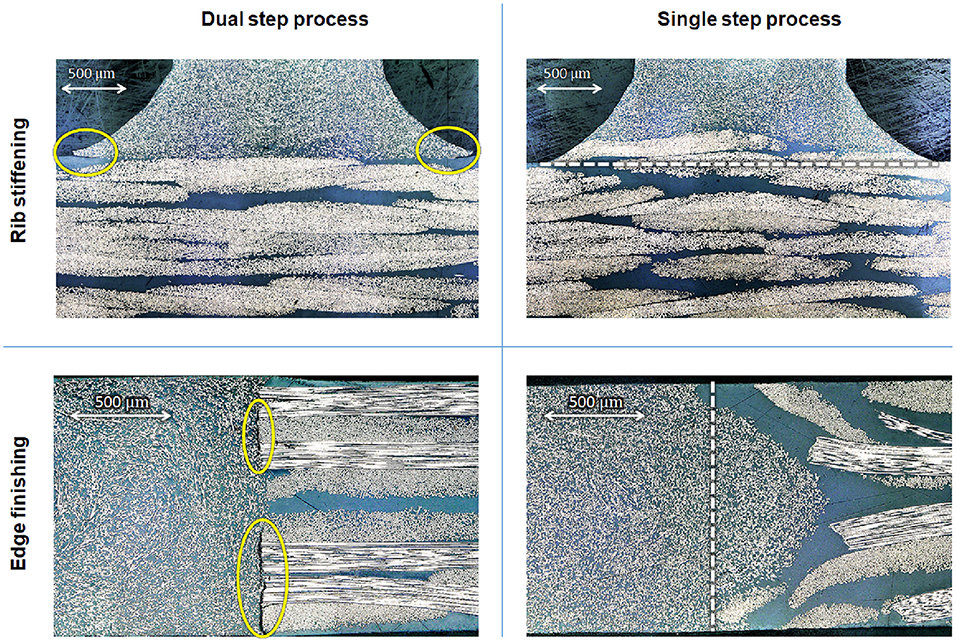
Figure 14. Defects and insert distortions in the C/PAEK grid stiffened curved panels. The yellow ellipses indicate process induced cracks, the dashed lines indicate the initially flat interfaces between laminate insert and the overmolded resin.
Small cracks were generated during the dual step process, which were attributed to rapid cooling and thermal shrinkage of the injected polymer resin, also in places with seemingly sufficient sustained flow along the insert/resin interface during overmolding. These cracks were observed for overmolding normal to the plane of the laminate (“Rib stiffening,” in the radius along the base of the ribs) as well as for overmolding in the same plane of the laminate (“Edge finishing,” especially where the resin touches the fiber ends). This suggests that the polymer resin has solidified at low melt pressure at these locations, before packing has been able to compensate for the thermal shrinkage. Similar cracks were observed in the C/PEAK rib stiffened V-shape, as mentioned before. The glass-reinforced PA6 coupon specimens did not show these defects.
The single step process involves forming and overmolding the laminate insert in melt condition. Firstly, this leads to de- and re-consolidation of the laminate. Figure 15 shows that the interfaces to be overmolded are not re-consolidated in the closed tool before resin injection. At these locations, the matrix material in the laminates can be observed to be squeezed out. The sink marks remaining after overmolding are slightly more apparent than in the parts manufactured using the dual step process. At these locations, the fibers in the laminate insert have moved into the rib. The interface is no longer at its original position (the dashed line) and the transition from laminate to rib seems to be less discrete, which may be beneficial for the mechanical performance. Secondly, the laminate can deform due to the polymer flow. The edges of the laminate are observed to be penetrated by the polymer melt, possibly even in such a way that the original interface can no longer be recognized. Again, this can be expected to significantly enhance the mechanical performance of the overmolded structure. Both phenomena (fiber migration and edge penetration) were also observed when performing microscopic inspection of the other test coupons made with the laminate in melt condition and appear to be typical for the single-step process.
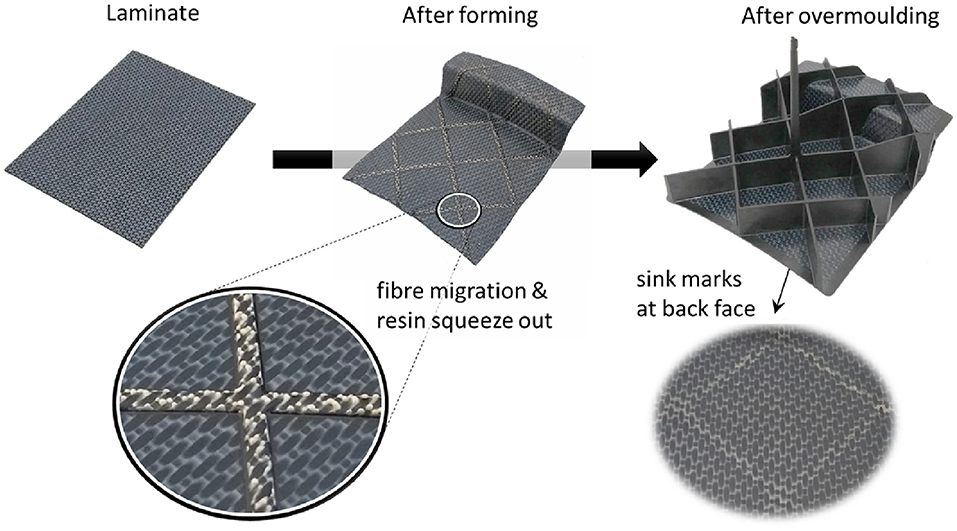
Figure 15. Forming induced deconsolidation and remaining sink holes after overmolding the C/PAEK grid stiffened curved panels.
5. Discussion
5.1. Healing Approach
A simplified model was proposed to describe the healing process in overmolded semi-crystalline polymer composites. In contrast to the more traditional model for amorphous thermoplastics, the novel degree of melting based model allows for chain mobility below the melting temperature and is able to predict strength development between Tg and Tm, which is also observed experimentally by mechanical testing. The currently available experimental data allow for a rudimentary implementation only. A generic model for crystallinity evolution, accurately describing the melting and solidification process for all appropriate heating and cooling rates, would improve the degree of melting prediction and hence would be expected to improve the accuracy of the predicted degree of healing as well. Ongoing research concentrates on this topic, using flash DSC to improve on the experimental data for crystallization and melting behavior at high heating and cooling rates.
Qualitatively, the trends in the degree of healing predictions, as a function of the processing temperatures, agree with those in the measured shear and tensile strengths of the laminate/resin interface. Both in general increase with the insert temperature (and hence the interface temperature) during overmolding, and so does the experimental scatter for most of the test results performed here. The increase in strength levels off once the laminate surface is above the melting temperature for a sufficient amount of time. The simulations show a flow length dependency in the predicted degree of healing: highest near the gate and decreasing toward the end of the flow. The test results of the short beams obtained from the rib stiffened V-shape seem to confirm this tendency, showing interface cracks on the side furthest remote from the injection gate. In addition, the simulations predict lower degrees of healing at the edges of the overmolded ribs. The experimental results show process induced cracks precisely at these edges, in the radii at the base of the stiffener ribs for both the rib stiffened V-shape and the grid stiffened panel.
The measured strengths in shear and tension are of similar magnitude for a single specimen shape. The apparent strength values are higher for the Iosipescu specimens than for the Rib-on-Plate specimens. Although these values should not be compared directly, the difference may also partially be attributed to the flash around the composite laminate in the Iosipescu specimen, alleviating local stress concentrations. These local (re)distributions of fibers and polymer matrix can be expected to have a large effect on the so-called interface strength. The current study once again reveals that the local idealized structure can be significantly altered during processing, which makes an accurate prediction of the structural performance of the composite quite complicated, requiring more than the classical intimate contact development and healing mechanisms only. Deconsolidation of a pre-consolidated laminate, as studied experimentally by Slange et al. (2018), will play a role when the laminate is brought into melt condition in the single step process, depending on the composite material and its thermomechanical history. Although some steps are taken to model the subsequent consolidation process during thermoforming (Xiong et al., 2019), an accurate model of the mesoscopic geometry of the fiber reinforcement at the interface after overmolding (involving deconsolidation as well as the subsequent interaction with the polymer melt) is still beyond current predictive capability. Nevertheless, when analysing the stress state at failure for the rib stiffened V-shape specimens, it was found that the maximum shear stress value is similar to interlaminar shear strengths of various C/PEEK laminates reported by e.g., Jang and Kim (1997), Gao and Kim (2002), and Gupta et al. (2002). This suggests that the mechanical performance of overmolded parts may well be suited for (semi) structural applications, provided the process conditions are sufficient to achieve a proper bonding. The proposed modeling approach can be a useful tool to optimize the processing conditions for this purpose.
5.2. Edge Finishing
The overmolding process can be used to mold a polymer edge around the composite laminate, thereby eliminating the need for trimming the laminate after forming. This can be considered a great benefit for larger series production, although adding some weight to the resulting component. It was found to be difficult to achieve an accurate fit of the composite insert in the mold, locally preventing this flow around the laminate, as experienced with the Iosipescu specimens. Smaller and larger gaps were, however, easily filled with the polymer resins used here. Both process variants (dual and single step) were found to have different characteristics. The components manufactured with the dual step process were shown to be sensitive to microcrack formation. First of all, the fibers on the laminate edges will lower the surface area where polymer interdiffusion can take place, likely reducing the maximum strength to be obtained. Further, especially carbon fibers will affect the local temperature evolution due to their high thermal diffusivity. Heat will be conducted quickly away from the interface, limiting time to develop sufficient bonding strength at the interface with the injected polymer resin. The cracks prominently normal to the fiber direction as observed in Figure 14 may be not coincidental. For edges to be overmolded in the dual step process, it thought beneficial to make the cavity locally thicker around the laminate insert's edge, providing more heat and preventing premature cooling before sufficient bonding strength has developed.
The components manufactured with the single step process, instead, were subject to resin penetration into the laminate edges. This deviation from the idealized local structure may well be advantageous, as the interface area between matrix and laminate increases, the matrix can be geometrically interlocked and a more gradual transition between polymer resin and composite laminate is formed, potentially alleviating local stress concentrations. In our experience, the overmolded edges form the single step process were well bonded to the composite laminate. This should be sufficient to satisfy the purpose of simple edge finishing, for which no major load transfer is expected between the laminate and the polymer resin.
5.3. Grid Stiffening
More prominently, overmolding is particulary suited to manufacture grid stiffened components in large series. The composite laminate is usually without dry fibers and hence has the maximum area available for polymer interdiffusion between laminate and resin. A classical injection molded design would use radii at the bottom of the rib to alleviate stress concentrations. It was found that rapid cooling of the resin in these regions, as experienced in the dual step process, can lead to microcracks, as the local pressure is low during fast solidification (such that thermal shrinkage cannot be compensated by packing) and the time for polymer healing is limited. Different mold designs, without the very thin gaps between laminate and mold, can help to prevent the occurrence of such process induced microcracks. Local thickening of the base of the ribs will, however, promote the occurrence and severity of dimensional inaccuracies such as process induced shape distortions and sink marks. The single step process showed no signs of the microcracks as observed in the dual step process. Instead, fiber migration was observed from the laminate into the ribs, increasing mechanical interlocking with the overmolded polymer and improving the strength of the interface. However, the fiber migration and thus local distortion of the fiber angles may influence the dimensional stability of the overmolded part.
6. Conclusion
First investigations were performed to elucidate the mechanical performance of overmolded structures, in particular concerning the strength development of the interface between the composite laminate and the polymer resin. A simple measure of the interface strength was introduced for semi crystalline polymers, based on the degree of melting of the crystalline phase, which as a first approximation was formulated in terms of the maximum interface temperature reached during the overmolding process. At lower interface temperatures this appeared to be a conservative estimate, i.e., lower than the actual measured interface strength. At higher interface temperatures, the composite laminate was observed to deform due to deconsolidation of the composite laminate and flow of the injected resin, transverse, along and into the fiber reinforcement, leading to a meso structure significantly different from the idealized flat separation between laminate and polymer. This has a large effect on the initiation and progression of cracks under sufficient mechanical loading, implying that the mechanical performance of the interfaces in overmolded structures cannot be predicted from only the idealized interface temperature evolution, no matter how accurately the temperature and crystallinity developments are modeled. The proposed degree of healing for semi crystalline polymers can, however, be used to define a suitable process window. Quantitatively accurate predictions of the effects of processing on the mechanical performance require further in-depth study, specific for the reinforcement structure and depending on the detailed part geometry, fiber and resin, and loading conditions.
Data Availability Statement
The datasets generated for this study are available on request to the corresponding author.
Author Contributions
MB performed the majority of the research work, with SW being responsible for the project management and accountable for the technical content and RA for the scientific level. RA compiled the manuscript, using technical reports, and draft sections written by MB and colleagues. All authors contributed to manuscript revision, read, and approved the submitted version.
Funding
This research was performed as part of the Composites OverMolding Production Technology (COMPeTE) project at TPRC. We gratefully acknowledge the financial and technical contributions of the industrial project partners Autodesk Inc., Harper Engineering, Johnson Controls GmbH, Kistler, Krauss Maffei, Safran Composites, SMP Deutschland GmbH, and Victrex plx, as well as the support funding from the Province of Overijssel for improving the regional knowledge position within the Technology Base Twente initiative.
Conflict of Interest
The authors declare that the research was conducted in the absence of any commercial or financial relationships that could be construed as a potential conflict of interest.
Acknowledgments
The authors further wish to thank Dr. Bert Rietman for initiating the COMPeTE project and our co-workers Thijs Donderwinkel, Coen Hartjes, Jeroen Houwers, and Erik Krämer for their contributions to the experiments and analyses.
Supplementary Material
The Supplementary Material for this article can be found online at: https://www.frontiersin.org/articles/10.3389/fmats.2020.00027/full#supplementary-material
References
Ageorges, C., Ye, L., Mai, Y.-W., and Hou, M. (1998). Characteristics of resistance welding of lap shear coupons. Composit. Part A Appl. Sci. Manufactur. 29, 911–919. doi: 10.1016/S1359-835X(98)00023-2
Akkerman, R., Rekers, G., and Huétink, J. (1995). “Finite element simulation of meltlines,” in Simulation of Materials Processing: Theory, Methods and Applications: Numiform '95, Proceedings 5th International Conference on Numerical Methods in Industrial Forming Processes, eds S.-F. Shen and P. Dawson (Rotterdam, NL: A.A. Balkema), 1007–1012.
American Society for Testing and Materials (2012). “ASTM D5379/D5379M-12 standard test method for shear properties of composite materials by the V-notched beam method,” in Annual Book of ASTM Standards, Vol. 15.03 (West Conshohocken, PA), 1–14.
American Society for Testing and Materials (2016). “ASTM D2344 / D2344M - 16 Standard test method for short-beam strength of polymer matrix composite materials and their laminates,” in Annual Book of ASTM Standards, Vol. 156.03 (West Conshohocken, PA), 1–16.
American Society for Testing and Materials (2013). “ASTM D6415 / D6415M - 06a(2013) standard test method for measuring the curved beam strength of a fiber-reinforced polymer-matrix composite,” in Annual Book of ASTM Standards (West Conshohocken, PA), Vol. 15.03, 1–10.
Awaja, F., and Zhang, S. (2015). Self-bonding of PEEK for active medical implants applications. J. Adhesion Sci. Technol. 29, 1593–1606. doi: 10.1080/01694243.2015.1037382
Boiko, Y. M., Guerin, G., Marikhin, V. A., and Prud'homme, R. E. (2001). Healing of interfaces of amorphous and semi-crystalline poly (ethylene terephthalate) in the vicinity of the glass transition temperature. Polymer 42, 8695–8702. doi: 10.1016/S0032-3861(01)00406-2
Bouwman, M. B., Donderwinkel, T., Krämer, E., Wijskamp, S., and Costa, F. (2016). “Overmolding - An integrated design approach for dimensional accuracy and strength of structural parts,” in CAMX 2016 - Composites and Advanced Materials Expo (Anaheim, CA), 26–29.
Butler, C. A., McCullough, R. L., Pitchumani, R., and Gillespie, J. W. Jr. (1998). An analysis of mechanisms governing fusion bonding of thermoplastic composites. J. Thermoplast. Comp. Mater. 11, 338–363. doi: 10.1177/089270579801100404
Colak, Z. S., Sonmez, F. O., and Kalenderoglu, V. (2002). Process modeling and optimization of resistance welding for thermoplastic composites. J. Comp. Mater. 36, 88–121. doi: 10.1177/0021998302036006507
Dara, P. H., and Loos, A. C. (1985). Thermoplastic Matrix Composite Processing Model. Technical Report CCMS 85-10, VPI-E-85-21, Virginia Polytechnic Institute and State University, Department of Engineering Science and Mechanics, Blacksburg, VA.
De Gennes, P. G. (1971). Reptation of a polymer chain in the presence of fixed obstacles. J. Chem. Phys. 55, 572–579. doi: 10.1063/1.1675789
Gao, S. L., and Kim, J. K. (2002). Correlation among crystalline morphology of PEEK, interface bond strength, and in-plane mechanical properties of carbon/PEEK composites. J. Appl. Polym. Sci. 84, 1155–1167. doi: 10.1002/app.10406
Giusti, R., and Lucchetta, G. (2014). Modeling the adhesion bonding mechanism in overmolding hybrid structural parts for lightweight applications. Key Eng. Mater. 611–612, 915–921. doi: 10.4028/www.scientific.net/KEM.611-612.915
Grouve, W., Warnet, L., Rietman, B., Visser, H., and Akkerman, R. (2013). Optimization of the tape placement process parameters for carbon-PPS composites. Comp. Part A Appl. Sci. Manufactur. 50, 44–53. doi: 10.1016/j.compositesa.2013.03.003
Gupta, V., Mathur, R. B., Dhami, T. L., and Bahl, O. P. (2002). Carbon/Kevlar/PEEK thermoplastic composites. High Perform. Polym. 14, 285–292. doi: 10.1177/095400830201400305
Jang, J., and Kim, H. (1997). Improvement of carbon fiber/PEEK hybrid fabric composites using plasma treatment. Polym. Comp. 18, 125–132. doi: 10.1002/pc.10267
Kim, Y. H., and Wool, R. P. (1983). A theory of healing at a polymer-polymer interface. Macromolecules 16, 1115–1120. doi: 10.1021/ma00241a013
Lafranche, E., Renault, T., and Krawczak, P. (2014). “Effect of the interdiffusion at the polymer/polymer interface on the flexural properties of over-moulded short glass fibre/glass fabric reinforced PA6 composites,” in Key Engineering Materials, Vol. 611–612, 821–828. doi: 10.4028/www.scientific.net/KEM.611-612.821
Lamèthe, J. F., Beauchêne, P., and Léger, L. (2005). Polymer dynamics applied to PEEK matrix composite welding. Aerospace Sci. Technol. 9, 233–240. doi: 10.1016/j.ast.2005.01.008
Lee, W. I., and Springer, G. S. (1987). A model of the manufacturing process of thermoplastic matrix composites. J. Comp. Mater. 21, 1017–1055. doi: 10.1177/002199838702101103
Levy, A., Le Corre, S., and Poitou, A. (2014). Ultrasonic welding of thermoplastic composites: a numerical analysis at the mesoscopic scale relating processing parameters, flow of polymer and quality of adhesion. Int. J. Mater. Forming 7, 39–51. doi: 10.1007/s12289-012-1107-6
Plummer, C. J., Bourban, P. E., Zanetto, J. E., Smith, G. D., and Månson, J. A. E. (2002). Nonisothermal fusion bonding in semicrystalline thermoplastics. J. Appl. Polym. Sci. 87, 1267–1276. doi: 10.1002/app.11528
Sauer, B. B., Kampert, W. G., Wakeman, M. D., and Yuan, S. (2016). Screening method for the onset of bonding of molten polyamide resin layers to continuous fiber reinforced laminate sheets. Comp. Sci. Technol. 129, 166–172. doi: 10.1016/j.compscitech.2016.04.030
Slange, T. K., Warnet, L. L., Grouve, W. J., and Akkerman, R. (2018). Deconsolidation of C/PEEK blanks: on the role of prepreg, blank manufacturing method and conditioning. Comp. Part A Appl. Sci. Manufactur. 113, 189–199. doi: 10.1016/j.compositesa.2018.06.034
Smith, G. D., Plummer, C. J., Bourban, P. E., and Månson, J. A. E. (2001). Non-isothermal fusion bonding of polypropylene. Polymer 42, 6247–6257. doi: 10.1016/S0032-3861(01)00060-X
Stokes-Griffin, C. M., and Compston, P. (2016). Investigation of sub-melt temperature bonding of carbon-fibre/PEEK in an automated laser tape placement process. Composit. Part A Appl. Sci. Manufactur. 84, 17–25. doi: 10.1016/j.compositesa.2015.12.019
Tierney, J., and Gillespie, J. W. (2006). Modeling of in situ strength development for the thermoplastic composite tow placement process. J. Comp. Mater. 40, 1487–1506. doi: 10.1177/0021998306060162
Walrath, D. E., and Adams, D. F. (1983). The losipescu shear test as applied to composite materials. Exp. Mech. 23, 105–110. doi: 10.1007/BF02328688
Xiong, H., Hamila, N., and Boisse, P. (2019). Consolidation modeling during thermoforming of thermoplastic composite prepregs. Materials 12, 10–18. doi: 10.3390/ma12182853
Yang, F., and Pitchumani, R. (2001). A fractal Cantor set based description of interlaminar contact evolution during thermoplastic composites processing. J. Mater. Sci. 36, 4661–4671. doi: 10.1023/A:1017950215945
Yang, F., and Pitchumani, R. (2002). Healing of thermoplastic polymers at an interface under nonisothermal conditions. Macromolecules 35, 3213–3224. doi: 10.1021/ma010858o
Keywords: thermoplastic composites, overmolding, interface, healing, semi crystalline polymer, process simulation
Citation: Akkerman R, Bouwman M and Wijskamp S (2020) Analysis of the Thermoplastic Composite Overmolding Process: Interface Strength. Front. Mater. 7:27. doi: 10.3389/fmats.2020.00027
Received: 21 October 2019; Accepted: 22 January 2020;
Published: 14 February 2020.
Edited by:
Patricia Krawczak, IMT Lille Douai, FranceReviewed by:
Philippe Boisse, Institut National des Sciences Appliquées de Lyon (INSA Lyon), FranceAlessandro Pegoretti, University of Trento, Italy
Eric Lafranche, IMT Lille Douai, France
Copyright © 2020 Akkerman, Bouwman and Wijskamp. This is an open-access article distributed under the terms of the Creative Commons Attribution License (CC BY). The use, distribution or reproduction in other forums is permitted, provided the original author(s) and the copyright owner(s) are credited and that the original publication in this journal is cited, in accordance with accepted academic practice. No use, distribution or reproduction is permitted which does not comply with these terms.
*Correspondence: Remko Akkerman, r.akkerman@utwente.nl