Multiphase Model for the Prediction of Shrinkage Cavity, Inclusion and Macrosegregation in a 36-Ton Steel Ingot
 Mengye Xie
  Houfa Shen*
- Key Laboratory for Advanced Materials Processing Technology, Ministry of Education, School of Materials Science and Engineering, Tsinghua University, Beijing, China
A five-phase model consisting of a liquid phase, columnar dendrites, equiaxed grains, air, and inclusion (discrete phase) is developed to predict the shrinkage cavity, inclusion distribution and macrosegregation simultaneously during solidification of a 36-ton steel ingot. The air phase is introduced to feed the shrinkage cavity and no mass or species exchange with other phases occurs. The transport and entrapment of inclusions are simulated using a Lagrangian approach. The predicted results agree well with the experimental results. The characteristics of inclusion distribution are better understood. A thin layer of inclusions tends to form close to the mold wall, and more inclusions reside in the last solidified segregation channels. The inclusion is easy to aggregate near the riser neck, and it is dragged by the solidification shrinkage. The influence of the inclusion on macrosegregation is comparatively small, while the solidification shrinkage affects the formation of macrosegregation significantly and makes the simulation result more accurate.
Introduction
Large steel ingots have been widely used in a variety of industries, such as new-generation nuclear power plants, ship building, aerospace equipment and industrial machinery. Macrosegregation and shrinkage cavity are two concomitant casting defects mainly resulting from density difference between liquid and solid phases during solidification. The inclusion is also a defect in steel products. These defects have been the subject of extensive studies for decades. Controlling of shrinkage cavity, inclusion and macrosegregation is essential to ensure the quality of large steel ingots, and numerical simulation is one effective research method.
Macrosegregation is generally believed to be a compositional heterogeneity widely found in large-scale or complex ingots/castings. In 1970s, Hultgren (1973) proposed that macrosegregation results from the relative flow between the liquid and solid phases during solidification, which is caused by many factors, i.e., thermal-solutal buoyancy, floatation or sedimentation of free moving grains or inclusions, fluid flow induced by solidification contraction, stirring, and deformation.
Since Fujii et al. (1979) introduced the first mushy zone model in the 1970s, numerical models to predict macrosegregation have been developed. In the 1990s, Wang and Beckermann (1996) took the grain sedimentation and melt convection into account. After that, Combeau et al. (2009) studied the influence of the morphology and motion of equiaxed grains on macrosegregation with a two-phase model. Wu and Ludwig (2005) presented a three-phase model containing liquid, equiaxed and columnar phases. The negative segregation cone at lower part of the ingot induced by grain sedimentation, was well predicted. Later, Wu et al. (2010a) and Wu et al. (2010b) extended this three-phase model to a five-phase model, treating the interdendritic melt of both columnar dendrites and equiaxed grains as independent phases. Using this model, Wu et al. (2017) analyzed the formation of macrosegregation and columnar-to-equiaxed (CET) transition during solidification of an Al-4wt%Cu ingot. It was verified that thermal-solutal convection and sedimentation of equiaxed grains are key mechanisms governing the formation of macrosegregation. The CET is predominated by the competitive equiaxed/columnar growth and the soft and hard blocking mechanisms. Ge and Li et al. (2016) used a three-phase model to predict the macrosegregation of ingots with different scales, and investigated the effects of ingot size on the formation of macrosegregation. Duan et al. (2016) casted a 36-ton steel ingot and provided sufficient data of macrosegregation by chemical analysis. Typical macrosegregation features such as negative segregation at the bottom and positive segregation at the top were observed. Besides, the negative segregation near the riser-neck was found. Chen and Shen (2020) proposed a three-phase model of liquid phase, columnar dendrites, and equiaxed grains, to simulate the evolution of macrostructure and macrosegregation in a 36-ton steel ingot.
The solidification shrinkage is an important driving force causing mass movement which leads to macrosegregation. (Fujii et al., 1979) Hence, it is important to consider the shrinkage cavity in macrosegregation models by introducing an additional air phase. Wu et al. (2015) presented a four-phase volume-averaged model for the prediction of macrosegregation and shrinkage cavity of a 2.45-ton steel ingot. Xia et al. (2017) developed a four-phase dendritic model to predict the macrosegregation, shrinkage cavity, and porosity during solidification in a 55-ton ingot in both 2D and 3D cases. Wu et al. (2017) elucidated a four-phase 3D model to calculate the macrosegregation and shrinkage cavity during solidification of a 10.5-ton steel ingot. Ren et al. (2018) employed a four-phase model to simulate the formation of macrosegregation, as-cast structure and shrinkage cavity of an Al-4.5wt%Cu ingot. The shrinkage cavity significantly affects the formation of positive segregation at the hot top during the last stage of solidification.
Nevertheless, few of the models considered the influence of inclusion. According to investigations of Li et al. (2014), the inclusion phase is essential in the formation of channel segregation. The transport of moving inclusions is also an important driving force disturbing the local fluid flow. Thus, the inclusion should be included in multiphase models of macrosegregation. A multiphase dendritic solidification model under the Euler–Lagrange framework was established by Cai et al. (2019) to characterize the effect of inclusions on macrosegregation in steel ingots. Inclusions were treated as a discrete phase to simulate their motion and interaction with fluid flow. However, up to now, there are few investigations on the combination of inclusions, shrinkage cavity and macrosegregation during the solidification of an ingot.
In this study, air and inclusion are considered in a new multiphase model based on the three-phase model by Chen and Shen (2020), to comprehensively simulate the shrinkage cavity, inclusion and macrosegregation distribution in a 36-ton steel ingot. Additionally, the influence of shrinkage cavity and inclusion on macrosegregation is investigated. The simulation results are compared with the experimental results for verification of the model.
Model Description
The model consists of five phases: liquid phase, columnar dendrites, equiaxed grains, air and inclusion. The conservation equations of mass, momentum, species, and enthalpy for each phase are solved simultaneously with a volume-averaged approach. The air phase is only employed to feed the shrinkage cavity, and there is no mass or species exchange with other phases. At the same time, a set of equations describing the nucleation and growth of equiaxed grains are supplemented into the five-phase model. A Lagrange approach is adopted to describe the transport and capture of the inclusion particles. The equations of the model are listed below with the variables declared in the nomenclature. It should be noted that this five-phase model can be simplified as four-phase or three-phase if the solidification shrinkage or inclusion is not considered.
Conservation Equations for Macrosegregation
Mass:
Momentum:
Species:
Enthalpy:
Kinetics of Grain Growth
Equiaxed Nucleation Density:
Equiaxed Nucleation Rate:
Growth rate for columnar dendrites and equiaxed grains:
Lagrange Formulation for Inclusion
Mixture Concentration of Species
Physical Properties
Density:
Drag coefficient for each couple of phases linked in momentum equations:
Viscosity for Equiaxed Grains:
The main assumptions and explanations of the model are summarized as follows.
(1) This model accounts for the macrostructure, including the columnar to equiaxed transition. Cylindrical columnar dendrites extend from the mold wall to ingot center. Once the calculation volume of a cell is packed by the equiaxed grains at a critical fraction 0.49, the growth of columnar dendrites is stopped.
(2) Carbon is a sensitive segregated element during solidification, and the cast steel is simplified as a binary alloy for simulation.
(3) The volume of the discrete phase of inclusion is ignored, and the volume fractions of liquid phase (l), columnar dendrites (c), equiaxed grains (e) and air (a) sum up to 1.
(4) There is no mass transfer between air and the other three phases. The air phase is to compensate the volume contraction of metal from solidification shrinkage, and is immiscible with other phases.
(5) The columnar phase is stationary (
(6) The thermodynamic equilibrium condition is always applied at the liquid-solid interface. Volume-averaged concentrations of the three metal phases (
(7) To balance the temperature difference among the liquid phase, columnar dendrites, and equiaxed grains, a large volumetric heat-transfer coefficient H* is applied.
(8) During solidification, the growth rate of the columnar tip is integrated in each time step to obtain the forward displacement of the tip. The free-floating equiaxed grains nucleate anywhere the undercooling is achieved. Furthermore, remelting is also considered in this model.
(9) The kinetics of grain-growth for columnar dendrites and equiaxed grains is governed by species diffusion. In Eq. 16, the concentration difference (
(10) The drag coefficient Kpq for each couple of phases is defined by Eq. 25. The subscript p denotes the primary phase and q denotes the secondary phase. Mpq is a large empirical value.
(11) The solidification shrinkage only leads to the formation of shrinkage cavity.
(12) Transport and entrapment of the inclusions is simulated using a Lagrange approach. The motion of each particle is tracked by solving the force balance equation (Eq. 17). The forces imposed on a single particle include gravity, buoyancy force, drag force, virtual mass force Fvm, and pressure gradient force FP.
(13) All the particles are independent of each other, and no collision or condensation is considered.
(14) It is assumed that no mass or solute transfer occurs between the discrete phase and other continuous phases.
(15) At the beginning of the simulation, 14,000 particles are injected and located randomly in the calculation domain with
(16) The inclusions are set as inert spheres of alumina, since alumina is the most common inclusion in steel ingot. Particle size distribution of inclusions conforms to Rosin-Rammler distribution, and the distribution range is 1–120 μm.
Ingot Mold Configuration and Experiment
The five-phase model was applied to a 36-ton steel ingot using a 2D axisymmetric grid. The initial carbon concentration is 0.51 wt%. This ingot was cast and chemically analyzed at China International Trust and Investment Corporation (CITIC) Heavy Industries Co., Ltd. The characteristics of the ingot and mold, and the boundary and initial conditions are shown in Figure 1. The filling process was neglected, i.e., the initial distribution of temperature and concentration was uniform. The thermodynamic and physical properties for the simulation are listed in Table 1.
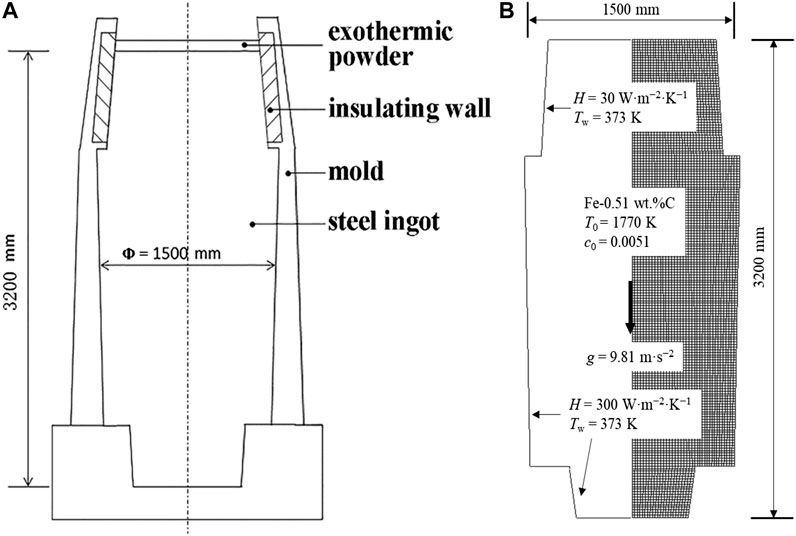
FIGURE 1. Schematic of the 36-ton steel ingot: (A) ingot and mold dimensions, (B) boundary and initial conditions for simulation.
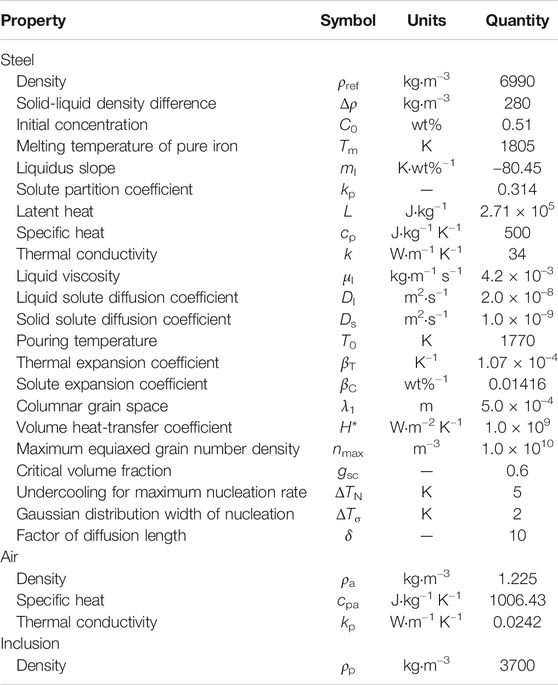
TABLE 1. Thermodynamic and Physical Properties used in the simulation.
The 36-ton ingot was cut along the axial plane, and details were reported by Duan et al. (2016). A plate of 500 mm thickness was sliced and cut along the centerline into two halves. 1800 sample points covering the half plate completely were drilled for chemical analysis using an infrared carbon-sulfur analyzer.
The carbon concentration of the ingot was extracted along the centerline and three horizontal lines at different heights of 0.6 m, 1.8 m, and 2.8 m, respectively. Macrosegregation was represented by segregation index calculated with the formulation
Results and Discussion
In order to investigate the influence of solidification shrinkage and inclusion on macrosegregation, four numerical cases are carried out by using the five-phase model or its simplified form with identical thermodynamic and physical properties. Here, it is termed that the “five-phase model” means with the consideration of both solidification shrinkage and inclusion; “four-phase shrinkage model” means with the consideration of solidification shrinkage but no inclusion; “four-phase inclusion model” means with the consideration of inclusion but no shrinkage; “three-phase model” means without the consideration of both solidification shrinkage and inclusion.
Influence of Shrinkage on Macrosegregation
Figure 2 shows the predicted solidification sequence by using the four-phase shrinkage model, including the growth of the two solid phases, the melt velocity, the sedimentation velocity of equiaxed grains, and the formation of shrinkage cavity. The melt flow is driven by three forces: 1) the thermal buoyancy force, leading to the downward flow; 2) the solutal buoyancy force, leading to the upward flow; 3) the sedimentation of equiaxed grains, dragging the surrounding melt downwards. The predicted macrosegregation according to the solidification sequence is shown in Figure 3, represented by contours of segregation index (SI).
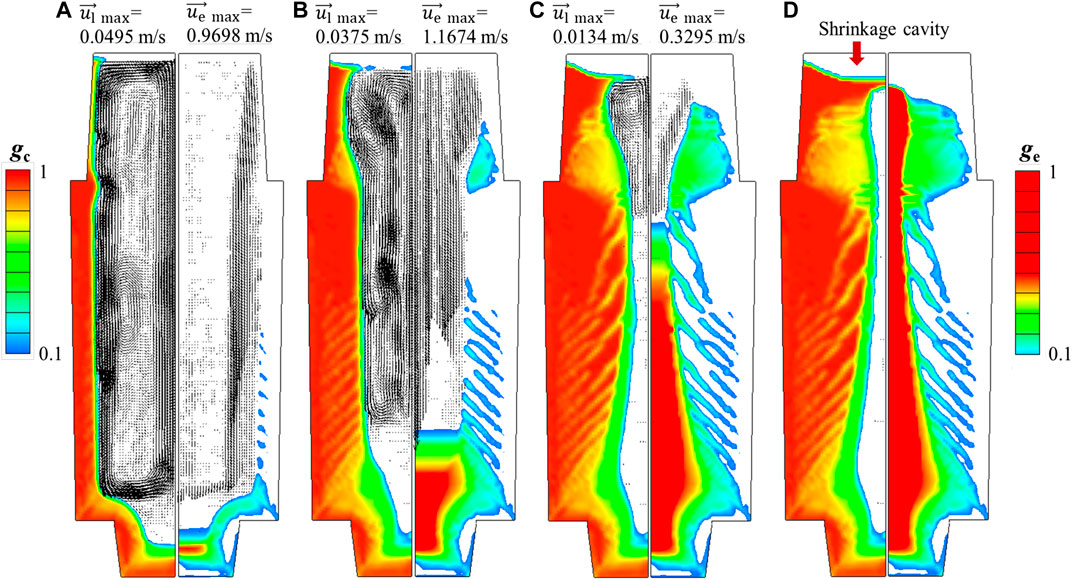
FIGURE 2. Predicted solidification sequence of the four-phase shrinkage case in the 36-ton ingot at different times: (A) 0.5 h, (B) 2 h, (C) 5 h, (D) end of solidification. The left half shows the columnar volume fraction (gc), and the melt velocity (ul, arrows). The right half shows the equiaxed volume fraction (ge), and the sedimentation velocity (ue, arrows).
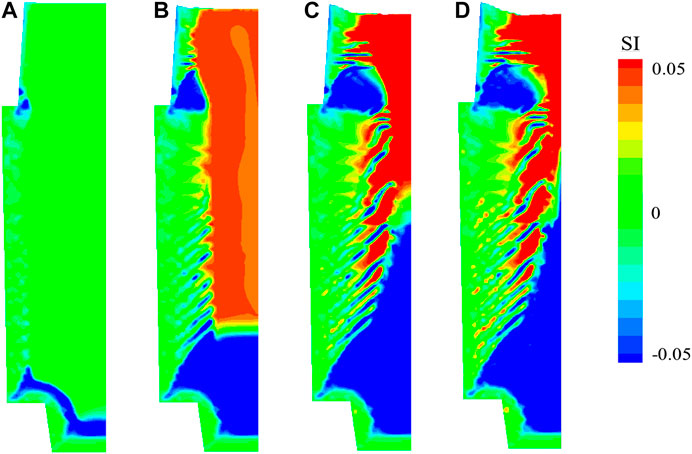
FIGURE 3. Predicted segregation index (SI) in the left half of the 36-ton ingot at different times: (A) 0.5 h, (B) 2 h, (C) 5 h, (D) end of solidification.
At 0.5 h (Figure 2A), the melt close to the mold wall has a lower temperature and higher density. The density difference between liquid and solid causes the melt to flow from the upper to lower region of the ingot along the columnar tip with a maximum velocity of 0.0495 m/s. Then, this melt flow diverts to an upward direction at the bottom and rises at the center of the ingot, forming a symmetrical anticlockwise circulation in the left half. The solidification at this stage is rapid owing to the chilling effect of the mold wall. The columnar dendrites grow against the mold wall to the center of the ingot. Meanwhile, equiaxed grains nucleate and grow in the front columnar tips. Competitive growth between the two solid phases appears. Due to the large temperature gradient, the growth of columnar dendrites dominates in this period, and the nucleation and settlement of equiaxed grains are not strong. There is no obvious outflow of the solute-enriched interdendritic melt from the mushy zone, since the columnar dendrites grow fast. Therefore, the solidified shell formed at this stage has a concentration identical to the initial value (Figure 3A).
At 2 h (Figure 2B), the nucleation and growth of equiaxed grains becomes dominant. More equiaxed grains settle and accumulate in the lower part of the ingot, with a maximum velocity of 1.674 m/s, while the velocity of melt reduces to 0.0375 m/s. A broad mushy zone consisting of settled equiaxed grains and melt forms at the bottom of the ingot. A negative segregation is observed in the lower part of the ingot (Figure 3B) as well.
At 5 h (Figure 2C), the solidified shell is thick. The further reduction of the temperature gradient leads to a further reduction in the cooling rate and the weakening of natural convection. The maximum velocity of the convective liquid phase is reduced to 0.134 m/s. At this stage, more equiaxed grains nucleate and grow adhering to the solidification front without settling. A conic negative segregation forms in the lower part, and streak-like A-type segregations form in the middle part of the ingot (Figure 3C). In addition, a negative segregation is observed close to the riser neck, while a positive segregation zone is located at the hot top. Further details of the segregation index (SI) will be discussed later.
In the final stage of solidification (Figures 2D,3D), the solute concentration in the remaining liquid at the top of the ingot is high, and the temperature becomes more uniform. Hence, such solidification is sustained for a long time, and equiaxed grains in the remaining liquid can sufficiently develop. Consequently, the volume fraction of equiaxed grains at the hot top is higher than in other regions. Due to the compensation of air for the volume contraction of solidifying metal, the shrinkage cavity forms at the hot top, and this process starts from the beginning of solidification.
It can be found from Figure 2 that the structure adjacent to the mold wall is dominated by columnar dendrites, while equiaxed grains occupies the inner part of the ingot. Moreover, the distribution of equiaxed crystals in the middle part of the ingot shown in the right panel of Figure 2 exhibits a similar morphology with the A-type channel segregation shown in Figure 3. A possible reason is that the settling equiaxed grains tends to stay and grow in the channels to hinder the growth of columnar crystals. The CET can also be observed in Figure 2D, which is triggered in the lower and upper regions for different reasons. In the lower part of the ingot, the growth of columnar dendrites is suppressed by the settled equiaxed grains due to the hard block effect (Li et al., 2014), while in the upper part, it is owing to the lack of undercooling.
Typical features of macrosegregation distribution can be found in Figure 3D, including the positive segregation at the hot top, the negative segregation cone in lower part of the ingot, the A-type channel segregation in the middle part and the negative segregation near the riser neck. The negative segregation cone is mainly caused by the sedimentation of equiaxed grains with lower composition, and the solute loss owing to the outflow of solute-rich melt from the mushy zone at the bottom. The A-type channel segregation results from the solidification fluctuation of the solid phase due to fluctuations of constitutional undercooling, and the flow of the solute-rich liquid phase. The positive segregation at the hot top forms because the remaining liquid contains a high concentration of solute. The negative segregation near the riser neck is a result of the specific relationship between liquid flow and temperature gradient in this region. The configuration of the mold and the insulation ability of the hot top also play an important role.
To illustrate the influence of solidification shrinkage on the formation of macrosegregation, simulation without consideration of shrinkage (three-phase model) is also carried out, and both numerical results are compared together with the concentration measurements at definite positions in the ingot.
Figure 4 shows the comparison of simulated segregation index (SI) along the ingot centerline with the practice. It can be observed that: 1) along the whole centerline of the ingot, the result with four-phase shrinkage model is much closer to the measurements compared to that without shrinkage; 2) in the lower part of the ingot, the negative segregation without shrinkage is a bit more severe; 3) in the hot top region, the formation of the shrinkage cavity reduces the range and severity of the positive segregation significantly; 4) in the negative segregation zone near the riser neck, the range and severity of segregation are both reduced.
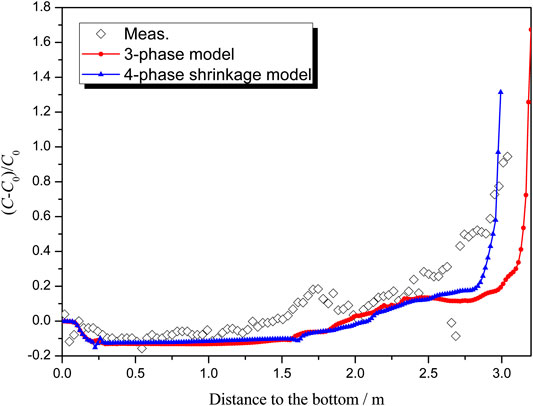
FIGURE 4. Comparison of segregation index along the centerline of the ingot between experimental results and simulated results of the three-phase model and the four-phase shrinkage model.
Influence of Inclusion on Macrosegregation
In order to elucidate the influence of inclusion on macrosegregation, a four-phase inclusion model was implemented to illustrate the evolution of inclusion during the solidification and the final macrosegregation. Figure 5 shows the predicted inclusion distribution and the growing process of columnar and equiaxed crystals in the 36-ton ingot.
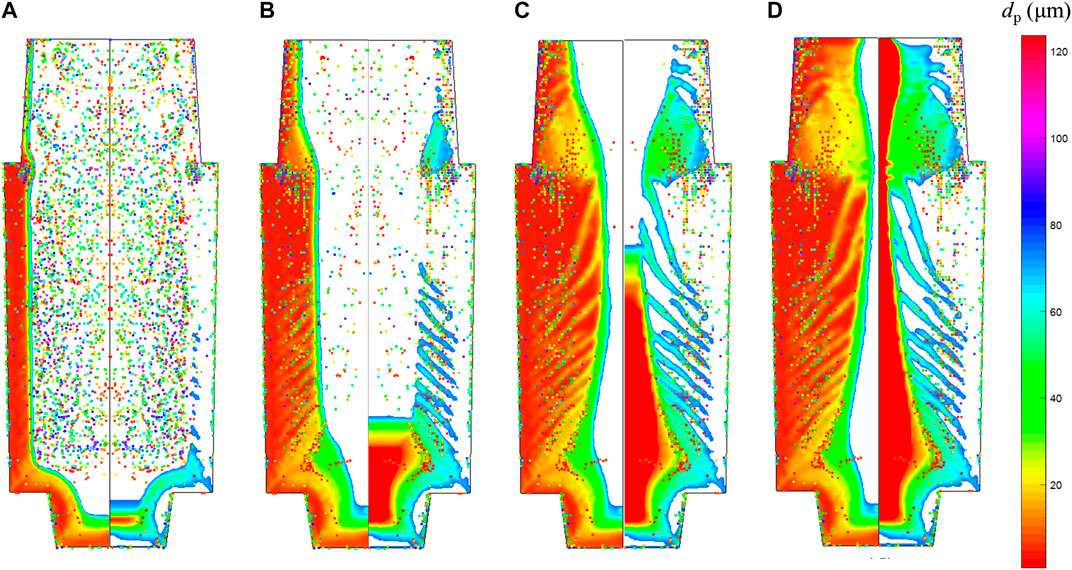
FIGURE 5. Predicted inclusion distribution and growing process of columnar and equiaxed crystals in the 36-ton ingot with the four-phase inclusion model at different times: (A) 0.5 h, (B) 2 h, (C) 5 h, (D) end of solidification. Inclusion particles are represented by colored dots with different diameters. The left half shows the columnar volume fraction, and the right half shows the equiaxed volume fraction.
In the early stage of solidification (Figure 5A), due to the large temperature gradient, the solidification is fast, and a thin layer of inclusions close to the mold wall and bottom is captured. The motion of most inclusions is affected by the fluid flow in the liquid. Inclusions near the solidification front are carried down by the downward liquid flow, and are carried upward by the liquid flow in the center of the ingot. Meanwhile, inclusions eligible for capture are entrapped in the solid shell.
At 2 h (Figure 5B), it can be observed that the distribution of inclusions in the middle part of the ingot is accordant with the location of equiaxed crystals (the right panel of figure). It is obvious that inclusions aggregate near the riser neck.
At 5 h (Figure 5C), the consistency between the distribution of inclusions and equiaxed crystals is more obvious. The size of inclusions is close to equiaxed grains. The channels solidify in the final stage where the temperature gradient is small, and the solidification time is long. More inclusions are easy to gather here. The melt in the channels solidifies and forms equiaxial crystals finally. As a result, the channels contain equiaxed crystals and more inclusions. In other words, the distribution orientation of inclusions is consistent with the morphology of the channels.
After solidification, the characteristics of inclusion distribution are summarized as follows: 1) inclusions with a smaller size are mainly in lower part of the ingot, while inclusions with a larger size tend to locate in upper part; 2) a thin layer of inclusions forms near the mold wall; 3) more inclusions reside in the last solidified segregation channels; 4) there is an aggregate of inclusions near the riser neck. For further research on inclusion in steel ingots, detailed experimental supports are still required.
For the comparison of coupling effect of inclusion on macrosegregation, the results of the three-phase model without inclusion and the four-phase model with inclusion are indicated. Figure 6 shows segregation index in the longitudinal section of the ingot, while Figure 7 shows comparison of segregation index along the centerline of the ingot. It can be concluded that the inclusion affects the formation of macrosegregation slightly.
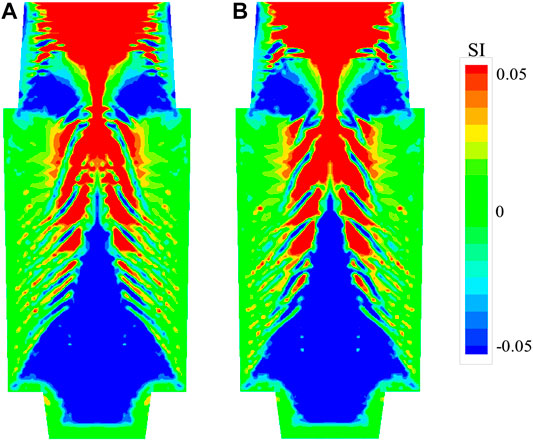
FIGURE 6. Segregation index (SI) in the longitudinal section of ingot: 1) simulation result of the three-phase model, 2) simulation result of the four-phase inclusion model.
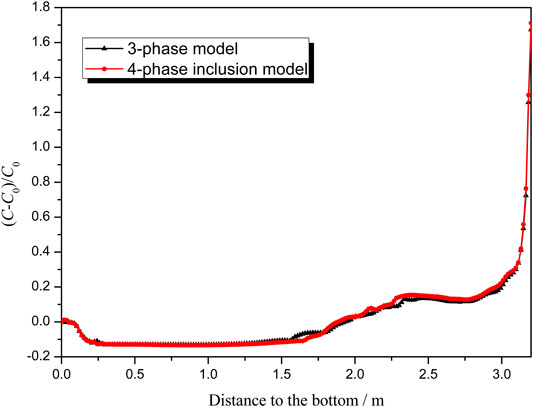
FIGURE 7. Comparison of segregation index along the centerline of the ingot between the simulation results of the three-phase model and the four-phase inclusion model.
Due to the limitations of the discrete phase model, the inclusion particles are set as inert and spherical. Besides, the nucleation, aggregation, and growth of inclusion particles during solidification are not considered in this model. Thus, there are no chemical reactions, species transfer or mass transfer occurring between the inclusion and other phases such as solid and liquid. Owing to the interaction forces between inclusion particles and the liquid around, the inclusion particles can change the surrounding flow field when moving in the liquid, and further change the surrounding concentration, in turn affecting the formation of macrosegregation during solidification. As a result, the influence of the inclusion on macrosegregation is underestimated in the current model. Whereas, solidification shrinkage can significantly change the liquid flow, and influence mass and species transfer further. The change is comparatively macroscopic, and affect the whole domain. Therefore, the influence of inclusion on macrosegregation is smaller than that of solidification shrinkage in this research.
Influence of Shrinkage and Inclusion on Macrosegregation
With the consideration of shrinkage and inclusion, the five-phase model were performed to predict the shrinkage cavity, inclusion distribution and macrosegregation contemporaneously. Figure 8 shows the evolution of solidification structure and inclusion distribution. The general distribution in Figure 8 is similar to that in Figure 5 except the shrinkage effect.
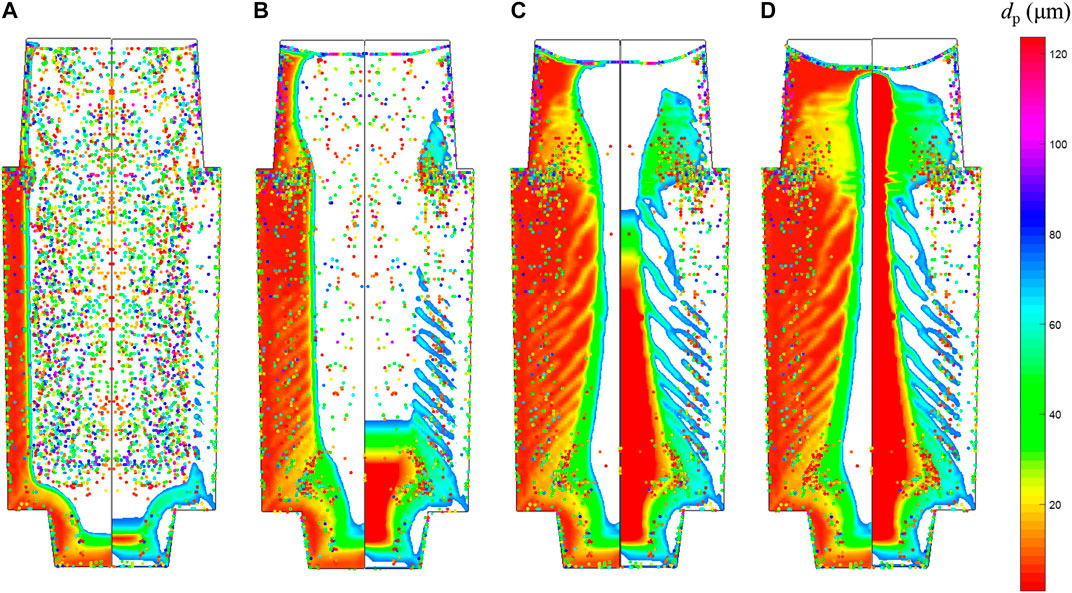
FIGURE 8. Predicted inclusion distribution and growing process of columnar and equiaxed crystals in the 36-ton ingot with the five-phase model at different times: (A) 0.5 h, (B) 2 h, (C) 5 h, (D) end of solidification. Inclusion particles are represented by colored dots with different diameters. The left half shows the columnar volume fraction, and the right half shows the equiaxed volume fraction.
In order to compare with the effect of solidification shrinkage on macrosegregation, the inclusion distribution and macrosegregation without shrinkage are shown in Figure 9A, while those with shrinkage shown in Figure 9B.
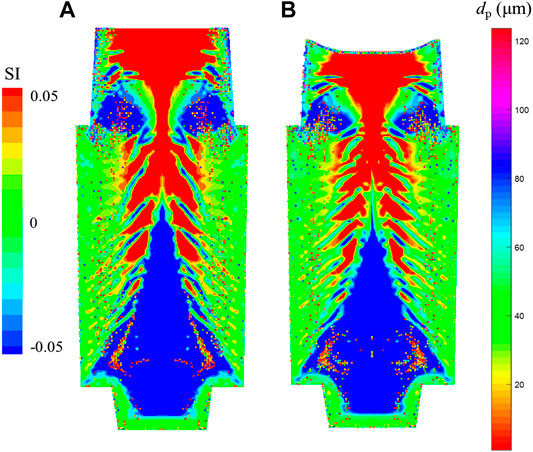
FIGURE 9. Predicted inclusion and macrosegregation distribution after solidification: (A) simulation result of the four-phase inclusion model, (B) simulation result of the five-phase model. Inclusion particles are represented by colored dots with different diameters.
Apart from the features of inclusion distribution mentioned above, inclusions are dragged by the solidification shrinkage when moving with the liquid phase, forming a layer of inclusions near the surface of shrinkage cavity. In addition, there are more inclusions located near the center of the ingot in Figure 9A than that in Figure 9B. Due to the influence of solidification shrinkage, the volume contraction of the solidifying metal affects the flow field, and the solidification time is shorter. Thus, the convection of the remaining melt is more sufficient at the later stage of solidification, and the tendency of inclusions to reside in the channels is reduced.
For the overview of the coupling effects of solidification shrinkage and inclusion on macrosegregation, the four models are compared and summarized with identical thermodynamic and physical properties, i.e., a three-phase model without shrinkage or inclusion, a four-phase shrinkage model without inclusion, a four-phase inclusion model without shrinkage, and the five-phase model with shrinkage and inclusion. The macrosegregation maps of the four cases are presented in Figures 10A–D in sequence. The effects of solidification shrinkage and inclusion on macrosegregation are as follows: 1) the range and severity of the negative segregation in lower part of the ingot and near the riser are reduced; 2) the range and severity of the top-located positive segregation are also reduced; 3) the number of channels in the middle part of the ingot is smaller. In addition, these effects in the five-phase case are the most obvious among the four cases.
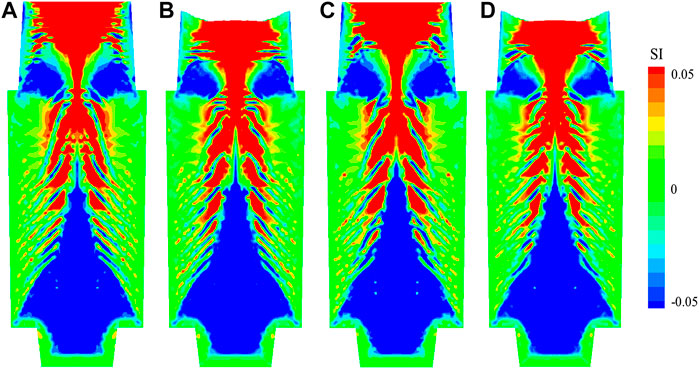
FIGURE 10. Segregation index (SI) in the longitudinal section of ingot of different cases: (A) the three-phase case without shrinkage or inclusion, (B) the four-phase shrinkage case, (C) the four-phase inclusion case, (D) the five-phase case.
For the sake of the reliability of the model, comparison of measured and calculated segregation index (SI) along the four lines with different model considerations is shown in Figure 11.
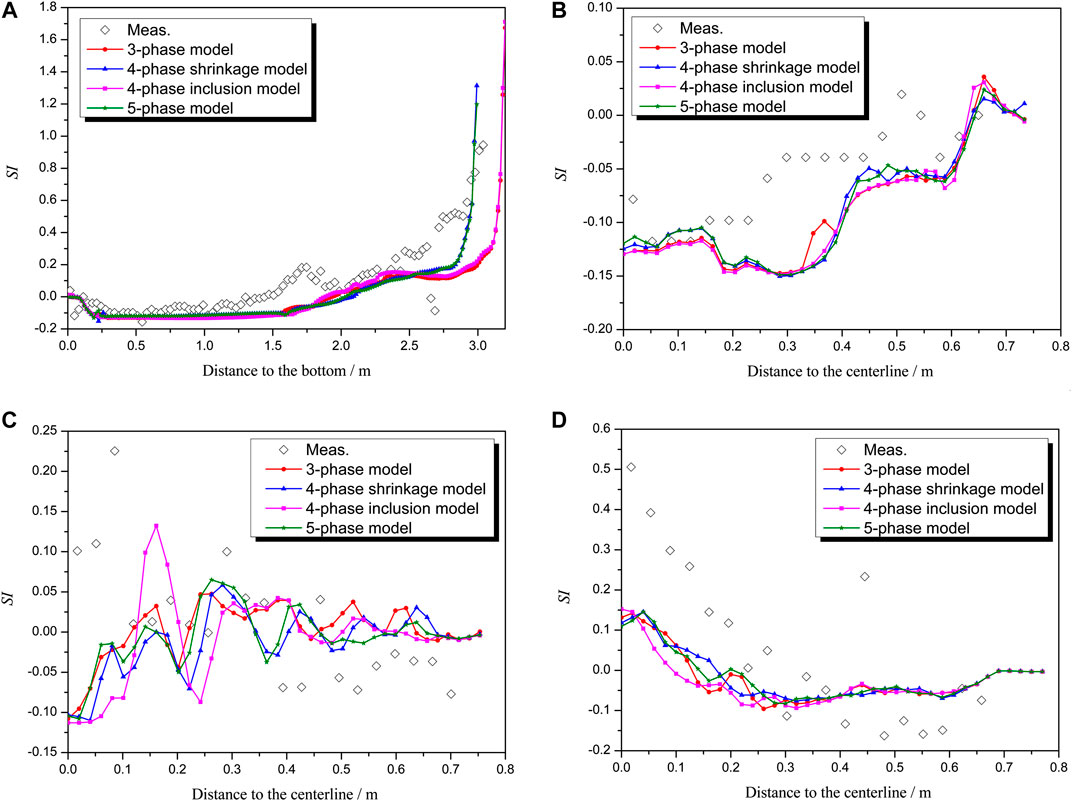
FIGURE 11. Comparison of segregation index (SI) between measurements and simulation results in a cross section of the ingot: (A) along the centerline; (B–D) along the horizontal lines at the heights of 0.6 m, 1.8 m, and 2.8 m respectively.
Figure 11A shows that the model result with solidification shrinkage is very consistent with the measurement whether the inclusion is considered or not. The negative segregation cone occupies about 1/3 of the ingot height. The maximum value of the segregation index is approximately −0.15, compared to measurement value −0.10. This may be attributed to the fact that the model adopted in this study does not consider the solute transport across the liquid-grain interface of solute-rich interdendritic melt during the growth of equiaxed grains, leading to an underestimation of solute concentration.
The predicted concentration in the bottom side of the centerline is close to the initial value before solidification, which agreed well with the measurements. The hot-top positive segregation occupies about 1/3 of the ingot height. The maximum segregation index is ∼1.7 with the three-phase model and four-phase inclusion model, ∼1.3 with the four-phase shrinkage model, and ∼1.2 with the five-phase model respectively, but the measurement value is less than 1. The reason may be that the solute and mass transfer is easier in simulation than in the practical solidification process, so the remaining liquid in the final stage of solidification is richer in solute, which means the positive segregation is more severe. Additionally, the tendency of the segregation index to rise along with the ingot height is similar for different model considerations, but model results without shrinkage have a platform or flat valley in the riser region. The solidification shrinkage makes the concentration change of remained liquid more uniform.
Figures 11B–D show the segregation index comparison along three horizontal lines of the ingot. In Figure 11B, the predicted concentration is lower at this height (0.6 m), but its trend is identical with that of measurement. The mismatch in the middle section of the curves is related to the shape and width of the negative segregation cone. In Figure 11C, the radial solute concentration fluctuates, proving that there is channel segregation in this part. In Figure 11D, there is transition from positive segregation to negative segregation at the height of 2.8 m.
Moreover, since the effect of the inclusion on macrosegregation is underestimated as aforementioned, the five-phase model does not have distinct advantages compared with the four-phase shrinkage model in this work. Further research needs to be done on the interactions between inclusions and other phases.
Conclusion
A five-phase model was proposed to predict the shrinkage cavity, inclusion distribution and macrosegregation simultaneously in a 36-ton steel ingot. The numerical and experimental results were compared to verify the model, and the influence of shrinkage and inclusion on macrosegregation was investigated. The main conclusions are as follows:
(1) The predicted results of the shrinkage cavity and macrosegregation in a 36-ton Fe-0.51 wt%C ingot are in a good agreement with experimental results.
(2) Inclusions with a smaller size are mainly in lower part of the ingot, while inclusions with a larger size tend to be located in upper part. A thin layer of inclusions tends to form close to the mold wall, and more inclusions reside in the last solidified segregation channels. The inclusion is easy to aggregate near the riser neck, and it is dragged by the solidification shrinkage. In addition, shrinkage will reduce the distribution density of inclusion in the middle part of the ingot.
(3) Bottom-located negative segregation is the result of the solute loss due to the sedimentation of equiaxed crystals and the outflow of solute-rich liquid in the mushy zone at the lower part of the ingot. A-type segregation results from the solidification undulation due to fluctuations of constitutional undercooling, and flow instability of solute-rich interdendritic liquid. The formation of negative segregation near the riser-neck is related to the insulation effect of riser insulating material.
(4) The solidification shrinkage affects the macrosegregation formation significantly in a steel ingot. It changes the location and shape of the positive segregation zone at the hot top, and reduces its range and severity. The range and severity of the negative segregation near the riser neck is also reduced. The number of the channels is slightly different as well. The simulation result of the five-phase model considering shrinkage is more accurate.
(5) The influence of inclusion on macrosegregation is small compared to that of solidification shrinkage. Inclusion changes the flow field during transportation in melt, and further affects the formation of macrosegregation.
Data Availability Statement
All datasets presented in this study are included in the article.
Author Contributions
MX designed the numerical simulation, analyzed the data, and wrote the draft of the paper. HS advised the research work, provided the research equipment, and revised the paper.
Funding
This work was financially supported by the National Natural Science Foundation of China (U1508215) and the project to strengthen industrial development at the grassroots level of the Ministry of Industry and Information Technology (MIIT), China (Grant No. TC160A310/21).
Conflict of Interest
The authors declare that the research was conducted in the absence of any commercial or financial relationships that could be construed as a potential conflict of interest.
Glossary
C: species concentration, wt%
c: specific heat
C0: initial concentration, wt%
dp: the diameter of inclusion particles, μm
g: volume fraction
K: drag coefficient, kg·m−3 s−1
k: thermal conductivity, W·m−1·k−1
L: latent heat, J·kg−1
nmax: maximum grain number density, m−3
p: pressure, N·m−2
R: grain radius, m
u: velocity, m·s−1
βC: concentration expansion coefficient, wt%−1
βT: thermal expansion coefficient, K−1
Γ: phase transfer rate, kg·m−3 s−1
δ: factor of diffusion length
ΔTN: undercooling for maximum nucleation rate, K
ΔTσ: Gaussian distribution width of nucleation, K
Δρ: solid-liquid density difference, kg·m−3
μ: viscosity, kg·m−1 s−1
ρ: density, kg·m−3
Subscripts
a: air phase
c: columnar dendrite
e: equiaxed grain
l: liquid phase
p: inclusion
ref: reference value
References
Cai, D., Ren, F., Ge, H., Kim, H.-S., Li, J., and Li, J. (2019). Modelling of inclusion effects on macrosegregation in solidifying steel ingot with a multi-phase approach. Metall. Mater. Trans. 50, 1323–1332. doi:10.1007/s11661-018-5066-5
Chen, Z., and Shen, H.-f. (2020). Simulation of macrosegregation in a 36-t steel ingot using a multiphase model. Int J Miner Metall Mater. 27 (2), 200–209. doi:10.1007/s12613-019-1875-9
Combeau, H., Založnik, M., Hans, S., and Richy, P. E. (2009). Prediction of macrosegregation in steel ingots: influence of the motion and the morphology of equiaxed grains. Metall. Mater. Trans. B 40 (3), 289–304. doi:10.1007/s11663-008-9178-y
Duan, Z., Tu, W., Shen, B., Shen, H., and Liu, B. (2016). Experimental measurements for numerical simulation of macrosegregation in a 36-ton steel ingot. Metall. Mater. Trans. 47 (7), 3597–3606. doi:10.1007/s11661-016-3531-6
Fujii, T., Poirier, D. R., and Flemings, M. C. (1979). Macrosegregation in a multicomponent low alloy steel. Metall. Trans. B 10 (3), 331–339. doi:10.1007/bf02652503
Li, D., Chen, X., Fu, P., Ma, X., Liu, H., Chen, Y., et al. (2014). Inclusion flotation-driven channel segregation in solidifying steels. Nat. Commun. 5, 5572. doi:10.1038/ncomms6572
Li, J., Ge, H., Wu, M., Ludwig, A., and Li, J. (2016). Modelling of ingot size effects on macrosegregation in steel castings. Acta Metall. 52, 1096. doi:10.1016/j.jmatprotec.2017.09.004
Ludwig, A., and Wu, M. (2005). Modeling the columnar-to-equiaxed transition with a three-phase Eulerian approach. Mater. Sci. Eng. A 413–414, 109–114. doi:10.1016/j.msea.2005.08.184
Ren, F., Ge, H., Cai, D., Li, J., Hu, Q., Xia, M., et al. (2018). Simulation of macrosegregation and shrinkage cavity in an Al-4.5 wt pct Cu ingot using a four-phase model. Metall. Mater. Trans. 49, 6243–6254. doi:10.1007/s11661-018-4892-9
Wang, C. Y., and Beckermann, C. (1996). Equiaxed dendritic solidification with convection: part I. Multiscale/multiphase modeling. Metall. Mater. Trans. A 27, 2754–2764. doi:10.1007/bf02652369
Wu, M., Fjeld, A., and Ludwig, A. (2010). Modelling mixed columnar-equiaxed solidification with melt convection and grain sedimentation—part I: model description. Comput. Mater. Sci. 50 (1), 32–42. doi:10.1016/j.commatsci.2010.07.005
Wu, M., Kharicha, A., and Ludwig, A. (2015). “Using four-phase Eulerian volume averaging approach to model macrosegregation and shrinkage cavity,” in Proceedings of the IOP conference series: materials science and engineering, Beijing, China, May 16–18, 2015.
Wu, M., Ludwig, A., and Fjeld, A. (2010). Modelling mixed columnar-equiaxed solidification with melt convection and grain sedimentation—part II: illustrative modelling results and parameter studies. Comput. Mater. Sci. 50 (1), 43–58. doi:10.1016/j.commatsci.2010.07.006
Wu, M., Ludwig, A., and Kharicha, A. (2017). A four phase model for the macrosegregation and shrinkage cavity during solidification of steel ingot. Appl. Math. Model. 41, 102–120. doi:10.1016/j.apm.2016.08.023
Keywords: macrosegregation, inclusion, solidification shrinkage, numerical simulation, multiphase model
Citation: Xie M and Shen H (2020) Multiphase Model for the Prediction of Shrinkage Cavity, Inclusion and Macrosegregation in a 36-Ton Steel Ingot. Front. Mater. 7:577290. doi: 10.3389/fmats.2020.577290
Received: 29 June 2020; Accepted: 17 September 2020;
Published: 24 November 2020.
Edited by:
Elena Pereloma, University of Wollongong, AustraliaReviewed by:
Sung Bo Lee, Seoul National University, South KoreaHuabing Li, Northeastern University, China
Copyright © 2020 Xie and Shen. This is an open-access article distributed under the terms of the Creative Commons Attribution License (CC BY). The use, distribution or reproduction in other forums is permitted, provided the original author(s) and the copyright owner(s) are credited and that the original publication in this journal is cited, in accordance with accepted academic practice. No use, distribution or reproduction is permitted which does not comply with these terms.
*Correspondence: Houfa Shen, shen@tsinghua.edu.cn