Mitigating Train Derailments Due to Sharp Curve and Overspeed
 Yan Q. Sun
- Centre for Railway Engineering, CQUniversity, Rockhampton, QLD, Australia
Each year around the world there are still several cases of train derailments on the curved tracks due to overspeed, leading to big casualties and costs to the rail industries. With the ongoing increase on the speed, the possibility of train derailment will increase, especially on the sharp curved tracks. Two guard rails (or check rails) are usually required to be placed inside and parallel to two running rails along restrictive clearance areas of the bridge, tunnel, and turnout, preventing the rail vehicle wheels from turning over the rails in case of derailment. However, the investigation on the guide rail which is used to mitigate the train derailment due to a curved track and overspeed is carried out in this paper through the simulations. On sharp curved tracks, one guard rail can be placed inside the low rail, where it engages the back of the wheel flange. The simulations demonstrate that the guard rail can reduce the train derailment potential caused by a sharp curve and overspeed. The lateral clearance between wheel rim back and guard rail, as well as the height over the low rail top, is crucial in the effectiveness of guard rail. Their optimal selections could be obtained through the further simulations.
Introduction
The rail transportation has been world-widely recognized as a safer one. However, the train derailments continue to occur. Due to the complexity of the rail transportation, these disasters are apparently difficult to eliminate completely, regardless of how much money spent on the safety improvements. As the train speed is continuously increased, a further increased safety in railway operations is desired. Generally, the rail industry always focuses on minimizing the possibilities of an undesired derailment by applying some safety procedures. These procedures are not always satisfactory, for examples, when dealing with failures on mechanical parts guiding the wheelsets on rails or with the driver's abnormal behaviors—driving at an overspeed in speed restricted zones.
Derailment mechanisms and assessment criteria have been reviewed (Wilson et al., 2011). Most of the assessment methods addressed the fundamental contributors to derailments. Derailment mechanisms could generally come from the rail vehicle resonant response, lateral instability, vehicle overturning, vertical wheel unloading, flange climb, rail rollover, track panel shift, and longitudinal train forces, etc. No matter what a mechanism causes a derailment, the derailment always involves significant cost and interruption to services, as well as an apparent safety risk to passengers and working staff. An independent professional group organizes an overall derailment investigation. In many derailment cases, the rail vehicle dynamic responses to particular track features are of critical importance. Therefore, the dynamic simulations using a professional software package such as VAMPIRE, NUCARS, and GENSYS, etc. is an important tool in the investigation process (Clementson and Evans, 2002).
For the derailments due to wheel flange climbing, the probability of preventing derailments due to the failure of an axle journal by applying mechanical restrictions between the bogie frame and the wheelsets were investigated (Brabie and Andersson, 2009). Extensive multi-body system (MBS) simulations were completed on the possibility of utilizing alternative additional guidance mechanisms, for instance, the low-reaching parts of axle box, bogie frame or brake disc, as means of reducing the lateral deviation, which led to a successful commitment for a total of 12 different derailment scenarios.
The train derailment mechanism due to overturning on a curved track is concerned only in this paper. In this kind of derailment, the wheels on the inner rail (or the low rail) unload and the train turns over around the high rail. This derailment usually occurs on sharp curves very quickly because the train is running at a high speed. When a train is running at a normal speed on a curved track, the track cant can effectively balance the centrifugal force of train. However, because the curve radius is small and there is the track cant deficiency, the wheel tread conicity is not sufficient to ensure the wheelset steering and the wheel flange will contact the high rail (Pombo and Ambrósio, 2008). When a train operates at a large overspeed, the large centrifugal force effect cannot be accommodated by the track cant, leading to the wheels lifting from the low rail and the derailment occurring finally. A detailed description on train overturn derailment was given (Matsumoto et al., 2016). Basic mechanism can be explained that when the train is running on a sharp curved track at a much higher speed than the speed limit set due to the curved track, which would result in the resultant force vector (see the figure attached), whose components include the centrifugal force, the gravity and the inertial forces of lateral and vertical vibrations, to go toward outside of the outer rail (high rail) from the gravity center of the vehicle, the overturn derailment would happen on the vehicle of train.
The three examples of train derailments due to the rail vehicle overturning were briefly described. It was reported that an investigation into the crash in 2004 found that the tilt train was traveling at almost twice the recommended speed limit on a curved track near Bundaberg, Queensland, Australia, leaving more than 120 people injured1. On 31 Jan. 2003 a passenger train derailment2 happened near Waterfall, NSW, Australia. Seven people on-board were killed in the derailment accident, including the train driver. The subsequent investigation found that the train speed was at over 117 km/h when it approached the curve with the speed limit of 60 km/h, where the derailment accident happened. It was reported that a train was derailed when it was moving at the speed of 180 km/h along a curve with the speed restriction of 80 km/h on 24th July 2013 in Santiago de Compostela, Spain, with large casualties of 79 people killed and 140 people injured3. From these three examples, the common aspect was that the trains were traveling on sharp curved tracks at much higher speeds, and all derailed vehicles overturned to the high rail side.
Basically the guard rails aim to prevent rail vehicles from overturning derailments and to avoid unnecessary damages and costs. After investigating a train derailment accident happened in a sharp curved track section, the decision was made to install a section of guard rail to the derailed section, which results in trains being much easier to be steered by guard rails (Sato et al., 2008). In a sharp curved track section, the installation of a new type of guard rail could allow the minimum laying curve radius reduction of 300 to 230 m without derailment happening (Mao et al., 2013). A rail vehicle/track model was generated by using SIMPACK simulation package, and the varying profiles of rail along a turnout and the check rail were also included for the train dynamics analysis due to passing over a turnout (Schupp et al., 2004). It was mentioned (Ren et al., 2005) that the existence of guard rail could make interactive dynamic responses of a vehicle/track system more intense. However, the wear on nose rail would be significantly decreased and the opportunity of wheel impact on nose rail would be significantly diminished, which was useful to maintain running vehicle safe and extend the nose rail's long service life.
It was mentioned (Iwnicki, 2016) that the wheel flange climb derailment on sharp curved tracks could be prevented by installing the guard rails, meanwhile, the cornering wear on high rail could be reduced. However, the lateral clearance between guard rail and wheel rim back (shown in Figures 1A,B) and the guard rail's height above the running rail (shown in Figure 1A) are crucial to the effectiveness of guard rail. The simulation results by using NUCARS® software package (Iwnicki, 2016) showed that the applications of guard rails could improve curving performance of rail vehicles, diminish risk of derailment due to wheel flange climbing, and control contact wear between wheel and rail. The flangeway width (shown in Figure 1) (Shu and Wilson, 2007) is designed in a range of 1.75–2 in (44.45–50.8 mm) for light rail in the USA, and the track gage and wheelset's back-to-back distance are 56.75 in (1441.45 mm) and 54.19 in (1376.43 mm). Hence, the lateral clearance between guard rail and wheel rim back is about 11.8 ~ 18.14 mm. To minimize lateral impact derailment potential at level crossing, the guard rails were applied (Ling et al., 2016), in which the clearance between guard rail and wheel rim back is selected to be 20 mm and the height of guard rail over the running rail top is 15 mm.
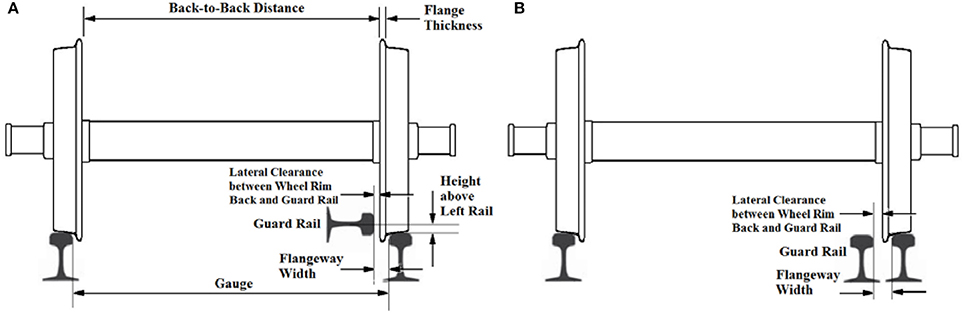
Figure 1. Arrangements of guard rail.
The derailment accident simulations of a passenger train carried out by using Gensys software—a multi-body dynamics software package, will be presented in this paper. The model of a single passenger car is described in detail based on the actual passenger car in Australia, as well as the track model. A train with five passenger cars is considered to operate on a sharp curved track. Several simulations with gradually increasing train speed are performed to find out the critical speed, which makes the train overturning derailment. The simulation with the guard rail installation on the track is finally completed to demonstrate the effectiveness of the guard rail to prevent the train from the derailment.
Train-Track Multi-Body Dynamics Modeling
At the beginning, a single passenger vehicle was modeled by using GENSYS (Sun et al., 2012, 2013, 2017a,b) and its model is shown in Figure 2A. For the better display, one bogie in Figure 2A is zoomed and shown in Figure 2B, which clearly shows the bogie components and connections, and the guard rails on the track are also included. The basic data used to model a passenger vehicle are listed in Appendix–I.
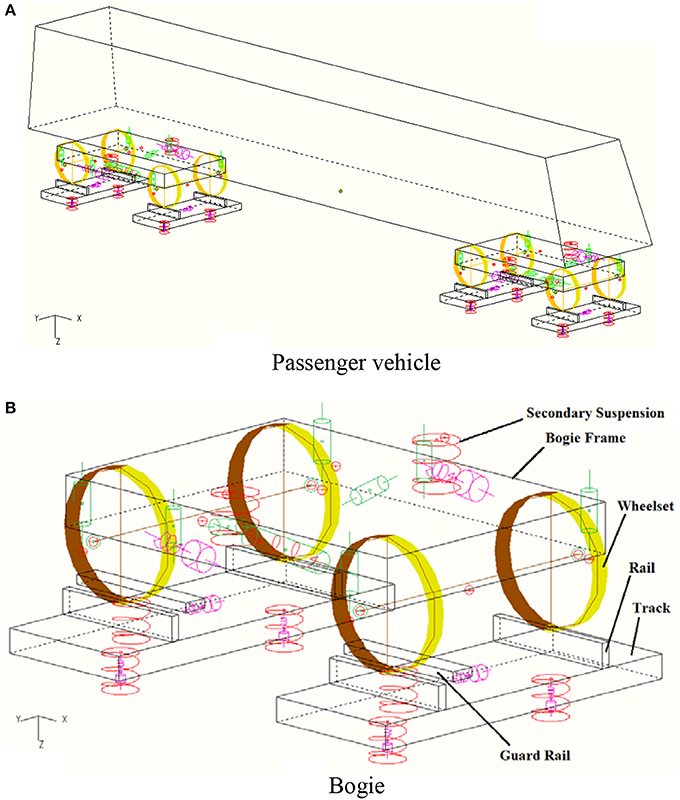
Figure 2. Passenger vehicle model. Source: From Sun et al. (2017a). With permission of ASME publications.
In a single passenger car model shown in Figure 2A, one car body and two bogie frames are considered each as a single mass with six degrees of freedom (DOFs), respectively. The wheelset is also considered to be a single mass with five DOFs, and the pitch rotation is not considered. The couplings (the primary suspensions) between two wheelsets and one bogie frame in a bogie comprise the following elements—twelve linear spring and damping elements at axle box positions in X, Y, and Z three directions; four vertical and two lateral bump-stops; and four vertical linear dampers at the positions indicated by their attachment points. The couplings (the secondary suspensions) between one car body and one bogie frame comprise the elements, including two coil springs at bogie middle in the vertical direction; one linear spring to represent anti-roll bar at the positions indicated by its attachment points; one linear spring and one linear damper elements to represent the traction rod at the positions indicated by its attachment points; two vertical and one lateral bumpstop elements; two lateral and two vertical linear dampers, and two yaw linear dampers at the positions indicated by their attachment points.
In the track modeling shown in Figure 3, two rails are modeled each to be a massless block and connected to the track by means of vertical and lateral linear spring and damper elements as shown in Figure 3 (kyrt and kzrt-lateral and vertical stiffness between rail and track block, cyrt and czrt-lateral and vertical damping between rail and track block). The track blocks are modeled each as a single mass with 3 DOFs—lateral and vertical displacements, and roll rotation, respectively. The connections between the track block and the ground comprise the following elements—two vertical linear spring and damping elements and one lateral linear spring and damping elements shown in Figure 3 (kytt and kztt-lateral and vertical stiffness between track block and ground, cytt and cztt-lateral and vertical damping between track block and ground).
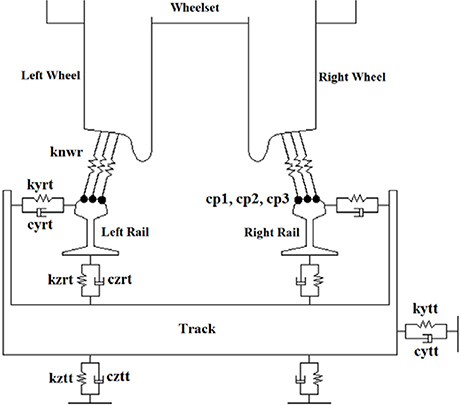
Figure 3. Track and wheel/rail contact modeling. Souce: From Sun et al. (2017a). With permission of ASME.
In Figure 3, three different contact points (cp1, cp2, and cp3) can be in contact simultaneously at the wheel-rail contact, so three linear spring elements, which are normal to the wheel-rail contact surfaces, are correspondingly defined (knwr-stiffness for the three spring elements normal to the surfaces). Through the spring elements, the wheel-rail contact normal forces can be obtained. The creep forces of wheel-rail contacts in the tangent direction are calculated by using Kalker creep theory. The wheel-rail contact points for a pair of wheel and rail profiles are shown in Figure 4. The lines linked to the wheel and to the rail points clearly show the different wheel-rail contact points—cp1 in blue color, cp2 in green color and cp3 in red color.
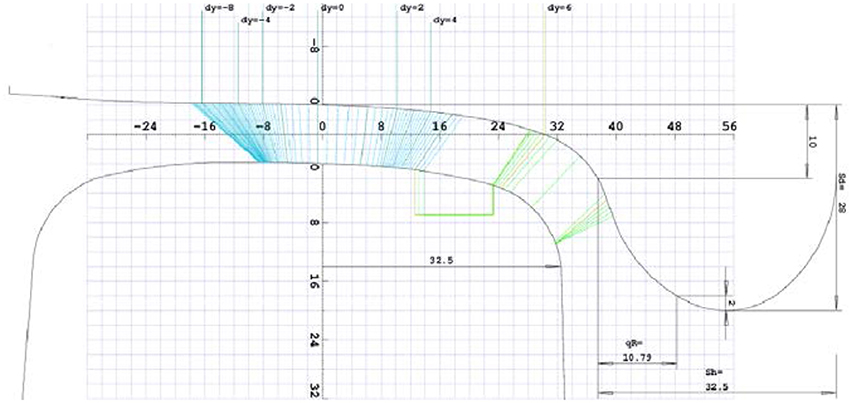
Figure 4. Wheel and rail contact.
The connection between two adjacent passenger cars is through a coupler. The coupler's longitudinal and vertical stiffness coefficients are assumed to be 3e6 and 40e6 N/m, and the roll and pitch rotational stiffness coefficients are 20e6 Nm/rad, respectively. The coupler's free swing angle about the vertical direction is allowed to have ±10°. If the free swing is over, the lateral stiffness coefficient is supposed to be 40e6 N/m and the yaw rotational stiffness coefficient is 20e6 Nm/rad. Therefore, a passenger train unit model comprised of five passenger vehicles can be established for the simulations.
Track Condition and Guard Rail Parameters
The track is the standard track with the gauge of 1,435 mm. Figure 5 shows the track geometry. It can be seen that the curve radius is 200 m (1/200 = 0.005), the track cant is 140 mm and the transition length is 80 m. The track condition is assumed as the perfect one without any track irregularities.
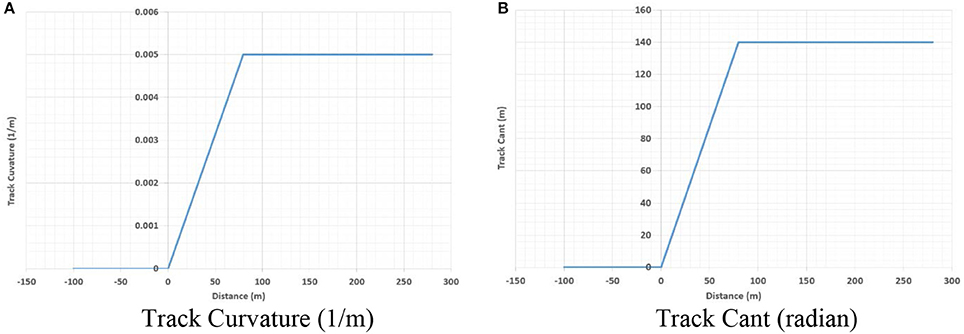
Figure 5. Track geometry.
For the positive track curvature, it is defined that the curve rounds to the left. In this situation, from the train moving direction, the high rail is in the left side while the low rail in the right side. The guard rail should be installed near the low rail, and its arrangement shown in Figure 1A is considered. Figure 6 shows the some basic parameters used for the simulations, where the lateral spring stiffness between the guard rail and the ground (Kgr) is selected to be 250 MN/m; the lateral clearance between guard rail head top and wheel rim back (Lgb) is 10 mm; the height of guard rail's symmetric line to the right rail top (Hgt) is 15 mm.
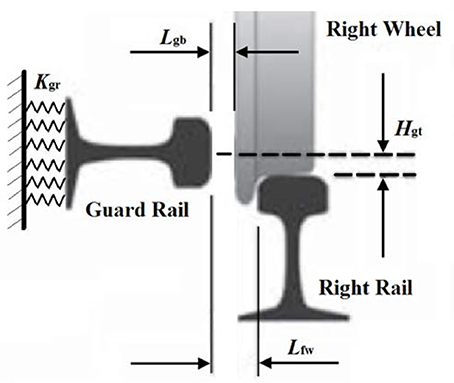
Figure 6. Guard rail.
The train overturn derailments are really different from the wheel climbing derailment. The concept of the guard rail being used to mitigate the train overturn derailment is basic on the observation and consideration. When train overturn derailments happen on the sharp curved tracks due to a much high speed, the wheelset mainly have two movements-lateral translational one toward the outer rail (high rail) and roll rotational one anti about train moving direction. If the guard rail is properly installed closed to the inner rail (low rail) on the sharp curved tracks, its top surface will keep in touch with the wheel back rim when train is running at a much high speed, which could prevent the derailment.
Overturning Derailment Simulations
Two scenarios of overturning derailment simulations are taken into account. One is to increase the train operating speed until the critical speed is found out to make the train overturning derailment. The other is to keep the simulations at the critical speed and to find out the effectiveness of the guard rail. Figure 7 shows the moments of train operation during the curving for the first scenario-starting the curving (Figure 7A), running on the transition section (Figure 7B) and derailing (Figure 7C) at the speed of 119 km/h. It can be seen from Figure 7C that the train derailment starts from the first bogie.
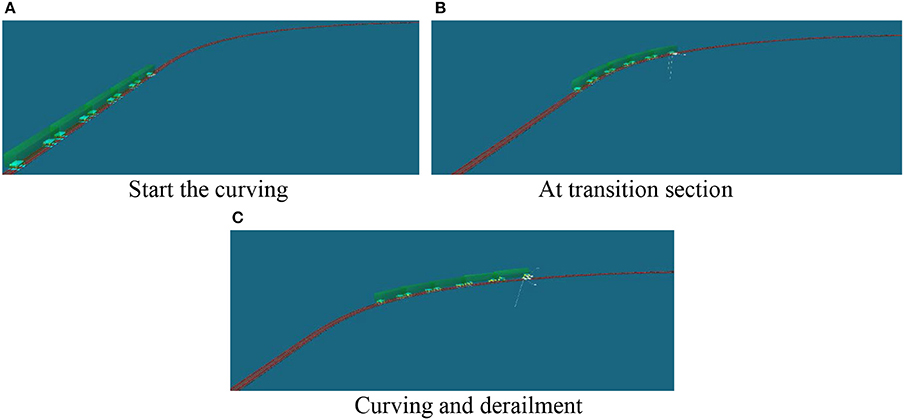
Figure 7. Simulations for first scenario at speed of 119 km/h.
In reality, for the track geometry condition with the horizontal curve radius of 200m, the speed limit is about 50–60 km/h. in order to simulate the vehicle overturning derailment, the running speed should be selected much higher. After several trial simulations, it is found that at the speed of 118 km/h, the train is in the critical situation, whilst when the speed is increased a little bit, it is totally derailed on the curve, for example, at the speed of 119 km/h. At the speeds of 118 and 119 km/h, the wheel-rail contacts and displacements of two wheelsets in the first bogie from the leading passenger vehicle are observed and shown in Figures 8A–F, 9A–F, respectively.
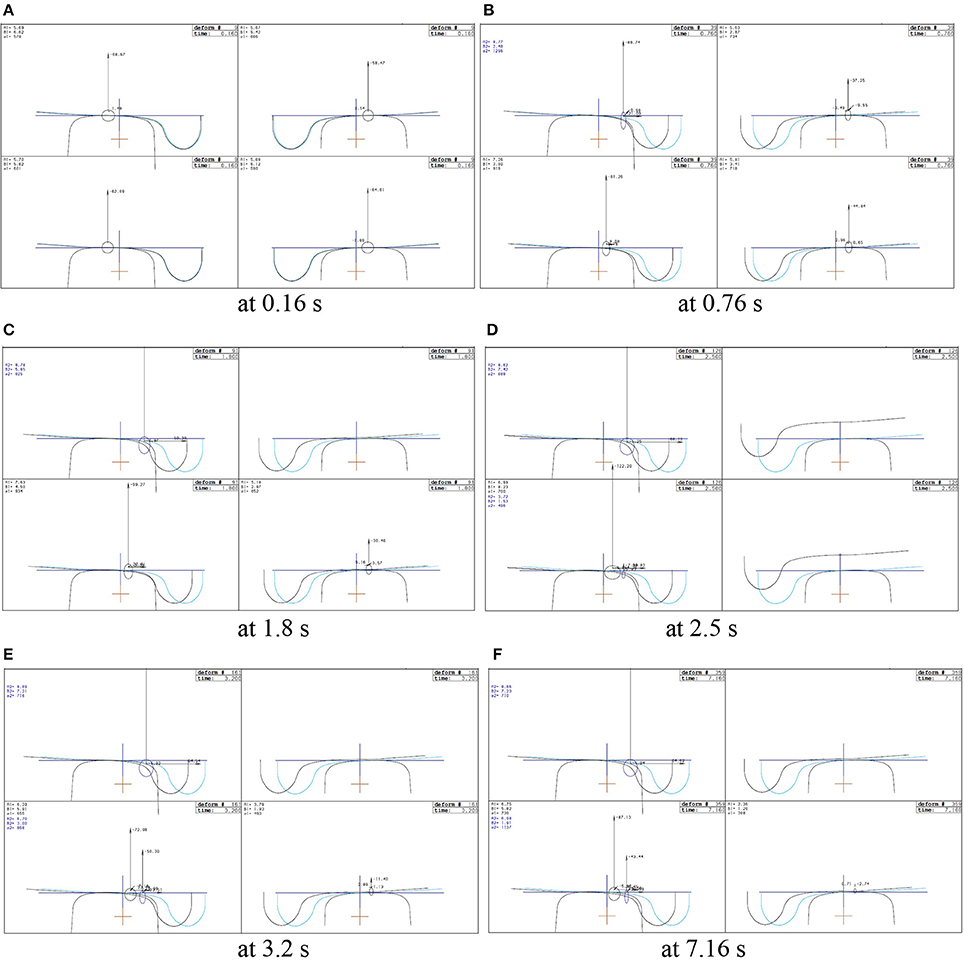
Figure 8. Simulation at speed of 118 km/h without guard rail.
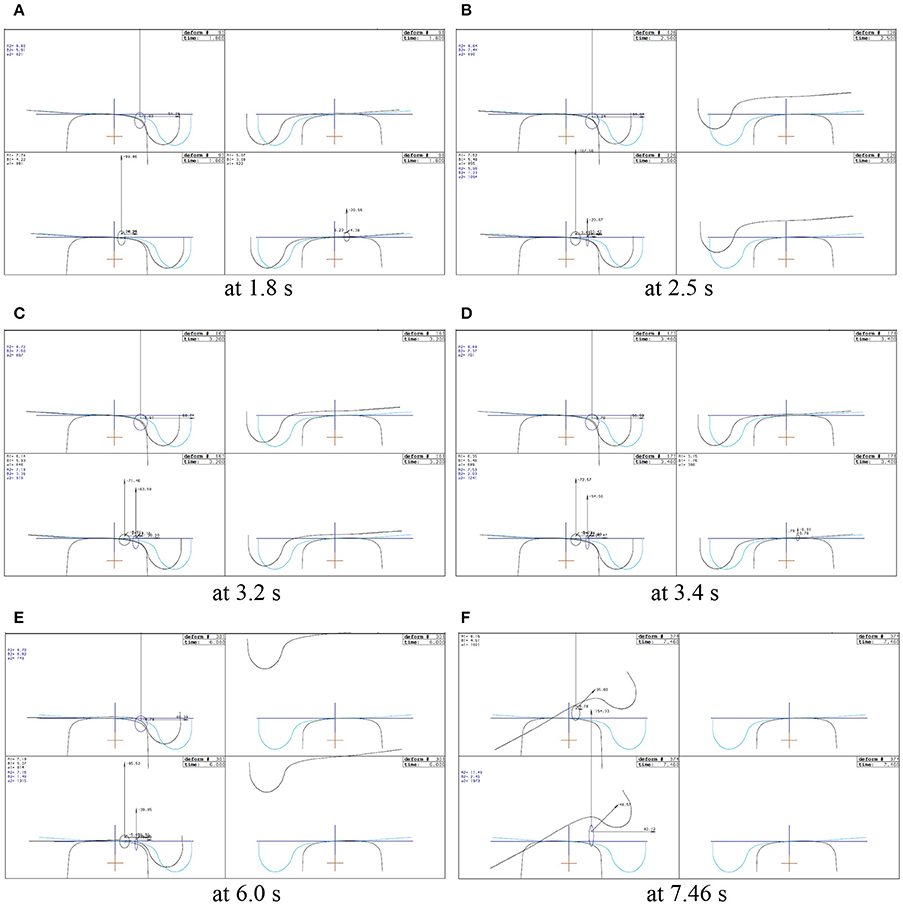
Figure 9. Simulation at speed of 119 km/h without guard rail.
In Figure 8, four graphs are together in each figure. The wheel-rail contacts in the left and right sides of the first wheelset are shown in the two upper graphs while those in the second wheelset in the two lower graphs. The left wheel-rail contacts are shown in the left graphs while the right ones in the right graphs. The left rail corresponds to the high rail while the right rail to the low rail in the curved track.
Figure 8A shows the wheel-rail contacts at the time of 0.16 s when the front bogie just starts to enter the transition section of curved track. At 0.76 s, the front bogie is closing to the middle of transition section, and the left wheel of the first wheelset begins the flange contact, as shown in Figure 8B. At 1.8 s, the front bogie is still on the transition section, but the right wheel of the first wheelset starts to separate with the low rail (there is no vertical wheel-rail contact force), as shown in Figure 8C. When the front bogie is approaching the curve from the transition section, the both right wheels of the first and second wheelsets begin to lift up from the low rail, reaching to the maximum height at the moment of 2.5 s, as shown in Figure 8D. However, these two right wheels come back and touch on the low rail again at 3.2 s, as shown in Figure 8E. Although one more lift-up occurs during the remaining travel for the both right wheels, its amplitude is smaller and the time is shorter. The train derailment will not happen, as shown in Figure 8F. However, it is noticed at the speed of 118 km/h that the train is in the critical condition because the right wheels just touch the low rail, leading to very small contact forces, as shown in (Figures 8E,F).
Similarly, the simulation results at the speed of 119 km/h are shown in Figure 9. Figure 9A shows the wheel-rail contacts at the moment of 1.8 s when the front bogie is running on the transition section. It can be seen that at 1.8 s, the right wheel of the first wheelset is already to separate with the low rail (there is no vertical wheel-rail contact force). The right wheels continue to lift up from the low rail, and at the moment of 2.5 s they reach to the maximum height, as shown in Figure 9B. After the front bogie enters the curve from the transition section, the right wheels gradually come back, at the moment of 3.2 s as shown in Figure 9C, and are closing to touch the low rail, at the moment of 3.4 s as shown in Figure 9D. Very soon after 3.4 s the right wheels' second lift-up occurs. However, the second lift-up never come back and continuously increases, at the moment of 6.0 s as shown in Figure 9E, until the both wheelsets of front bogie derail at about 7.46 s, as shown in Figure 9F, leading to the train derailment.
The simulation is continued at the speed of 119 km/h under the condition that a segment of guard rail is installed near the low rail along the curve, as shown in Figure 6. The installation parameters—the distance (Lgb) between guard rail top and wheel rim back and the height (Hgt) of guard rail above the rail are selected to 10 and 15 mm, respectively. During the simulation, when the right wheels begin to separate the right running rail and rotate over about the opposite direction of X axis, the search is conducted if the wheel rim back surface contacts with the guard rail head surface. If they are contacting, the normal contact force is calculated based on the Hertz contact theory:
where CH is the Hertz contact constant (N/) and δqwg is the normal penetration of the wheel rim back surface into the guard rail head surface.
Meanwhile, based on the Coulomb friction theorem at the opposite direction of wheel rim back sliding on the guard rail the tangent friction force is calculated as:
where μwg is the moving friction coefficient between wheel rim back surface and guard rail head surface and vwg is the moving speed of the wheel rim back surface on the guard rail head surface. The simulation results are represented in Figures 10A–H.
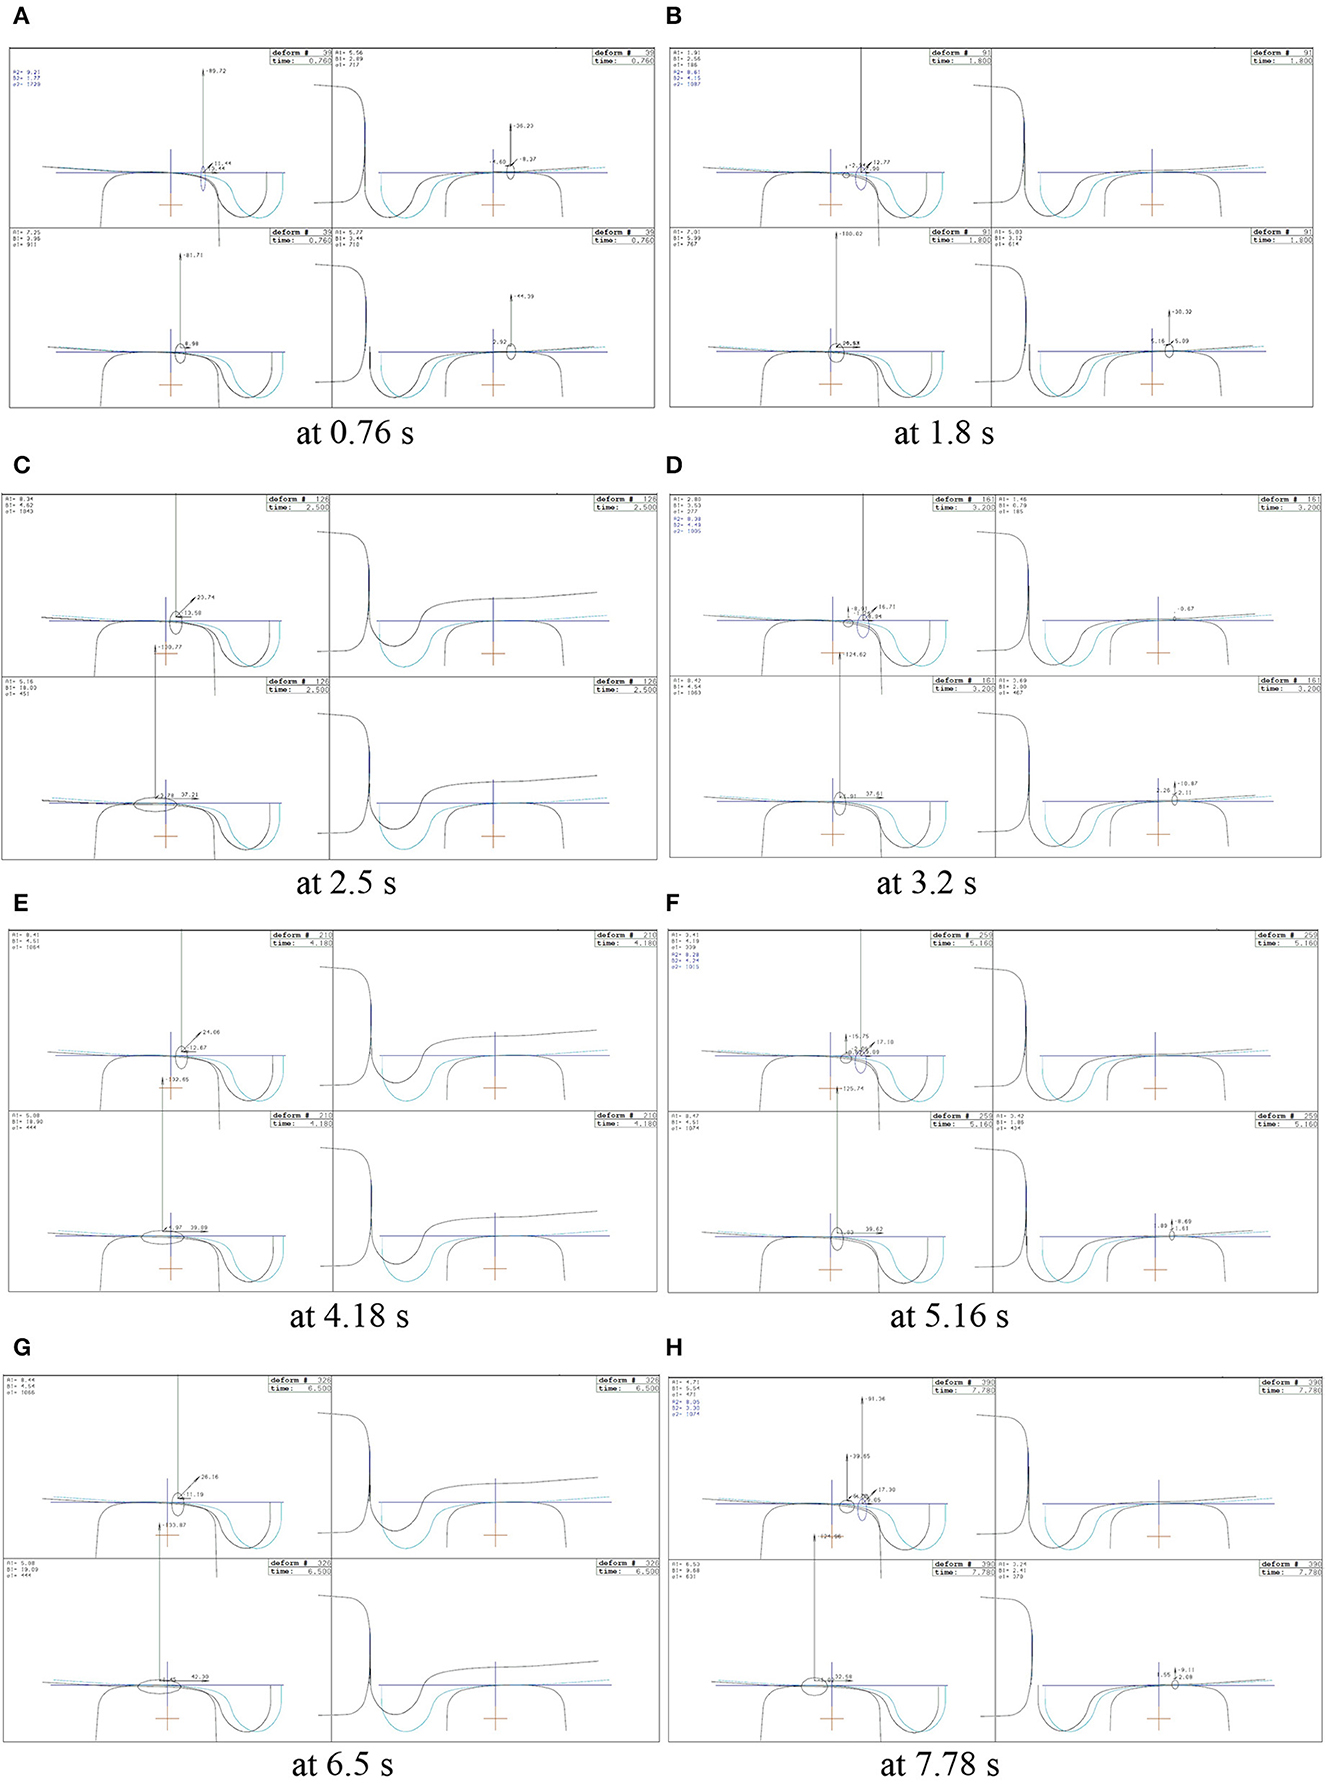
Figure 10. Simulation at speed of 119 km/h with guard rail.
After the guard rail is installed on the curved track (including the transition section), and when the passenger vehicle travels at the overspeed of 119 km/h, the right wheel of the first wheelset on the front bogie starts to touch the guard rail near to the middle of the transition section at about 0.76 s, as shown in Figure 10A. At this moment, the right wheel of the second wheelset on the front bogie does not touch the guard rail until at the moment of about 2.2 s. Similarly, it can be seen that at 1.8 s, the first right wheel is already to separate with the low rail, and the second right wheel just follows it, as shown in Figure 10B. Both right wheels continue to lift up from the low rail, and at the moment of 2.5 s they reach to the maximum height, as shown in Figure 10C. At this moment, the second right wheel already contact the guard rail. Similarly, after the front bogie enters the curve from the transition section, the right wheels gradually come back and touch the low rail at 3.2 s. as shown in Figure 10D.
After 3.2 s the second lift-up of both right wheels occurs. However, during 3.2 s to 4.18 s, the lift-up continues to increase, and reaches to the maximum height at 4.18 s, as shown in Figure 10E. Instead of continuous lift-up and finally derailing, as shown in Figure 9E, both right wheels come back and contact with the low rail at 5.16 s, as shown in Figure 10F. Such process repeats again, as shown in Figures 10G,H. The train will keep the movement forwards in this kind of pattern without derailment occurring.
Figure 11 shows the contact forces between right wheel flange backs and guard rail in the first vehicle, in which three digital numbers represent that the first one is the vehicle, the second one is the bogie and the last one is the wheelset. “121” means that the right wheel of the first wheelset on the second bogie in the first rail vehicle. It can be seen that before entering the curve the right wheels on the first wheelset in the first bogie and on both wheelsets in the second bogies have already contacted with the guard rail top surface. After entering the curve, the contacts are still kept, and the right wheel on the second wheelset in the first bogie begins to touch on the guard rail. However, its contact forces are quite smaller, about 10 kN at the lateral direction and 3 kN at the longitudinal direction (actually this force is the friction force with considering the friction coefficient of 0.3). The larger contact forces occur between the right wheel flange back on the first wheelset in the first bogie, approximately 80 kN at the lateral direction, and change with a periodic fluctuation.
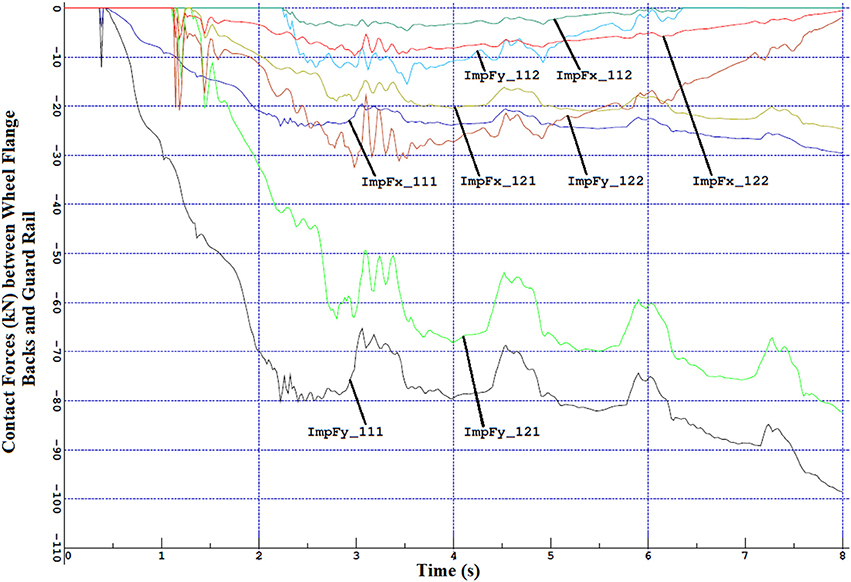
Figure 11. Contact forces between wheel flange backs and guard rail.
The mitigation of train overturn derailment due to high overspeed on the sharp curved tracks is due to the contact of the right wheel rim back surface with the guard rail top surface, counteracting the effect of the train centrifugal force during curving, and restraining the right wheel's further lift-up and roll rotation. The reason why right wheel periodic lift-up and coming back maybe due to the dry friction. This problem deserves the further investigation.
Closing Remarks
The prevention of a passenger train derailment accident due to a sharp curve and overspeed has been investigated and simulated by using the GENSYS software package—a professional multi-body dynamics software. It is necessary for the simulation outcomes to be verified using field/laboratory testing data. Unfortunately, to perform such a field/laboratory experiment may not be practical. However, the detailed description on modeling a passenger car has been presented and the detailed coupling's characteristics based on actual products are applied in this paper. The accident should be mentioned again on the second example of train derailments due to the rail vehicle overturning2, in NSW, Australia. The derailed vehicles, as well as the track condition are quite similar to ones used in the simulation model, and the derailment speed of 117 km/h is near enough the simulated speed of 119 km/h.
The main purpose in this paper is to demonstrate the possibility of guard rails in preventing the derailments due to the rail vehicle overturning. According to the simulation results, the train overturning derailment can be prevented at a little higher running speed than the critical speed against train overturning. But it may not be prevented at higher running speed due to insufficient friction force or no contact between the flange back of wheel and the guard rail surface. So additional simulations are necessary to consider the effectiveness of derailment prevention by this type of guard rail for higher running speed.
The main installation parameters of guard rails (e.g., the lateral clearance between wheel rim back and guard rail, and the guard rail's height over the running rail) are very important. If this lateral distance was narrow, the intensive impacts would happen between wheel rim back and guard rail, as well as between wheel tread and running rail. Otherwise, the contact would lose between wheel rim back and guard rail, and the derailment would still occur. As a result, the further investigation is necessary to analyse the effect of the lateral clearance, the guard rail's height and the guard rail's supporting stiffness to the derailment and intensive impacts through the simulations.
Author Contributions
The author confirms being the sole contributor of this work and approved it for publication.
Conflict of Interest Statement
The author declares that the research was conducted in the absence of any commercial or financial relationships that could be construed as a potential conflict of interest.
Acknowledgments
The author acknowledges the support from his colleagues at the Centre for Railway Engineering, CQUniversity and the support from State Key Laboratory of Traction Power, Southwest Jiaotong University in the Open Projects: TPL1504, Study on heavy haul train and coupler system dynamics. The author also acknowledges the use of the GENSYS software developed by DEsolver.
Footnotes
1. ^http://www.couriermail.com.au/news/queensland/train-back-to-full-tilt/story-e6freoof-1111113583231 (Accessed on 20 October, 2016).
2. ^http://www.cityrail.info/general/waterfall.pdf Special Commission of Inquiry into the Waterfall Rail Accident; Final Report Volume 1; January 2005. (Accessed on 20 October, 2016).
3. ^http://www.raillynews.com/2014/report-issued-santiago-train-derailment-accident-spain-2013/ (Accessed on 20 October, 2016).
References
Brabie, D., and Andersson, E. (2009). On minimizing derailment risks and consequences for passenger trains at higher speeds Proc. IMechE F J. Rail Rapid Transit 223, 543–566. doi: 10.1243/09544097JRRT271
Clementson, J., and Evans, J. (2002). The use of dynamic simulation in the investigation of derailment incidents. Vehicle Syst. Dyn. 37, 338–349. doi: 10.1080/00423114.2002.11666244
Ling, L., Dhansekar, M., Thambiratnam, D. P., and Sun, Y. Q. (2016). Minimising lateral impact derailment potential at level crossings through guard rails. Int. J. Mech. Sci. 113, 49–60. doi: 10.1016/j.ijmecsci.2016.04.011
Mao, J., Xiang, J., and Gong, K. (2013). “Mechanism and application of a new guard rail for improving the stability of small radius curve tracks with contiuous welded rails,” in Fourth International Conference on Digital Manufacturing and Automation (Qingdao).
Matsumoto, A., Michitsuji, Y., and Tobita, Y. (2016). Analysis of train-overturn derailments caused by excessive curving speed. Int. J. Railway Technol. 5, 27–45. doi: 10.4203/ijrt.5.2.2
Pombo, J. C., and Ambrósio, J. A. C. (2008). Application of a wheel–rail contact model to railway dynamics in small radius curved tracks. Multibody Syst. Dyn. 19, 91–114. doi: 10.1007/s11044-007-9094-y
Ren, Z., Sun, S., and Zhai, W. (2005). Study on lateral dynamic characteristics of vehicle/turnout system. Vehicle Syst. Dyn. 43, 285–303. doi: 10.1080/00423110500083262
Sato, Y., Matsumoto, A., Ohno, H., Oka, Y., and Ogawa, H. (2008). Wheel/rail contact analysis of tramways and LRVs against derailment. Wear 265, 1460–1464. doi: 10.1016/j.wear.2007.12.019
Schupp, G., Weidemann, C., and Mauer, L. (2004). Modelling the contact between wheel and rail within multibody system simulation. Vehicle Syst. Dyn. 41, 349–364. doi: 10.1080/00423110412331300326
Shu, X., and Wilson, N. (2007). Research Results Digest 82 - Use of Guard/Girder/Restraining Rails. Transit Cooperative Research Program. Hapeville, GA: Transportation Research Board.
Sun, Y. Q., Cole, C., Dhanasekar, M., and Thambiriratnam, D. P. (2012). Modelling and analysis of the crush zone of a typical Australian passenger train. Vehicle Syst. Dyn. 50, 1137–1155. doi: 10.1080/00423114.2012.656658
Sun, Y. Q., Spiryagin, M., and Cole, C. (2017a). Rail passenger vehicle crashworthiness simulations using multibody dynamics approaches. J. Comput. Nonlinear Dynam. 12:041015. doi: 10.1115/1.4035470
Sun, Y. Q., Spiryagin, M., Cole, C., and Nielsen, D. (2017b). Wheel–rail wear investigation on a heavy haul balloon loop track through simulations of slow speed wagon dynamics. Transport doi: 10.3846/16484142.2017.1355843
Sun, Y. Q., Zong, N., Dhanasekar, N. M., and Cole, C. C. (2013). “Dynamic analysis of vehicle-track interface under train collision using multi-body dynamics,” in Proceedings of 23rd IAVSD Symposium, 19–23 August, 2013 (Qingdao).
Wilson, N., Fries, R., Witte, M., Haigermoser, A., Wrang, M., Evans, J., et al. (2011). Assessment of safety against derailment using simulations and vehicle acceptance tests: a worldwide comparison of state-of-the-art assessment methods. Vehicle Syst. Dyn. 49, 1113–1157. doi: 10.1080/00423114.2011.586706
Appendix
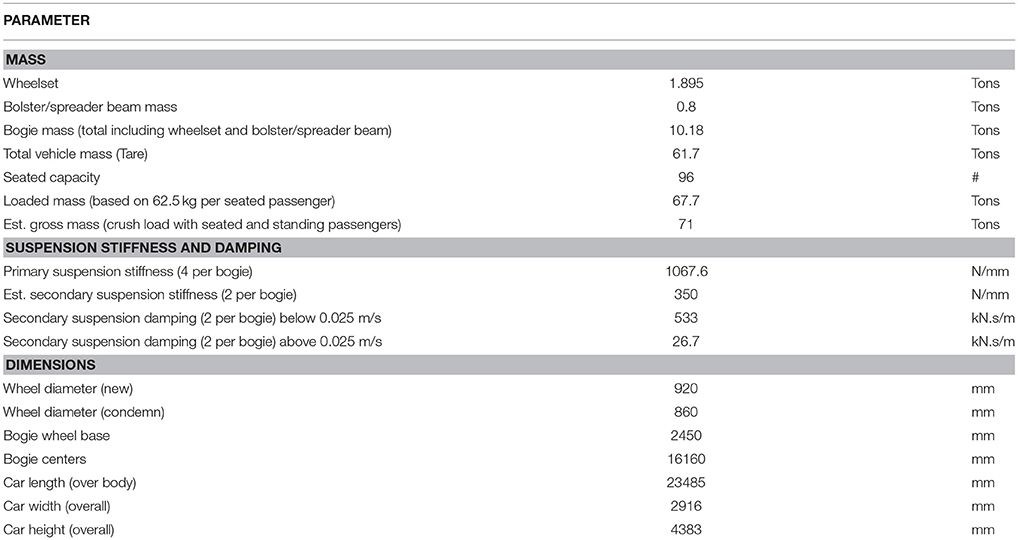
TABLE A1. Passenger car basic parameters.
Keywords: dynamic modeling, passenger train, derailment, overturning, guard rail
Citation: Sun YQ (2018) Mitigating Train Derailments Due to Sharp Curve and Overspeed. Front. Mech. Eng. 4:8. doi: 10.3389/fmech.2018.00008
Received: 29 March 2018; Accepted: 13 July 2018;
Published: 14 August 2018.
Edited by:
Keiichi Goto, Railway Technical Research Institute (RTRI), JapanReviewed by:
Akira Matsumoto, Ministry of Land, Infrastructure, Transport and Tourism, JapanSerdar Dindar, University of Illinois at Urbana-Champaign, United States
Copyright © 2018 Sun. This is an open-access article distributed under the terms of the Creative Commons Attribution License (CC BY). The use, distribution or reproduction in other forums is permitted, provided the original author(s) and the copyright owner(s) are credited and that the original publication in this journal is cited, in accordance with accepted academic practice. No use, distribution or reproduction is permitted which does not comply with these terms.
*Correspondence: Yan Q. Sun, y.q.sun@cqu.edu.au