The brain’s cutting-room floor: segmentation of narrative cinema
- 1 Department of Psychology, Washington University in Saint Louis, St. Louis, MO, USA
- 2 Western Interstates Consortium for Higher Education, Boulder, USA
- 3 Department of Psychology, University of Minnesota, Minneapolis, MN, USA
- 4 Department of Philosophy, Princeton University, Princeton, NJ, USA
Observers segment ongoing activity into meaningful events. Segmentation is a core component of perception that helps determine memory and guide planning. The current study tested the hypotheses that event segmentation is an automatic component of the perception of extended naturalistic activity, and that the identification of event boundaries in such activities results in part from processing changes in the perceived situation. Observers may identify boundaries between events as a result of processing changes in the observed situation. To test this hypothesis and study this potential mechanism, we measured brain activity while participants viewed an extended narrative film. Large transient responses were observed when the activity was segmented, and these responses were mediated by changes in the observed activity, including characters and their interactions, interactions with objects, spatial location, goals, and causes. These results support accounts that propose event segmentation is automatic and depends on processing meaningful changes in the perceived situation; they are the first to show such effects for extended naturalistic human activity.
Introduction
Segmentation is a fundamental component of perception that plays a critical role in understanding. Suppose you visit a busy produce market. To navigate the situation, you will need to segment the dynamic scene into spatial parts – stalls, people, fruits and vegetables, carts. You also will need to segment the ongoing activity into temporal parts – parking your car, chatting with a neighbor, buying tomatoes. Without proper segmentation, activity is merely a “blooming, buzzing confusion” (James, 1890, p. 488), recognition of objects and actions is difficult (Biederman, 1987), and planning breaks down (Spector and Grafman, 1994). This article focuses on the segmentation of experience in time.
Some psychological theories of event segmentation have proposed that segmentation is automatic and ongoing. In Newtson’s (1976) account, behavior perception is a feature monitoring process in which perceivers monitor for changes in some criterial set of features. A change in one or more of these features defines a “breakpoint,” and breakpoints cognitively organize one’s representation of the activity in perception and memory. More recently, we have proposed that perceivers continuously attempt to predict the near future, and perceive event boundaries at those points when prediction fails (Zacks et al., 2007). This account, like Newtson’s, proposes that event boundaries tend to occur at feature changes; however, in this case it is because feature changes lead to prediction failures rather than that the system monitors for feature changes per se.
In contrast, other psychological theories have proposed that event segmentation is not automatic, and that it not necessarily related to feature changes. For example, Ebbesen (1980) proposed that event segmentation is a secondary process that is applied to continuously extracted set of feature values, and therefore that the event boundaries that are identified depend on the explicit strategies of the perceiver when attending to event boundaries.
A limited body of research has tested the proposals that event segmentation is an automatic component of ongoing behavior, and that event boundaries occur at feature changes. Behavioral studies of event segmentation provide indirect support for the proposal that it is automatic. When people are asked to segment an ongoing activity into events, their segmentation shows good intersubjective agreement as to the locations of event boundaries, their boundaries cluster hierarchically into events and sub-events, and individual differences in segmentation show significant test–retest reliability (for a review, see Zacks et al., 2007). However, deliberate performance of a segmentation task can only tell so much about information processing in the absence of the task. More direct evidence comes from non-invasive measures of brain activity. In one study, participants watched movies of everyday activities while brain activity was measured with functional magnetic resonance imaging (fMRI). The participants then segmented the movies by watching them again and pressing a button whenever, in their judgment, one event ended and another began. During passive viewing, activity increased in a number of brain regions at those points that participants later identified as event boundaries (Zacks et al., 2001a). Similar results have been observed using electroencephalography (Sharp et al., 2007) and oculomotor behaviors (Swallow and Zacks, 2006). Using fMRI, researchers have measured evoked brain responses at event boundaries in music (Sridharan et al., 2007). Thus, the available data are consistent with the proposal that event segmentation is an automatic component of normal perception. However, an important limitation of these studies is that none have studied naturalistic activity lasting more than a few minutes.
A few behavioral studies of event segmentation have found that event boundaries tend to occur at points of large change in the behavior stream. Newtson et al. (1977) found that people tended to identify event boundaries when an actor’s position was changing rapidly. Zacks (2004) and Hard et al. (2006) studied the segmentation of simple animated displays, and reported that changes in the motions of objects were associated with event boundaries. Recently, Zacks et al. (2009a) measured the movements of an actor while he performed a set of everyday activities and then asked viewers to segment movies of the activities. Again, movement changes were associated with event boundaries. These data support the proposal that event boundaries occur at feature changes, but they have studied exclusively movement changes in relatively simple and brief stimuli.
Movement and its changes are important features of everyday activity, but there is surely more to naturalistic events than physical motion. People have no trouble comprehending verbally described events for which no motion information is available. Moreover, understanding would seem to depend heavily on features such as intentions and causes that are not simple functions of physical motion. Theories of discourse comprehension in text processing provide a means to code and analyze such changes. The event indexing model claims that readers of a narrative text construct event representations that are updated when important features of the situation described by the text change (Zwaan et al., 1995). For typical narratives, these include changes in time, spatial location, characters, goals, and causes. Support for the event indexing model has come from two major empirical sources (for a review, see Zwaan and Radvansky, 1998). First, studies of online reading indicate that readers slow down when they encounter situation changes. Second, studies of memory for recently presented concepts indicate that information becomes less available after a situation change. Both results are consistent with the proposal that readers update memory representations feature changes.
Recent reading and listening experiments have tested the proposal that event boundaries occur at feature changes, and have found support for it (Speer and Zacks, 2005; Speer et al., 2007; Whitney et al., 2009; Zacks et al., 2009b). For example, in one experimental condition readers segmented written narratives into coarse-grained events by marking event boundaries with a pencil (Zacks et al., 2009b, Experiment 1). Changes in time, space, objects, characters, goals, and causes all were associated with significant increases in the probability that a clause would be marked as an event boundary. Speer et al. (2007) provided evidence that the processing of feature changes accounted for components of the neural response at event boundaries. They had participants read narratives during fMRI scanning and then segment those narratives. They found that event boundaries during reading activated a set of brain regions similar to those activated during event boundaries perceived when viewing everyday events. The regions included areas in the medial precuneus and posterior cingulate cortex, superior posterior temporal cortex, anterior temporal cortex, and right middle frontal gyrus. An overlapping set of regions was activated in response to the situation changes. Importantly, controlling for the brain response to situation changes substantially attenuated the response to event boundaries. This suggests that feature change processing mediated the link between event boundaries and their neural correlates. However, these behavioral and imaging studies are limited in that they all used reading rather than naturalistic event perception to measure effects of feature changes. Texts differ in important ways from naturalistic activity. First, language provides explicit markers of situational dimensions and changes therein. These include verb tense and aspect, articles, and pronouns. Second, language abstracts away vast amounts of perceptual detail that are important for event segmentation. Thus, it is important to test whether situational changes are related to the neural correlates of event segmentation when viewing rich, naturalistic human activity. Two previous behavioral studies have found evidence that situation changes predict event segmentation during movie viewing (Magliano et al., 2001; Zacks et al., 2009b, Experiment 2). However, both of these used active segmentation tasks, and neither included an indirect measure of the processing of event boundaries. Thus, two important questions remain: First, does the neurophysiological evidence supporting automatic segmentation of ongoing events generalize to extended naturalistic activity? Second, do feature changes account for components of the neural response to event boundaries during naturalistic visually presented activity?
In this experiment, we used movie stimuli to ask whether situation changes mediate the relations between event segmentation of naturalistic human activity and its neural correlates. We employed a narrative feature film, The Red Balloon, about a boy interacting with an apparently sentient red balloon. The Red Balloon has some unique features that make it particularly appropriate: It has a rich enough narrative structure to allow a thorough survey of situational changes, but is filmed in a highly naturalistic style which preserves ecological validity for the study of event perception. This film has previously been used in psychological studies of story and film understanding (Baggett, 1979).
We probed brain activity using whole-brain analyses, and also using functional localizers to characterize regions of a priori interest. Previous behavioral and neurophysiological studies have found that movement information is related to event boundary processing (Speer et al., 2003; Zacks, 2004, 2006b, 2009a; Hard et al., 2006). In particular, the brain areas that respond selectively at event boundaries include the human MT complex (MT+), an area specialized for motion processing (Sekuler et al., 2002), and a region of the posterior temporal sulcus (pSTS) that responds selectively to biological motion (Grossman et al., 2000). Therefore, we included functional localizers to specifically assess whether these regions responded at event boundaries in naturalistic movies. Because changes in object interactions are associated with event boundaries (Zacks et al., 2009b), and because object interactions are associated with selective activation of dominant somatomotor cortex (SM) during naturalistic movie viewing (Hasson et al., 2004), we also localized SM.
Materials and Methods
Participants
Twenty-four participants (12 male, ages 19–28) were recruited from the Washington University community. An additional six participants’ data were unusable due to equipment problems (five) or failure to complete the full protocol (one). This research was approved by the Institutional Review Board of Washington University. All participants provided informed consent.
Stimuli and Tasks
During MRI scanning participants viewed The Red Balloon with instructions to pay attention and to try to remember as much as possible. In a following behavioral session they watched the movie twice more while performing an event segmentation task (Newtson, 1976). On one viewing they were asked to press a button to identify the largest units of activity that were natural and meaningful to them (coarse segmentation). On the other viewing they were asked to press a button to identify the smallest units that were natural and meaningful to them (fine segmentation). Order of segmentation grain was counterbalanced across participants. The Red Balloon was always presented in four clips (durations: 463.3, 468.4, 446.2, and 600.6 s) with short breaks between each clip.
Before performing the coarse and fine segmentation tasks, participants were given the opportunity to practice the task using a brief (155 s) movie of a man building a model with a construction toy. During this practice the number of event boundaries identified was recorded. If the participant identified fewer than three boundaries for coarse segmentation or fewer than six boundaries for fine segmentation, they were encouraged to repeat the practice and try to identify more boundaries. This helped reduce extraneous variability in the grain of segmentation viewers adopted (Zacks et al., 2006a).
The Red Balloon had previously been scored to mark six types of situation change (Zacks et al., 2009b) derived from the event indexing model (Zwaan et al., 1995). Briefly, two research assistants coded the film frame by frame for situation changes. Spatial changes were coded when a character changed direction of motion within the scene or when the point of view of the camera changed location. Changes in direction of motion included starting, stopping, and sudden turning. Temporal changes were coded whenever the frame after a cut was temporally discontinuous with the frame preceding the cut. (Temporal changes were rare – 27, or 6.8% of intervals – and always co-occurred with spatial changes, so they were not modeled in the analyses.) Object changes occurred whenever the nature of a character’s interaction with an object changed, such as picking up an object or beginning to use an object already in hand in a new way. Character changes occurred when the focus of action was an animate character or characters and this focus was different from that of the preceding frame. Changes in character interactions were defined as changes in the physical or abstract interactions between characters, such as touching, talking or gesturing, or joining together while walking or running. Causal changes were coded whenever the activity in a frame could not be described as having been caused by something viewed in the previous frame. Finally, goal changes were coded whenever a character performed an action associated with a goal different than the goal in the previous frame. In addition to the situation changes, we coded for cuts, which are those points in time when two adjacent film shots are edited together. For the imaging analyses, responses were time-locked to the frame of each situation change. For the behavioral analyses, the film was divided into 5 s intervals (398 intervals total), and situation changes were assigned to the interval that contained them. Table 1 gives the correlations amongst the variables coding for the presence of each change in a 5-s interval. Object changes were not strongly correlated with the other changes; the rest were moderately correlated. Cuts tended to co-occur with changes in space and characters.
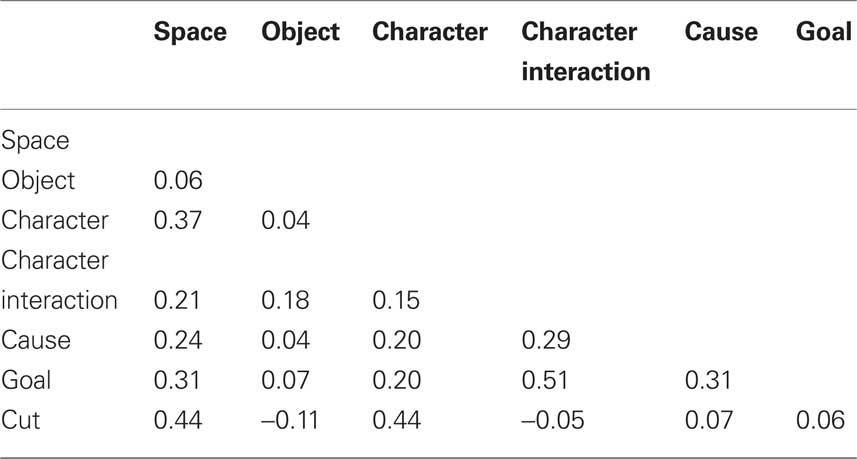
Table 1. Correlations amongst the situation change variables.
MRI Scanning
Magnetic resonance images were acquired with a Siemens 3T Vision MRI Scanner (Erlangen, Germany). A high-resolution (1 mm × 1 mm × 1.25 mm) T1-weighted image of each individual’s structural anatomy was acquired with an MPRAGE sequence. Functional images were acquired with a T2* weighted asymmetric spin-echo echo-planar sequence (RT = 2048 ms, TE = 25 ms) in 32 transverse slices (4.0 mm isotropic voxels) aligned with the anterior and posterior commissures. To facilitate registration of the BOLD data to the structural data, a high-resolution T2-weighted fast turbo-spin-echo image (1.3 mm × 1.3 mm × 4.0 mm voxels, slice TR = 8430 ms, TE = 96 ms) was acquired in the same plane as the T2* images. Prior to analysis, the functional data were processed correcting slice-to-slice timing offsets, normalizing slice-to-slice intensity differences, correcting for within-run and between run motion, and normalizing the whole-brain image intensity to a mode of 1000. The functional data were aligned to the high-resolution T2 image, and these were aligned to the individual’s high-resolution structural images. The functional and structural data were resampled to a standard stereotaxic space (Talairach and Tournoux, 1988) using 3.0 mm isotropic voxels using an atlas-representative target constructed using the methodology described by Buckner et al. (2004), and smoothed with a Gaussian kernel (6 mm FWHM).
Functional Localizers
To localize MT+, participants performed a color-change detection task while viewing brief animations depicting high-contrast moving dots, low-contrast moving dots, and high-contrast still dots (Tootell et al., 1995). For this task, participants monitored a fixation cross (0.65° square) at the center of the screen and pressed a button with their right hand whenever the cross changed color between red and green. The random interval between color changes followed an exponential distribution (mean interval: 4.1 s; range: 1.2–12.3 s). The fixation cross was superimposed on animations consisting of 100 randomly placed dots (0.225° diameter) over a darker background in a circular annulus (11° diameter). For high-contrast stimuli the dots were white on a black background. For low-contrast stimuli the dots and background were gray with a display contrast of 0.06. The moving dots moved in one of 11 randomly chosen directions (0° to 345°; 15° increments) at a velocity of 3.5°/s. Still and moving dots were presented for 1 s with an inter-stimulus interval of 1.05 s, during which a black screen was shown for the high-contrast conditions and a neutral gray screen for the low-contrast condition. The onset of the animations was time-locked to volume acquisition. The moving and still dot animations were shown in two BOLD runs of 352.3 s. Each run began with four frames of fixation (for one run the fixation cross started out green, for the other it started out red). Animations were blocked by condition in blocks of 8. There were 21 blocks per run (7 of each condition); order was counterbalanced across runs and participants. Because MT+ responds strongly to both low- and high-contrast stimuli (Tootell et al., 1995), MT+ was defined as those voxels within a broad anatomic mask that had a higher BOLD signal for high-contrast moving dots than for high-contrast still dots (z > 5), but did not have a substantially higher BOLD signal for high-contrast moving dots than low-contrast moving dots (z < 2.5). Because the region identification process was not intended to test a statistical hypothesis, the statistical thresholds for this and the other localizers were chosen based on inspection to identify regions of the appropriate volume. The anatomic mask was broad, including much of posterior/inferior cortex (Swallow et al., 2003).
To localize pSTS, participants performed the same color-change detection task, with the fixation cross superimposed on animations depicting intact and scrambled human movements (Grossman et al., 2000). Displays were rendered using the point-light technique, in which the movements of 12 points on the body were depicted. The animations consisted of 12 black dots (0.074°) on a gray background (6.3° × 11°). For both animations of biological and scrambled motion the dots moved along trajectories defined by the movements of an actor. For scrambled motion the initial positions of the dots were randomly determined, whereas for intact biological motion the initial points reflected the actual recorded positions. The animations lasted 1 s and were separated by a 1.05-s inter-stimulus interval consisting of a gray screen. The onset of the animations was time-locked to volume acquisition. The biological and scrambled motion animations were shown in two BOLD runs of 164 volume acquisitions (344.1 s). Each run began with four frames of fixation (for one run the fixation cross started out green, for the other it started out red). The animations were blocked by condition (5 blocks of 8 animations per run), with condition order counterbalanced across runs and participants. pSTS was defined as those voxels within an anatomic mask that had a substantially higher BOLD signal for intact than for scrambled movement displays (z > 6). The same mask was used for pSTS as for MT+.
To localize the region of dominant SM most involved in the button press, we selected voxels within an anatomic mask that had large transient increases (z > 6.0) when pressing the button in response to the color change. For the somatomotor region the anatomic mask was restricted to the central sulcus and surrounding precentral and post-central gyri. Responses to the MT+ stimuli, the pSTS stimuli, and the button press stimuli were modeled using the general linear model (GLM), with one model per participant per voxel. We used a standard assumed hemodynamic response function (Boynton et al., 1996) and included regressors coding for effects of no interest (run-to-run differences and linear trends within runs). Descriptive statistics for the regions are given in Table 2.
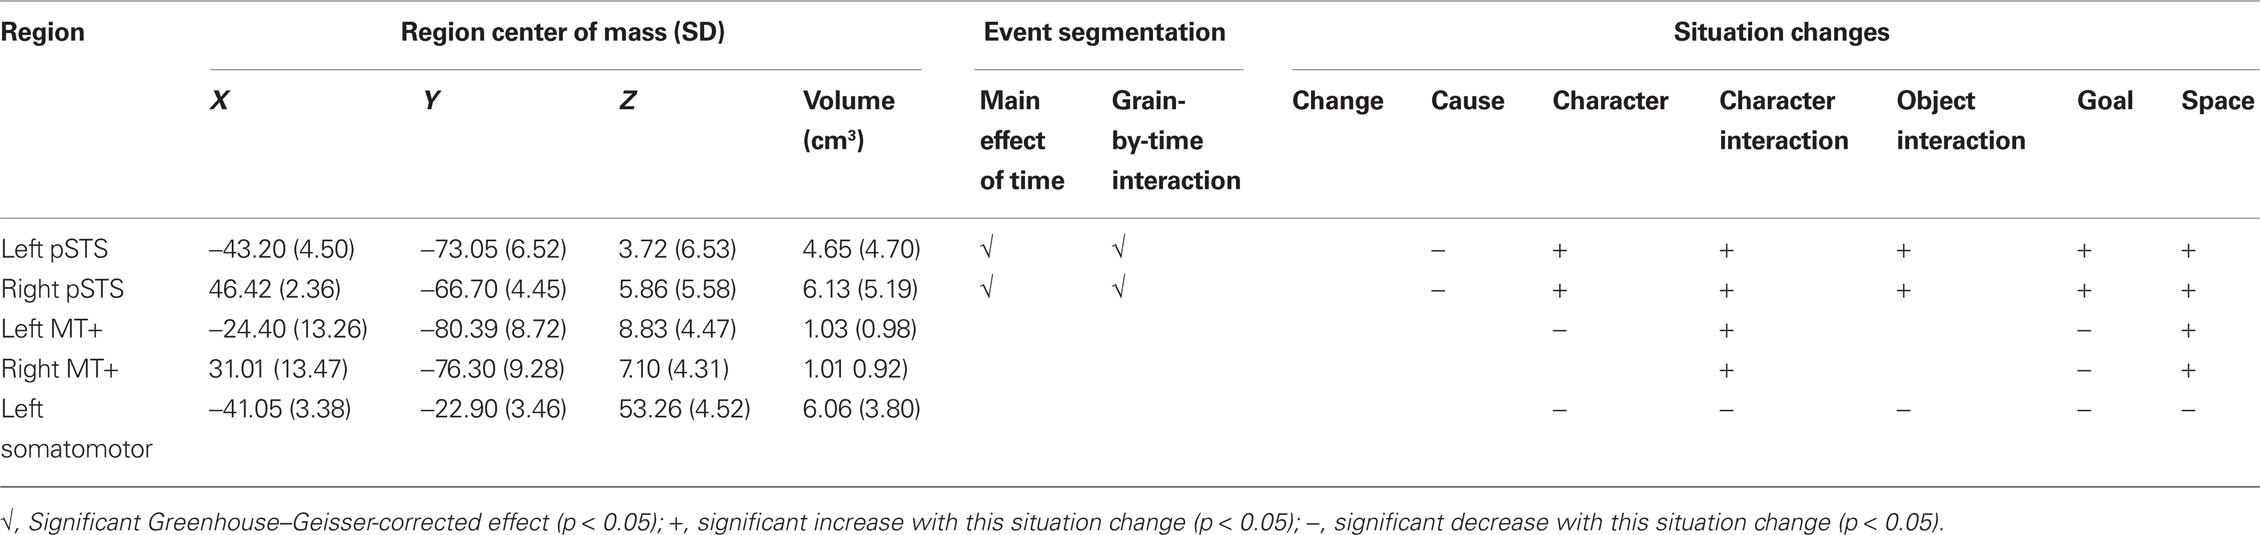
Table 2. Descriptive statistics and analysis results for functional localizer regions.
Stimulus Presentation
Stimuli were presented with PsyScope X software1 on Macintosh computers2. During the MRI scanning session, visual stimuli were back-projected onto a screen located at the head of the scanner bore using an LCD projector and mirror (approximate viewing angle 16°). Movie soundtracks were audible over headphones, and the volume was adjusted to ensure participants could hear the movies during the BOLD runs. During the behavioral segmentation session stimuli were projected onto a 19 in CRT monitor placed at arms length from the participant.
Procedure
Each participant completed an MRI scanning session followed within 6 days by a behavioral segmentation session. During the MRI scanning session participants’ heads were stabilized in the receiver coil with soft cloths and they were fitted with earplugs and noise-attenuating headphones. They were then placed in the scanner and the anatomical images were collected. These were followed by four BOLD-sensitive scans during which the stimulus movie was presented in four clips (durations: 463, 468, 446, 601 s). Each clip was preceded by 53.3 s of a fixation crosshair and followed by 45.1 s of the crosshair. MRI data from the initial 8.2 s (4 scanner frames) were discarded to allow for magnetic saturation. The remaining fixation blocks allowed us to model the brain’s tonic response to movie viewing. During the initial session, participants were naïve to the event segmentation task. Following the four movie-viewing runs participants completed the two MT+ localizer runs and the two pSTS localizer runs. In a subsequent behavioral segmentation session, participants performed the segmentation task on the stimulus movie, twice, to identify coarse- and fine-grained events. Before segmenting at each grain, participants were given instructions and practiced the task using a brief (155 s) movie of a man building an object using Duplos construction blocks3.
Results
Segmentation
The results of the behavioral segmentation task are described in detail in the Appendix. The primary results were: Viewers were able to follow the instructions to modulate their grain of segmentation, and fine units clustered hierarchically into coarse units. Event boundaries were associated with changes in dimensions of the narrated situation, at both a fine and coarse grain. All of the situation changes were associated with increases in segmentation, and the probability of segmenting during a 5-s interval increased with the number of situation changes. Cuts in and of themselves did not produce increases in segmentation. These effects closely replicate a previous behavioral study using these methods and materials (Zacks et al., 2009b, Experiment 2).
Brain Response at Event Boundaries
To estimate the brain response at perceptually identified event boundaries, we constructed GLMs using finite impulse responses (Ollinger et al., 2001). This approach was chosen, rather than assuming a response function, because the timecourse of processing relative to an event boundary is not well characterized and may vary from brain region to brain region (Zacks et al., 2001a). The fMRI signal at each voxel for each participant was the dependent measure. The predictor variables of interest were location in time relative to a coarse or fine event boundary, coded as a series of delta functions representing a temporal window from 15.36 s before the event boundary to 15.36 s after (15 scanning frames); responses to coarse and fine boundaries were modeled simultaneously, using separate sets of 15 variables were used to code coarse and fine boundaries. The mean number of coarse boundaries per subject was 39.7 (SD 26.2); the mean number of fine boundaries was 125 (SD 80.2). The model also included variables coding for effects of no interest: run-to-run differences, within-run linear drift, whether the participant was watching the movie or the fixation cross. The models also included a variable coding for the location of cuts in the movie, because cuts induce a sudden full-field visual change that could produce substantial evoked brain responses not of current interest. The timecourses for the brain response to coarse and fine event boundaries at each voxel were submitted to repeated measures ANOVAs. The voxel-wise maps of ANOVA F statistics were converted to z statistics and thresholded to include only clusters of 5 or more voxels with a z greater than 4.5, which controls the overall probability of a false positive response at p = 0.05 (McAvoy et al., 2001). All fMRI analyses were performed with FIDL4.
These brain regions are shown in Figure 1. As can be seen in the figure, activated voxels included large continuous regions in the medial and lateral posterior cortex and smaller regions in frontal cortex. To better characterize the responses, we identified peaks of activity within the larger regions. This was done by identifying local maxima z statistic map and grouping voxels with the maximum to which they were closest. Specifically, we examined voxels that exceeded a threshold of z = 6.0. When two maxima were closer than 30 mm, the lower of the two was excluded; this was repeated until no peaks were closer than 30 mm. These parameters were chosen by inspection to retain most of the statistically significant voxels identified in the map-wise analysis and group them into compact clusters that formed plausible anatomic units. Descriptive statistics for the clustered regions are given in the first five columns of Table 3. Representative timecourses of response are plotted in the line graphs in Figure 1. Responses at event boundaries were observed bilaterally in medial posterior temporal, parietal, and occipital cortex, posterior superior temporal sulcus, superior parietal cortex, anterior cingulate gyrus, medial and lateral precentral cortex, and lateral prefrontal cortex. Activity in the lateral inferior parietal lobule and in anterior lateral temporal cortex was observed primarily in the right hemisphere.
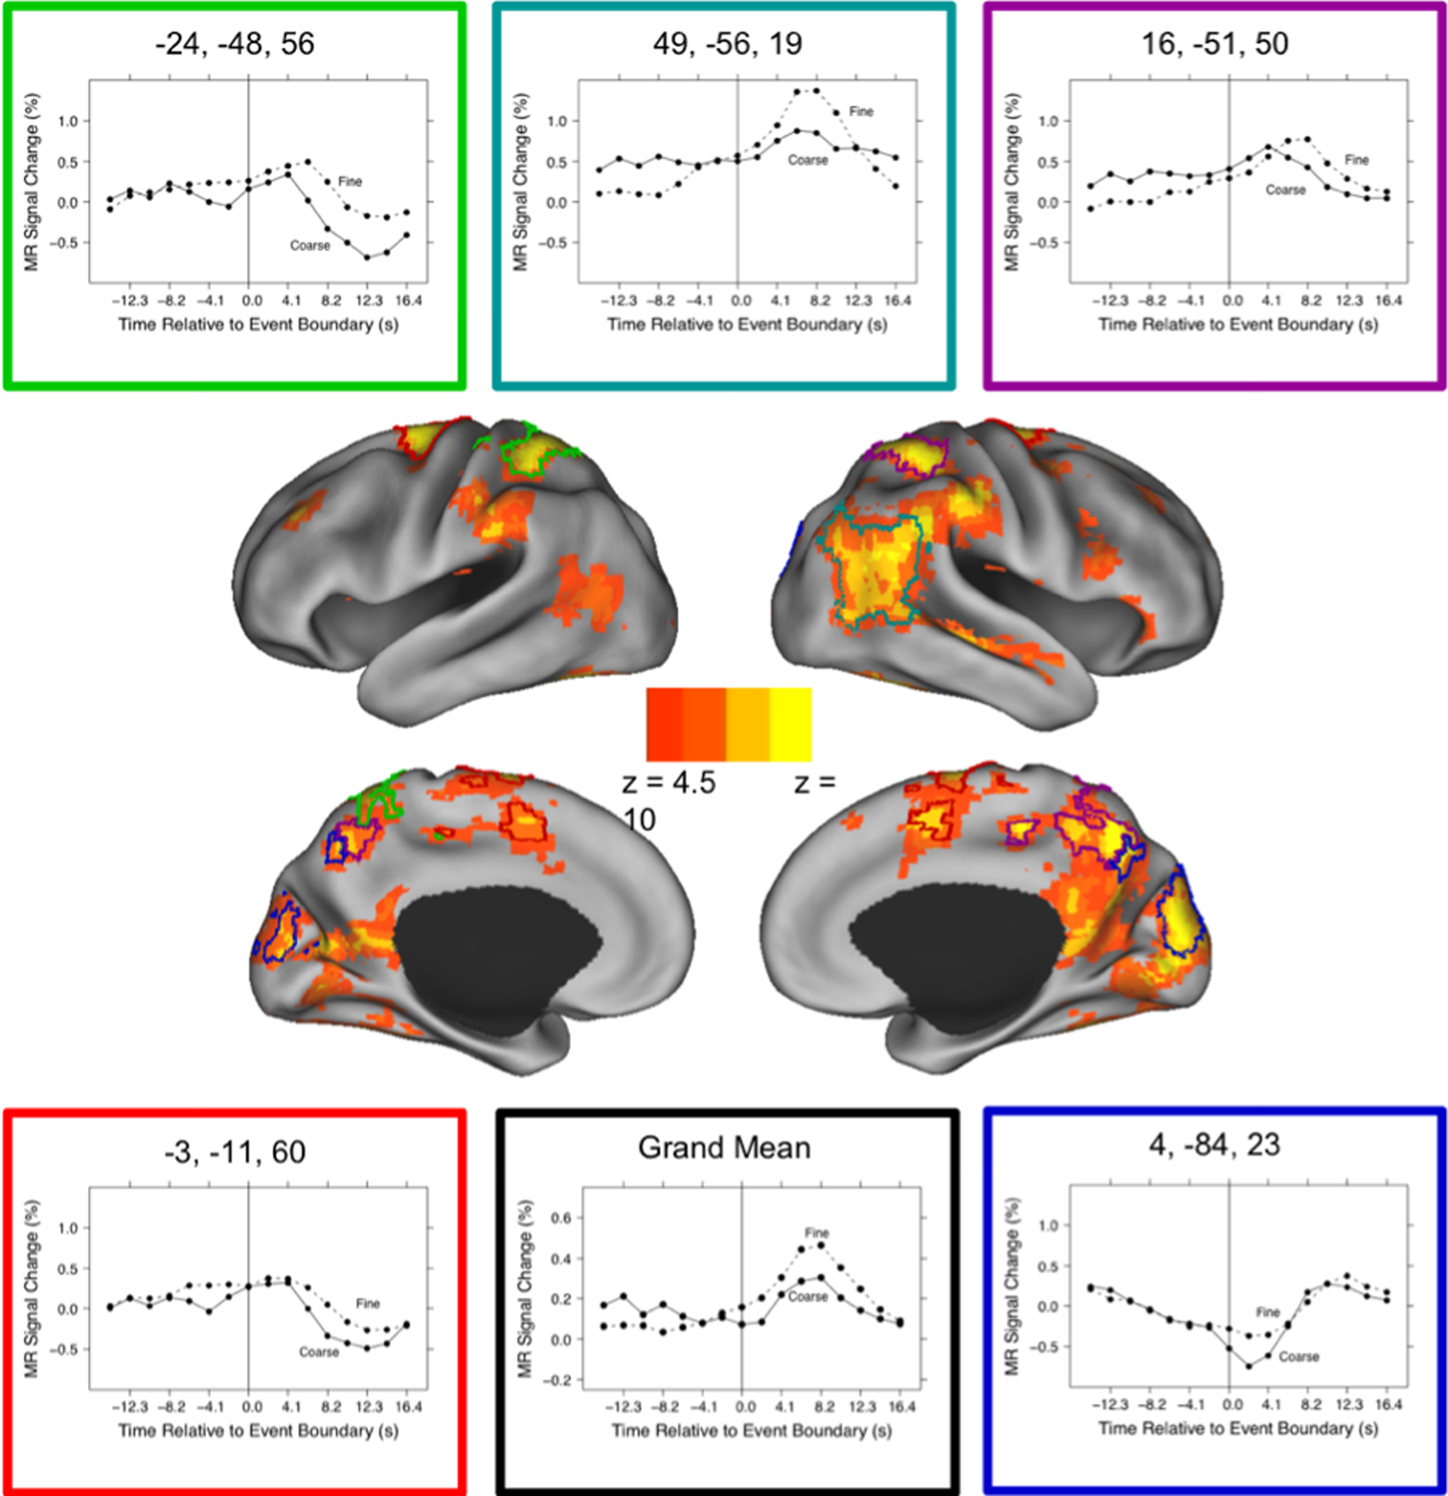
Figure 1. Brain response to event boundaries. The central images show the distribution of brain areas with significant transient changes at event boundaries, operationalized as the main effect of timepoint in the timepoint-by-grain ANOVA. The color map shows the z transformation of the F statistic value at each voxel, projected on inflated renderings of the cortical hemispheres using CARET (Van Essen et al., 2001) and the PALS cortical surface atlas (Van Essen, 2005). The five regions with the highest peak z values (see Table 3) have been outlined in different colors, and the timecourses of their responses are depicted in the surrounding line graphs. The lower middle line graph plots the grand mean response for all the regions in Table 3.
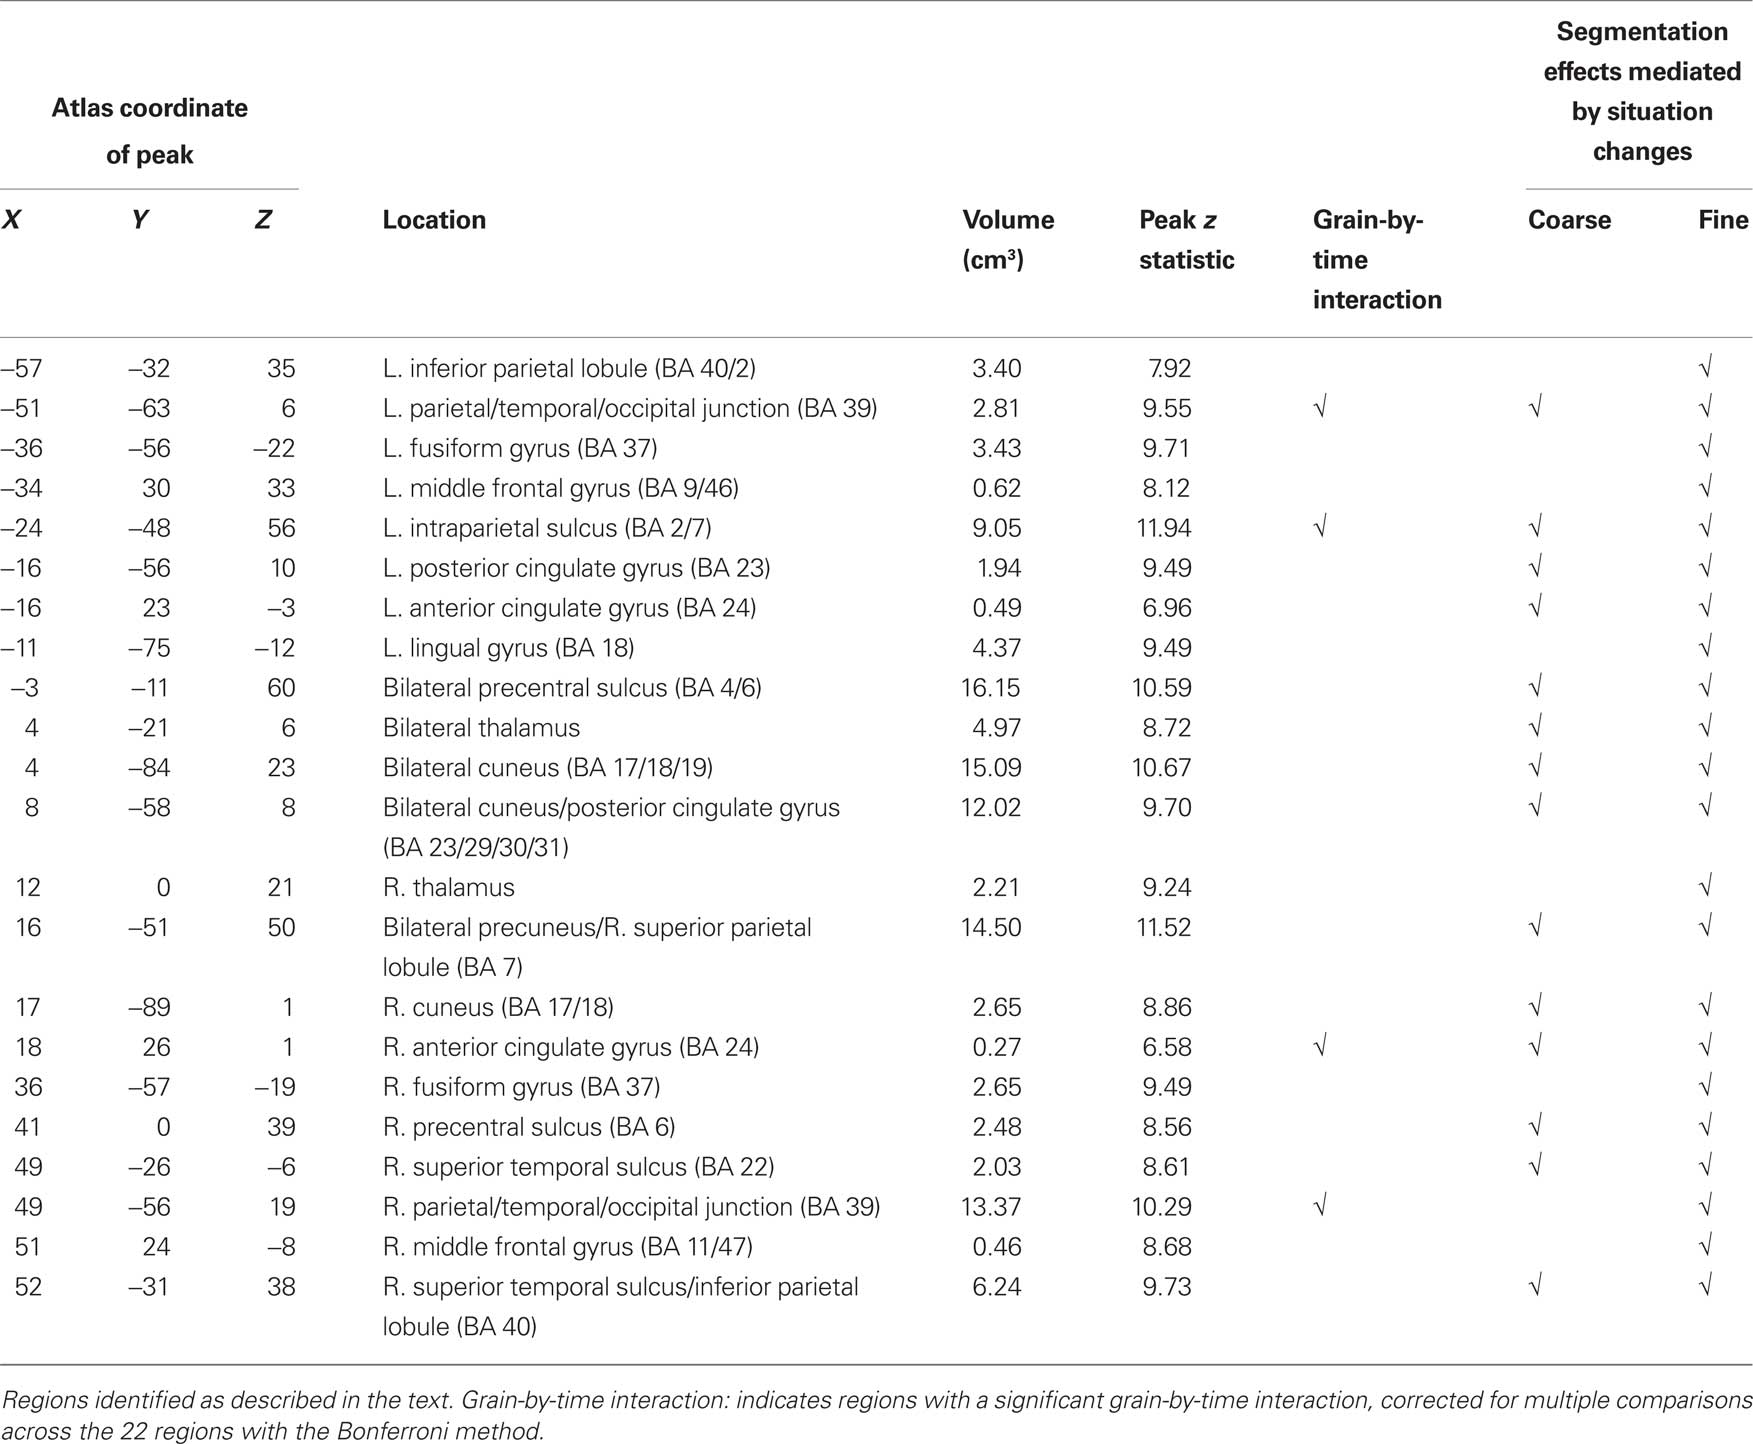
Table 3. Regions of significant transient fMRI change at event boundaries.
As can be seen in Figure 1, the evoked responses showed both consistency and variability. Regions with significant responses generally increased in activity beginning around the time of the event boundary, peaking 4–10 s later. This was sometimes followed by a negative-going deflection, particularly in medial locations. Overall, the response at fine event boundaries was more positive than that at coarse boundaries, though there were exceptions. To identify regions whose timecourse of response at coarse boundaries differed statistically from the response at fine boundaries, we examined the grain-by-time interaction term of the ANOVA. Four regions had significant Greenhouse–Geisser-corrected interaction terms; these are listed in Table 3 and their timecourses are depicted in Figure 2. Bilateral regions at the parietal-temporal-occipital junction showed responses that were similar to the modal brain response: increases in MRI signal that began around the time of the event boundary and peaked 4–10 s after the boundary, with larger responses at fine boundaries than coarse boundaries. The left intraparietal sulcus decreased in activity starting 4–8 s after the event boundary with a maximal decrease 10–14 s after the boundary; decreases were larger for coarse than for fine boundaries. The right anterior cingulate gyrus showed little response at fine boundaries but increased 10–16 s after coarse boundaries.
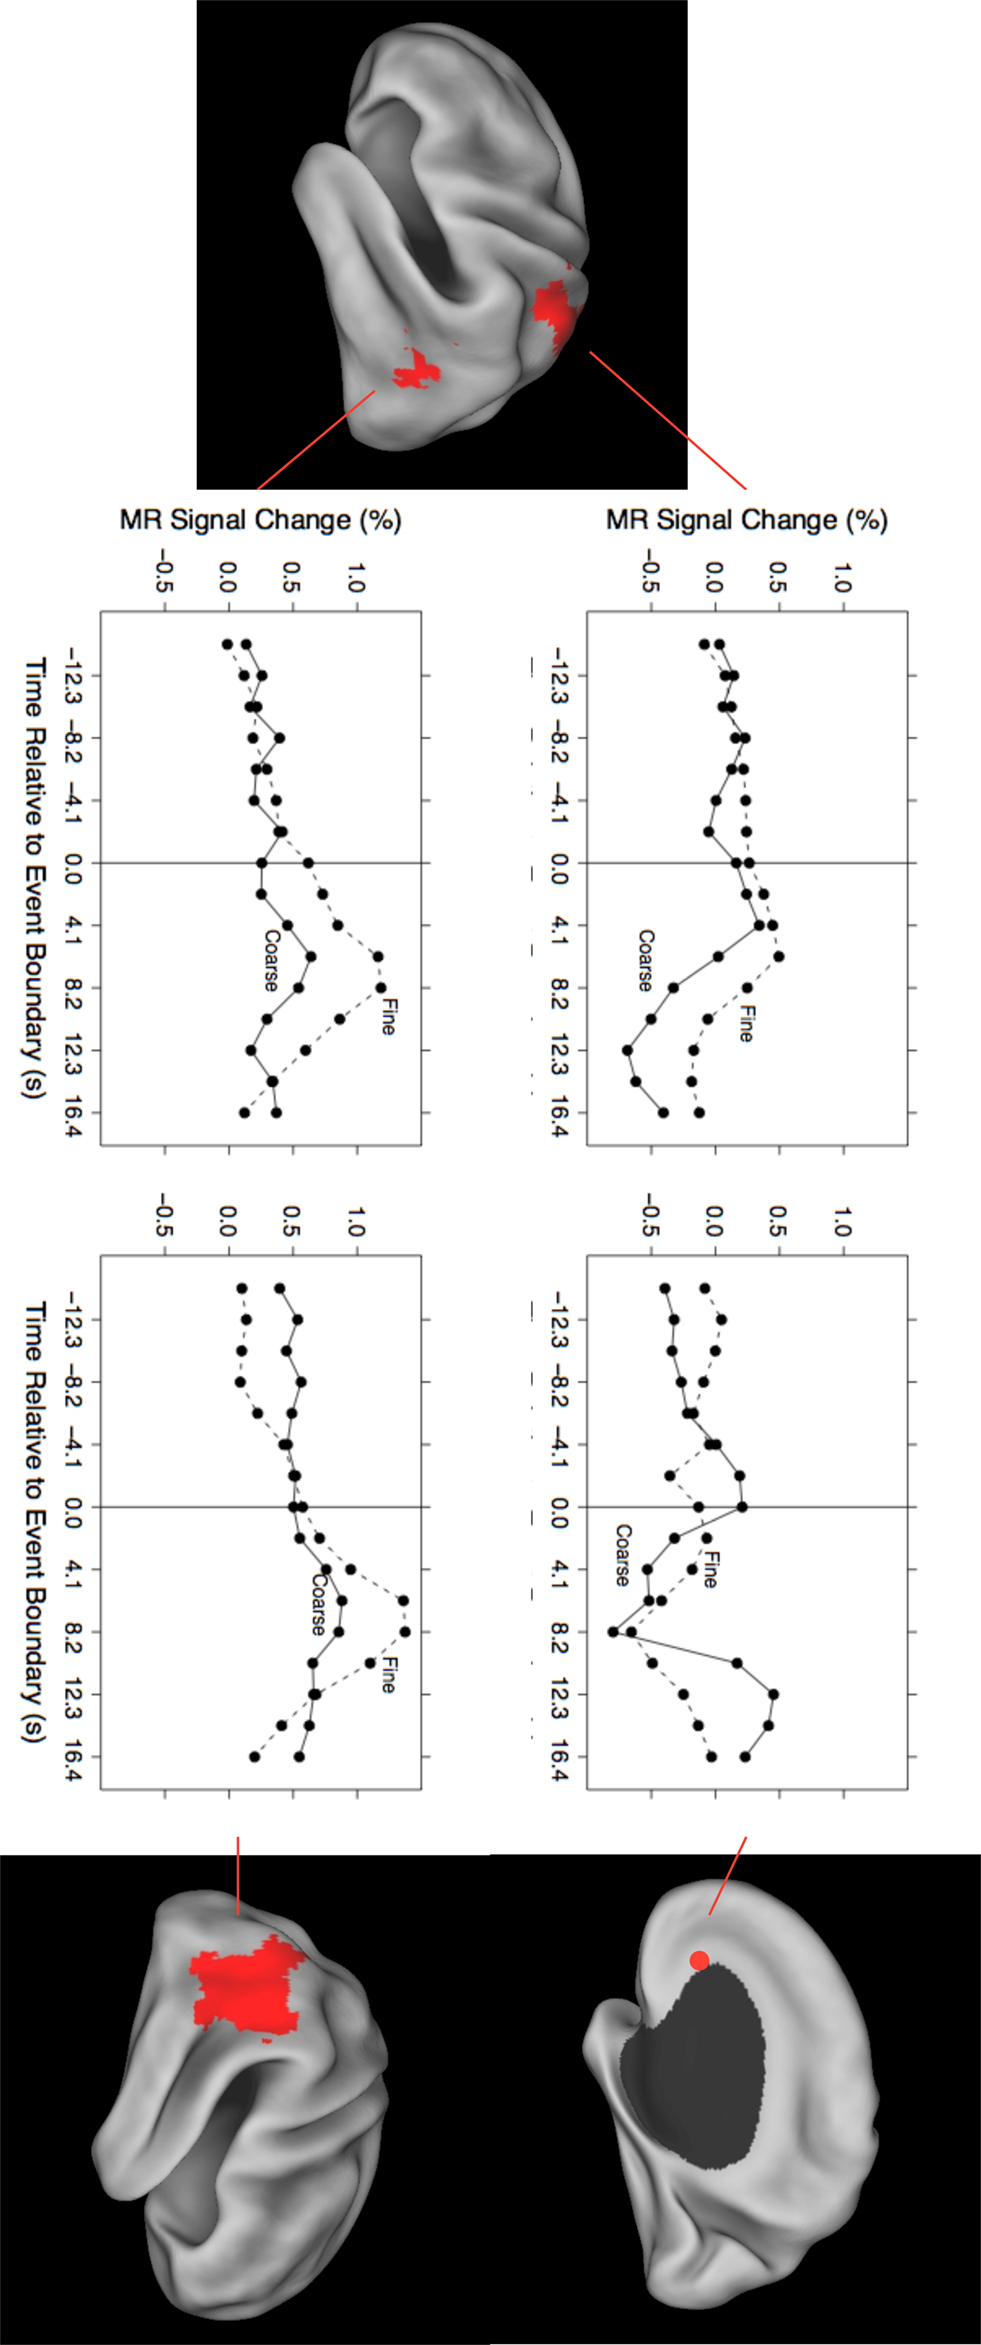
Figure 2. Timecourses for brain areas whose transient response to coarse and fine event boundaries differed significantly. Top left: left intraparietal sulcus (BA 2/7), −24, −48, 56; bottom left: left parietal-temporal-occipital junction (BA 39), −51, −63, 6; top right: right anterior cingulate gyrus (BA 24), 18, 26, 1; bottom right: right parietal-temporal-occipital junction (BA 39), 45, −56, 19.
Inspection of Figure 1 suggests that regions near MT+ and pSTS showed evoked responses at event boundaries. To assess which if any of these regions showed significant responses, we extracted timecourses of BOLD activity from the regions identified by the functional localizers. These timecourses were analyzed using the same GLM and ANOVA forms as for the voxel-wise whole-brain analyses. As indicated in Table 2, both left and right pSTS showed significant evoked responses (main effect of time) and significant modulation by segmentation grain (grain-by-time interaction). Inspection of the pSTS timecourses indicated that they showed the typical pattern illustrated in Figure 1, with larger changes for fine event boundaries than coarse event boundaries. Neither MT+ nor the left somatomotor region showed such effects.
Brain Response at Situation Changes
To estimate the brain response to situation changes, we constructed GLMs with the fMRI signal at each voxel as the dependent measure, and variables coding for each of the situation changes as predictor variables. To test specifically for changes in brain activity occurring close in time to the situation change, predictors were constructed by convolving an impulse response function time-locked to the situation change with a canonical hemodynamic response function (Boynton et al., 1996). The model included variables modeling each of the six situation changes, and also included variables coding for effects of no interest as for the previous analysis. GLMS were fitted for each participant and the effect estimates were submitted to t-tests with participant as a random effect. Regions were clustered and thresholded as described for the brain response at event boundaries (see previous section). To control the map-wise false positive rate at p = 0.05, a z threshold of 4.5 and cluster size of 2 were used (McAvoy et al., 2001); regional analyses were again conducted by selecting peaks whose z value exceeded 6.0 and combining peaks closer than 30 mm. The voxels that responded significantly to changes in each of the situational dimensions are illustrated in Figure 3 and the clustered peaks are listed in Table 4.
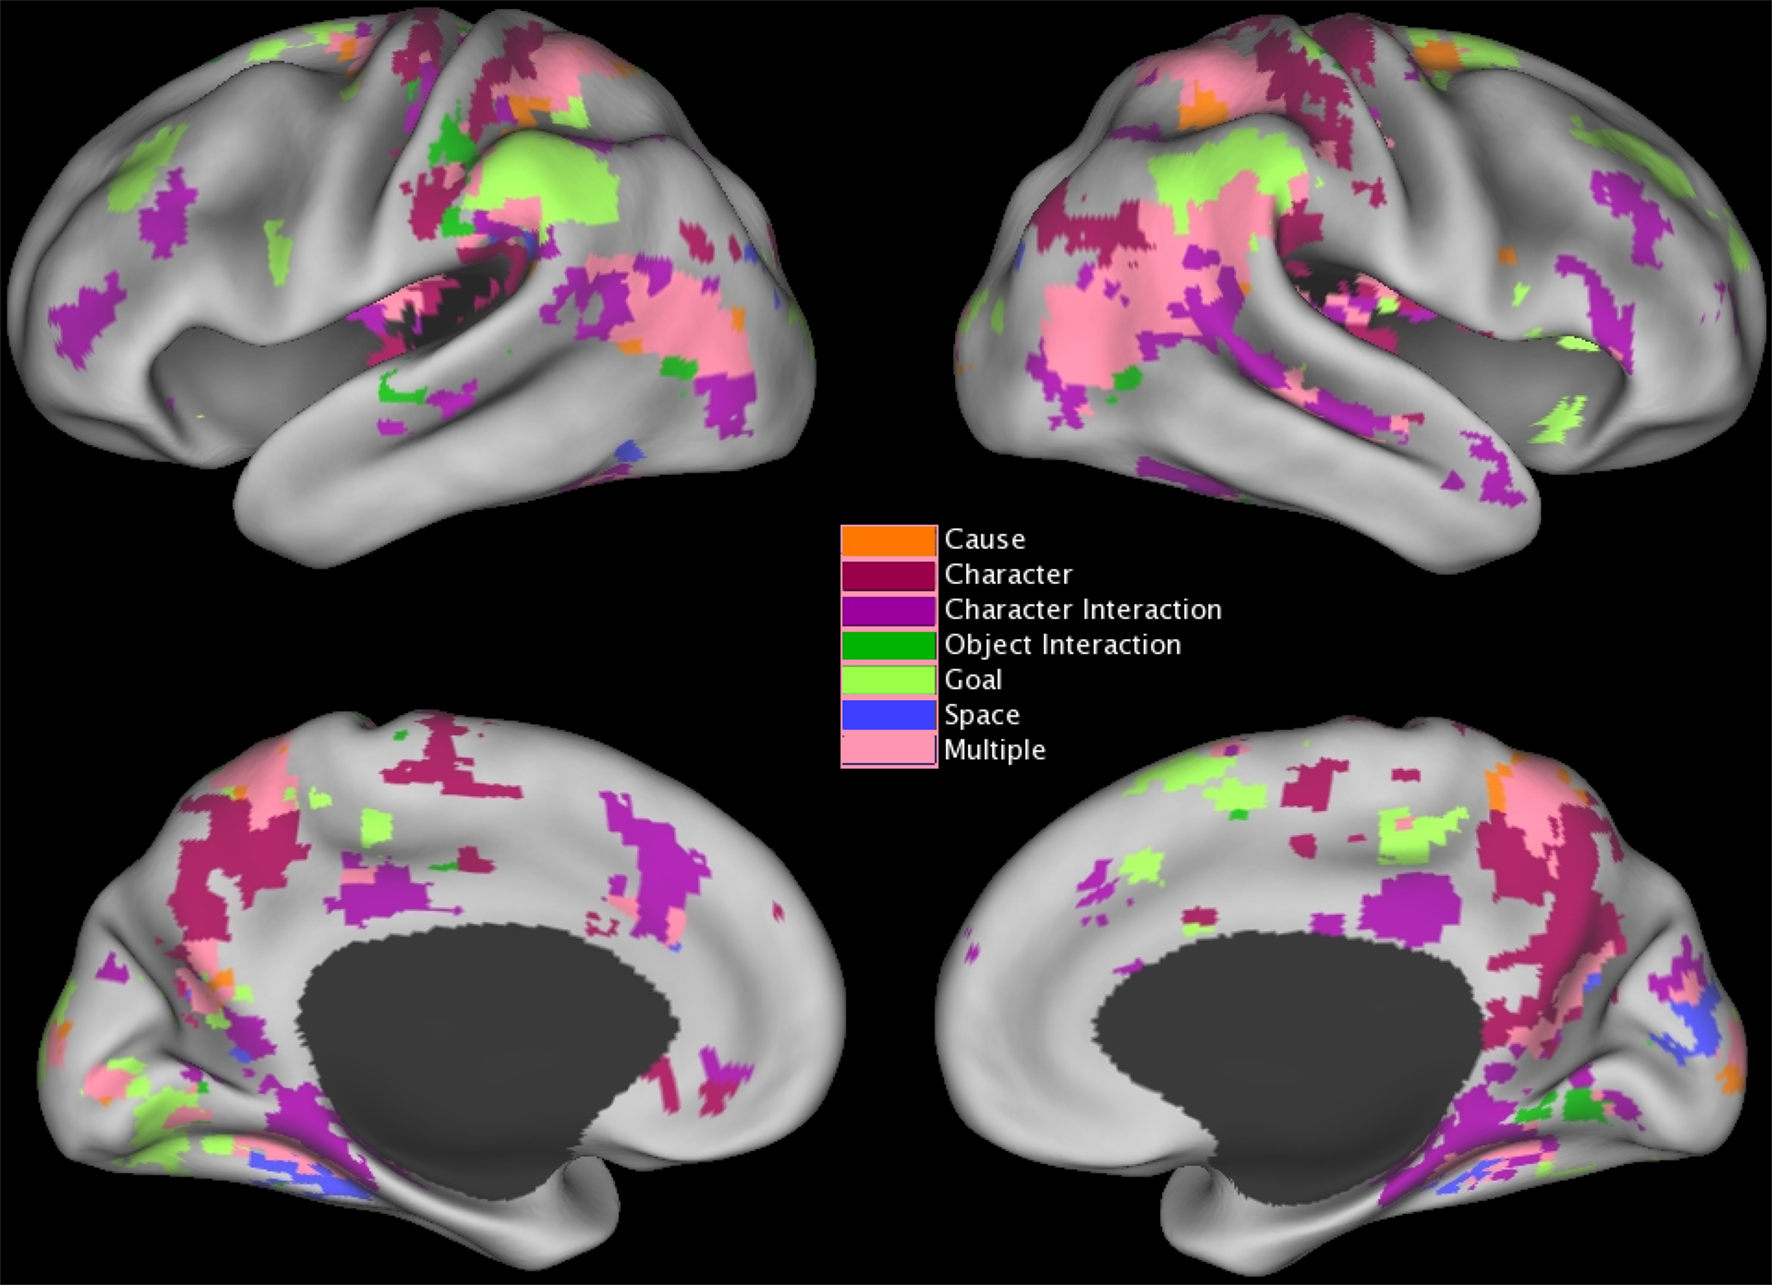
Figure 3. Distribution of brain areas with significant transient changes at event boundaries, projected on inflated renderings of the cortical hemispheres using CARET (Van Essen et al., 2001) and the PALS cortical surface atlas (Van Essen, 2005). Coloring shows the z statistic value at each voxel.
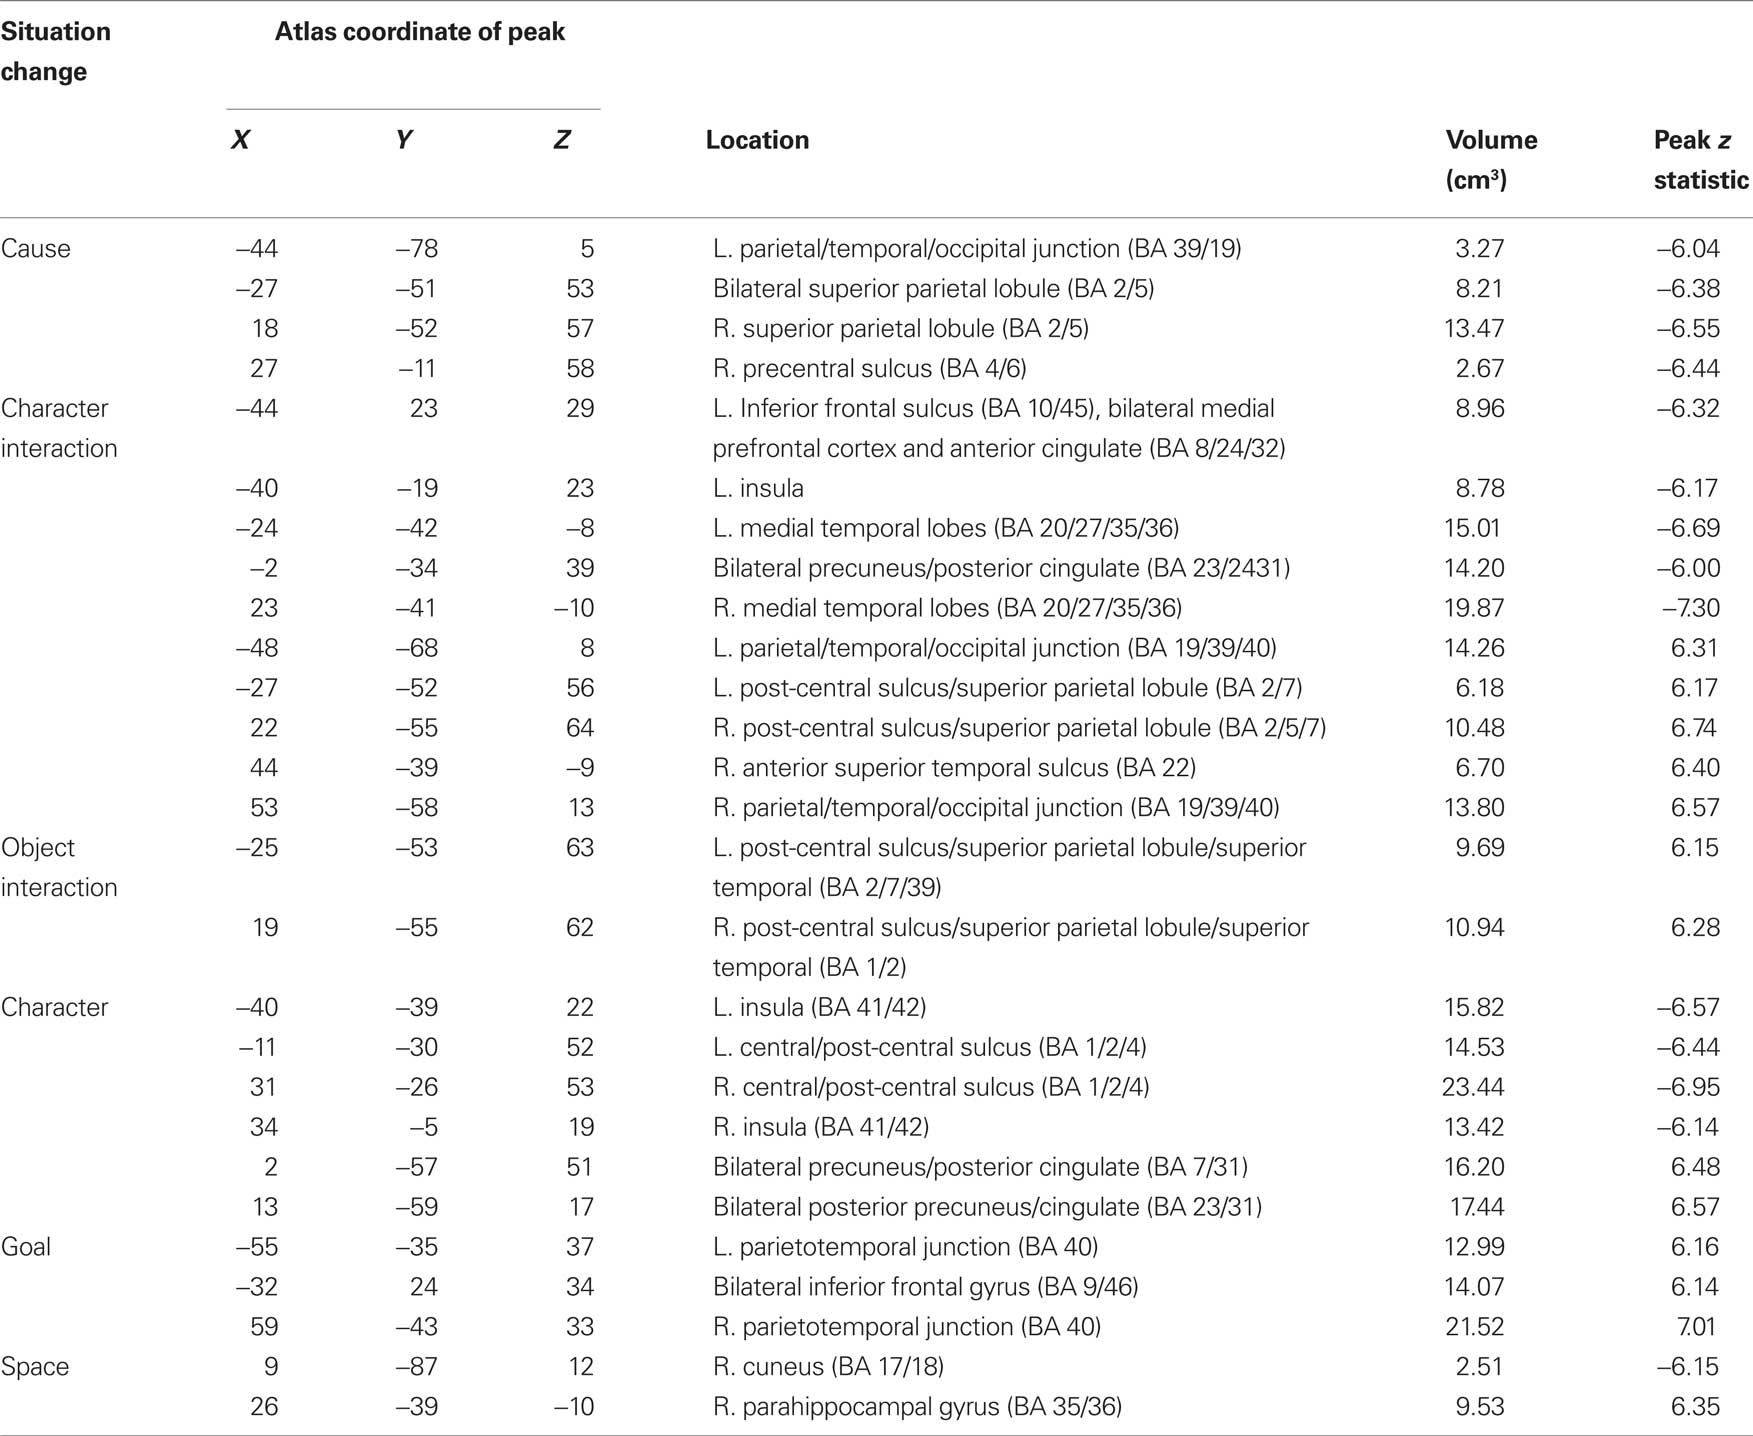
Table 4. Regions of significant transient fMRI change at situation changes.
In Figure 3 voxels that were significantly associated with changes to more than one situation dimension are shown in pink. As can be seen in the figure, responses to multiple situation changes were observed in a large number of voxels around the parietal-temporal-occipital junction, and in medial and lateral superior parietal cortex. In addition, a number of voxels showed significant responses to only one type of situation change. Character changes were associated with increases in the precuneus and posterior cingulate (BA 5/7/23/31), and decreases in the insula (BA 41/42) and around the superior part of the central sulcus (BA 1/2/4). All changes were bilateral. Character interaction changes were associated most prominently with increases along the length of the superior temporal sulcus (BA 22), joining at its rear aspect the large region at the parietal/temporal/occipital (PTO) junction that responded to multiple changes. Decreases at character interaction changes were observed in frontal regions including the medial prefrontal cortex and anterior cingulate (BA 8/24/32) and the left inferior frontal sulcus (BA 10/45), in the posterior cingulate gyrus (BA 23/24/31), and in the medial temporal lobes (BA 20/27/35/36). Object changes were associated with increases in the left post-central sulcus corresponding to the somatosensory hand representation (BA 2/40), in a more medial region in right post-central cortex (BA 1/2) and bilaterally on the inferior edge of the PTO multiple-change region (BA 37/39). Goal changes were associated with prominent increases in lateral inferior parietal cortex on the superior edge of the PTO multiple-change region (BA 40) and the superior frontal sulcus (BA 9/46); both of these were bilateral. Increases at goal changes also were observed in the right frontal operculum (BA 44/45). Finally, spatial changes were associated with increases in the parahippocampal gyrus (BA 35/36) bilaterally (though the left hemisphere region did not have a peak greater than z = 6.0 and thus is not listed in Table 4), and decreases in the right cuneus (BA 17/18). (Note that this description focuses on those components that did not respond significantly to more than one situation change; Table 4 includes overlapping regions in the list for each type of change.)
To test specifically for regions that responded only to a single type of situation change, we computed a set of hierarchical linear regressions (Speer et al., 2009). In stage 1 we predicted the fMRI signal for each participant for each region from the nuisance variables and the situation change variable used to define the region. In stage 2 we used each of the remaining situation change variables as the sole predictors in a simple regression model of the residuals from the stage 1 model. The regression coefficients from the stage 2 models were compared to zero in t-tests with subject as the random effect (df = 23). We adopted a criterion that labeled regions for which none of the t statistics exceeded 1.0 as selective for a single situation change. Only one region met this sensitivity criterion: The central sulcus region that decreased during character changes (peak location: −11, −30, 52) did not show substantial effects of any other situation changes. Thus, the majority of responses to situation changes were in regions that tracked the activity of two or more situational dimensions.
To characterize the response of pSTS, MT+ and SM to situation changes, we submitted the timecourses extracted from these regions to analyses of the same form as the voxel-wise analyses. The results, shown in Table 2, indicate that activity in left and right pSTS was strongly influenced by situation changes: These regions decreased significantly at causal changes and increased for all the other situation changes. Activity in left MT+ was related less strongly to situation changes: activity increased in left and right MT+ at new character interactions and spatial changes, and decreased at goal changes. Activity in left MT+ also decreased at character changes. Activity in the left somatomotor region decreased significantly for all changes except causal changes.
Comparing Figure 1 and Figure 3 suggests a large degree of overlap between those brain areas that responded at event boundaries and those that responded at situation changes. One possibility is that the transient responses observed at event boundaries reflect in part the brain’s processing of situation changes. To assess this, we conducted a hierarchical analysis in which we estimated responses at event boundaries with and without simultaneously modeling effects of situation changes. We first computed timecourses for the response at event boundaries for each region, by fitting GLMs of the same as the voxel-wise analysis (see Brain Response at Event Boundaries). We then computed a second set of GLMs that included the situation change variables as described in this section, as well as the event boundary variables. The computed timecourses for each region were submitted to two-way ANOVAs, with model (with or without situation changes) and timepoint as the independent variables. This was performed separately for coarse and fine segmentation. The model-by-timepoint interaction was tested (with a Greenhouse–Geisser correction for violation of sphericity). In such an analysis, a significant interaction indicates that including the situation change variables in the GLMs affected the measured timecourses, i.e., that some of the measured response at event boundaries could be attributed to situation changes. The last column of Table 3 show that this was true for fine-grained event boundaries in all of the regions that showed a main effect of timepoint in the original segmentation analysis. The second-to-last column shows that situation changes also accounted for part of the response at coarse-grained event boundaries in the majority (14) of regions. The event boundary timecourses from models computed with situation change variables showed smaller deviations from baseline, illustrated in Figure 4. To quantify this, we calculated the area under the curve of each timecourse. For 21 of the 22 fine timecourses and 10 of the 14 coarse timecourses with significant interactions, the area under the curve was reduced once the situation changes were added to the model. Thus, the data showed strong evidence that the brain response at event boundaries was mediated by the effects of situation changes.
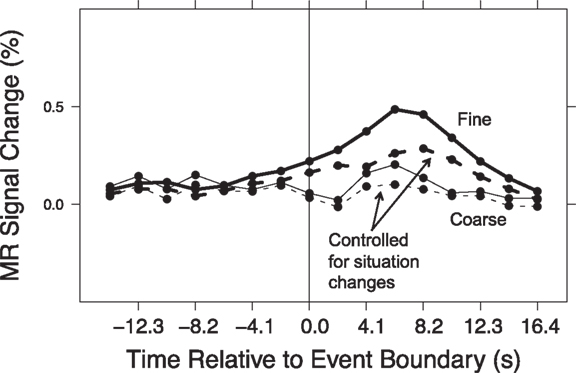
Figure 4. Timecourse of response to event boundaries, before and after controlling for situation changes. Shown here is the mean timecourse for the regions described in Figure 3.
Discussion
The present data provide strong evidence that when attended dimensions of a situation change, this gives rise to a neural cascade that is consciously perceived as the end of one event and the beginning of a new one. Participants watched an extended narrative movie with multiple characters, large numbers of objects, and complex action sequences. They showed transient evoked brain responses at those points they would later go on to identify as event boundaries. This is the first report of such ongoing event segmentation for such extended naturalistic activity. The regions involved corresponded closely with those previously identified using movies of everyday events and simple geometric animations (Zacks et al., 2001a, 2006b), supporting a common segmentation mechanism.
The neural response at event boundaries was mediated by changes in the situation depicted by the film. The changes studied here included some that were closer to the physical stimulus – spatial location, objects, and characters – and some that were more conceptual – interactions between characters, goals, and causes. Even in the midst of rich information about movement, form, and color, such conceptual changes had strong effects. This supports the proposal that event segmentation results from the processing of changes in the dimensions of a situation to which a viewer attends.
A recent account of event segmentation predicts both that segmentation is automatic and that it depends on processing situational changes. According to Event Segmentation Theory (EST; Zacks et al., 2007), the perception of event boundaries is a side effect of prediction during ongoing perception. Prediction is of profound adaptive significance because it allows for anticipatory actions, and prediction is front and center in many current theories of perception (e.g., Enns and Lleras, 2008), action planning (e.g., Botvinick and Plaut, 2004), episodic memory (Conway, 2009), and language comprehension (e.g., Elman, 2009). EST proposes that perceptual prediction is aided by actively maintained memory structures called event models. Event models maintain a representation of “what is happening now” that is robust against incidental variation in sensory input, and that biases ongoing perceptual processing. For example, this top-down bias enables one to perceive a partially occluded reaching motion as reaching for a coffee mug rather than a screwdriver when the larger event involves making coffee. Event models are adaptive because activity is sequentially structured, and thus maintaining an integrated representation of what has happened recently can facilitate prediction and comprehension. However, event models need to be updated, else out-of-date information will lead to errors. EST proposes that prediction error is constantly monitored, and that when prediction error spikes event models are updated. People experience this updating as event boundaries. Thus segmentation is automatic because memory updating is an obligatory component of perceptual processing, and it depends on situational changes because increases in prediction error occur at changes.
In this study, brain responses were generally larger for fine-grained event boundaries than for coarse-grained event boundaries (see Figure 1). In previous studies of everyday events (Zacks et al., 2001a) and simple geometric animations (Zacks et al., 2006b), responses were larger for coarse-grained boundaries. The narrative film used here was much longer than previously used materials, and the lengths of the events identified were longer as well: Fine-grained events were about as long as the coarse-grained events identified in previous studies. One possibility is that the relation between event grain and evoked response magnitude is non-monotonic, with a maximum in the range of 20 to 40 s.
The use of functional localizers allows for a finer-grained assessment of the cognitive significance of these changes. First, the localizer data provide valuable information for interpreting the increases observed in the dominant-hemisphere grasp network (left post-central cortex) at new object interactions. This region was medial and posterior to the region identified by the somatomotor localizer, which presumably corresponds to primary motor and somatosensory cortex. Activity in the localizer region did not increase at object changes (it decreased). Together, these results suggest that, rather than primary sensory or motor cortex, non-primary components of the grasp network (Castiello, 2005) respond selectively during processing of object interactions.
In pSTS, a region that responds selectively to biological motion (Grossman et al., 2000; Beauchamp et al., 2003), activity increased at event boundaries and the magnitude of this evoked response depended on segmentation grain. This result replicates previous results using simple geometric animations (Zacks et al., 2006b). Surprisingly, MT+ did not show significant evoked responses at event boundaries, unlike in previous studies using movies of everyday events (Speer et al., 2003) or geometric animations (Zacks et al., 2006b). One possibility is that for an extended narrative film such as this, viewers monitor a different set of predicted feature values than for naturalistic everyday activities or simple animated motions. For extended narrative films situational features having to do with sequences of goal-directed action may be relatively more salient and the details of motion paths less salient. Another possibility is that the absence of MT+ reflects stimulus-specific effects on the features viewers monitor. The Red Balloon contains many long tracking shots of characters running, which may render low-level movement information less predictive. These possibilities are consistent with the finding that activity in pSTS increased strongly at five of six situation changes, whereas MT+ showed weaker responses to situation changes. These possibilities also are consistent with the finding of Hasson et al. (2008), that MT+ was sensitive to information on relatively short timescales, whereas the STS was sensitive to information on longer timescales. (However, the STS region in that study may have included more anterior components of the sulcus as well.)
The present results bear a striking similarity to those obtained using narrative texts as stimuli. First, a similar network of brain regions showed evoked responses at event boundaries. The major difference was that in the present study (and in previous studies using movies) effects were seen in lateral visual areas that likely included areas specialized for processing visual motion. Second, similar regions responded to situation changes; in particular, the inferior parietal responses to goal changes, the parahippocampal responses to spatial changes, and the left somatosensory responses closely resemble the previous responses observed with texts. Finally, for both texts and movies, situation changes mediated the relations between event boundaries and these evoked brain responses. These similarities can be seen vividly by comparing Figure 1 and Figure 3 to Figure 1 in Speer et al. (2007) and Figure 1 in Speer et al. (2009), respectively.
The finding of feature-specific responses during the ongoing viewing of an extended narrative film converges well with previous studies of visual perception in extended narrative films. Hasson et al. (2004) had participants view 30 min of a commercial film and identified regions that showed timecourses of brain activity that were consistent across viewers. They then identified the regionally specific timecourses of activity, and investigated the visual features associated with peaks in activity in each of these timecourses. A region in the post-central sulcus was associated with viewing fine hand movements, similar to the present finding of post-central activation when viewing object changes. Both results likely reflect activation of the dominant-hemisphere grasp network (Castiello, 2005). A region in the collateral sulcus (one of the borders of the parahippocampal gyrus) responded selectively when participants viewed landscapes and buildings, similar to the present finding of parahippocampal activity at spatial changes. These activations likely correspond to the “parahippocampal place area,” a region that has been found to be selectively activated when viewing pictures of spaces (Epstein, 2008). Hasson and colleagues also observed category-specific responses to the viewing of faces. Bartels and Zeki (2004) adopted a complementary approach, coding a commercial film for the presence of color, faces, language, and human bodies and then identifying regions that responded selectively to one of the features. They observed results consistent with those of Hasson et al. and with the present study.
From time to time, theories of narrative comprehension have been applied to the perception and memory of movies (Baggett, 1979; Lichtenstein and Brewer, 1980; Brewer and Dupree, 1983; Magliano et al., 1996, 2001; Zacks et al., 2009b) and virtual reality (Radvansky and Copeland, 2006). This reflects an implicit hypothesis that common mechanisms apply to understanding stories and real life. The present results support this hypothesis. More deeply, they bring together theoretical claims in discourse processing with broader models of perceptual processing. As noted previously, contemporary discourse models propose that representations of narrative are segmented at changes in the situation described by the text. Accounts of why and how this happens have been relatively impoverished. The teleological explanation has been that segmentation is necessary to deal with limited capacity. Capacity is surely limited, but this does not explain why segmentation should be the solution rather than continuous decay. Mechanistic explanations have been minimal. EST proposes both a teleological and a mechanistic explanation for the construction of segmented situation models. The teleological explanation is this: Event models exist to use information about the recent past to bias processing of current information to make better predictions. They need to be updated in a fashion that is (a) statistically advantageous, and (b) computable without an explicit teaching signal. The mechanistic explanation (which is still incomplete) is this: Event models are maintained by recurrent firing patterns of cortical neurons, likely in the prefrontal cortex, that are reset in response to transient spikes in prediction error.
These results also have important implications for knowledge representation. Event models are structured representations of particular events; as such, they are closely related to event schemata, which are structured representations of event types (Zwaan and Radvansky, 1998). Event schemata, and the related concepts of scripts and structured event complexes, have been important constructs in theories of event memory and action planning (Rumelhart, 1980; Abelson, 1981; Spector and Grafman, 1994). However, a major challenge for schema theories is how schemata are to be learned. One big part of that problem is identifying the units that may be combined to make up structured events. Identifying the right set of units is necessary to characterize how they combine in structured representations. For example, in the classic work on scripts by Bower et al. (1979), it was proposed that the participants had a general script for going to a health care practitioner that included components such as checking in, taking weight and blood pressure, and having an exam. However, such generalization cannot take place until the units are segmented out and their features are represented in a format that can support generalization. The segmentation mechanisms characterized here may give part of an explanation for how these segments and their features are pulled out of the behavior stream.
Conflict of Interest Statement
The authors declare that the research was conducted in the absence of any commercial or financial relationships that could be construed as a potential conflict of interest.
Acknowledgments
This research was supported by the National Institute of Mental Health (R01-MH70674). The authors thank Michelle Eisenberg for thoughtful comments on the manuscript, and thank Mary Derbish and Jennifer Scott for assistance with the situation change coding.
Footnotes
References
Baggett, P. (1979). Structurally equivalent stories in movie and text and the effect of the medium on recall. J. Verbal Learn. Verbal Behav. 18, 333–356.
Bartels, A., and Zeki, S. (2004). Functional brain mapping during free viewing of natural scenes. Hum. Brain Mapp. 21, 75–85.
Beauchamp, M. S., Lee, K. E., Haxby, J. V., and Martin, A. (2003). fMRI responses to video and point-light displays of moving humans and manipulable objects. J. Cogn. Neurosci. 15, 991–1001.
Biederman, I. (1987). Recognition-by-components: a theory of human image understanding. Psychol. Rev. 94, 115–117.
Botvinick, M. M., and Plaut, D. C. (2004). Doing without schema hierarchies: a recurrent connectionist approach to routine sequential action and its pathologies. Psychol. Rev. 111, 394–429.
Bower, G. H., Black, J. B., and Turner, T. J. (1979). Scripts in memory for text. Cogn. Psychol. 11, 177–220.
Boynton, G. M., Engel, S. A., Glover, G. H., and Heeger, D. J. (1996). Linear systems analysis of functional magnetic resonance imaging in human V1. J. Neurosci. 16, 4207–4221.
Brewer, W. F., and Dupree, D. A. (1983). Use of plan schemata in the recall and recognition of goal-directed actions. J. Exp. Psychol. Learn. Mem. Cogn. 9, 117–129.
Buckner, R. L., Head, D., Parker, J., Fotenos, A. F., Marcus, D., Morris, J. C., and Snyder, A. Z. (2004). A unified approach for morphometric and functional data analysis in young, old, and demented adults using automated atlas-based head size normalization: reliability and validation against manual measurement of total intracranial volume. Neuroimage 23, 724–738.
Ebbesen, E. B. (1980). “Cognitive processes in understanding ongoing behavior,” in Person Memory: The Cognitive Basis of Social Perception, ed. R. Hastie (Hillsdale, NJ: Lawrence Erlbaum Associates), 179–225.
Elman, J. L. (2009). On the meaning of words and dinosaur bones: lexical knowledge without a lexicon. Cogn. Sci. 33, 547–582.
Enns, J., and Lleras, A. (2008). What’s next? New evidence for prediction in human vision. Trends Cogn. Sci. (Regul. Ed.) 12, 327–333.
Epstein, R. (2008). Parahippocampal and retrosplenial contributions to human spatial navigation. Trends Cogn. Sci. (Regul. Ed.) 12, 388–396.
Grossman, E. D., Donnelly, M., Price, R., Pickens, D., Morgan, V., Neighbor, G., Blake, R. (2000). Brain areas involved in perception of biological motion. J. Cogn. Neurosci. 12, 711–720.
Hard, B. M., Tversky, B., and Lang, D. (2006). Making sense of abstract events: building event schemas. Mem. Cognit. 34, 1221–1235.
Hasson, U., Nir, Y., Levy, I., Fuhrmann, G., and Malach, R. (2004). Intersubject synchronization of cortical activity during natural vision. Science 303, 1634–1640.
Hasson, U., Yang, E., Vallines, I., Heeger, D. J., and Rubin, N. (2008). A hierarchy of temporal receptive windows in human cortex. J. Neurosci. 28, 2539–2550.
Lichtenstein, E. D., and Brewer, W. F. (1980). Memory for goal-directed events. Cogn. Psychol. 12, 412–445.
Magliano, J., Dijkstra, K., and Zwaan, R. (1996). Predictive inferences in movies. Discourse Process. 22, 199–224.
Magliano, J. P., Miller, J., and Zwaan, R. A. (2001). Indexing space and time in film understanding. Appl. Cogn. Psychol. 15, 533–545.
McAvoy, M., Ollinger, J. M., and Buckner, R. L. (2001). Cluster size thresholds for assessment of significant activation in fMRI. Neuroimage 13, S198.
Newtson, D. (1976). “Foundations of attribution: the perception of ongoing behavior,” in New Directions in Attribution Research, eds J. H. Harvey, W. J. Ickes, and R. F. Kidd (Hillsdale, NJ: Lawrence Erlbaum Associates), 223–248.
Newtson, D., Engquist, G., and Bois, J. (1977). The objective basis of behavior units. J. Pers. Soc. Psychol. 35, 847–862.
Ollinger, J. M., Corbetta, M., and Shulman, G. L. (2001). Separating processes within a trial in event-related functional MRI II: analysis. Neuroimage 13, 218–229.
Radvansky, G., and Copeland, D. (2006). Walking through doorways causes forgetting: situation models and experienced space. Mem. Cognit. 34, 1150–1156.
Rumelhart, D. E. (1980). “Schemata: the building blocks of cognition,” in Theoretical Issues in Reading Comprehension: Perspectives from Cognitive Psychology, Linguistics, Artificial Intelligence, and Education, eds R. J. Spiro, B. C. Bruce, and W. F. Brewer (Hillsdale, NJ: L. Erlbaum Associates), 33–58.
Sekuler, R., Watamaniuk, S. N. J., and Blake, R. (2002). Perception of Visual Motion, Vol. 1. New York: John Wiley and Sons, 121–176.
Sharp, R. M., Lee, J., and Donaldson, D. I. (2007). “Electrophysiological correlates of event segmentation: how does the human mind process ongoing activity?” in Annual Meeting of the Cognitive Neuroscience Society. New York.
Spector, L., and Grafman, J. (1994). Planning, Neuropsychology and Artificial Intelligence: Cross-Fertilization, Vol. 9. Amsterdam: Elsevier, 377–392.
Speer, N. K., Reynolds, J. R., Swallow, K. M., and Zacks, J. M. (2009). Reading stories activates neural representations of perceptual and motor experiences. Psychol. Sci. 20, 989–999.
Speer, N. K., Reynolds, J. R., and Zacks, J. M. (2007). Human brain activity time-locked to narrative event boundaries. Psychol. Sci. 18, 449–455.
Speer, N. K., Swallow, K. M., and Zacks, J. M. (2003). Activation of human motion processing areas during event perception. Cogn. Affect. Behav. Neurosci. 3, 335–345.
Speer, N. K., and Zacks, J. M. (2005). Temporal changes as event boundaries: processing and memory consequences of narrative time shifts. J. Mem. Lang. 53, 125–140.
Sridharan, D., Levitin, D., Chafe, C., Berger, J., and Menon, V. (2007). Neural dynamics of event segmentation in music: converging evidence for dissociable ventral and dorsal networks. Neuron 55, 521–532.
Swallow, K., Braver, T., Snyder, A., Speer, N., and Zacks, J. (2003). Reliability of functional localization using fMRI. Neuroimage 20, 1561–1577.
Swallow, K. M., and Zacks, J. M. (2006). Hierarchical grouping of events revealed by eye movements. Abstr. Psychon. Soc. 11, 81.
Talairach, J., and Tournoux, P. (1988). Co-planar Stereotaxic Atlas of the Human Brain: 3-Dimensional Proportional System, an Approach to Cerebral Imaging. Stuttgart: G. Thieme.
Tootell, R. B., Reppas, J. B., Kwong, K. K., Malach, R., Born, R. T., Brady, T. J., Rosen, B. R., and Belliveau, J. W. (1995). Functional analysis of human MT and related visual cortical areas using magnetic resonance imaging. J. Neurosci. 15, 3215–3230.
Van Essen, D. (2005). A population-average, landmark- and surface-based (PALS) atlas of human cerebral cortex. Neuroimage 28, 635–662.
Van Essen, D. C., Drury, H. A., Dickson, J., Harwell, J., Hanlon, D., and Anderson, C. H. (2001). An integrated software suite for surface-based analyses of cerebral cortex. J. Am. Med. Inform. Assoc. 8, 443–459.
Whitney, C., Huber, W., Klann, J., Weis, S., Krach, S., and Kircher, T. (2009). Neural correlates of narrative shifts during auditory story comprehension. Neuroimage 47, 360–366.
Zacks, J. M. (2004). Using movement and intentions to understand simple events. Cogn. Sci. 28, 979–1008.
Zacks, J. M., Braver, T. S., Sheridan, M. A., Donaldson, D. I., Snyder, A. Z., Ollinger, J. M., Buckner, R. L., and Raichle, M. E. (2001a). Human brain activity time-locked to perceptual event boundaries. Nat. Neurosci. 4, 651–655.
Zacks, J. M., Tversky, B., and Iyer, G. (2001b). Perceiving, remembering, and communicating structure in events. J. Exp. Psychol. Gen. 130, 29–58.
Zacks, J. M., Kumar, S., Abrams, R. A., and Mehta, R. (2009a). Using movement and intentions to understand human activity. Cognition 112, 201–216.
Zacks, J. M., Speer, N. K., and Reynolds, J. R. (2009b). Segmentation in reading and film comprehension. J. Exp. Psychol. Gen. 138, 307–327.
Zacks, J. M., Speer, N. K., Swallow, K. M., Braver, T. S., and Reynolds, J. R. (2007). Event perception: a mind/brain perspective. Psychol. Bull. 133, 273–293.
Zacks, J. M., Speer, N. K., Vettel, J. M., and Jacoby, L. L. (2006a). Event understanding and memory in healthy aging and dementia of the Alzheimer type. Psychol. Aging 21, 466–482.
Zacks, J. M., Swallow, K. M., Vettel, J. M., and McAvoy, M. P. (2006b). Visual movement and the neural correlates of event perception. Brain Res. 1076, 150–162.
Zwaan, R. A., Magliano, J. P., and Graesser, A. C. (1995). Dimensions of situation model construction in narrative comprehension. J. Exp. Psychol. Learn. Mem. Cogn. 21, 386–397.
Zwaan, R. A., and Radvansky, G. A. (1998). Situation models in language comprehension and memory. Psychol. Bull. 123, 162–185.
Appendix
Behavioral Segmentation Results
The mean length of coarse-grained events was 59.4 s (SD 28.1 s); for fine segmentation, the mean length was 22.9 s (SD 13.8 s). As can be seen in Table 1 in Appendix, event lengths varied somewhat from clip to clip, and varied differently for coarse and fine segmentation, leading to a significant main effect on event length of clip [F(3, 69) = 10.8, p < 0.001], a significant main effect of grain [F(1, 23) = 92.1, p < 0.001], and a significant clip-by-grain interaction [F(3, 69) = 4.64, p = 0.005]. These clip-to-clip differences may reflect differences in the action depicted in each clip; they are unlikely to be of theoretical significance.
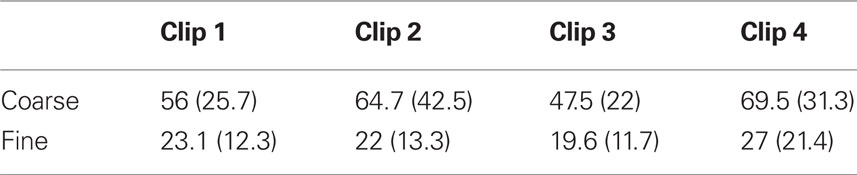
Table 1. Mean coarse and fine event lengths for each clip in seconds (standard deviations in parentheses).
To assess whether participants grouped fine-grained events hierarchically into larger units we used the overlap measure described by Zacks et al. (2001b). Each clip was divided into 5-s intervals, and the number of intervals each participant identified as coarse boundaries, fine boundaries, or both was used to assess the degree to which the coarse and fine boundaries aligned with one another. The number of intervals that were identified as both coarse and fine bins (M 25.5, SD 21.3) exceeded that expected by chance (M 13,8, SD 14.8), t(23) = 7.90, p < 0.001. Overlap did not vary significantly across clips [F(3, 69) = 1.53, p = 0.22]. Analyses with the alignment measure used in Zacks et al. (2001b) gave similar results. Thus, there was evidence that boundaries were grouped hierarchically.
We performed a pair of analyses examining the relations between situation changes and event segmentation. The first analysis predicted each individual’s probability of segmentation during each 5 s interval in the film as a function of the number of changes in that interval. The number of changes in each interval ranged from 0 to 5 (121 intervals with zero changes, 76 with one, 85 with two, 56 with three, 42 with four, and 18 with five). For each participant, we fit a logistic regression predicting the presence of event boundaries from the number of situation changes, separately for coarse and fine segmentation. The regression coefficients were compared to zero using t-tests with participant as the random effect. As can be seen in Figure 1 in Appendix, participants were more likely to identify event boundaries when larger numbers of situation dimensions changed. This effect was statistically significant for both coarse and fine segmentation; coarse: t(23) = 14.7, p < 0.001; fine: t(23) = 12.0, p < 0.001. The effect was significantly larger for fine than coarse segmentation, t(23) = 2.73, p = 0.01.
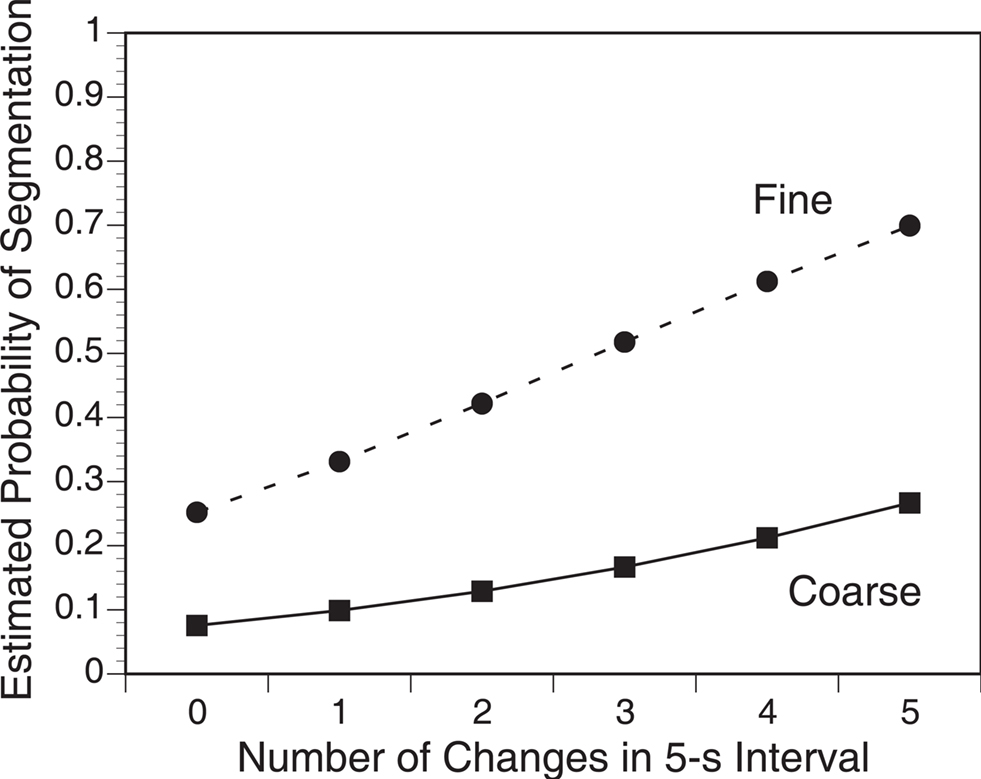
Figure 1. As the number of situation changes during the movie increased, viewers’ probability of coarse and fine segmentation increased. Estimated probabilities were calculated by fitting logistic regression models for each participant, constructing a model using the mean regression coefficients across participants, and predicting each data point from that model.
The second situation change analysis examined the relations between individual situation changes and behavioral segmentation. For each participant, we computed a logistic regression predicting segmentation from the individual situation changes and the presence of cuts. As can be seen in Figure 2 in Appendix, all of the situation changes were significantly associated with an increase in both coarse and fine segmentation. The strength of this relation was generally stronger for fine than coarse segmentation, leading to a significant main effect of grain in a repeated measures analysis of variance (ANOVA) with grain and situation dimension as independent variables, F(1, 23) = 6.80, p = 0.02. Character changes were associated with the largest increases in segmentation, whereas spatial changes and goal changes were associated with small increases. These differences across situation dimensions led to a main effect of situation dimension, F(5, 115) = 13.0, p < 0.001. Finally, the interaction between grain and situation dimension also was significant, F(5, 115) = 2.32, p = 0.05.
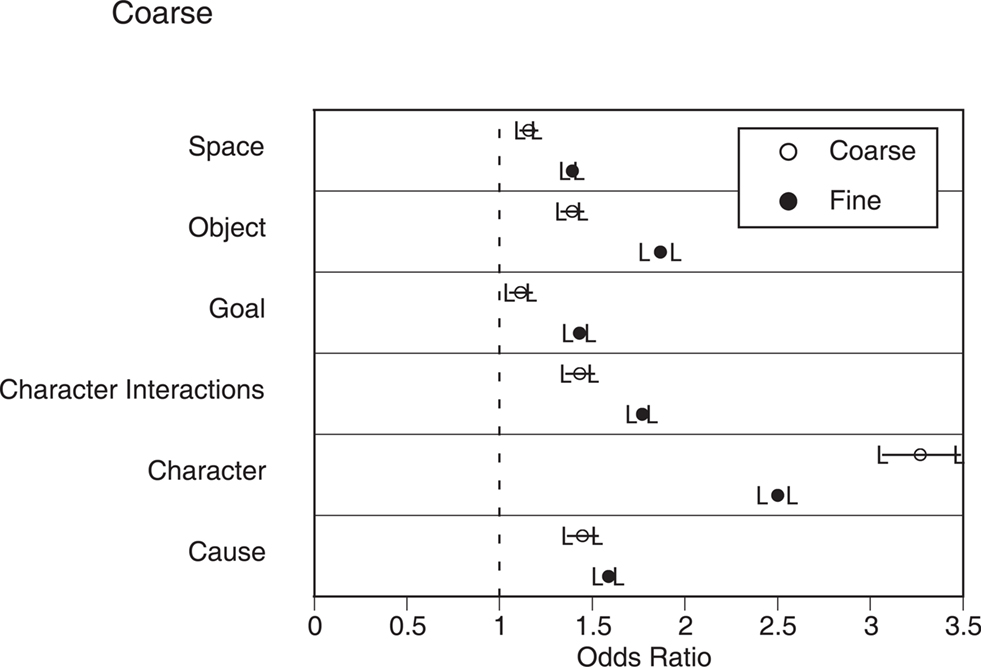
Figure 2. The relations between situation changes and segmentation in narrative film. Circles represent the odds ratios for the mean coefficients in the logistic regressions, and error bars represent the 95% confidence intervals for these odds ratios. Values whose confidence intervals do not include 1.0 (dashed lines) indicate a statistically significant relationship between changes on that dimension and segmentation.
We also examined the relations between cuts and segmentation. First, we fit logistic regression models predicting segmentation solely from the presence of a cut, and tested the regression coefficients with t-tests. We then fit logistic regression models that included the situation changes and again tested the regression coefficients for cuts with t-tests. In the first regressions, cuts were associated with significant increases in fine segmentation [estimated log odds: 1.42, t(23) = 4.81, p < 0.001] and marginal increases in coarse segmentation [estimated log odds: 1.18, t(23) = 2.03, p = 0.05]. However, after controlling for situation changes these effects were eliminated or reversed [fine segmentation estimated log odds: .87, t(23) = −1.7, p = 0.10; coarse segmentation estimated odds ratio: .70, t(23) = −3.37, p = 0.002]. Thus, cuts in and of themselves were not associated with increases in segmentation.
Keywords: action, cinema, discourse, event perception, functional MRI
Citation: Zacks JM, Speer NK, Swallow KM and Maley CJ (2010) The brain’s cutting-room floor: segmentation of narrative cinema. Front. Hum. Neurosci. 4:168. doi: 10.3389/fnhum.2010.00168
Received: 02 February 2010;
Paper pending published: 24 March 2010;
Accepted: 31 July 2010;
Published online: 01 October 2010
Edited by:
Neal J. Cohen, University of Illinois, USACopyright: © 2010 Zacks, Speer, Swallow and Maley. This is an open-access article subject to an exclusive license agreement between the authors and the Frontiers Research Foundation, which permits unrestricted use, distribution, and reproduction in any medium, provided the original authors and source are credited.
*Correspondence: Jeffrey M. Zacks, Department of Psychology, Washington University, St. Louis, MO 63130-4899, USA. e-mail: jzacks@artsci.wustl.edu