Perceptual and physiological responses to Jackson Pollock’s fractals
- 1 Department of Physics, University of Oregon, Eugene, OR, USA
- 2 School of Psychology, University of New South Wales, Sydney, NSW, Australia
- 3 Department of Human Physiology, University of Oregon, Eugene, OR, USA
- 4 Department of Work Science, Business Economics and Environmental Psychology, Swedish University of Agricultural Sciences, Alnarp, Sweden
Fractals have been very successful in quantifying the visual complexity exhibited by many natural patterns, and have captured the imagination of scientists and artists alike. Our research has shown that the poured patterns of the American abstract painter Jackson Pollock are also fractal. This discovery raises an intriguing possibility – are the visual characteristics of fractals responsible for the long-term appeal of Pollock’s work? To address this question, we have conducted 10 years of scientific investigation of human response to fractals and here we present, for the first time, a review of this research that examines the inter-relationship between the various results. The investigations include eye tracking, visual preference, skin conductance, and EEG measurement techniques. We discuss the artistic implications of the positive perceptual and physiological responses to fractal patterns.
Poured Complexity
The art world changed forever in 1945, the year that Jackson Pollock moved from downtown Manhattan to the countryside of Long Island, New York. Friends recall the many hours that Pollock spent on the back porch of his new house, staring out at the scenery as if assimilating the natural shapes surrounding him (see Figure 1; Potter, 1985). Using an old barn as his studio, he started to perfect a radically new approach to painting. The procedure appeared basic. Purchasing yachting canvas from his local hardware store, he simply rolled the large canvases (sometimes spanning five meters) out across the floor of the barn. Even the traditional painting tool – the brush – was not used in its expected capacity: abandoning physical contact with the canvas, he dipped the stubby, paint-encrusted brush in and out of a can and poured the fluid paint from the brush onto the canvas below. The uniquely continuous paint trajectories served as “fingerprints” of his motions through the air.
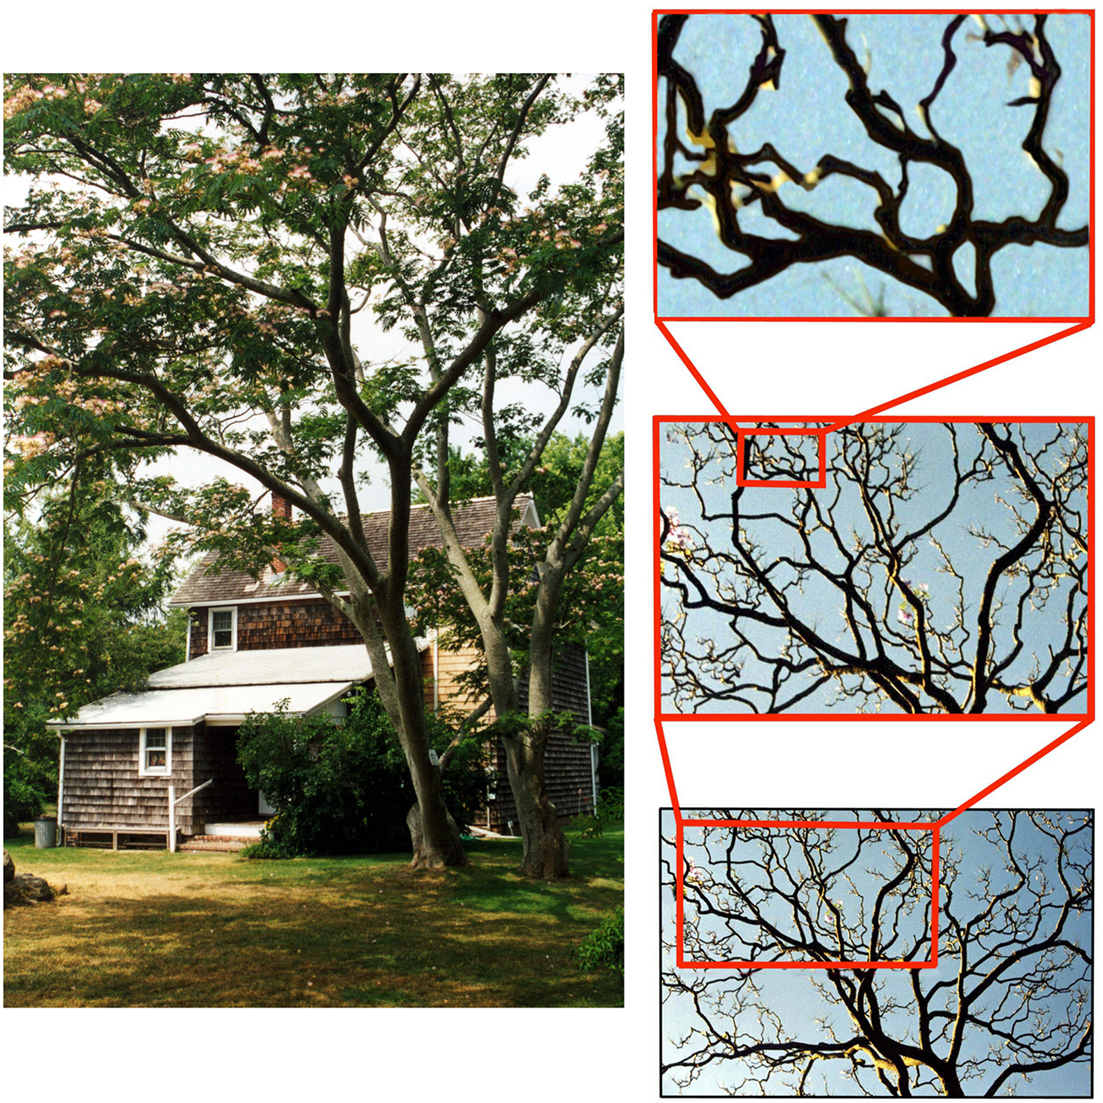
Figure 1. Left: Pollock’s house on Long Island. In contrast to his previous urban life in Manhattan, Pollock perfected his pouring technique surrounded by the complex patterns of nature. Right: Trees are an example of a natural fractal object. Although the patterns observed at different magnifications don’t repeat exactly, analysis shows them to have the same statistical qualities.
These deceptively simple acts fuelled unprecedented controversy and polarized public opinion of his work. Was this painting “style” driven by raw genius or was he simply mocking artistic traditions? Sixty-five years on, Pollock’s brash and energetic works continue to grab public attention and command staggering prices of up to $200M. Art theorists now recognize his patterns as a revolutionary approach to esthetics. However, despite the millions of words written about Pollock through the years, the real meaning behind his infamous swirls of paint remained the source of fierce debate in the art world (O’Connor, 1967; Varnedoe and Karmel, 1998).
One issue agreed upon early in the Pollock story was that his paintings represent one extreme of the spectrum of abstract art, with the paintings of his contemporary, Piet Mondrian, representing the other. Mondrian’s so-called “Abstract Plasticism” generated paintings that seem as far removed from nature as they possibly could be (Taylor, 2002a, 2004). They consist of elements – primary colors and straight lines – that never occur in a pure form in the natural world. In contrast to Mondrian’s simplicity, Pollock’s “Abstract Expressionism” speaks of complexity – a tangled web of intricate paint splatters. Whereas Mondrian’s patterns are traditionally described as “artificial” and “geometric,” Pollock’s are “natural” and “organic” (Taylor, 2011). But if Pollock’s patterns celebrate nature’s organic shapes, what shapes would these be?
Nature’s Fractals
Since the 1970s many of nature’s patterns have been shown to be fractal (Mandelbrot, 1982; Barnsley, 1993; Gouyet, 1996). In contrast to the smoothness of artificial lines, fractals consist of patterns that recur on finer and finer scales, building scale-invariant shapes of immense complexity. Even the most common fractal objects, such as the tree shown in Figure 1, contrast sharply with the simplicity of artificial shapes.
An important parameter for quantifying a fractal pattern’s visual complexity is the fractal dimension, D. This parameter describes how the patterns occurring at different magnifications combine to build the resulting fractal shape (Mandelbrot, 1982). For Euclidean shapes, dimension is described by familiar integer values – for a smooth line (containing no fractal structure) D has a value of 1, whilst for a completely filled area (again containing no fractal structure) its value is 2. However, the repeating patterns of a fractal line cause the line to begin to occupy space. As a consequence, its D value lies between 1 and 2. By increasing the amount of fine structure in the fractal mix of repeating patterns, the D value moves closer to 2 (Mandelbrot, 1982; Taylor and Sprott, 2008).
Thus, for fractals described by a low D value, the small content of fine structure builds a very smooth, sparse shape. However, for fractals with a D value closer to two, the larger content of fine structure builds a shape full of intricate, detailed structure (Taylor and Sprott, 2008). Figure 2 (left column) demonstrates how a pattern’s D value has a profound effect on the visual appearance. The pattern established by clouds (left, top) has a D value of 1.3, while the pattern established by the trees (left, bottom) has a D value of 1.9. Table 1 shows D values for various natural forms.
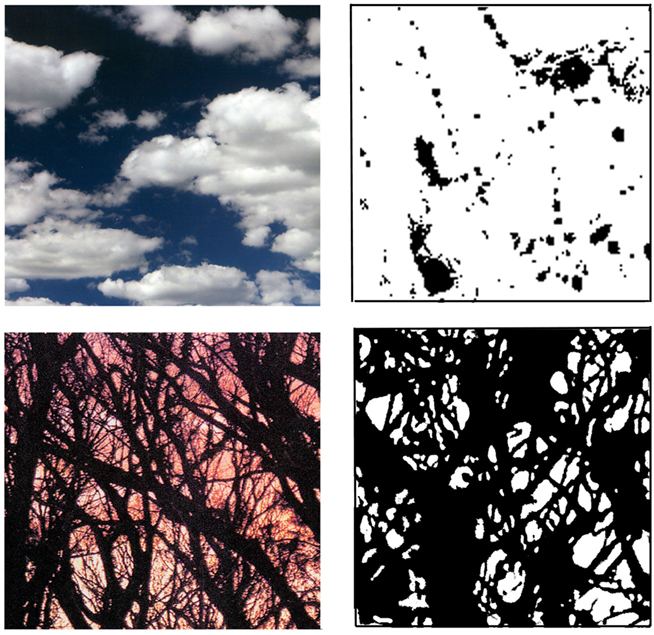
Figure 2. Examples of natural scenery (left column) and poured paintings (right column). Top: Clouds and Pollock’s painting Untitled (1945) are fractal patterns with low D values (D = 1.3 and 1.10 respectively). Bottom: A forest and Pollock’s painting Untitled (1950) are fractal patterns with high D values (both D = 1.89).
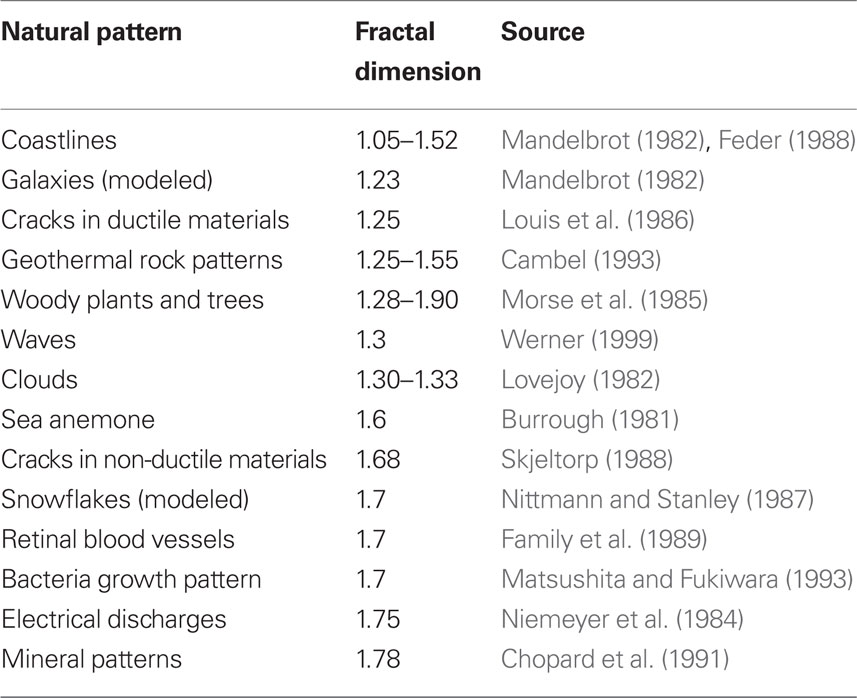
Table 1. D values for various natural fractal patterns.
Pollock’s Fractals
In 1999, we published an analysis of Pollock’s paintings that confirmed his poured patterns to be fractal (Taylor et al., 1999a). Building on this initial analysis, a number of groups have shown diverse fractal analysis techniques to be useful approaches to quantifying the visual complexity of Pollock’s poured patterns (Mureika et al., 2004, 2005; Mureika, 2005; Lee et al., 2006, 2007; Graham and Field, 2007, 2008; Redies, 2007; Redies et al., 2007; Alvarez-Ramirez et al., 2008a,b; Coddington et al., 2008; Irfan and Stork, 2009; Fairbanks et al., 2010). Our initial analysis employed the well-established “box-counting” method, in which digitized images of Pollock paintings were covered with a computer-generated mesh of identical squares (or “boxes”). The statistical scaling qualities of the pattern were then determined by calculating the proportion of squares occupied by the painted pattern and the proportion that were empty. This process was then repeated for meshes with increasingly small square sizes. Reducing the square size is equivalent to looking at the pattern at finer magnification. In this way, we could compare the pattern’s statistical qualities at different magnifications. Specifically, the number of squares, N(L), that contained part of the painted pattern were counted and this was repeated as the size, L, of the squares in the mesh was reduced. The largest size of square was chosen to match the canvas size (L ∼ 2.5 m) and the smallest was chosen to match the finest paint work (L ∼ 1 mm). For fractal behavior, N(L) scales according to the power law relationship N(L) ∼ L−D, where 1 < D < 2. This power law generates the scale-invariant properties that are central to fractal geometry. The D values, which chart this scale invariance, were extracted from the gradient of a graph of log N(L) plotted against log L. Details of the procedure, along with typical graphs, are presented elsewhere (Taylor et al., 2007). We note that the standard deviation associated with fitting the data to the fractal scaling behavior is such that D can be determined to an accuracy of two decimal places (Taylor et al., 2007).
Many of Pollock’s paintings are composed of a number of distinctly colored paint layers. One of the central challenges is to separate these layers so that each can be passed through the box-counting analysis. Colors have been filtered using the “physical” model based on red–green–blue primaries (Taylor et al., 1999a, 2007; Mureika, 2005) and also a “perceptual” model based on L*a*b* color space (Mureika, 2005). The extracted patterns are labeled as color “blobs,” and light-colored blobs typically have higher D values than darker blobs (Mureika, 2005). The question of how Pollock combined the blobs into an integrated, multi-colored visual fractal led us to investigate his painting technique in detail. We described Pollock’s style as “Fractal Expressionism” (Taylor et al., 1999b; Taylor, 2011) to distinguish it from computer-generated fractal art. Fractal Expressionism indicates an ability to generate and manipulate fractal patterns directly. In many ways, this ability to paint such complex patterns represents the limits of human capabilities. Our analysis of film footage taken at his peak in 1950 reveals a remarkably systematic process (Taylor et al., 2002). He started by painting localized islands of trajectories distributed across the canvas, followed by longer extended trajectories that joined the islands, gradually submerging them in a dense fractal web of paint. This process was very swift with the fractal dimension rising sharply to a mid-range value of D = 1.5 at 20 s. He would then break off and later return to the painting over a period of several days, depositing extra layers on top of this initial “anchor” layer (Taylor, 2011). Whether or not fractal layers merge to create a combined pattern that is also fractal depends on the relative D values of the individual layers, their densities and their degrees of overlap (Taylor et al., 2006; Taylor, 2011). In Pollock’s painting process, the combined patterns are fractal (Taylor et al., 2002; Mureika, 2005). The dark-colored, anchor layer set the initial D value of the painting, which was then fine-tuned by adding multiple, light-colored layers (Taylor et al., 2002). This fine-tuning process has been interpreted in terms of a mathematical union of the individual fractal layers (Vicsek, 1989), in which the combined pattern has a D value that matches the highest D of the individual layers (Mureika et al., 2005): thus as lighter-colored, higher D layers were added, the painting’s overall D value rose. Pollock’s multi-stage painting technique was therefore clearly aimed at generating high D fractal paintings (Taylor, 2011).
As shown in Figure 3, he perfected this technique over 10 years. Art theorists categorize the evolution of Pollock’s pouring technique into three phases (Varnedoe and Karmel, 1998). In the “preliminary” phase of 1943–1945, his initial efforts were characterized by low D values. An example is the fractal pattern of the painting Untitled from 1945, which has a D value of 1.10 (see Figure 2). During his “transitional phase” from 1945 to 1947, he started to experiment with the pouring technique and his D values rose sharply (as indicated by the first gradient in Figure 3). In his “classic” period of 1948–1952, he perfected his technique and D rose more gradually (second gradient in Figure 3) to the value of D = 1.7. During his classic period he also painted Untitled (see Figure 2), which has an even higher D value of 1.89. However, he immediately erased this pattern (it was painted on glass), prompting the speculation that he regarded this painting as too complex and immediately scaled back to paintings with D = 1.7. This suggests that his 10 years of refining the pouring technique were motivated by a desire to generate fractal patterns with D ∼ 1.7. This distinct evolution raises an intriguing question: did these higher D fractal patterns hold a special esthetic quality for Pollock and, if so, do observers of his work share the same preference?
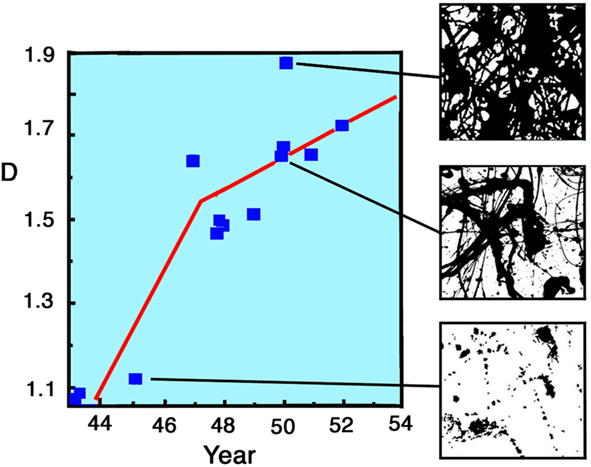
Figure 3. The fractal dimension D of Pollock paintings plotted against the year in which they were painted (1943–1953). See text for details. The right hand images show computer constructions of three of Pollock’s paintings.
In the following sections, we will present our investigations of how observers look at Pollock’s fractals. Our initial motivation for extracting the box-counting dimension for Pollock’s patterns was to facilitate a direct comparison with previous investigations of human response to fractals, which focused on the relationship between their esthetic value and D (see later). Before we move onto these comparisons, it is important to emphasize that D is just one of a spectrum of dimensions that can be used to quantify the scaling properties of fractal patterns. A number of groups, including ours, have gained further insight into the rich structure of Pollock’s patterns by performing a multi-fractal analysis (Mureika et al., 2005; Coddington et al., 2008; Irfan and Stork, 2009; Fairbanks et al., 2010). In addition, whereas our work focused on the colored blobs, the “edge” patterns extracted from the luminance gradients of grayscale images of Pollock’s work are also fractal (Mureika et al., 2005). The D values extracted from these fractal edge patterns can be related mathematically to a power spectrum analysis of the grayscale images (Fairbanks and Taylor, 2011). Spectral analysis of Pollock’s paintings reveals a scale-invariant power law behavior (Redies et al., 2007; Alvarez-Ramirez et al., 2008a; Graham and Field, 2008). This latter result is appealing because it facilitates a comparison between the luminance properties of Pollock’s work and those of other artworks (Graham and Redies, 2010; Koch et al., 2010) and natural scenery (Switkes et al., 1978; Field and Brady, 1997; Ruderman, 1997; Billock, 2000; Billock et al., 2001). However, the relationship between the grayscale (i.e., power spectral analysis) and colored (i.e., box-counting analysis of the blobs) patterns of Pollock’s fractals is not without its complexities (Fairbanks and Taylor, 2011) and our future research will continue to seek a precise characterization of this relationship. For the remainder of the present article, we restrict our analyses to the blob D values.
It is also valuable to highlight an inevitable restriction of all of the above forms of fractal analysis – that the fractal magnification range is limited. Unlike mathematical fractals, which span from the infinitesimally small through to the infinitely large, Pollock’s fractals can’t exceed the canvas size, nor can they be smaller than the smallest speck of paint. Concerns that Pollock’s limited magnification range prevents an accurate extraction of D values have been successfully addressed elsewhere (Taylor et al., 2006; Taylor, 2011). Of more interest for the current study is whether this magnification range is sufficient for the fractals to induce marked responses in the human visual system. The results that follow show that a magnification factor of only 20 (i.e., the largest pattern is just 20 times larger than the smallest) is enough to trigger striking responses. Significantly, most of nature’s fractals match this highly limited magnification range and Pollock’s fractals exceed it.
How Does the Eye Search through the Visual Complexity of Pollock’s Fractals?
The use of eye-tracking techniques to examine the gaze of the observer is a potentially powerful approach to understanding art appreciation (Busswell, 1935; Yarbus, 1967; Nodine and Krupinski, 2003; Locher, 2006). While eye-tracking investigations of many types of artworks have revealed a great inter individual variability in scan path characteristics, several systematic findings have emerged. For example, the spontaneous gaze behavior in viewing artworks seems to follow a “coarse-to-fine” strategy where an initial global sweep of the image is followed by a later period of visual scrutiny of finer local details (Locher et al., 2007). Furthermore, the points of high salience computed in terms of local feature differences in luminance, color and orientation were found to drive eye fixations in viewing abstract and representational artworks (Wallraven et al., 2007; DiPaola et al., 2010; Foulsham and Kingstone, 2010; Fuchs et al., 2011). Based on these investigations, how the eye scans across Pollock’s patterns, which lack obvious salient features and which scale across multiple sizes, is of obvious interest.
Figure 4A shows an eye-tracking system used in our study, which integrates infrared and visual camera techniques to determine the location of the eye’s gaze when looking at a pattern formed on a computer screen (Hyona et al., 2002). The sizes of the fractal images displayed on the screen were 290 by 290 mm, corresponding to 1024 by 1024 screen pixels (i.e., the image resolution was 35.3 pixels/cm). The eye-tracker can locate the gaze with an accuracy of 4 pixels.
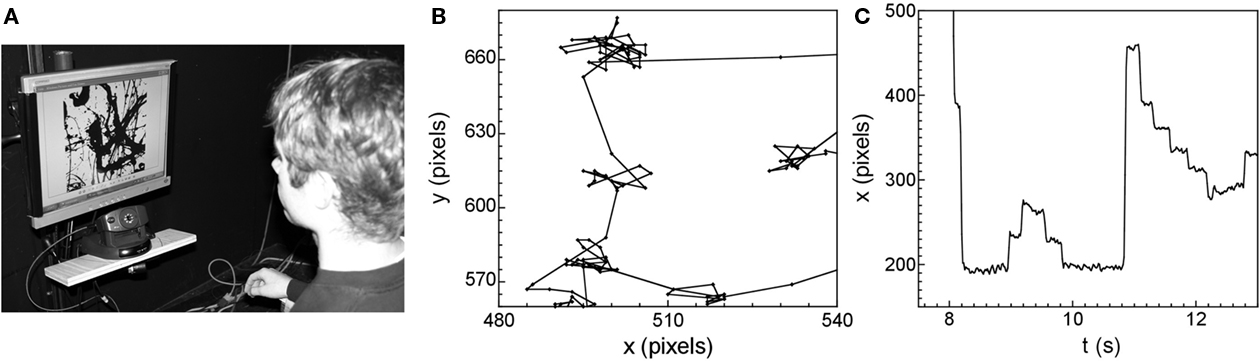
Figure 4. (A) A photograph of the eye-tracking apparatus. Subsections of a single eye-tracking data set: the spatial pattern plotted in the x (horizontal) and y (vertical) directions, (B) and the time series x vs. time (C).
Figure 4B shows a magnified section of the spatial pattern traced out by the eye’s gaze as it moves across the screen. As expected, the pattern is composed of long ballistic trajectories as the eye jumps between the locations of interest, and smaller motions called micro-saccades that occur during the dwell periods to ensure that the retina does not de-sensitize (Hyona et al., 2002). Figure 4B plots the horizontal (x) and vertical (y) locations in units of screen pixels. Micro-saccades are expected to occur over an angular range of typically 0.5°. This angle translates to a distance of 15 pixels on the screen and, as expected, this approximately matches the typical width of the dwell regions observed in Figure 4B.
Figure 4C shows the corresponding temporal pattern by plotting the x position against time t. The periods of relative motionlessness are the dwell periods at a given location, during which time the eye is undergoing micro-saccades. The typical dwell time is approximately 0.4 s. The time scale of the individual micro-saccades is expected to be approximately 10–20 ms. We note that this is on the same order as the sampling rate of the eye-tracking equipment (16 ms, 60 Hz). This measurement limitation would, therefore, impact on any studies of the micro-saccades. However, the focus of our investigations lies with the saccades, since these larger motions are the ones that dictate the search motion, and these operate on longer time scales than the equipment’s sampling rate.
Figure 5 shows the eye’s spatial patterns (red trajectories) superimposed on Pollock’s fractal paintings that were displayed on the computer screen. The observer was instructed to memorize the observed painting in order to induce the search activity. The observation period lasted 60 s. The D values of the displayed monochrome paintings from left to right were 1.11, 1.66, and 1.89. The fourth image (right) is a Pollock painting composed of four differently colored interlocking fractal patterns, each with a D value of 1.6.
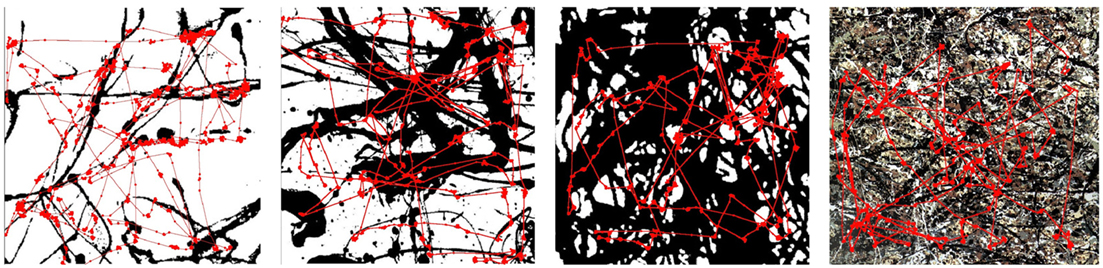
Figure 5. Eye-tracks are overlaid on the observed fractal patterns, which have dimensions of D = 1. 11 (far left), D = 1.66 (second left), and D = 1.89 (third left). The final pattern (right) is a colored composite of four D = 1.6 patterns.
Details of the box-counting analysis applied to the eye spatial pattern can be found elsewhere (Fairbanks and Taylor, 2011). The results show that the eye trajectories trace out fractal patterns with D values that are insensitive to the D value of the fractal pattern being observed: the saccade pattern is quantified by D = 1.4, even though the underlying pattern varied over a very large range from 1.11 to 1.89. We note that this characteristic value of D = 1.4 also holds for observations of multi-colored fractals (far right image of Figure 5).
To test this result further, we considered another form of fractal pattern for observers to search through – the computer-generated fractals shown in Figure 6. Table 2 compares the D values of the spatial patterns traced out by the saccades and the D values of the observed fractal patterns. In each case, the D values of the saccades are averaged over the results from six observers, each of whom observed the nine fractal images for 30 s, separated by a checkerboard pattern observed for 30 s. The results confirm that the saccades trace out an inherent search pattern set at D = 1.5, regardless of the D values of the fractal pattern being observed (Fairbanks and Taylor, 2011).
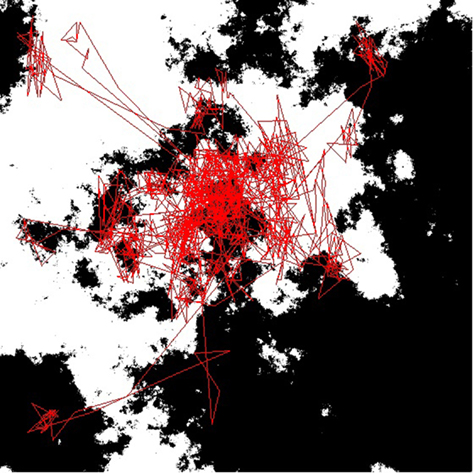
Figure 6. An example of the computer-generated fractals (black and white) viewed by the subjects for the eye-tracking results shown in Table 2. The red lines are the eye trajectories.
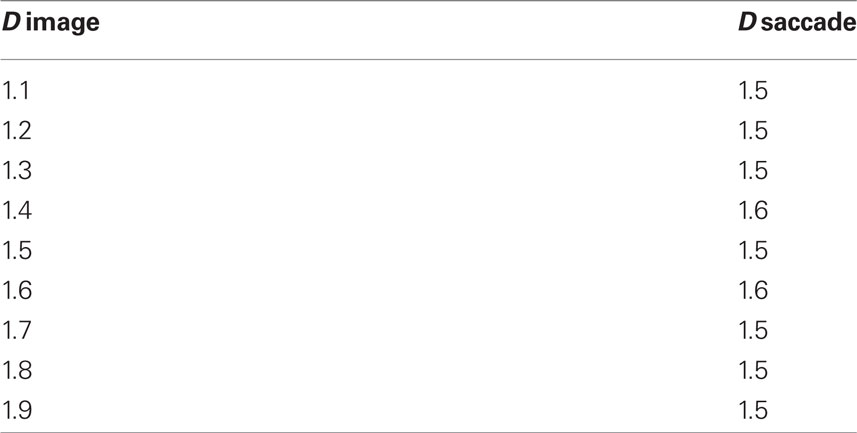
Table 2. A comparison of the D values of the fractal images being viewed, and the D values of the patterns traced out by the saccades.
This insensitivity to such a wide range of D values in the observed pattern is striking. It suggests that the eye’s search mechanism follows an intrinsic mid-range D value when in search mode. Why would the eye adopt a fractal trajectory with a D value of 1.5? An appealing possible answer lies in previous studies of the foraging behavior of animals. A number of successful investigations have proposed that animals adopt fractal motions when searching for food. See, for example, Viswanathan et al. (1996). Within this foraging model, the smaller trajectories allow the animal to look for food in small region and then to travel to neighboring regions and then onto regions further away.
Significantly, such fractal motion has an “enhanced diffusion” compared to the equivalent random motion of Brownian motion. This might explain why it is adopted for both animal searches for food and the eye’s search for visual information. The amount of space covered by fractal trajectories is bigger than for random trajectories, and a mid-range D value appears to be optimal for covering terrain efficiently (Fairbanks and Taylor, 2011). The mathematical properties of fractals, therefore, provide the explanation for why the human eye follows a fractal trajectory with an inherent D value set at 1.5.
This model raises an intriguing question – what happens when the eye is made to view a fractal pattern of D = 1.5? Will this trigger a “resonance” when the eye sees a fractal pattern that matches its own inherent characteristics? Could such a resonance lead to a peak in esthetic appeal? In the next section, we will use visual perception experiments to explore this hypothesis.
The Esthetics of Fractals
The prevalence of fractals in our natural environment has motivated a number of studies to investigate the relationship between a pattern’s fractal character and its visual properties (Pentland, 1984; Cutting and Garvin, 1987; Jang and Rajala, 1990; Knill et al., 1990; Rogowitz and Vosset al., 1990; Gilden et al., 1993; Geake and Landini, 1997). Whereas these studies concentrated on perceived qualities such as roughness and complexity, other studies have focused on esthetics and the quantification of the “visual appeal” of fractal patterns (Sprott, 1993; Pickover, 1995; Aks and Sprott, 1996; Taylor, 1998, 2001; Richards and Kerr, 1999; Richards, 2001; Spehar et al., 2003; Hagerhall et al., 2004; Taylor and Sprott, 2008; Boon et al., 2011). In one of the initial experiments performed in 1994, we used a chaotic pendulum called the “Pollockiser” to generate fractal and non-fractal poured paintings (example sections from two paintings are shown in Figure 7; Taylor, 2011). In the perception studies that followed, participants were shown one fractal and one non-fractal pattern (randomly selected from 40 images) and asked to state a preference (Taylor, 1998, 2003). Out of the 120 participants, 113 preferred examples of fractal patterns over non-fractal patterns, confirming their powerful esthetic appeal.
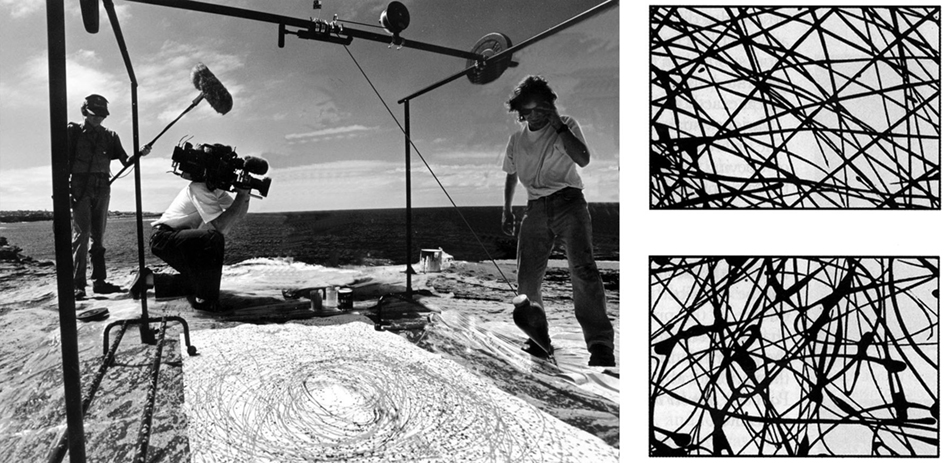
Figure 7. The chaotic pendulum (left) employed to generate non-fractal (top right) and fractal (bottom right) poured paintings. This technique was documented by ABC television in 1998.
Given the profound effect that D has on the visual appearance of fractals (see, for example, Figure 2), do observers base esthetic preference on the fractal pattern’s D value? Previous studies by Aks and Sprott used computer-generated fractals and reported preferred values of 1.3 (Sprott, 1993; Aks and Sprott, 1996). To determine if this was a “universal” esthetic quality of fractals, we performed an experiment incorporating all three categories of fractal pattern: fractals formed by nature’s processes (natural scenery), by mathematics (computer-generated images) and by humans (Pollock paintings) (Spehar et al., 2003). Within each category of fractals (i.e., mathematical, natural, and human), we investigated the visual preference as a function of D. This was done using a “forced choice” paired comparison technique, in which participants were shown a pair of images with different D values on a monitor and asked to chose the more “visually appealing.” Introduced by Cohn (1894), the forced choice paired comparison technique is well-established for securing value judgments. In our experiments, all the images were paired in all possible combinations. The presentation order was fully randomized and preference was quantified in terms of the proportion of times each image was chosen. The results, based on 220 participants, indicated that across all categories the visual preference peaks for fractal dimension between 1.3 and 1.5, whereas lower visual preferences are found for fractals outside of this range (Spehar et al., 2003).
We have further extended these findings by measuring visual preference for the same computer-generated fractals that were used in our eye-tracking experiments. The results of this new investigation are shown in Figure 8.
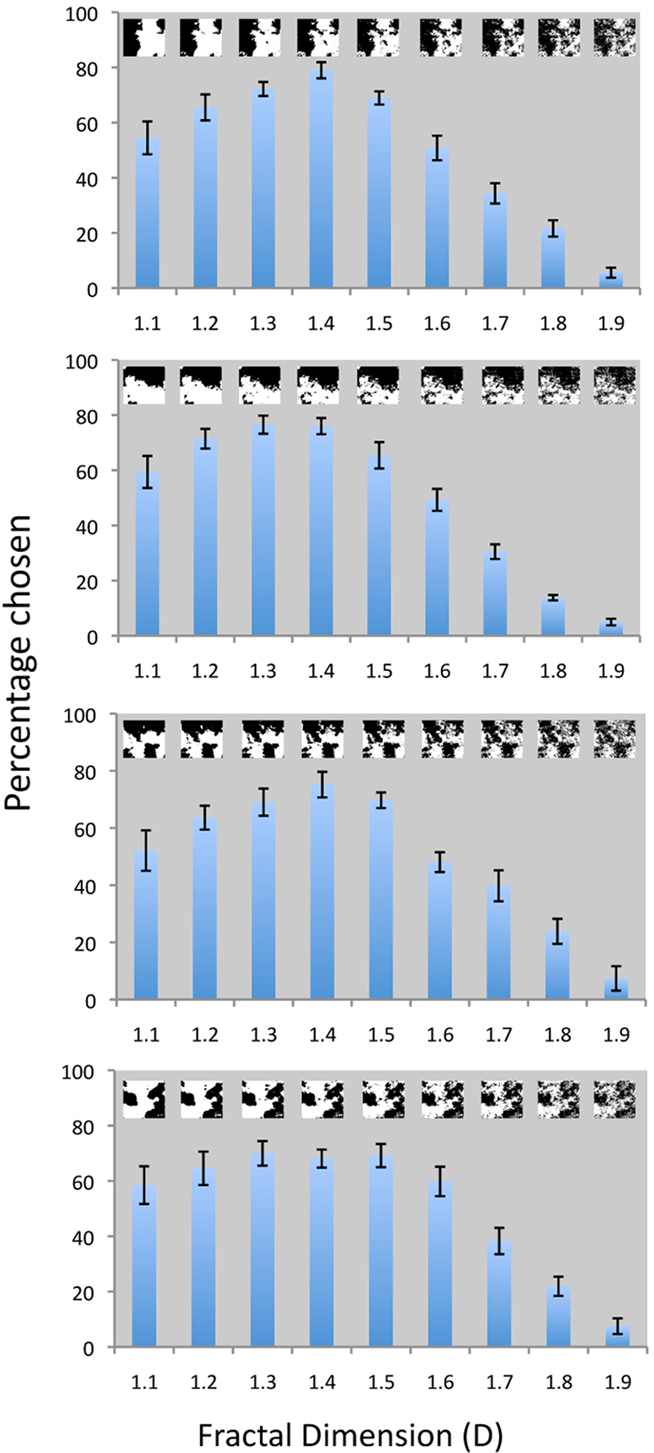
Figure 8. Visual preference for computer-generated fractals: The vertical axis in each panel corresponds to the percentage of trails for which patterns of a given D value were chosen as a function of fractal dimension (D). Each of the four different panels uses a different fractal configuration to investigate this visual preference. The fractal images are shown as insets in each panel. The main effect of fractal dimension (D) on visual preference was significant for all four types of fractal images: F8,19 = 22.16, p < 0.0001; F8,19 = 38.01, p < 0.0001; F8,19 = 15.68, p < 0.0001; and F8,19 = 1.54, p < 0.0001 from the top to the bottom panel respectively.
For each panel in Figure 8, we show how the visual preference for fractal patterns depends on their D values. The four panels investigate the response to different fractal “configurations” created using the same computer generation process. The same 20 observers viewed each image configuration1 and the results reveal a remarkable consistency in terms of the preference across the different configurations. For each configuration of fractal image, visual preference was significantly affected by a pattern’s fractal dimension (F8,19 = 22.16, p < 0.0001). As in our previous study (Spehar et al., 2003), the highest average visual preference is observed for fractal dimensions in the 1.3–1.5 range. A comparison across the four panels shows how little this preference varies for different examples of fractal patterns with the same D value. This “universal” character of fractal esthetics is further emphasized by an investigation indicating that gender and cultural background of participants did not significantly influence preference (Abraham et al., 2011).
The above perception experiments deliberately focused on relatively simple fractal objects. Each image featured just one form of fractal pattern (for example, the clouds or trees shown in Figure 2). Furthermore, the selected images provided a relatively high contrast against a uniform background, facilitating the application of the box-counting technique. An obvious step is to extend our studies to consider preferences for natural scenes, which typically feature a combination of several different fractal objects (e.g., clouds, tress, mountains etc). Although the characteristics of typical scenes are considerably more subtle than the simple shapes considered above, their fractal statistics are well-charted. Analysis has shown that typical scenes are scale invariant, following a power law behavior (Field and Brady, 1997; Billock, 2000; Billock et al., 2001). This behavior is thought to be due to a combination of the following factors: (i) many of the individual objects in the scene are fractal (see Table 1), (ii) many scenes contain a power law distribution of object sizes (Field and Brady, 1997; Ruderman, 1997), and (iii) the structure in each of the luminance edges in the scene is expected to follow a power law distribution of sizes (Switkes et al., 1978).
Does the preference for mid-range D values of simple fractal objects (Sprott, 1993; Aks and Sprott, 1996; Spehar et al., 2003) extend to these more visually intricate fractal scenes? One possible approach to addressing this issue would be to concentrate on the luminance properties of the overall scene. This could be done by adopting the technique that performs a spectral analysis of the spatial frequencies of the grayscale image of the scene, as discussed earlier (Field and Brady, 1997; Billock, 2000). The appeal of this approach is that the grayscale analysis can be related to key variables in studies of spatial vision, such as Michelson contrast. Furthermore, the grayscale image conveys visual information about the “textures” of a scene and previous fractals research indicates that roughness texture is an important property for perception – in particular, a strong correlation has been found between fractal dimension and perceived roughness (Pentland, 1984; Jang and Rajala, 1990). In contrast, other research indicates that perception is determined by the edge contours of the observed fractal pattern (Rogowitz and Voss, 1990). Therefore, an alternative approach to the analysis of a fractal scene would be to select a prominent edge contour and investigate its impact on perception. The importance of edge contours to the visual system is supported by eye-tracking experiments which show that, in free viewing situations, subjects fixate on definite contours (Rayner and Pollatsek, 1992). The dominant contour in many scenes is formed by the skyline, and consequently these contours have been the focus of previous perception studies. In particular, in architectural studies of tall building skylines, the silhouette complexity significantly affected preference scores while facade complexity was of less importance (Heath et al., 2000). Furthermore, perception experiments using computer-generated images have investigated the impact of matching a city skyline to the background horizon formed by fractal mountains (Stamps, 2002).
Due to this inter-disciplinary interest, our investigations of fractal scenery focused on the importance of the skyline contour for determining esthetic preference of natural scenes (Hagerhall et al., 2004). The skyline contour of natural scenes has previously been found to be fractal, with the D value depending on the objects that define the contour (Keller et al., 1987). Our box-counting analysis of the skyline contours extracted from 80 scenes photographed in Australia, Sweden and Italy confirms this fractal behavior. The procedure for extracting the skyline contour, shown in Figure 9, is described in detail elsewhere (Hagerhall et al., 2004). The preference experiments, involving 119 participants from the general public, show the most preferred D value to be 1.3 (Hagerhall et al., 2004), indicating that the preference for mid-range D values revealed for simple fractal shapes (Aks and Sprott, 1996; Spehar et al., 2003) appears to extend to the fractal characteristics of more intricate fractal scenery. The preference for skyline contours with D = 1.3 was also confirmed in another study with 63 students in psychology and landscape architecture who rated 12 landscape silhouettes extracted from photographs of natural scenery. In addition to preference, the participants rated the “naturalness” of the silhouettes and the results showed that the perceived naturalness was also highest for the silhouettes with a fractal dimension of around 1.3 (Hagerhall, 2005).
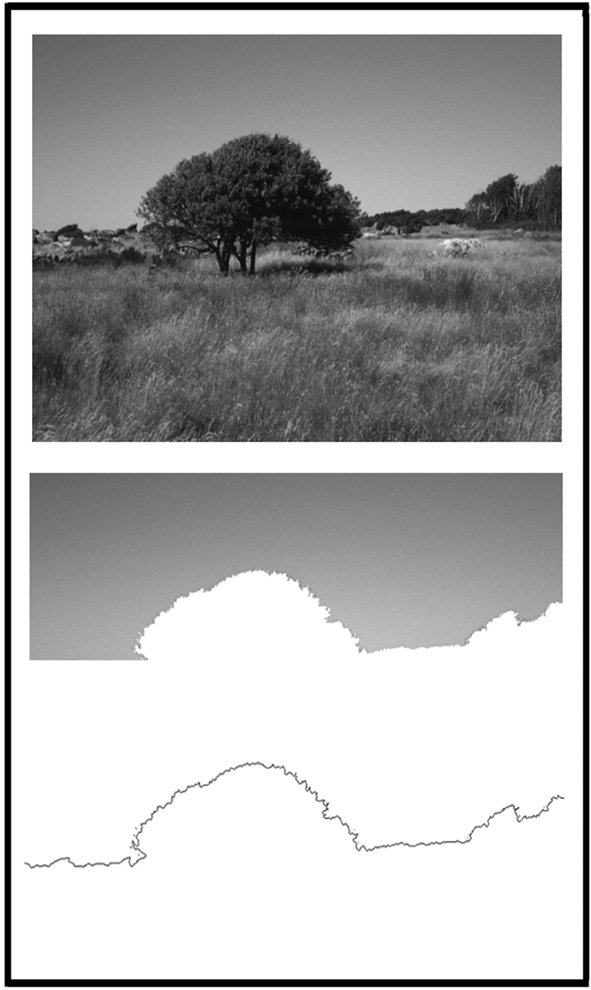
Figure 9. The processing steps used in the extraction of the fractal skyline contour of a natural scene. Top: one of the natural scenes shown to subjects. Middle: an intermediate processing step used to extract the skyline contour. Bottom: the extracted skyline contour subjected to the box-counting fractal analysis.
To summarize this section, perception studies of fractals generated by nature, mathematics and art indicate that images in the range D = 1.3–1.5 have the highest esthetic appeal. These mid-D values are close to the D values of 1.4–1.5 values predicted from the eye-tracking experiments.
Neurophysiological Response to Fractals
Does this visual appreciation for mid-range D values affect the physiological condition of the observer? In particular, do mid-D fractals also induce relaxation in the observer? This question motivated us to analyze the results of experiments performed at the NASA-Ames Research Center, in which 24 participants were seated in a simulated space station cabin, each facing one image on the wall. During continuous exposure to the image, each participant performed a sequence of mental tasks designed to induce physiological stress. Each task period was separated by a 1-min recovery period, thus creating a sequence of alternating high and low stress periods. To measure the subject’s physiological response to the stress of mental work, skin conductance was monitored continuously during this sequence (Taylor, 2006). Prior studies have shown skin conductance to be a reliable indicator of mental performance stress with higher conductance occurring under high stress (Ulrich and Simons, 1986). The results showed that the mental tasks induced the smallest rise in stress when the observer was observing a fractal pattern with a D value of 1.4 (Taylor, 2006).
To build on this result, we extended our studies of relaxation to include neurophysiological responses (Hagerhall et al., 2008). This was done by monitoring subjects’ quantitative EEG (qEEG) response while viewing fractals with different D values. Previous EEG recordings by others have shown that people are more wakefully relaxed during exposure to natural landscapes than during exposure to townscapes (Ulrich, 1981) and studies of wall art in hospitals find that images with natural content have positive effects on anxiety and stress (Ulrich, 1993). However, the definition of “nature” adopted in these previous studies was vague compared to our proposal of considering the D dependence.
It is generally agreed upon that EEG is a good indicator of cortical arousal. Similarly, there seems to be agreement that, in the awake brain, power in the alpha-band (9–12 Hz) of the EEG is inversely related to activity (Laufs et al., 2003a,b; Oakes et al., 2004). Human behavior also seems to be more strongly related to the alpha-band than to the other frequency bands in the EEG (Davidson and Hugdahl, 1996) and that the alpha components seems to be especially responsive to environmental stimulation (Küller, 1991; Küller et al., 2009). While the alpha component of EEG is considered to show a wakefully relaxed state, the delta component (2.25–3 Hz) is prominent during drowsiness and deep sleep. The beta component (18–24 Hz) is associated with external focus, attention and an alert state (Kolb and Whishaw, 2003). Three regions of the brain–frontal, parietal and temporal – were chosen for the qEEG recordings. Processes in these three associational zones are thought to be complementary (Kolb and Whishaw, 2003). Hence, the three selected regions are expected to reveal significant psycho-physiological impacts of exposure to fractal images.
Based on the preferences for mid-D fractals and the possibility, based on the skin conductance measurements, that these fractals might also induce a relaxed state (Taylor, 2006), we hypothesized that mid-D fractals would produce a maximal alpha response in the frontal areas. Additionally, we hypothesized that the different fractal dimensions would generate different levels of activation in the processing of the pattern, i.e., a difference in beta responses would be likely in the parietal and temporal regions.
Computer-generated fractal skylines, shown in Figure 10, were chosen with the D values of 1.14, 1.32, 1.51, and 1.70. Thirty-two subjects participated in the study. The fractal images were viewed for 1 min each and interspaced by a neutral gray picture for 30 s. This exposure period was chosen to ensure that a relaxation effect in the subjects could occur. Half of the subjects viewed the stimuli with increasing fractal dimension and the other half with decreasing fractal dimension. During the viewing, qEEG was continuously monitored and recorded using a digital EEG recorder.
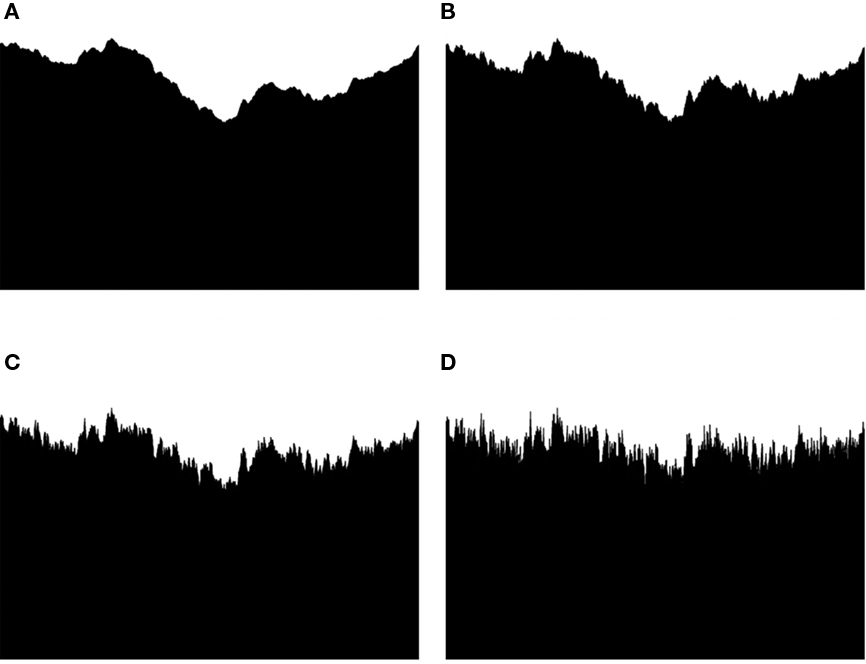
Figure 10. The fractal skylines used in the qEEG study. The fractal dimensions of the images were as follows: D(A) 1.14 (B) 1.32 (C) 1.51 and (D) 1.70.
The results shown in Figure 11 indicate that fractal images quantified by D = 1.3 induce the largest changes in subjects’ qEEG response (Hagerhall et al., 2008). This supports the proposal emerging from perception studies that these patterns are visually unique. These fractals generated the maximal alpha response in the frontal region, consistent with the hypothesis that they are most relaxing. They, at the same time, generated the highest beta response in the parietal region, indicating that this pattern was conversely generating most activation in the processing of the pattern’s spatial properties. This points to a very interesting interplay between these brain areas for mid-D fractals, which requires further investigation.
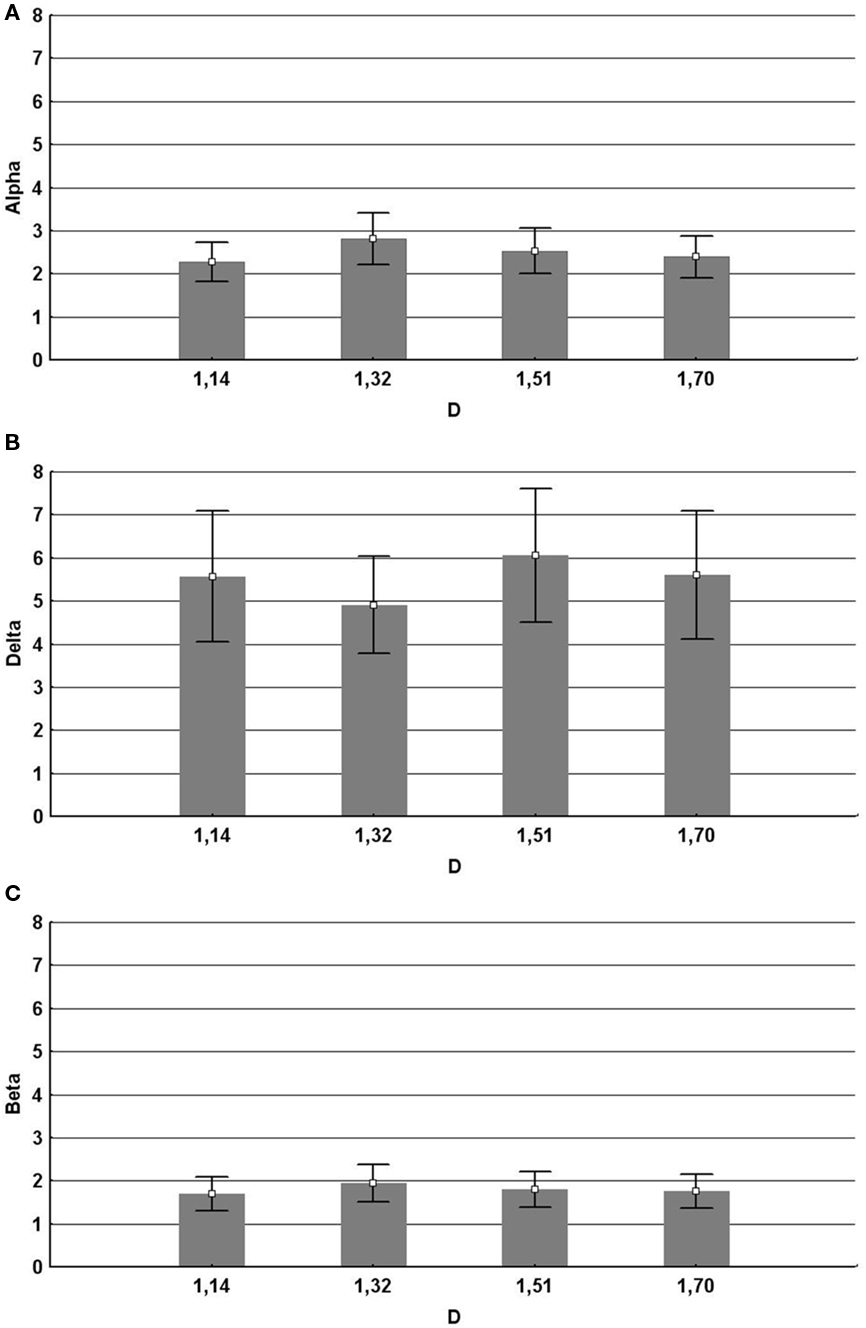
Figure 11. Significant effects of the fractal dimension D on EEG. Mean and SD in mV2 (Mean ± SD). Error bars represent 95% confidence intervals. (A) Alpha for frontal regions F3F4 together for D = 1.14 (2.28 ± 1.77), D = 1.32 (2.80 ± 2.36), D = 1.51 (2.53 ± 2.09), and D = 1.70 (2.39 ± 1.88). (B) Delta for the frontal regions F3F4 together for D = 1.14 (5.57 ± 5.96), D = 1.32 (4.91 ± 4.44), D = 1.51 (6.06 ± 6.11), and D = 1.70 (5.60 ± 5.86). (C) Beta for the parietal regions P3P4 together for D = 1.14 (1.69 ± 1.57), D = 1.32 (1.95 ± 1.74), D = 1.51 (1.80 ± 1.63) and D = 1.70 (1.76 ± 1.54).
Current studies are using the fMRI technique to identify more precisely the regions of the brain that are preferentially activated when observing the stress-reducing fractals. Preliminary results suggest that mid-D fractals activate the ventral visual stream (including the ventrolateral temporal cortex), the parahippocampal region, and the dorsolateral parietal cortex, involved with spatial long-term memory. Interestingly, the parahippocampal area has also been discussed in relation to detection and regulation of emotional input, for instance with reactions to happy and sad classical music (Mitterschiffthaler et al., 2007). These studies belong to the emerging field of “neuro-esthetics,” which explores the relationship between the neural cells activated and the esthetics of the object being observed (Zeki, 1999).
Conclusion
Scientific experiments might appear to be a highly unusual tool for judging art. However, our preliminary experiments provide a fascinating insight into the impact that art might have on the perceptual, physiological and neurological condition of the observer. Our future investigations will explore the possibility of incorporating fractal art into the interior and exterior of buildings, in order to adapt the visual characteristics of artificial environments to the positive responses.
Our findings might apply to a remarkably diverse range of fractal patterns appearing in art, architecture and archeology spanning more than five centuries. In addition to Pollock’s poured fractals, other examples of fractals include the Nazca lines in Peru (pre-seventh century) (Castrejon-Pita et al., 2003), early Chinese paintings (tenth to thirteenth century) (Voss, 1998), the Ryoanji Rock Garden in Japan (fifteenth century) (Van Tonder et al., 2002), Leonardo da Vinci’s sketch The Deluge (1500) (Mandelbrot, 1982), Katsushika Hokusai’s wood-cut print The Great Wave (1846) (Mandelbrot, 1982), Gothic cathedrals (Goldberger, 1996), Gustave Eiffel’s tower in Paris (1889) (Schroeder, 1991), Frank Lloyd Wright’s Palmer House in Michigan (1950) (Eaton, 1998), M. C. Escher’s Circle Limit III and IV (1960) (Taylor, 2009) and Frank Gehry’s proposed architecture for the Guggenheim Museum in New York (2001) (Taylor, 2001).
Is Jackson Pollock an artistic enigma? According to our results, the low D patterns painted in his earlier years should have more “visual appeal” than the higher D patterns in his later classic poured paintings. What was motivating Pollock to paint high D fractals? Should we conclude that he wanted his work to be esthetically challenging to the gallery audience? It is interesting to speculate that Pollock might have regarded the visually restful experience of a low D pattern as being too bland for an artwork and that he wanted to keep the viewer alert by engaging their eyes in a constant search through the dense structure of a high D pattern. Speculation over Pollock’s preference for high D fractals leads us back to the fundamental question driving this article: why do most people prefer fractals in the range D = 1.3–1.5?
We have noted that one potential explanation lies in a “resonance” with our eye trajectories, which trace out fractal patterns characterized by D = 1.4–1.5 when in search mode. However, an alternative explanation was presented by Aks and Sprott (1996) when interpreting their pioneering perception experiment. They speculated that the preference for mid-range D values is set through exposure to nature’s fractal patterns. Indeed, Table 2 shows that many of nature’s fractals cluster around D = 1.3. Perhaps then people’s preference for mid-range fractals is based on familiarity with these D = 1.3 shapes? Intriguingly, Table 2 also reveals another cluster at D = 1.7, matching Pollock’s preference, raising the possibility that Pollock’s preference was set by exposure to these more complex fractals (Taylor, 2011).
Others have used traditional theories of esthetics to explain Pollock’s preference. For example, Mureika appealed to the peak shift effect (Mureika, 2005), one of the “eight laws of artistic experience” (Ramaschandran and Hirstein, 1999). Within this esthetics model, visual interest is strengthened by overtly enhancing key characteristics of an image, in Pollock’s case the D value. Another esthetics model, the “principle of the esthetic middle,” predicts that the viewer will be drawn to a visual scene of mid-complexity (Berlyne, 1971). Given that higher D values exhibit higher visual complexity through their higher content of fine structure (Sprott and Taylor, 2008), this might explain why most people prefer mid-D fractals, but not Pollock’s quest for higher values. Recent studies that supplement D with other measures of complexity, such as Gif file size and algorithm length (Taylor and Sprott, 2008; Boon et al., 2011; Forsythe et al., 2011), might prove useful in addressing this issue.
The discrepancy between Pollock’s preference and those of other observers might also lie in the fact that the paintings might have looked different to Pollock simply because he spent so much time generating and looking at them. Webster has argued that a prolonged exposure to any pattern or a visual environment leads to a process of adaptation, a process through which the perceptual norms are constantly adjusted (Webster, 2002). We plan to test the idea of habituation to fractals in future experiments that examine if exposure to high D fractals causes the observer’s preference to move to these higher D values.
We finish with a remark made by one of Pollock’s friends, Ruebin Kadish, who noted, “I think that one of the most important things about Pollock’s work is that it isn’t so much what you’re looking at but it’s what is happening to you as you’re looking at his particular work” (Bragg, 1987). This observation emphasizes both the importance of the long tradition of experimental esthetics (Fechner, 1876) and the value of employing modern tools for analyzing human response to art works.
Conflict of Interest Statement
The authors declare that the research was conducted in the absence of any commercial or financial relationships that could be construed as a potential conflict of interest.
Acknowledgments
We thank M. S. Fairbanks, C. Boydston, N. Kawada, A. P. Micolich, D. Jonas, T. Laike, M. Küller, R. Küller, T. P. Martin, T. Purcell, B. R. Newell, C. W. G. Clifford, M. Sereno, and J. A. Wise.
Footnote
- ^The experimental procedures were approved by the School of Psychology, the University of New South Wales Human Research Ethics Advisory Panel. Informed consent was obtained from all subjects.
References
Abraham, F. D., Sprott, J. C., Mitina, O., Osorio, M., Dequito, E. A., and Pinili, J. M. (2011). Judgments of time, aesthetics, and complexity as a function of the fractal dimension of images formed by chaotic attractors. (in press).
Aks, D., and Sprott, J. (1996). Quantifying aesthetic preference for chaotic patterns. Empirical Stud. Arts 14, 1–16.
Alvarez-Ramirez, J., Echeverria, J. C., and Rodriguez, E. (2008a). Performance of a high-dimensional R/S analysis method for Hurst exponent estimation. Physica A 387, 6452–6462.
Alvarez-Ramirez, J., Ibarra-Valdez, C., Rodriguez, E., and Dagdug, L. (2008b). 1/f-noise structure in Pollock’s drip paintings. Physica A 387, 281–295.
Billock, V. A. (2000). Neural acclimation to 1/f spatial frequency spectra in natural images transduced by human visual system. Physica D 137, 379.
Billock, V. A., de Guzman, G. C., and Scott Kelso, J. A. (2001). Fractal time and 1/f spectra in dynamic images and human vision. Physica D 148, 136–146.
Boon, J. P., Casti, J., and Taylor, R. P. (2011). Artistic forms and complexity. Nonlinear Dynamics Psychol. Life Sci. 15, 265–283.
Burrough, P. A. (1981). Fractal dimensions of landscapes and other environmental data. Nature 295, 240–242.
Busswell, G. (1935). How People Look at Pictures: A Study of the Psychology of Perception in Art. Chicago: University of Chicago Press.
Castrejon-Pita, J. R., Castrejon-Pita, A. A., and Sarmiento-Galan, A. (2003). Nasca lines: a mystery wrapped in an enigma. Chaos 13, 836.
Chopard, B., Hermann, H. J., and Vicsek, T. (1991). Structure and growth mechanism of mineral dendrites. Nature 309, 409.
Coddington, J., Elton, J., Rockmore, D., and Wang, Y. (2008). Multi-fractal analysis and authentication of Jackson Pollock paintings. Proc. SPIE 6810, 1–12.
Cohn, J. (1894). Experimentelle unterschungen uber die gefuhlsbetonung der farben helligkeiten, und ihrer combinationen. Phil. Stud. 10, 562–603.
Cutting, J. E., and Garvin, J. J. (1987). Fractal curves and complexity. Percept. Psychophys. 42, 365–370.
Davidson, R. J., and Hugdahl, K. (1996). Baseline asymmetries in brain electrical activity predict dichotic listening performance. Neuropsychology 10, 241–246.
DiPaola, S., Riebe, C., and Enns, J. T. (2010). Rembrandt’s textural agency: a shared perspective in visual art and science. Leonardo 43, 145–151.
Eaton, L. K. (1998). “Fractal geometry in the late works of Frank Lloyd Wright,” in Architecture and Mathematics, ed. K. Williams (Firenze: Edizioni dell’Erba), 23–38.
Fairbanks, M. S., Mureika, J., and Taylor, R. P. (2010). Multifractal analysis of the painting techniques of adults and children. SPIE Proc. Electron. Imaging 7531, 1–6.
Fairbanks, M. S., and Taylor, R. P. (2011). Scaling Analysis of Spatial and Temporal Patterns: From the Human Eye to the Foraging Albatross. Non-linear Dynamical Analysis for the Behavioral Sciences Using Real Data. Boca Raton: Taylor and Francis Group.
Family, F., Masters, B. R., and Platt, D. E. (1989). Fractal pattern formation in human retinal vessels. Physica D 38, 98.
Field, D. J., and Brady, N. (1997). Visual sensitivity, blur and the sources of variability in the amplitude spectra of natural scenes. Vision Res. 37, 3367–3383.
Forsythe, A., Nadal, M., Sheehy, N., Cela-Conde, C. J., and Sawey, M. (2011). Predicting beauty: fractal dimension and visual complexity. Br. J. Psychol. 102, 49–70.
Foulsham, T., and Kingstone, A. (2010). Asymmetries in the direction of saccades during perception of scenes and fractals: effects of image type and image features. Vision Res. 50, 779–795.
Fuchs, I., Ansorge, U., Redies, C., and Leder, H. (2011). Salience in paintings: bottom-up influences on eye fixations. Cognit. Comput. 3, 25–36.
Geake, J., and Landini, G. (1997). Individual differences in the perception of fractal curves. Fractals 5, 129–143.
Gilden, D. L., Schmuckler, M. A., and Clayton, K. (1993). The perception of natural contour. Psychol. Rev. 100, 460–478.
Graham, D. J., and Field, D. (2007). Statistical regularities of art images and natural scenes: spectra. Sparseness and non-linearities. Spat. Vis. 21, 149–164.
Graham, D. J., and Field, D. (2008). Variations in intensity for representative and abstract art, and for art from Eastern and Western Hemispheres. Perception 37, 1341–1352.
Graham, D. J., and Redies, C. (2010). Statistical regularities in art: relations with visual coding and perception. Vision Res. 50, 1503–1509.
Hagerhall, C. M. (2005). “Fractal dimension as a tool for defining and measuring naturalness,” in Designing Social Innovation – Planning, Building, Evaluating, eds B. Martens, and A. G. Keul (Cambridge, MA: Hogrefe and Huber), 75–82.
Hagerhall, C. M., Laike, T., Taylor, R. P., Küller, M., Küller, R., and Martin, T. P. (2008). Investigation of EEG response to fractal patterns. Perception 37, 1488–1494.
Hagerhall, C. M., Purcell, T., and Taylor, R. P. (2004). Fractal dimension of landscape silhouette outlines as a predictor of landscape preference. J. Environ. Psychol. 24, 247–255.
Heath, T., Smith, H. G. G., and Lim, B. (2000). Tall buildings and the urban skyline. The effect of visual complexity on preferences. Environ. Behav. 32, 541–556.
Hyona, J., Munoz, D. P., Heide, W., and Radach, R. (2002). The brain’s eye: neurobiological and clinical aspects of oculomotor research. Prog. Brain Res. 140, 1.
Irfan, M., and Stork, D. (2009). Multiple visual features for the computer authentication of Jackson Pollock’s drip paintings: beyond box counting and fractals. SPIE Electron. Imaging 7251, 72510Q1–72510Q11.
Jang, J., and Rajala, S. A. (1990). Segmentation based image coding using fractals and the human visual system. Proc. IEEE Int. Conf. Acoust. Speech Signal Process. 4, 1957–1960.
Keller, J. M., Crownover, R. M., and Chen, R. Y. (1987). Characteristics of natural scenes related to the fractal dimension. IEEE Trans. Pattern Anal. Mach. Intell. 9, 621–627.
Knill, D. C., Field, D., and Kersten, D. (1990). Human discrimination of fractal images. J. Opt. Soc. Am. 77, 1113–1123.
Koch, M., Denzler, J., and Redies, C. (2010). 1/f2 characteristics and isotropy in the Fourier power spectrum of visual art, cartoons, comics, mangas and different categories of photographs. PLoS ONE 5, e12268. doi: 10.1371/journal.pone.0012268
Kolb, B., and Whishaw, I. Q. (2003). Fundamentals of Human Neuropsychology. New York: Worth Publishers.
Küller, R. (1991). “Environmental assessment from a neuropsychological perspective,” in Environment, Cognition and Action. An Integrated Approach, eds T. Gärling, and G. W. Evans (New York: Oxford University Press), 111–147.
Küller, R., Mikellides, B., and Janssens, J. (2009). Color, arousal, and performance – a comparison of three experiments. Color Res. Appl. 34, 141–152.
Laufs, H., Kleinschmidt, A., Beyerle, A., Eger, E., Salek-Haddadi, A., Preibisch, and Krakow, C. (2003a). EEG-correlated fMRI of human alpha activity. Neuroimage 19, 1463–1476.
Laufs, H., Krakow, K., Sterzer, P., Eger, E., Beyerle, A., Salek-Haddadi, A., and Kleinschmidt, A. (2003b). Electroencephalographic signatures of attentional and cognitive default modes in spontaneous brain activity fluctuations at rest. Proc. Natl. Acad. Sci. U.S.A. 100, 11053–11058.
Lee, S., Olsen, S., and Gooch, B. (2006). “Non-photorealistic animation and rendering,” in Proceedings of the 4th International Symposium on Non-Photorealistic Animation and Rendering (New York, NY: Association for Computing Machinery), 97–104.
Lee, S., Olsen, S., and Gooch, B. (2007). Simulating and analyzing Jackson Pollock’s paintings. J. Math. Arts 1, 73–83.
Locher, P. (2006). The usefulness of eye movements to subject an aesthetic episode with visual art to empirical scrutiny. Psychol. Sci. 48, 106–114.
Locher, P., Krupinski, E. A., Mello-Thoms, C., and Nodine, C. F. (2007). Visual interest in pictorial art during an aesthetic experience. Spat. Vis. 21, 55–77.
Louis, E., Guinea, F., and Flores, F. (1986). “The fractal nature of fracture,” in Fractals in Physics, eds L. Pietronero, and E. Tossati (Amsterdam: Elsevier Science), 177.
Matsushita, M., and Fukiwara, H. (1993). “Fractal growth and morphological change in bacterial colony formation,” in Growth Patterns in Physical Sciences and Biology, eds J. M. Garcia-Ruiz, E. Louis, P. Meaken, and L. M. Sander (New York: Plenum Press), 23–40.
Mitterschiffthaler, M. T., Fu, C. H. Y., Dalton, J. A., Andrew, C. M., Steven, C. R., and Williams, S. C. R. (2007). A functional MRI study of happy and sad affective states induced by classical music. Hum. Brain Mapp. 28, 1150–1162.
Morse, D. R., Larson, J. H., Dodson, M. M., and Williamson, M. H. (1985). Fractal dimension of arthropod body lengths. Nature 315, 731–733.
Mureika, J. R. (2005). Fractal Dimensions in fractal color space: a comparison study using Jackson Pollock’s art. Chaos 15, 043702-1-6.
Mureika, J. R., Dyer, C. C., and Cupchik, G. C. (2004). Multifractal structure in non-representational art. Leonardo 37, 53–56.
Mureika, J. R., Dyer, C. C., and Cupchik, G. C. (2005). Multifractal structure in nonrepresentational art. Phys. Rev. E Stat. Nonlin. Soft Matter Phys. 72, 0461010-1-15.
Niemeyer, L., Pietronero, L., and Wiesmann, H. J. (1984). Fractal dimension of dielectric breakdown. Phys. Rev. Lett. 52, 1033–1036.
Nittmann, J., and Stanley, H. E. (1987). Non-deterministic approach to anisotropic growth patterns with continuously tunable morphology: the fractal properties of some real snowflakes. J. Phys. A 20, L1185–L1189.
Nodine, C., and Krupinski, E. (2003). How do viewers look at artworks? Bull. Psychol. Arts 4, 65–68.
Oakes, T. R., Pizzagalli, D. A., Hendrick, A. M., Horras, K. A., Larson, C. L., Abercrombie, H. C., Schaefer, S. M., Koger, JV., and Davidson, R. J. (2004). Functional coupling of simultaneous electrical and metabolic activity in the human brain. Hum. Brain Mapp. 21, 257–270.
Pentland, A. P. (1984). Fractal-based description of natural scenes. IEEE Pattern Anal. Mach. Intell. 6, 661–674.
Potter, J. (1985). To a Violent Grave: An Oral Biography of Jackson Pollock. New York: G.P. Putman and Sons.
Ramaschandran, V. S., and Hirstein, W. J. (1999). The science of art: a neurological theory of aesthetic experience. Conscious. Stud. 6, 15.
Rayner, K., and Pollatsek, A. (1992). Eye movements and scene perception. Can. J. Psychol. 46, 342–376.
Redies, C. (2007). A universal model of esthetic perception based on the sensory coding of natural stimuli. Spat. Vis. 21, 97–117.
Redies, C., Hasenstein, J., and Denzler, J. (2007). Fractal-like image statistics in visual art: similar to natural scenes. Spat. Vis. 21, 137–148.
Richards, R. (2001). A new aesthetic for environmental awareness: chaos theory, the beauty of nature, and our broader humanistic identity. J. Humanist. Psychol. 41, 59–95.
Richards, R., and Kerr, C. (1999). The fractal form of nature: a resonant aesthetics. Paper presented at the Annual meeting of the Society for Chaos Theory in Psychology and Life Sciences, Berkeley.
Rogowitz, B. E., and Voss, R. F. (1990). Shape perception and low dimensional fractal boundary contours. in Proceedings of the conference on human vision: Methods, Models and Applications, S.P.I.E./SPSE Symposium on Electron Imaging, Vol. 1249, Santa Clara, 387–394.
Skjeltorp, P. (1988). “Fracture experiments on monolayers of microspheres,” in Random Fluctuations and Pattern Growth, eds H. E. Stanley, and N. Ostrowsky (Dordrecht: Kluwer Academic), 424–426.
Spehar, B., Clifford, C., Newell, B., and Taylor, R. P. (2003). Universal aesthetic of fractals. Chaos Graph. 37, 813–820.
Switkes, E., Mayer, M. J., and Sloan, J. A. (1978). Spatial frequency analysis of the visual environment: anisotropy and the carpentered environment hypothesis. Vision Res. 18, 1393–1399.
Taylor, R. P. (2003). “Fractal expressionism-where art meets science,” in Art and Complexity, eds J. Casti, and A. Karlqvist (Amsterdam: Elsevier Press), 117–144.
Taylor, R. P. (2004). Mondrian, Pollock and nature: recent scientific investigations. Chaos Compl. Lett. 1, 29.
Taylor, R. P. (2006). Reduction of physiological stress using fractal art and architecture. Leonardo 39, 245–251.
Taylor, R. P. (2011). Fractal Expressionism: The Art and Science of Jackson Pollock. To be published by World Scientific.
Taylor, R. P., Guzman, R., Martin, T. M., Hall, G., Micolich, A. P., Jonas, D., Scannell, B. C., Fairbanks, M. S., and Marlow, C. A. (2007). Authenticating Pollock paintings with fractal geometry. Pattern Recognit. Lett. 28, 695.
Taylor, R. P., Micolich, A. P., and Jonas, D. (1999a). Fractal analysis of Pollock’s drip paintings. Nature 399, 422.
Taylor, R. P., Micolich, A. P., and Jonas, D. (1999b). Fractal expressionism. Phys. World 12, 25–28.
Taylor, R. P., Micolich, A. P., and Jonas, D. (2002). The construction of Pollock’s fractal drip paintings. Leonardo 35, 203.
Taylor, R. P., Micolich, A. P., and Jonas, D. (2006). Revisiting Pollock’s drip paintings. Nature 444, E10–E11.
Taylor, R. P., and Sprott, J. C. (2008). Biophilic fractals and the visual journey of organic screen-savers. Nonlinear Dynamics Psychol. Life Sci. 12, 117–129.
Ulrich, R. S. (1993). Biophilia, Biophobia and Natural Landscapes. The Biophilia Hypothesis. Washington DC: Island Press.
Ulrich, R. S., and Simons, R. F. (1986). Recovery from stress during exposure to everyday outdoor environments. Proc. EDRA 17, 115–122.
Ulrich, R. S. (1981). Natural versus urban scenes: some psychophysiological effects. Environ. Behav. 13, 523–556.
Van Tonder, G. J., Lyons, M. J., and Ejima, Y. (2002). Visual structure of a Japanese Zen garden. Nature 419, 359.
Viswanathan, G. M., Afanasyev, V., Buldyrev, S. V., Murphy, E. J., Prince, P. A., and Stanley, H. E. (1996). Lévy flight search patterns of wandering albatrosses. Nature 381, 413–415.
Voss, R. F. (1998). Local connected fractal dimension analysis of early Chinese landscape paintings and X-ray mammograms. Fractal Image Encoding Anal. NATO ASI Ser. 159, 279–297.
Wallraven, C., Kaulard, K., Kurner, C., Pepperell, R., and Bulthoff, H. H. (2007). Psychophysics for Perception of (In)Determinate Art. APGV 2007, New York: ACM Press, 115–122.
Keywords: fractals, esthetics, visual preference, eye tracking, EEG
Citation: Taylor RP, Spehar B, Van Donkelaar P and Hagerhall CM (2011) Perceptual and physiological responses to Jackson Pollock’s fractals. Front. Hum. Neurosci. 5:60. doi: 10.3389/fnhum.2011.00060
Received: 14 February 2011; Accepted: 09 June 2011;
Published online: 22 June 2011.
Edited by:
Luis M. Martinez, Universidad Miguel Hernández de Elche, SpainReviewed by:
Christoph Redies, University of Jena School of Medicine, GermanyGert Jakobus Van Tonder, Kyoto Institute of Technology, Japan
Copyright: © 2011 Taylor, Spehar, Van Donkelaar and Hagerhall. This is an open-access article subject to a non-exclusive license between the authors and Frontiers Media SA, which permits use, distribution and reproduction in other forums, provided the original authors and source are credited and other Frontiers conditions are complied with.
*Correspondence: Richard P. Taylor, Department of Physics, University of Oregon, Eugene, OR 9743, USA. e-mail: rpt@uoregon.edu