
- 1 Department of Biostatistics, State University of New York at Buffalo, Buffalo, NY, USA
- 2 Department of Biostatistics, University of Toronto, Toronto, ON, Canada
Cancer is a major health problem with high mortality rates. In the post-genome era, investigators have access to massive amounts of rapidly accumulating high-throughput data in publicly available databases, some of which are exclusively devoted to housing Cancer data. However, data interpretation efforts have not kept pace with data collection, and gained knowledge is not necessarily translating into better diagnoses and treatments. A fundamental problem is to integrate and interpret data to further our understanding in Cancer Systems Biology. Viewing cancer as a network provides insights into the complex mechanisms underlying the disease. Mathematical and statistical models provide an avenue for cancer network modeling. In this article, we review two widely used modeling paradigms: deterministic metabolic models and statistical graphical models. The strength of these approaches lies in their flexibility and predictive power. Once a model has been validated, it can be used to make predictions and generate hypotheses. We describe a number of diverse applications to Cancer Biology, including, the system-wide effects of drug-treatments, disease prognosis, tumor classification, forecasting treatment outcomes, and survival predictions.
Mathematical and Statistical Modeling in Cancer Systems Biology
In the last half a century, tremendous progress in understanding the genetic and biochemical mechanisms underlying cancer has been achieved. Despite these advances, cancer remains a major health problem that is responsible for one in every four adult deaths (Siegel et al., 2011). High mortality rates indicate that this knowledge is not translating into effective cancer treatments (Lord and Ashworth, 2010). Chemotherapy was discovered in chemical warfare during World War I; it was first used to treat cancer in the 1940s when little was understood about the disease (Goodman et al., 1946), and remains the most common form of treatment for most types of cancers. Chemotherapy drugs target rapidly dividing cells; as a result, normal tissues with high growth rates suffer and patients often experience adverse and sometimes deadly side effects.
Over the past 15 years, drugs have emerged that target cancer metabolism, either directly through enzymes that facilitate metabolic reactions or indirectly through signaling pathways (Zhukov and Tjulandin, 2007; Heiden, 2011). Targeted therapy is typically less damaging to normal cells than chemotherapy. However, cancer cells are extremely robust for survival and often completely insensitive to perturbations or develop resistance over time. Drug resistance occurs when non-targeted genes or proteins kick in to rescue the cancer cell by rerouting growth requirements through alternative mechanisms and pathways. Drug resistance is a major limitation to targeted therapies. For this reason, they are most effective when used in combination with chemotherapy treatments. It is becoming apparent that, in order to develop effective targeted therapies that overcome resistance, the drug development paradigm will have to shift from single molecular targets to pathways (Astsaturov et al., 2010; Thangue and Kerr, 2011). Systems biology approaches will play a pivotal role in the development of drugs that do not succumb to resistance.
Mathematical models of complex biological systems are central to systems biology. They can be used as an exploratory tool to complement and guide experimental work. Simulations, known as in silico experiments, can be performed with mathematical models to validate hypotheses and make predictions about quantities that are difficult or impossible to measure in vivo. Predictions can provide much-needed insight into the pathways driving cancer progression, and the robust compensatory mechanisms that protect cancer cells from drug intervention. Model simulations can be used to predict the system-wide effects of molecular targets, e.g., determine the effects of molecular target(s) inhibition in specific populations. They can also serve as an important clinical tool, e.g., classify benign and malignant tumors, predict disease prognosis for individual patients, and predict outcomes of treatments.
High-throughput technologies offer the capability to simultaneously measure tens of thousands of molecular targets per sample. As costs steadily decline, the number of omics datasets characterizing the genome, proteome, and metabolome continues to grow. A number of publicly available resources have been developed to house data and functional annotation. These resources can be queried and have enabled scientists to better leverage omics-based research efforts. To illustrate the size of such databases, as of March, 2012, Gene Expression Omnibus (GEO) contained data from 9,919 platforms, 710,229 samples, 28,873 series, and 2,720 manually curated datasets (Barrett and Edgar, 2006). The Progenetix database houses data from Comparative Genomic Hybridization (CGH) experiments that focus on copy number abnormalities in human cancer (Baudis and Cleary, 2001). The Cancer Genome Atlas (TCGA) contains the results of subjecting patient samples from a variety of cancer subtypes to a battery of common high-throughput assays such as gene expression, array comparative genomic hybridization (aCGH), SNP genotyping, methylation profiling, microRNA profiling, and some exon sequencing platforms (Collins and Barker, 2008). The Sanger Cancer Genome Project has generated a cancer gene census (Futreal et al., 2004), a catalog of somatic mutations in cancer (Forbes et al., 2010), as well as several bioinformatic resources born out of the interrogation of cancer cell lines.
The wealth of publicly available data offers an exciting opportunity to study cancer as a complex network. We are currently in an era where collecting data in a high-throughput fashion is the norm. However, our ability to interpret this data for knowledge and discovery has not kept pace with the data collection efforts. Importantly, this message was echoed in NCI’s recent funding opportunity addressing provocative questions, which pose game-changing scientific questions to drive progress against cancer (RFA-CA-11-01; Varmus and Harlow, 2012). A series of questions were posed to inspire investigators to “…step back from the momentum of these discoveries and make sure we have left no stone unturned and no important but perhaps not obvious question left unexplored.” Provocative question 17 asks the following: “Since current methods to assess potential cancer treatments are cumbersome, expensive and often inaccurate, can we develop other methods to rapidly test interventions for cancer treatment or prevention?” Mathematical models serve as a link between experimental and computational biology, and can be used to address this question. Specifically, they can serve as a tool to drive experimental advances in terms of predication, classification, and hypotheses generation.
In this article, we describe two complementary and widely used modeling paradigms: deterministic models of cellular systems and graphical modeling. Deterministic models of cellular metabolism are constructed in a bottom-up approach from known stoichiometry, principles of mass balance, and physiological constraints, whereas graphical models are inferred from the data using linear statistical models in a top-down approach. These approaches offer vastly different perspectives on network behavior and have been instrumental for systems biology. We review the fundamentals of these modeling paradigms and highlight applications of models that have been developed to advance Cancer Systems Biology.
Deterministic Models of Cellular Metabolism and Cell Signaling
Cancer cells exhibit profound alterations to their metabolic and signaling pathways. Many drugs that are either available or in the development phase target proteins or enzymes in these pathways in an effort to slow or halt cancer growth (Bates et al., 2012). Cell proliferation, motility, and survival are tightly controlled in normal cells. However, adjustments in cancer cell signaling enable proliferation independent of exogenous signals, disrupt apoptosis, and elicit tumor angiogenesis and metastasis to surrounding tissues and vessels (Johnstone et al., 2002; Martin, 2003). Unlike their normal counterparts, cancer cells use aerobic glycolysis instead of oxidative phosphorylation for energy production (Warburg, 1956). Glutamine is central to cancer cell protein and nucleotide biosynthesis, and replenishes the TCA cycle for anabolic processes (Lu et al., 2010). Fatty acid biosynthesis occurs at high rates and most fatty acids are produced de novo regardless of nutrition. (Medes et al., 1953; Ookhtens et al., 1984). These metabolic and signaling signatures are common to most forms of cancer.
Ordinary differential equations (ODEs) represent the most widely used approach for modeling cellular dynamics. The underlying assumption is that reactions occur under well-mixed conditions and that the abundance of reactants is not too low. The differential equations are derived from laws of mass balance and describe the rate of change of a species (dC/dt) in terms of production and utilization, i.e., dC/dt = production − utilization (Figure 1A). In many cases, the stoichiometry of pathways are well understood, and the topology of the system can be modeled easily with ODEs (Ogata et al., 1999; Matthews et al., 2009). However, the underlying processes, e.g., reaction fluxes and transport rates, rely on parameters that are often unknown and require challenging underdetermined estimation from time course data (Figure 1B; Erguler and Stumpf, 2011). Another challenge is that these systems can often exhibit sharp transients on different time scales (stiffness), which requires computationally intensive numerical integration (Shampine et al., 2003; MacLachlan et al., 2007). These factors ultimately limit the scale of dynamic models. Consequently, they are used to investigate small subsets of reactions and pathways.
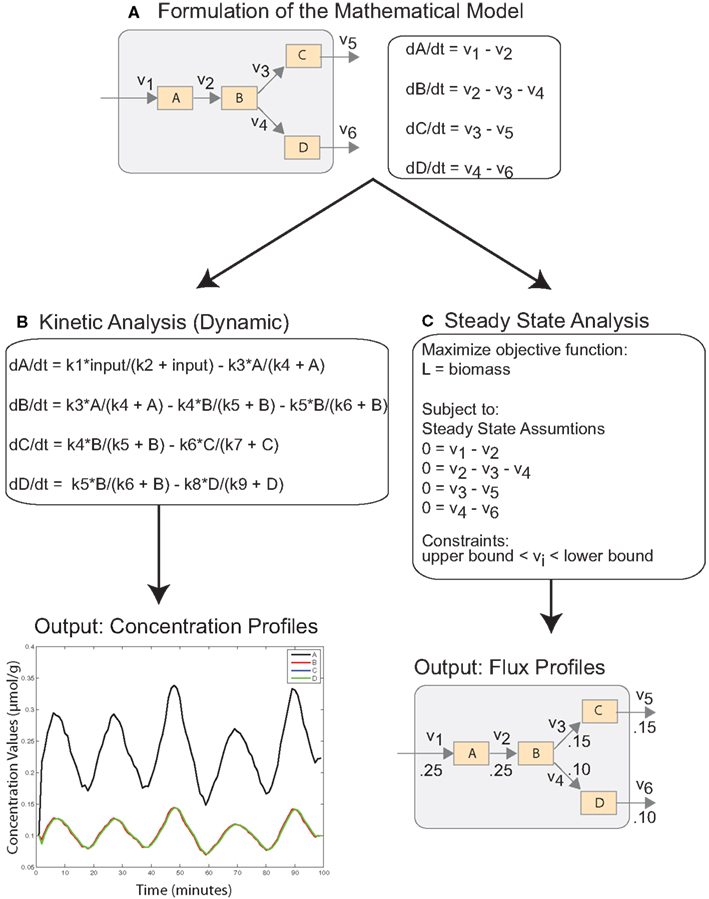
Figure 1. Simplified schematic describing mathematical modeling of cellular systems with ODEs. (A) The cellular system is translated into a mathematical model with system of ODEs reflecting the mass balance of the system. (B) Dynamic analysis of the system requires specification of fluxes as non-linear functions, which depend on a number of unknown parameters. Solving the ODE system results in the time course of concentration values as output. (C) Steady-state analysis of the system requires the specification of an objective function and constraints, but the ODE system reduces to a simple linear system. The output of the analysis is optimal flux values.
ODE models have been used extensively to examine the dynamic properties of cancer signaling pathways. A model of tumor suppressor p53 and oncogene Mdm2 revealed high variability in the oscillatory behaviors of cells following DNA damage (Geva-Zatorsky et al., 2006). NF-κB signaling plays a critical role in intracellular signaling, apoptosis, and resistance to chemotherapy. A computational model was used to distinguish the roles of NF-κB kinase isoforms, which regulate NF-κB through coordinated system dynamics (Hoffmann et al., 2002). Extensions of this model have been used to characterize feedback loops in the system and identify the activation of downstream pathways (Covert et al., 2005; Werner et al., 2005; Cheong et al., 2008). Several different mathematical models have been developed for the MAPK (mitogen-activated protein kinase) pathway (35 models between 1960 and 2005; Orton et al., 2005). Despite differences in detail and complexity, these models are able to explain the data and make insightful system-wide predictions about the pathway dynamics. Most of the differences between model outputs can be attributed to model boundaries and simplifications. This has been suggested to be a reflection of the robustness of ODE modeling and the biological system at hand (Orton et al., 2005).
Advances in high-throughput technologies have spurred the development of comprehensive genome-scale metabolic models (Oberhardt et al., 2009). These models have developed from extensive curation of the data and literature. The metabolic system is described by hundreds of metabolic reactions, multiple compartments, and highly interconnected pathways. Constraint based analysis (CBA) has been used to investigate the steady-state behavior of these systems under a variety of conditions. In the steady-state, metabolites are stable and exhibit no change in concentration levels. Adopting this assumption reduces a complex dynamical system of ODEs to linear system and eliminates the need for large-scale parameter estimation (Figure 1C).
The purpose of steady-state analysis is to identify feasible flux values that satisfy the steady-state assumptions and maximize an objective function describing the physiological objectives of the cell (Lee et al., 2006). The solution space is bounded with system constraints, e.g., stoichiometric, thermodynamic, and enzyme capacity constraints. In single cell organisms, such as Escherichia coli and Saccharomyces cerevisiae, the cellular objective is to proliferate, and critical reactions and pathways are included in biomass function which is maximized (Edwards and Palsson, 2000; Förster et al., 2003). In these cases, optimizing cellular growth is analogous to maximizing the likelihood of survival. Defining cellular objectives is less straightforward in mammalian and human systems, which consist of a variety of interacting tissues and cells (Duarte et al., 2007; Livnat Jerby and Ruppin, 2010; Selvarasu et al., 2010). However, unlike normal cells, cancer cells want to proliferate and exhibit biomass requirements which can be leveraged in CBA modeling approaches. Recently, a genome-scale model has been used to characterize the Warburg effect in cancerous cells (Shlomi et al., 2011). The model was validated against the full panel of NCI-60 cancer cell lines, and provided novel insights into phases of metabolic behavior through cancer progression. A smaller model centered around a core set of critical enzymes and coding genes was used to predict novel drug targets (Folger et al., 2011).
ODEs are the most popular modeling technique largely because of their simplicity. Several other modeling paradigms that vary in complexity have been applied to study cancer cellular metabolism, signaling, and response to treatment. Boolean models have been used to represent reactions as logical gates with two states: on and off (Lähdesmäki et al., 2003; Morris et al., 2010). Partial differential equations (PDEs) are significantly more complex than ODEs with respect to parameter estimation. Detailed information about spatial dynamics and interactions between components is required (Sleeman and Levine, 2001; Ribba et al., 2006; Friedman et al., 2007). Perturbation-response modeling approaches are based on fundamental linear response rules, which leverage flux conservation. This approach has been used to examine toll like receptor (TLR) signaling and tumor necrosis factor related apoptosis inducing ligand (TRAIL) resistance (Piras et al., 2011; Selvarajoo, 2011). Pharmacokinetic modeling has also been used to describe the time-dependent distribution of drugs in the system (Gerlowski and Jain, 1983; Reitz et al., 1990; Sanga et al., 2006).
Graphical Models
Probabilistic graphical models (PGMs) can be used to describe directed and undirected relationships between variables (Koller and Friedman, 2009). In this setting, each variable (e.g., genes, proteins) is a node in the network and viewed as a random variable, which is subject to uncertainty. The links in the network convey a relevant measure of association, e.g., correlation (undirected) or causality (directed). The network structure can be decomposed into small regions and translated into a product of conditional probabilities, which represents the joint probability distribution. Undirected graphs are known as Markov Networks and portray symmetric relationships (Figure 2A). A link in this model is present if the linked nodes are associated after controlling for the influence of other nodes in the graph (conditional association). In a directed graph, an edge A → B implies that independent variable A (parent node) is upstream of the dependent variable B (child node) in the underlying causal process (Figure 2B). Furthermore, the directed edge implies a causal effect of A after the influence of the remaining nodes upstream of B (ancestors of B) have been controlled for or removed. Bayesian Networks (BNs) are directed acyclic graphs (DAGs), which contain no cycles, and thereby prohibit feedback in the model. Chain graphs contain a mixture of directed and undirected edges.
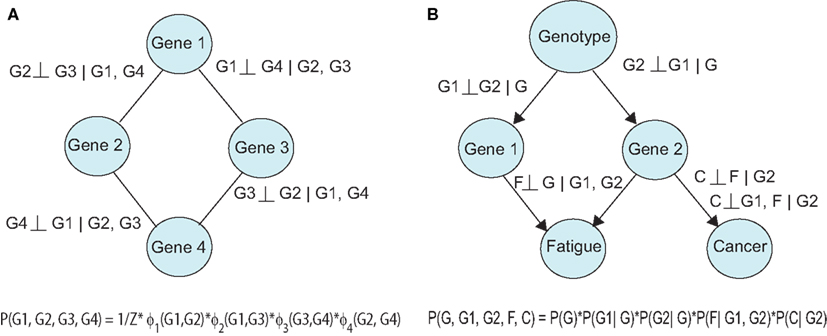
Figure 2. Probabilistic graphical models can be (A) undirected, or (B) directed. Relationships between variables can be expressed using conditional independencies, allowing compact representation of the joint distribution.
A fundamental challenge is to infer graphical models from data. There are two distinct and difficult learning tasks: parameter estimation and structural learning. Parameter estimation is for the parameters of the conditional probabilities for a given network structure, and can be carried out using maximum likelihood approaches (Koller and Friedman, 2009). In structural learning, the aim is to identify the most likely network topology that came from the observational data. Structural learning is especially challenging because the number of possible network topologies is super-exponential with the number of nodes (Chickering et al., 1994). As a result, enumeration of all possible network topologies is impossible even for small problems, and machine learning and optimization techniques must be utilized (Koller and Friedman, 2009).
PGMs have been applied to investigate a number of different cancers and data types. Several applications involve prediction and classification tasks, which have direct clinical relevance. Markov networks were used to predict breast cancer survival after patients received different forms of treatments, e.g., combinations of chemotherapy, radiotherapy, and hormonal therapy (Pérez-Ocón et al., 2001). BNs were used to integrate clinical and microarray data for the classification of breast cancer patients into good and poor prognosis groups (Gevaert et al., 2006). Kahn et al. developed a BN called MammoNet for radiological decision support in distinguishing malignant and benign mammary tumors. The highly accurate classifier (88% correct diagnosis in test cases) was constructed from observational data, patient history, and expert advice from experienced radiologists (Kahn et al., 1995). This group later developed a similar BN classifier called OncOs to differentiate among bone lesions on the appendicular skeleton (Kahn et al., 2001). A practical value of these models is to provide a probabilistic guide for a clinician to diagnose and treat different cancers. Another use of PGMs is to sort out the underlying mutations which put individuals at high-risk. Conjunctive Bayesian Networks (CBNs; Beerenwinkel et al., 2007), which describe an accumulation of events, have been used to model the accumulation of mutations using CGH mutation data from the Progentix database (Gerstung et al., 2009). The inference problem is to identify CGNs, which represent the dependencies among accumulating mutations in renal cell carcinoma, breast, and colorectal cancers. The models identified multiple independent mutations, which triggered downstream complex pathways.
A strength of PGM frameworks is the flexibility to integrate across diverse data types. Recently, a PGM methodology based on factor graphs known as PARADIGM (Pathway Recognition Algorithm using Data Integration on Genomic Models) was proposed, which integrates multiple high-throughput data sets together to identify perturbed molecular pathways (Nigro et al., 2005). This method was applied to breast cancer using gene expression data, and glioblastoma using gene expression and copy number data, to identify pathways and disease subclasses which correlate with survival. PARADIGM was recently applied to the same task using a more comprehensive set of breast cancer data in the CGA, including, mRNA, copy number alterations, micro RNAs, and methylation data. The method revealed disease subclasses and specific class signatures, which would not have been identified without leveraging the different data sources. Specific perturbations in immune response and interleukin signaling (IL-4, IL-6, IL-12, and IL-23) were also shown to be drivers of the classification and to have promising prognostic value. For example, patients with gene signature that favors high-T helper 1 cytotoxic T-lymphocyte response and represses Th2 driven humoral immunity, are more likely to have a better survival outcome.
Expression quantitative trait loci (eQTL), protein QTL, and metabolic QTL combine genotyping and high-throughput phenotyping of a population (Jansen et al., 2009). Genotype-phenotype network inference leverages this data and the natural variation that occurs within a population (Rockman, 2008). EQTL data on skin tumor progression in mice revealed markedly different patterns in the genetic architecture of malignant skin tumors (Quigley et al., 2011). This rich data includes genotypes and gene expression from F2 mice on benign and malignant skin tumors, as well as normal skin samples. EQTL data from a mouse model of breast cancer was used to identify Sipa1, a susceptibility and progression locus in both mice and humans (Crawford et al., 2007). PGM based algorithms utilize directed graphs to approximate the network of causal relationships among phenotypes and genotypes in segregating populations, but applications to cancer data are yet to be explored (Neto et al., 2010; Hageman et al., 2011).
There has been recent progress in sparse genome-scale models for undirected graphs, with applications that include protein signaling, breast cancer gene expression, and the genetics of gene expression (Carvalho et al., 2008; Friedman et al., 2008; Edwards et al., 2010; Yoshida and West, 2010). Sparse models can be estimated when the number of variables greatly exceeds the sample size. Importantly, estimation in graphical models requires large sample sizes for accuracy. Although sparse modeling deals with the issue of many variables, sufficient sample size is still required for meaningful results.
Graphical reasoning about biological problems underlies many approaches that are not formal PGMs. Cluster analysis is a class of techniques whose motivation lies in the concept of modularity, which has gained popularity more or less simultaneously in molecular biology, systems biology, developmental biology, and evolutionary biology (Wagner et al., 2007). Clustering (Gordon, 1999) can be viewed as a graph partitioning since members of the same cluster are considered to be connected in terms of whichever measure of association is adopted, and different clusters are relatively disconnected from each other. The associations between clusters may be specified in a variety of ways and no attempt is made to specify all the links in the graph. Viewing high-throughput data through clusters and modules increases our ability to distinguish subtle signals in tumorigenesis (Segal et al., 2005). This type of analysis is often easier to interpret than traditional lists of differential expression. Clustering methods have been extensively applied to identify and classify different cancer subtypes, and associate clusters with survival, e.g., (Furey et al., 2000; Guyon et al., 2002; van’t Veer et al., 2002; Sørlie et al., 2003; Rich et al., 2005; De Souto et al., 2008). Weighted Correlation Network Analysis (WGCNA) was recently developed as a method for identifying co-expression modules, relating modules to one another, relating modules to external phenotypes, and identifying hub genes that are highly connected within the module (Langfelder and Horvath, 2008). This method was used to identify a co-expression module in glioblastoma, which was also present in breast cancer. ASPM, a hub gene in the module, was experimentally validated as a potential uncharacterized glioblastoma target (Horvath et al., 2006).
Discussion: Challenges and Opportunities
Data integration remains a major fundamental challenge for the field of systems biology, which has limited our ability to take full advantage of omics data for knowledge and discovery (Kitano, 2002; Sullivan et al., 2010). Comparisons and integration within omics data types are complicated by a number of factors. Several different platforms are available that use different technologies and vary in coverage. Differences exist in sample quality, array processing, the organism under investigation, tissue type, and experimental conditions (e.g., diet). Integration between data types is an even larger challenge (Figure 3). It is important to understand how these different biological domains connect and give rise to a phenotype or disease. Methods that integrate between and across diverse data types are only beginning to emerge (Nigro et al., 2005). Mathematical modeling is a promising avenue for this endeavor. In Cancer Biology, data integration is of particular importance because of the complex interplay between genetics, cell signaling, and metabolic pathways.
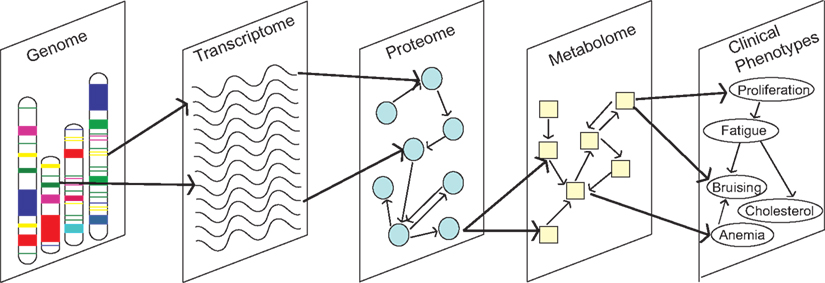
Figure 3. Understanding how molecular traits from different biological domains connect in networks is critical to progressing Cancer Biology.
Mathematical and statistical models are capable of integrating biological knowledge that is outside of the observational data. In a number of applications, the use of Bayesian methods that integrate a priori knowledge into the model have been shown to improve model behaviors and predictive output. We have described applications of BNs which incorporate expert advice from radiologists, which can be viewed as a model prior (Kahn et al., 1995). In metabolic modeling, flexible Bayesian priors have been used to guide the parameter estimation process. In this context, priors favor parameter estimates which respect known physiology of the system, e.g., steady-state, dynamic trends, feasible bounds on concentration levels, and fluxes (Calvetti and Somersalo, 2006; Calvetti et al., 2006). In graphical models, priors have been developed in the form of energy functions to guide network inference (Imoto et al., 2004). Priors have been used to encode known relational information from databases such as KEGG into the network inference process (Werhli and Husmeier, 2007; Mukherjee and Speed, 2008). Priors have also been used to enforce sparsity in the network structure and prevent over-fitting (Hageman et al., 2011).
Developing mathematical models which are consistent with and predictive of the true underlying biological mechanisms is a central goal of systems biology. The experimental design and perturbations have been shown to have major influence on parameter estimation, and subsequently the output and accuracy of the computational model (Apgar et al., 2010). Graphical model network inference can be subject to a large proportion of false positive edges (Li et al., 2010). Environmental and experimental design factors that are not accounted for in the model can further misguide models (Remington, 2009). Assessing and improving the utility of mathematical models in the context of systems biology will continue to be an active area of research.
A continuous cycle between mathematical modeling and the wet-bench is critical to move systems biology forward. As George Box famously stated, “all models are wrong, but some are useful” (Box and Draper, 1987). Sensitivity analysis should routinely be performed to assess how sensitive the model output (predictions) are to model parameters and input (data). However, this is often not routine. Sensitivity analysis can also be used to guide model reductions and expansions, e.g., marginalizing over quantities that play little to no role in the system dynamics. Mathematical models can provide, via model driven predictions and hypotheses generation, a cheap and fast catalyst for experimental advances in systems biology. On the other hand, models which are more “wrong” than “useful” can lead to the design and execution of experiments and studies which are unlikely to be successful. Contrary to in silico studies, this can waste a lot of time and money, and ultimately promote skepticism in the modeling approach.
Concluding Remarks
In summary, mathematical models of networks can describe a wide range biological processes. We have described two complementary modeling approaches: deterministic modeling of cellular metabolism and graphical modeling, which offer different insights into biological systems. Although they have been used to drive progress in Cancer Systems Biology, they remain far from mainstream. At present, there is an overwhelming need to view cancer as a complex network in order to understand drug resistance, and develop viable targets. It is also critical to better interpret and integrate data to get at the mechanisms which drive the disease, classify cancer subtypes, and predict treatment outcomes. In the coming years, we believe that mathematical and statistical models will be pivotal in advancing our understanding, and that they hold tremendous promise for the future of Cancer Systems Biology.
Conflict of Interest Statement
The authors declare that the research was conducted in the absence of any commercial or financial relationships that could be construed as a potential conflict of interest.
Acknowledgments
David L. Trichler received support from the Natural Sciences and Engineering Research Council of Canada (NSERC) and from MITACS (Mathematics of Information Technology and Complex Systems).
References
Apgar, J. F., Witmer, D. K., White, F. M., and Tidor, B. (2010). Sloppy models, parameter uncertainty, and the role of experimental design. Mol. Biosyst. 6, 1890–1900.
Astsaturov, I., Ratushny, V., Sukhanova, A., Einarson, M., Bagnyukova, T., Zhou, Y., Devarajan, K., Silverman, J., Tikhmyanova, N., Skobeleva, N., Pecherskaya, A., Nasto, R., Sharma, C., Jablonski, S., Serebriiskii, I., Weiner, L., and Golemis, E. (2010). Synthetic lethal screen of an egfr-centered network to improve targeted therapies. Sci. Signal. 3, ra67.
Barrett, T., and Edgar, R. (2006). Gene expression omnibus: microarray data storage, submission, retrieval, and analysis. Meth. Enzymol. 411, 352–369.
Bates, S., Amiri-Kordestani, L., and Giaccone, G. (2012). Drug development: portals of discovery. Clin. Cancer Res. 18, 23–32.
Baudis, M., and Cleary, M. (2001). Progenetix. net: an online repository for molecular cytogenetic aberration data. Bioinformatics 17, 1228–1229.
Beerenwinkel, N., Eriksson, N., and Sturmfels, B. (2007). Conjunctive Bayesian networks. Bernoulli 13, 893–909.
Box, G. E. P., and Draper, N. R. (1987). Empirical Model-Building and Response Surfaces. New York: Wiley.
Calvetti, D., Hageman, R., and Somersalo, E. (2006). Large-scale Bayesian parameter estimation for a three-compartment cardiac metabolism model during ischemia. Inverse Probl. 22, 1797–1816.
Calvetti, D., and Somersalo, E. (2006). Large-scale statistical parameter estimation in complex systems with an application to metabolic models. Multiscale Model. Simul. 5, 1333.
Carvalho, C., Chang, J., Lucas, J., Nevins, J., Wang, Q., and West, M. (2008). High-dimensional sparse factor modeling: applications in gene expression genomics. J. Am. Stat. Assoc. 103, 1438–1456.
Cheong, R., Hoffmann, A., and Levchenko, A. (2008). Understanding nf-κb signaling via mathematical modeling. Mol. Syst. Biol. 4, 192.
Chickering, D. M., Geiger, D., and Heckerman, D. (1994). Learning Bayesian Networks is NP-hard. Technical Report MSR-TR-94-17. Redmond: Microsoft Research.
Covert, M., Leung, T., Gaston, J., and Baltimore, D. (2005). Achieving stability of lipopolysaccharide-induced nf-κb activation. Science 309, 1854.
Crawford, N., Qian, X., Ziogas, A., Papageorge, A., Boersma, B., Walker, R., Lukes, L., Rowe, W., Zhang, J., Ambs, S., Lowy, D., Anton-Culver, H., and Hunter, K. (2007). Rrp1b, a new candidate susceptibility gene for breast cancer progression and metastasis. PLoS Genet. 3, e214. doi:10.1371/journal.pgen.0030214
De Souto, M., Costa, I., De Araujo, D., Ludermir, T., and Schliep, A. (2008). Clustering cancer gene expression data: a comparative study. BMC Bioinformatics 9, 497. doi:10.1186/1471-2105-9-497
Duarte, N., Becker, S., Jamshidi, N., Thiele, I., Mo, M., Vo, T., Srivas, R., and Palsson, B. (2007). Global reconstruction of the human metabolic network based on genomic and bibliomic data. Proc. Natl. Acad. Sci. U.S.A. 104, 1777.
Edwards, D., De Abreu, G., and Labouriau, R. (2010). Selecting high-dimensional mixed graphical models using minimal aic or bic forests. BMC Bioinformatics 11, 18. doi:10.1186/1471-2105-11-18
Edwards, J., and Palsson, B. (2000). Metabolic flux balance analysis and the in silico analysis of Escherichia coli k-12 gene deletions. BMC Bioinformatics 1, 1. doi:10.1186/1471-2105-1-1
Erguler, K., and Stumpf, M. (2011). Practical limits for reverse engineering of dynamical systems: a statistical analysis of sensitivity and parameter inferability in systems biology models. Mol. Biosyst. 7, 1593–1602.
Folger, O., Jerby, L., Frezza, C., Gottlieb, E., Ruppin, E., and Shlomi, T. (2011). Predicting selective drug targets in cancer through metabolic networks. Mol. Syst. Biol. 7, 501.
Forbes, S. A., Tang, G., Bindal, N., Bamford, S., Dawson, E., Cole, C., Kok, C. Y., Jia, M., Ewing, R., Menzies, A., Teague, J. W., Stratton, M. R., and Futreal, P. A. (2010). COSMIC (the catalogue of somatic mutations in cancer): a resource to investigate acquired mutations in human cancer. Nucleic Acids Res. 38, D652–D657.
Förster, J., Famili, I., Fu, P., Palsson, B., and Nielsen, J. (2003). Genome-scale reconstruction of the Saccharomyces cerevisiae metabolic network. Genome Res. 13, 244–253.
Friedman, A., Bellomo, N., and Maini, P. (2007). Mathematical analysis and challenges arising from models of tumor growth. Math. Models Methods Appl. Sci. 17, 1751–1772.
Friedman, J., Hastie, T., and Tibshirani, R. (2008). Sparse inverse covariance estimation with the graphical lasso. Biostatistics 9, 432–441.
Furey, T., Cristianini, N., Duffy, N., Bednarski, D., Schummer, M., and Haussler, D. (2000). Support vector machine classification and validation of cancer tissue samples using microarray expression data. Bioinformatics 16, 906–914.
Futreal, P. A., Coin, L., Marshall, M., Down, T., Hubbard, T., Wooster, R., Rahman, N., and Stratton, M. R. (2004). A census of human cancer genes. Nat. Rev. Cancer 4, 177–183.
Gerlowski, L., and Jain, R. (1983). Physiologically based pharmacokinetic modeling: principles and applications. J. Pharm. Sci. 72, 1103–1127.
Gerstung, M., Baudis, M., Moch, H., and Beerenwinkel, N. (2009). Quantifying cancer progression with conjunctive Bayesian networks. Bioinformatics 25, 2809–2815.
Gevaert, O., De Smet, F., Timmerman, D., Moreau, Y., and De Moor, B. (2006). Predicting the prognosis of breast cancer by integrating clinical and microarray data with Bayesian networks. Bioinformatics 22, e184–e190.
Geva-Zatorsky, N., Rosenfeld, N., Itzkovitz, S., Milo, R., Sigal, A., Dekel, E., Yarnitzky, T., Liron, Y., Polak, P., Lahav, G., and Alon, U. (2006). Oscillations and variability in the p53 system. Mol. Syst. Biol. 2.
Goodman, L., Wintrobe, M., Dameshek, W., Goodman, M., Gilman, A., and McLennan, M. (1946). Nitrogen mustard therapy; use of methyl-bis (beta-chloroethyl) amine hydrochloride and tris (beta-chloroethyl) amine hydrochloride for hodgkin’s disease, lymphosarcoma, leukemia and certain allied and miscellaneous disorders. J. Am. Med. Assoc. 132, 125–132.
Guyon, I., Weston, J., Barnhill, S., and Vapnik, V. (2002). Gene selection for cancer classification using support vector machines. Mach. Learn. 46, 389–422.
Hageman, R. S., Leduc, M. S., Korstanje, R., Paigen, B., and Churchill, G. A. (2011). A Bayesian framework for inference of the genotype-phenotype map for segregating populations. Genetics 187, 1163–1170.
Heiden, M. V. (2011). Targeting cancer metabolism: a therapeutic window opens. Nat. Rev. Drug Discov. 10, 671–684.
Hoffmann, A., Levchenko, A., Scott, M., and Baltimore, D. (2002). The iκb-nf-κb signaling module: temporal control and selective gene activation. Science 298, 1241.
Horvath, S., Zhang, B., Carlson, M., Lu, K., Zhu, S., Felciano, R., Laurance, M., Zhao, W., Qi, S., Chen, Z., Lee, Y., Scheck, A. C., Liau, L. M., Wu, H., Geschwind, D. H., Febbo, P. G., Kornblum, H. I., Cloughesy, T. F., Nelson, S. F., and Mischel, P. S. (2006). Analysis of oncogenic signaling networks in glioblastoma identifies aspm as a molecular target. Proc. Natl. Acad. Sci. U.S.A. 103, 17402–17407.
Imoto, S., Higuchi, T., Goto, T., Tashiro, K., Kuhara, S., and Miyano, S. (2004). Combining microarrays and biological knowledge for estimating gene networks via Bayesian networks. J. Bioinform. Comput. Biol. 2, 77–98.
Jansen, R., Tesson, B., Fu, J., Yang, Y., and McIntyre, L. (2009). Defining gene and qtl networks. Curr. Opin. Plant Biol. 12, 241–246.
Johnstone, R., Ruefli, A., and Lowe, S. (2002). Apoptosis: a link between cancer genetics and chemotherapy. Cell 108, 153–164.
Kahn, C. Jr., Roberts, L., Wang, K., Jenks, D., and Haddawy, P. (1995). “Preliminary investigation of a Bayesian network for mammographic diagnosis of breast cancer,” in Proceedings of the Annual Symposium on Computer Application in Medical Care (New Orleans: American Medical Informatics Association), 208.
Kahn, C., Laur, J., and Carrera, G. (2001). A Bayesian network for diagnosis of primary bone tumors. J. Digit. Imaging 14, 56–57.
Koller, D., and Friedman, N. (2009). Probabilistic Graphical Models: Principles and Techniques. Cambridge: The MIT Press.
Lähdesmäki, H., Shmulevich, I., and Yli-Harja, O. (2003). On learning gene regulatory networks under the Boolean network model. Mach. Learn. 52, 147–167.
Langfelder, P., and Horvath, S. (2008). Wgcna: an r package for weighted correlation network analysis. BMC Bioinformatics 9, 559. doi:10.1186/1471-2105-9-559
Lee, J., Gianchandani, E., and Papin, J. (2006). Flux balance analysis in the era of metabolomics. Brief. Bioinformatics 7, 140–150.
Li, Y., Tesson, B. M., Churchill, G. A., and Jansen, R. C. (2010). Critical reasoning on causal inference in genome-wide linkage and association studies. Trends Genet. 26, 493–498.
Livnat Jerby, T., and Ruppin, E. (2010). Computational reconstruction of tissue-specific metabolic models: application to human liver metabolism. Mol. Syst. Biol. 6, 401.
Lord, C., and Ashworth, A. (2010). Biology-driven cancer drug development. BMC Biol. 8, 38. doi:10.1186/1741-7007-8-38
Lu, W., Pelicano, H., and Huang, P. (2010). Cancer metabolism: is glutamine sweeter than glucose? Cancer Cell 18, 199–200.
MacLachlan, M., Sundnes, J., and Spiteri, R. (2007). A comparison of non-standard solvers for odes describing cellular reactions in the heart. Comput. Methods Biomech. Biomed. Engin. 10, 317–326.
Matthews, L., Gopinath, G., Gillespie, M., Caudy, M., Croft, D., De Bono, B., Garapati, P., Hemish, J., Hermjakob, H., Jassal, B., Kanapin, A., Lewis, S., Mahajan, S., May, B., Schmidt, E., Vastrik, I., Wu, G., Birney, E., Stein, L., and D’Eustachio, P. (2009). Reactome knowledgebase of human biological pathways and processes. Nucleic Acids Res. 37 (Suppl. 1), D619–D622.
Medes, G., Thomas, A., and Weinhouse, S. (1953). Metabolism of neoplastic tissue. IV. A study of lipid synthesis in neoplastic tissue slices in vitro. Cancer Res. 13, 27.
Morris, M., Saez-Rodriguez, J., Sorger, P., and Lauffenburger, D. (2010). Logic-based models for the analysis of cell signaling networks. Biochemistry 49, 3216–3224.
Mukherjee, S., and Speed, T. (2008). Network inference using informative priors. Proc. Natl. Acad. Sci. U.S.A. 105, 14313.
Neto, E., Keller, M., Attie, A., and Yandell, B. (2010). Causal graphical models in systems genetics: a unified framework for joint inference of causal network and genetic architecture for correlated phenotypes. Ann. Appl. Stat. 4, 320–339.
Nigro, J., Misra, A., Zhang, L., Smirnov, I., Colman, H., Griffin, C., Ozburn, N., Chen, M., Pan, E., Koul, D., Yung, W. K., Feuerstein, B. G., and Aldape, K. D. (2005). Integrated array-comparative genomic hybridization and expression array profiles identify clinically relevant molecular subtypes of glioblastoma. Cancer Res. 65, 1678.
Oberhardt, M., Palsson, B., and Papin, J. (2009). Applications of genome-scale metabolic reconstructions. Mol. Syst. Biol. 5, 320.
Ogata, H., Goto, S., Sato, K., Fujibuchi, W., Bono, H., and Kanehisa, M. (1999). Kegg: Kyoto encyclopedia of genes and genomes. Nucleic Acids Res. 27, 29.
Ookhtens, M., Kannan, R., Lyon, I., and Baker, N. (1984). Liver and adipose tissue contributions to newly formed fatty acids in an ascites tumor. Am. J. Physiol. 247, R146–R153.
Orton, R., Sturm, O., Vyshemirsky, V., Calder, M., Gilbert, D., and Kolch, W. (2005). Computational modelling of the receptor-tyrosine-kinase-activated mapk pathway. Biochem. J. 392 (Pt 2), :249.
Pérez-Ocón, R., Ruiz-Castro, J., and Gámiz-Pérez, M. (2001). Non-homogeneous markov models in the analysis of survival after breast cancer. J. R. Stat. Soc. Ser. C Appl. Stat. 50, 111–124.
Piras, V., Hayashi, K., Tomita, M., and Selvarajoo, K. (2011). Enhancing apoptosis in trail-resistant cancer cells using fundamental response rules. Sci. Rep. 1, 144.
Quigley, D., To, M., Jin Kim, I., Lin, K., Albertson, D., Sjolund, J., Perez-Losada, J., and Balmain, A. (2011). Network analysis of skin tumor progression identifies a rewired genetic architecture affecting inflammation and tumor susceptibility. Genome Biol. 12, R5.
Reitz, R., Mendrala, A., Corley, R., Quast, J., Gargas, M., Andersen, M., Staats, D., and Conolly, R. (1990). Estimating the risk of liver cancer associated with human exposures to chloroform using physiologically based pharmacokinetic modeling. Toxicol. Appl. Pharmacol. 105, 443–459.
Remington, D. L. (2009). Effects of genetic and environmental factors on trait network predictions from quantitative trait locus data. Genetics 181, 1087–1099.
Ribba, B., Saut, O., Colin, T., Bresch, D., Grenier, E., and Boissel, J. (2006). A multiscale mathematical model of avascular tumor growth to investigate the therapeutic benefit of anti-invasive agents. J. Theor. Biol. 243, 532–541.
Rich, J., Hans, C., Jones, B., Iversen, E., McLendon, R., Rasheed, B., Dobra, A., Dressman, H., Bigner, D., Nevins, J., and West, M. (2005). Gene expression profiling and genetic markers in glioblastoma survival. Cancer Res. 65, 4051.
Rockman, M. (2008). Reverse engineering the genotype–phenotype map with natural genetic variation. Nature 456, 738–744.
Sanga, S., Sinek, J., Frieboes, H., Ferrari, M., Fruehauf, J., and Cristini, V. (2006). Mathematical modeling of cancer progression and response to chemotherapy. Expert Rev. Anticancer Ther. 6, 1361–1376.
Segal, E., Friedman, N., Kaminski, N., Regev, A., and Koller, D. (2005). From signatures to models: understanding cancer using microarrays. Nat. Genet. 37, S38–S45.
Selvarajoo, K. (2011). Macroscopic law of conservation revealed in the population dynamics of toll-like receptor signaling. Cell Commun. Signal 9, 9.
Selvarasu, S., Karimi, I., Ghim, G., and Lee, D. (2010). Genome-scale modeling and in silico analysis of mouse cell metabolic network. Mol. Biosyst. 6, 151–161. doi:10.1371/journal.pcbi.1002018
Shampine, L., Gladwell, I., and Thompson, S. (2003). Solving ODEs with MATLAB. Cambridge: Cambridge University Press.
Shlomi, T., Benyamini, T., Gottlieb, E., Sharan, R., and Ruppin, E. (2011). Genome-scale metabolic modeling elucidates the role of proliferative adaptation in causing the warburg effect. PLoS Comput. Biol. 7, 151–161.
Siegel, R., Ward, E., Brawley, O., and Jemal, A. (2011). The impact of eliminating socioeconomic and racial disparities on premature cancer deaths. CA Cancer J. Clin. 61, 212–236.
Sleeman, B., and Levine, H. (2001). Partial differential equations of chemotaxis and angiogenesis. Math. Methods Appl. Sci. 24, 405–426.
Sørlie, T., Tibshirani, R., Parker, J., Hastie, T., Marron, J., Nobel, A., Deng, S., Johnsen, H., Pesich, R., Geisler, S., Demeter, J., Perou, C. M., Lønning, P. E., Brown, P. O., Børresen-Dale, A. L., and Botstein, D. (2003). Repeated observation of breast tumor subtypes in independent gene expression data sets. Proc. Natl. Acad. Sci. U.S.A. 100, 8418.
Sullivan, D., Gabbard, J. Jr., Shukla, M., and Sobral, B. (2010). Data integration for dynamic and sustainable systems biology resources: challenges and lessons learned. Chem. Biodivers. 7, 1124–1141.
Thangue, N. L., and Kerr, D. (2011). Predictive biomarkers: a paradigm shift towards personalized cancer medicine. Nat. Rev. Clin. Oncol. 8, 587–596.
van’t Veer, L., Dai, H., Van De Vijver, M., He, Y., Hart, A., Mao, M., Peterse, H., Van Der Kooy, K., Marton, M., Witteveen, A., Schreiber, G. J., Kerkhoven, R. M., Roberts, C., Linsley, P. S., Bernards, R., and Friend, S. H. (2002). Gene expression profiling predicts clinical outcome of breast cancer. Nature 415, 530–536.
Varmus, H., and Harlow, E. (2012). Science funding: provocative questions in cancer research. Nature 481, 436–437.
Wagner, G., Pavlicev, M., and Cheverud, J. (2007). The road to modularity. Nat. Rev. Genet. 8, 921–931.
Werhli, A.V., and Husmeier, D. (2007). Reconstructing gene regulatory networks with Bayesian networks by combining expression data with multiple sources of prior knowledge. Stat. Appl. Genet. Mol. Biol. 6, 15.
Werner, S., Barken, D., and Hoffmann, A. (2005). Stimulus specificity of gene expression programs determined by temporal control of IKK activity. Science 309, 1857.
Keywords: cancer, metabolism, ODEs, steady-state, dynamic, graphical models, high-throughput data
Citation: Blair RH, Trichler DL and Gaille DP (2012) Mathematical and statistical modeling in cancer systems biology. Front. Physio. 3:227. doi: 10.3389/fphys.2012.00227
Received: 30 March 2012; Accepted: 05 June 2012;
Published online: 28 June 2012.
Edited by:
Kumar Selvarajoo, Keio University, JapanReviewed by:
Amin Mazloom, University of Texas at Arlington, USAShawn Gomez, The University of North Carolina at Chapel Hill, USA
Copyright: © 2012 Blair, Trichler and Gaille. This is an open-access article distributed under the terms of the Creative Commons Attribution Non Commercial License, which permits non-commercial use, distribution, and reproduction in other forums, provided the original authors and source are credited.
*Correspondence: Rachael Hageman Blair, Department of Biostatistics, State University of New York at Buffalo, Kimball Tower, Room 709, 3435 Main Street, Buffalo, NY 14214, USA. e-mail: hageman@buffalo.edu