 Lorenzo Raggi
 Leonardo Caproni
 Andrea Carboni
 Valeria Negri
- 1Dipartimento di Scienze Agrarie, Alimentari e Ambientali (DSA3), Università degli Studi di Perugia, Perugia, Italy
- 2CREA Research Centre for Cereal and Industrial Crops, Bologna, Italy
The common bean is one of the most important staples in many areas of the world. Extensive phenotypic and genetic characterization of unexplored bean germplasm are still needed to unlock the breeding potential of this crop. Dissecting genetic control of flowering time is of pivotal importance to foster common bean breeding and to develop new varieties able to adapt to changing climatic conditions. Indeed, flowering time strongly affects yield and plant adaptation ability. The aim of this study was to investigate the genetic control of days to flowering using a whole genome association approach on a panel of 192 highly homozygous common bean genotypes purposely developed from landraces using Single Seed Descent. The phenotypic characterization was carried out at two experimental sites throughout two growing seasons, using a randomized partially replicated experimental design. The same plant material was genotyped using double digest Restriction-site Associated DNA sequencing producing, after a strict quality control, a dataset of about 50 k Single Nucleotide Polymorphisms (SNPs). The Genome-Wide Association Study revealed significant and meaningful associations between days to flowering and several SNP markers; seven genes are proposed as the best candidates to explain the detected associations.
Introduction
Achieving food security is one of the most important challenges to face in the next three decades. FAO’s 2017 prospects’ revision on the world’s population growth reports an expected growth of the population of more than 2 billion people by 2050 (United Nations, 2017). Accordingly, the demand of food will increase, especially in the areas of the world where most of the developing countries are located, mainly in the African continent (Jensen et al., 2012).
In this context, grain legumes are generally regarded as key commodities for improving food security as they are a relatively inexpensive source of amino acids and other important nutrients such as minerals, when compared to livestock and dairy products (Jensen et al., 2012). In addition, due to their ability to fix atmospheric nitrogen, legumes can generally help reducing the use of fertilizers, thus the environmental impact of agriculture (Reay et al., 2012; Andrews and Andrews, 2017). For all these reasons the use of legumes as a key ingredient for a sustainable agricultural production system is at the core of agricultural policy debates in different countries (Zander et al., 2016).
Among grain legumes, common bean (Phaseolus vulgaris L., 2n = 2x = 22) is one of the most important staples in the world, produced over an area of 18 million hectares with a total production of 12 million tons per year (Akibode and Maredia, 2011; Faostat, 2019). Its production mainly occurs in the sub-Saharan Africa and in many Latin American countries (Petry et al., 2015), where it is critical to nutritional security and farmers income generation (Broughton et al., 2003). The cultivated common bean originated in two centers of diversity, giving rise to two genepools: the Mesoamerican, from Central America and the Andean, from the Andes mountains in South America. Many evidences demonstrated that the two genepools are the result of two independent domestication events that led to many morphological and genetic differences (Singh et al., 1991a, b; Kwak and Gepts, 2009).
Upon the introduction of the common bean in Europe from the Americas, hybridization of the two genepools generated further genetic diversity (Gepts et al., 1988; Zeven, 1997; Angioi et al., 2009; Gioia et al., 2013; Maras et al., 2013), for this reason Europe is considered a secondary center of diversification for this species (Angioi et al., 2010). This process led to the constitution of many European common bean landraces that represent a very important resource for plant breeding. In fact, they have been and still are a useful, sometimes unique, source of favorable alleles for abiotic stress, pest and disease resistances (Esquinas-Alcázar, 1993; Angioi et al., 2010).
Landraces are distinct and variable populations that are characterized by useful agronomical traits and adaptation to the specific environments where they were cultivated for a long time. It is important to stress that landraces differ from historical varieties; in fact, they lack “formal” crop improvement and are closely related to knowledge, habits and uses of the people that have been grown them until present times (Raggi et al., 2013). Even if landraces are excellent raw material for breeding new varieties, the within-population genetic diversity of such materials makes their exploitation in plant breeding challenging. This applies to common bean too where intra-landraces genetic diversity can be rather high (Tiranti and Negri, 2007) while intra-individual heterozygosity rather low (Caproni et al., 2018). Indeed, difficulties may arise in the attempt of associating phenotypic traits of interest with the corresponding genetic determinants when using landraces; the identification of such associations is a fundamental prerequisite for allele mining (Visioni et al., 2013). Therefore, the development of a panel of a manageable number of diverse homozygous common bean genotypes is needed to cope with the above-mentioned limitations (Pignone et al., 2015).
The Single Seed Descent (SSD), initially proposed as a modification of the classical bulk breeding scheme to overcome the problem of natural selection (Goulden, 1939), represent a cost-effective approach to achieve that purpose. Given a certain cross, the application of this method to segregating generations allows to maximize the level of retained genetic variation in relation to cost and labor. SSD consists of passing from a generation to the next one by sowing a single seed from each plant (Brim, 1966). In a self-pollinating species like common bean, SSD can be effectively exploited to generate highly homozygous genotypes starting from single individuals of different landraces (Snape and Riggs, 1975).
Although bi-parental mapping has been successful in identifying many significant Quantitative Trait Loci (QTL) mapped to wide intervals in the common bean genome, our knowledge of genes controlling certain traits is still limited (Johnson and Gepts, 2002; Kelly et al., 2003; Blair et al., 2006, 2011; Miklas et al., 2006; Kwak et al., 2008; Perez-Vega et al., 2010). In fact, the resolution of QTL analysis is generally limited by the number of the recombination events; it means that a QTL can span a few centiMorgans (cM), which can indeed be translated into relatively long physical distances, sometimes containing hundreds of candidate genes (Moghaddam et al., 2016). By contrast, Genome Wide Association Mapping (GWAM) considers much more recombination events by using an association panel of individuals, each of those potentially characterized by a unique recombination history (Visscher et al., 2017). In addition, Genome Wide Association Studies (GWAS), based on very high number of markers, allow to test association of the trait of interest with a large part of the genome of the target species. Due to low cost by data point, high robustness, reproducibility and number in the genome, molecular markers based on Single Nucleotide Polymorphism (SNP) detection are those of election for conducting GWAS.
Currently, different approaches can be used to generate large SNP datasets. For example, high-density SNP arrays are already available for several crops (Hao et al., 2017) including common bean. However, such arrays are often designed starting from a limited number of elite genotypes and can produce biased data when used for characterization of non-elite materials. Next Generation Sequencing (NGS) techniques, that equally produce high number of datapoints, are an interesting alternative as they allow cheap not-biased SNP discovery and genotyping. This approaches have already been used and proven efficient in several crops including wheat, barley and pea (Poland et al., 2012; Liu et al., 2014; Annicchiarico et al., 2017). Moreover, the current availability of reference genomes of several crops (that allows to perform in silico simulations to optimize the technique and to map the markers) and of collections of genetically diverse pure lines (that allow to reduce sequence coverage due to the absence of heterozygous loci) makes Next Generation Genotyping (NGG) extremely attractive. Among the possible different NGG strategies (Davey et al., 2011; Barilli et al., 2018) double digest Restriction-site Associated DNA sequencing (ddRAD-seq) was the one of choice for this work. ddRAD-seq is a technique based on a digestion of genomic DNA carried out using two restriction enzymes (instead of a single restriction enzyme as in RAD-seq); the resulting DNA fragments are then ligated to sample-specific barcode adapters for subsequent bulk genotyping on an Illumina platform (Peterson et al., 2012).
Schmutz et al. (2014) published the first reference genome for P. vulgaris. This achievement opened novel possibilities for common bean NGG making the use of techniques, such as ddRAD-seq, potentially very effective.
Recently, association studies were carried out on the common bean using different plant materials and genotyping approaches. These studies focused on the search of meaningful association of agronomic traits (Moghaddam et al., 2016), nitrogen fixation (Kamfwa et al., 2015a), resistance to diseases (Perseguini et al., 2016), seed weight (Yan et al., 2017), and some technological traits as cooking time in dry beans (Cichy et al., 2015) with possible genetic determinants involved in their control. In some cases, these studies allowed the identification of candidate genes that can be used to develop new genetic stocks for bean breeding programs.
As flowering time is a key trait determining the production of dry matter and seed yield in many crops such as common bean, its manipulation is a relevant plant breeding target to produce novel varieties that are better adapted to changing climatic conditions (Jung and Müller, 2009). For example, early flowering can be exploited to avoid harsh environmental conditions (e.g., drought and heat) and/or escape pathogen attacks that can both negatively affect seed production (as they occur during/after the seed set stage). On the other hand, late flowering can increase seed yield by extending the vegetative phase and increasing the photosynthate accumulation. A flowering time well-synchronized with target environmental conditions would contribute to the achievement of optimal crop performances.
Extensive studies on floral transition revealed a network of regulatory interactions among genes able to promote or inhibit the phenological transition to the reproductive phase (i.e., flowering). In Arabidopsis many of the regulatory genes have been identified and functionally characterized (Putterill et al., 2004; Bäurle and Dean, 2006). Moreover, different species, such as medicago (Medicago truncatula) (Pierre et al., 2008, 2011; Laurie et al., 2011), pea (Pisum sativum) (Lejeune-Hénaut et al., 2008) and narrow-leafed lupin (Lupinus angustifolius) (Ksiazkiewicz et al., 2016; Nelson et al., 2017) have been used to investigate the genetic control of flowering in legumes.
In P. vulgaris few studies on flowering time variation and control have been carried out to date. QTL mapping studies detected some genomic regions associated with the trait (Koinange et al., 1996; Blair et al., 2006; Perez-Vega et al., 2010). Raggi et al. (2014) found significant associations between some candidate genes and flowering time variation in a common bean collection. Recently, Kamfwa et al. (2015b) and Moghaddam et al. (2016) identified SNPs significantly associated with days to flowering.
In our study GWAS was used to detect key genomic regions involved in flowering time control. To the purpose, a panel of highly homozygous and diverse common bean genotypes was developed using SSD. Genotypes within the panel were subjected to an extensive genotyping, using ddRAD-seq, and phenotypic characterization carried out in different years and locations.
Materials and Methods
Plant Material
The plant material of this work was initially selected with the idea of creating a balanced collection of Andean and Mesoamerican landraces potentially representing an important portion of the European diversity of this species. A similar number of accessions from the two common bean genepools was initially considered; according to the available data of the phaseolin alleles, 97 Andean (57 T + 40 C type) and 84 Mesoamerican (all S type) accessions were included. Europe is the most represented geographical area in the panel (153 accessions) followed by South and Central America (22 and 17, respectively). Italy accounts the highest number of accessions followed by Turkey, Spain, Netherlands, and Portugal. A heatmap representing the origin of the materials is reported in Figure 1.
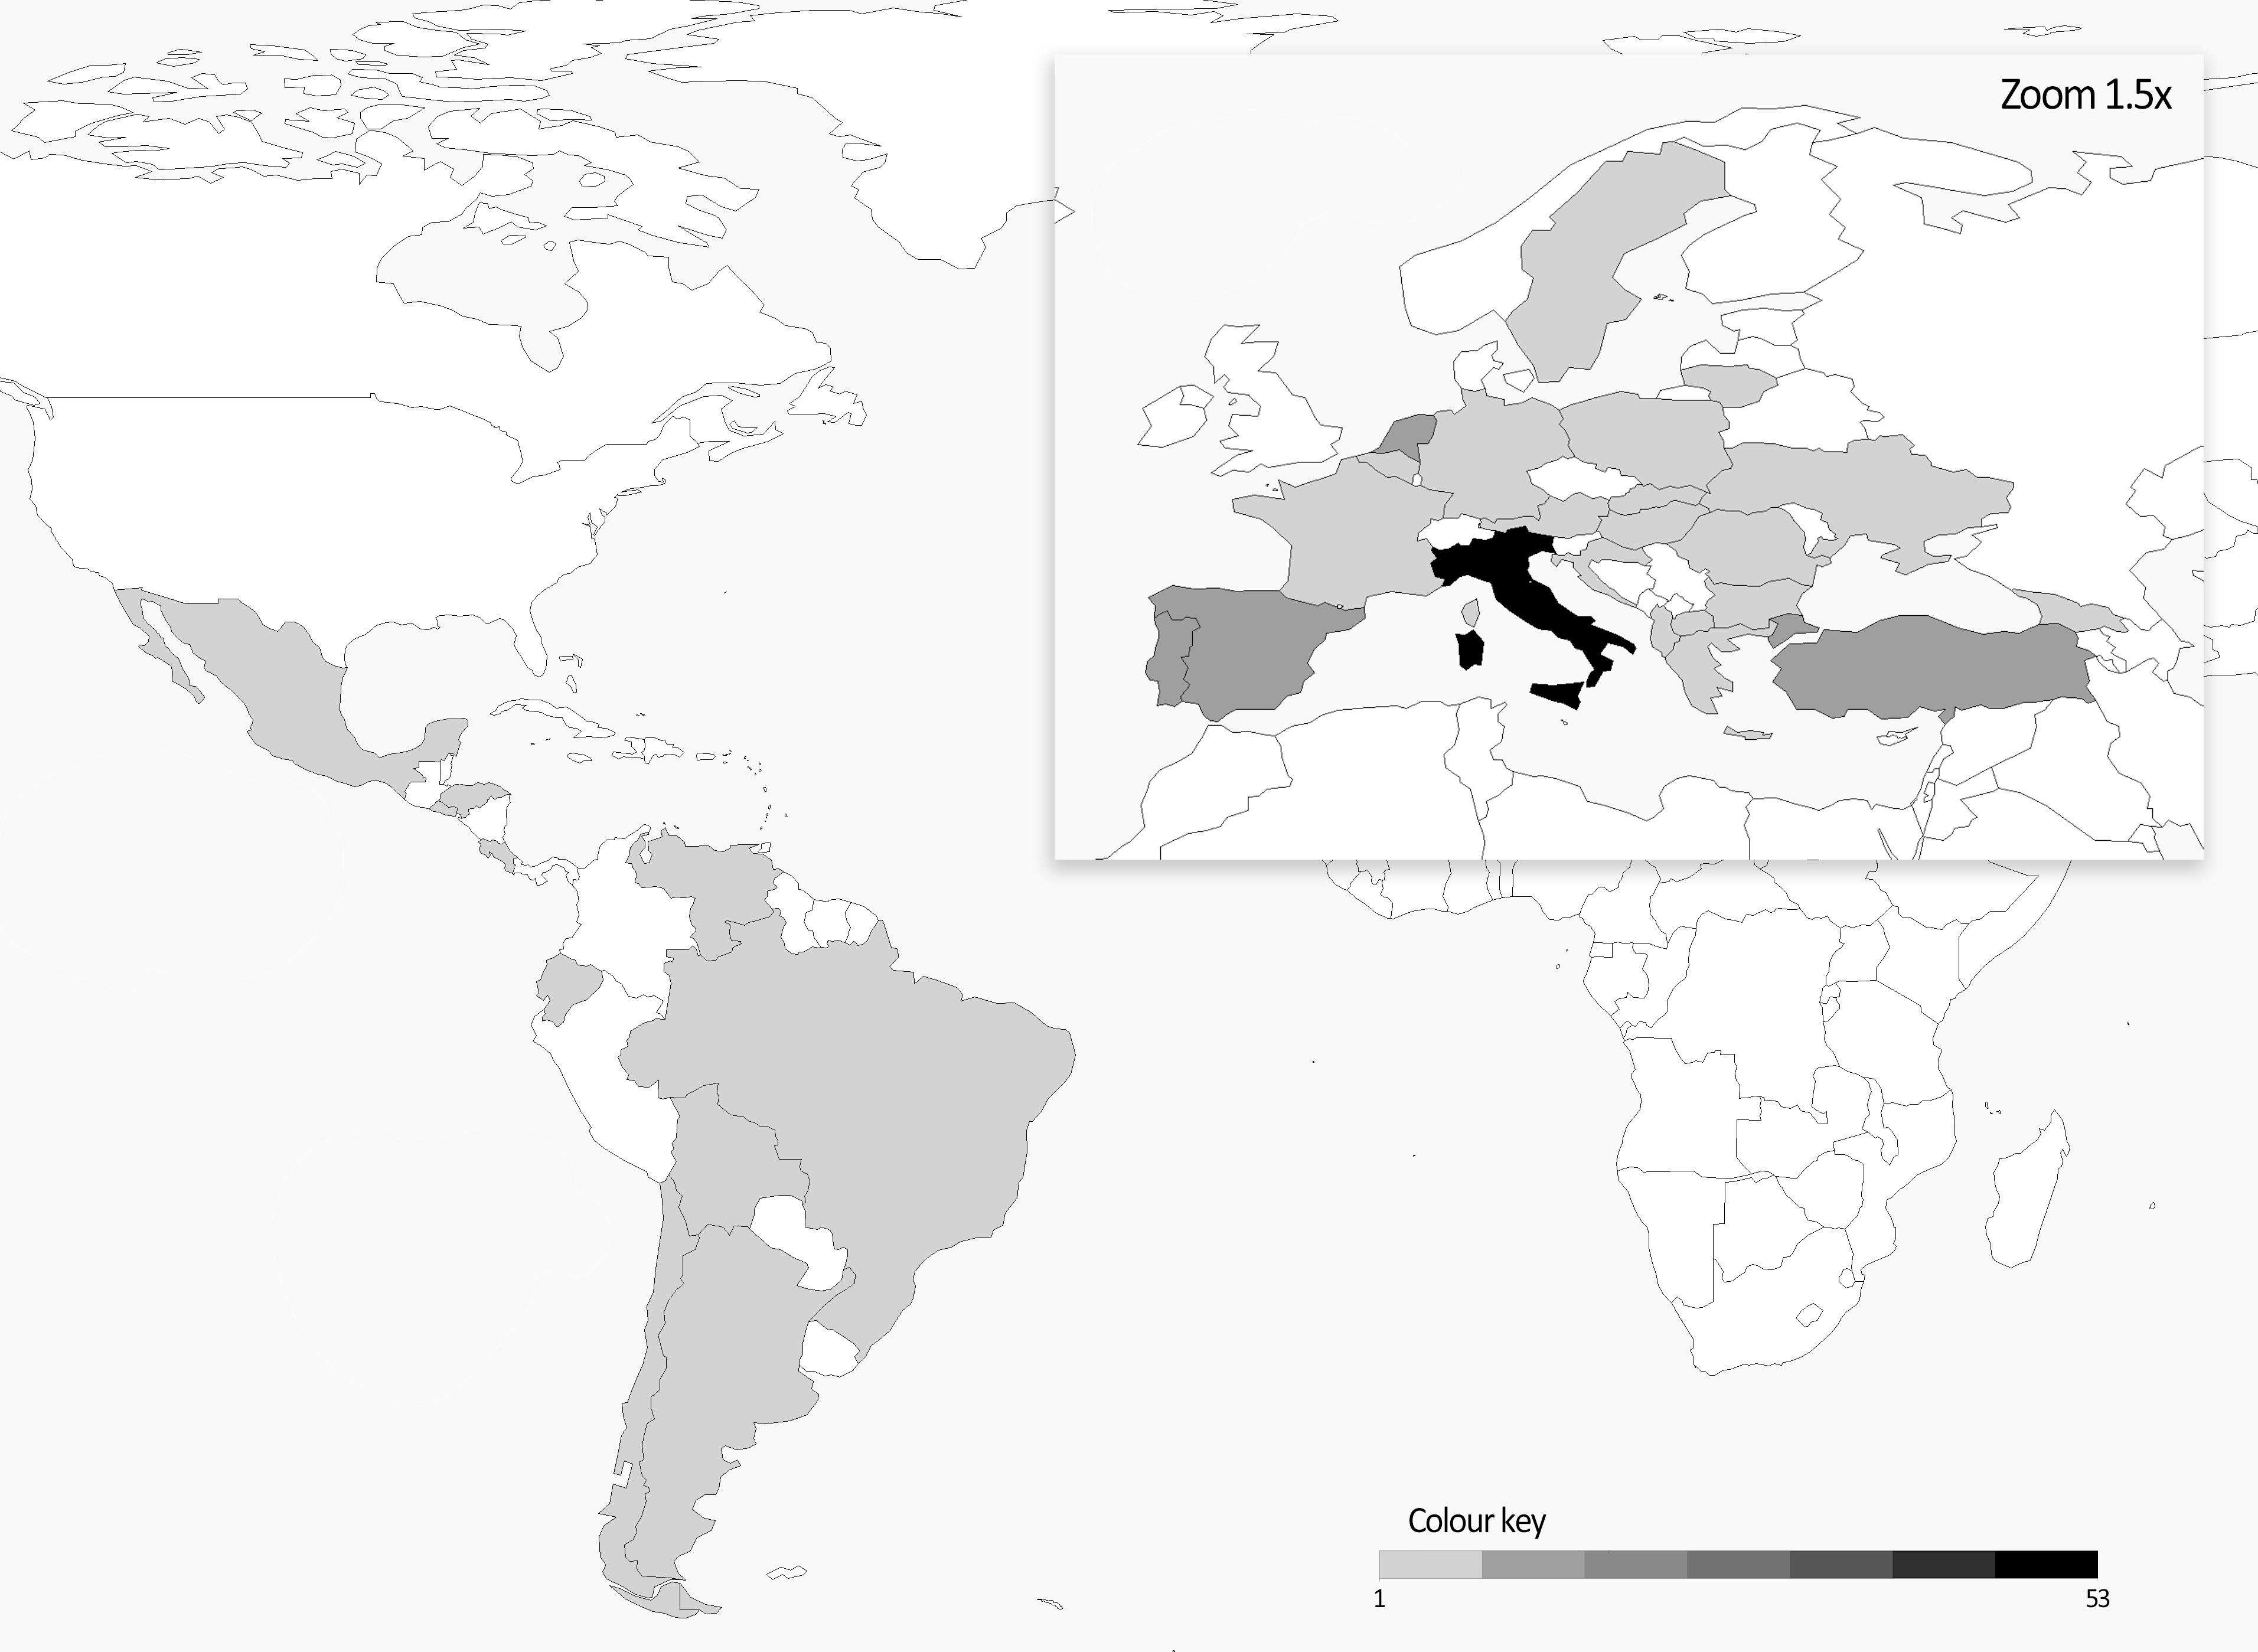
Figure 1. Heatmap of number of accessions per country included in the common bean panel.
Starting from the above described collection, 181 common bean highly homozygous genotypes (i.e., pure lines) were obtained applying SSD for at least 5 consecutive generations under isolated conditions. The 181 lines together with 11 cultivars, included as controls, constitute the diversity panel used in this study accounting a total of 192 lines (NCBI BioSample accessions from SAMN12035168 to SAMN12035359). Further details about lines within the panel, including the genebank from which each accession has been originally obtained, are reported in Supplementary Table 1.
Phenotyping
The phenological characterization of the 192 genotypes was carried out for two consecutive seasons (2016 and 2017) at: (i) DSA3-UNIPG experimental field located in Sant’Andrea d’Agliano, Perugia, Italy (43°3′15.12″N; 12°23′41.64″E, 175 m a.s.l.) (hereafter PG) and (ii) CREA-CI experimental field located in Anzola dell’Emilia, Bologna, Italy (44°34′30.51″N, 11°9′55.64″E, 38 m a.s.l.) (hereafter BO). In 2016 plant material was only evaluated in PG while in 2017 in both PG and BO. In both years sowing has been carried out in May: the 4th (PG_2016), the 11th (PG_2017), and the 12th (BO_2017).
The three experiments were all arranged using partially replicated randomized designs in which five entries were replicated five times and two were replicated six times, producing a total of 222 single plant samples out of 192 entries [total samples = 192 – 7 + (5 × 5) + (2 × 6)]. In PG, the 222 common bean samples were grown in 6 adjacent blocks (fixed size of 1 column × 37 rows) covered by anti-insect net; in BO the same samples were arranged in 3 adjacent blocks (fixed size of 1 column × 74 rows). Plants were grown in a net covered nursery supplied with an automatic drip-irrigation system throughout the entire duration of the trials (May to mid-October). For each sample days to flowering (dtf) was recorded as days between sowing and the opening of the first flower (Raggi et al., 2014); a value of 162 days was assigned to the genotypes that did not flower by the end of the experiments (Zhao et al., 2007).
Phenotypic Data Analyses
The row-column layout of the grown plants and their partial replication allowed for a bi-dimensional spatial analysis of dtf (Singh et al., 1997, 2003; Rollins et al., 2013; Raggi et al., 2017). To the purpose, “plot,” “row,” and “column” number was assigned to each sample according to its position. For each entry dtf Best Linear Unbiased Predictors (BLUPs) of the genotype effect were calculated in GenStat® (Payne et al., 2011) using the most suitable spatial model determined for the row and column field layout as described by Singh et al. (2003). The procedure consists in gauging the spatial variability by nine applicable models accounting for the existence of different trends, fitting each model (according to the sample position, using the Restricted Maximum Likelihood method, REML), and choosing the best possible one using the Akaike Information Criterion (AIC) (Akaike, 1974). The variance components were used to estimate dtf broad-sense heritability , along with its standard error, on a plot basis as:
where (phenotypic variance), = genotypic variance, and = error variance.
Descriptive statistics and Pearson’s correlation coefficients among dtf BLUPs of the three trials were calculated using the R package “agricolae” (de Mendiburu, 2017); results were then visualized using “ggplot2” package (Wickham, 2009). BLUPs datasets were then used to perform GWAS.
DNA Extraction
Genomic DNA was isolated from young leaf tissues, collected from 15 days-old single seedlings, using the TissueLyser II (Qiagen) and the DNeasy 96 plant kit (Qiagen) according to the procedure provided by the manufacturer. DNA concentration and quality were estimated using UV-Vis spectrophotometry (NanoDrop 2000TM, Thermo Fisher Scientific). DNA integrity was evaluated after 1% agarose gels (Euro Clone) stained with ethidium bromide electrophoresis. DNA samples were then diluted to 30 ng/μl for following genotyping.
Genotyping
A double digest Restriction-site Associated DNA sequencing (ddRAD-seq) approach was used for genotyping. The library preparation and the sequencing were carried out by IGAtech (Udine, Italy). Before starting the procedure, a further check of the DNA concertation was produced using a fluorimetric assay to further normalize and uniform the samples. The libraries were produced using a custom protocol (IGAtech), with minor modifications in respect to the one implemented by Peterson and colleagues (Peterson et al., 2012). In silico analysis was initially performed to select the best combination of restriction enzymes using the common bean reference genome v1.0 (Schmutz et al., 2014). Since the analysis indicated SphI and MboI as the best restriction enzymes combination to maximize the number of sequenced loci, they were used for DNA digestion. Digested DNA was purified with AMPureXP beads (Agencourt) and ligated to barcode adapters. Samples were than pooled on multiplexing batches and bead purified. For each pool, target fragment distribution was collected on BluePippin instrument (Sage Instruments Inc., Freedom, CA, United States). Gel eluted fraction was amplified with oligo primers that introduce TruSeq indexes and subsequently bead purified. The resulting libraries were than checked with both Qubit 2.0 Fluorimeter (Invitrogen, Carlsbad, CA, United States) and Bioanalyzer DNA assay (Agilent Technologies, Santa Clara, CA, United States). Libraries were processed with Illumina cBot for cluster generation on the flow cell, following the manufacturer’s instruction and sequenced with V4 chemistry pair end 125 bp mode on HiSeq2500 instrument (Illumina, San Diego, CA, United States).
Demultiplexing of raw Illumina sequences was performed using Stacks v 2.0 (Catchen et al., 2013) and subsequent alignment to the common bean reference genome v 1.0 (Schmutz et al., 2014) using BWA-MEM (Li and Durbin, 2009) with default parameters. Stacks v2.0 was also used to detect all the covered SNP loci from the aligned reads and to filter the detected loci using the population program (included in Stacks v2.0). In this last step, only loci that are represented in at least 75% of the population were retained.
SNP Quality Control
Several quality control steps were performed on the SNP dataset using PLINK v1.09 (Purcell et al., 2007) and TASSEL v 5.2 software (Bradbury et al., 2007). In particular: (i) SNP loci characterized by values of missingness higher than 10%, (ii) individuals with more than 10% missing loci, and (iii) markers with a Minor Allele Frequency (MAF) lower than 5% were filtered. Loci characterized by heterozygosity ≥2% were also discarded.
Detection of Population Structure and Cryptic Relatedness
The analyses of structure and cryptic relatedness of genotypes in the panel were carried using a reduced dataset where loci in strong Linkage Disequilibrium (LD) (r2 ≥ 0.3) were removed. In order to detect the population stratification of the developed panel, a Bayesian clustering approach was used. The number of clusters was initially tested in STRUCTURE v.2.3.4 (Pritchard et al., 2000) assuming an admixture model for different number of clusters (K), ranging from 1 to 11. For each tested cluster 10 iterations were carried out resulting from a 30,000 burn-in period and a Markov Chain Monte Carlo (MCMC) of 30,000 iterations after burn-in. The effective number of clusters was than inferred using the Evanno test (Evanno et al., 2005) implemented in the on-line tool STRUCTURE HARVESTER (Earl and vonHoldt, 2012). According to the result, a new single run was performed at the designed K using 100,000 burn-in period and 200,000 MCMC. The resulting population Q-matrix was used to (i) generate the corresponding Q-plot using the software DiStruct (Rosenberg, 2003) and (ii) to correct the association analyses for the putative population structure. Moreover, a kinship matrix was generated using PLINK v. 1.19 and visualized as heatmap and dendrogram using the R package “ggplot2” (Wickham, 2009).
Genome-Wide Association Analysis
Marker-trait association analyses were performed using a Mixed Linear Model (MLM) implemented in TASSEL v 5.2 that includes corrections for both population structure (Q) and kinship (K). In fact, the use of such model was necessary as P. vulgaris is characterized by a strong genetic structure (Kwak and Gepts, 2009; Raggi et al., 2013). The three BLUP datasets were used as phenotype input matrix in a single association analysis.
The resulting p-values were then plotted, as –log10(p) to produce a Manhattan plot using the R package “CMplots” (Yin, 2016). The correction for multiple-testing was carried out using the Bonferroni adjustment based on the estimated number of independent recombination blocks calculated using PLINK according to Gabriel et al. (2002). For the SNP markers that remained significant after the application of Bonferroni correction, possible candidate genes were identified based on proximity (maximum ± 100 kb) (Patishtan et al., 2018) and by browsing the P. vulgaris genome using the online tool Jbrowse on Phytozome v. 12.1 (Goodstein et al., 2012). In order to take advantage of the latest version of the common bean reference genome, sequences containing the significant SNP were positioned against the P. vulgaris reference version 2.1. Nucleotide sequences of putative candidate genes were translated into the corresponding proteins and used as queries against the Arabidopsis thaliana protein database (Araport11 protein sequences) using the online tool BLASTP (AA query, AA db) available at: https://www.arabidopsis.org/Blast/.
Linkage Disequilibrium
A raw estimation of LD decay was obtained dividing the size of common bean genome (bp) by the number of independent recombination blocks within the panel, calculated according to Gabriel et al. (2002). In order to ascertain whether significant SNPs, and their relative candidate genes, were located on the same recombination blocks, further LD analyses were carried out. In particular, LD patterns were studied within a window of ±1.5 Mb (centered on the significant marker). Such analysis was only performed for those SNPs located outside the identified candidate genes. Markers within the windows surrounding the associated SNPs were generated using PLINK v. 1.09 by sub-setting the whole SNP dataset obtained after QC and then paired with their corresponding p-values. Pairwise LD between markers within the windows (r2) were calculated using HaploView 4.2 (Barrett et al., 2005); the same software was also used to produce graphical representations of the results.
Results
Phenotyping
A total of 648 (97.3%) common bean samples were successfully characterized for dtf during the three experiments. In BO-2017, the spatial analysis was more efficient than the completely randomized design with a superior efficiency of the spatial model CrdL (Completely randomized design with linear trends along rows) of 22.4% over the Completely randomized design (Crd); the Crd was the best model for BLUPs calculation from data collected in PG-2016 and 2017. Summary statistics of BLUPs are reported in Table 1. As expected, dtf showed high broad sense heritability (He2B) in all trials (Table 1). Distribution analysis showed consistent data dispersion and the existence of a number of late flowering genotypes (Figure 2A); on the other hand, no differences were observed when data were analyzed separately according to the genepool (Supplementary Figure 1). Simple linear regressions of dtf in pairwise comparisons between years (Figure 2B) and experimental sites (Figure 2C) revealed significant and high correlation in both cases with an R2 values equal to 0.90 (P < 0.001) and 0.93 (P < 0.001), respectively. The full BLUPs dataset is available in Supplementary Table 2.
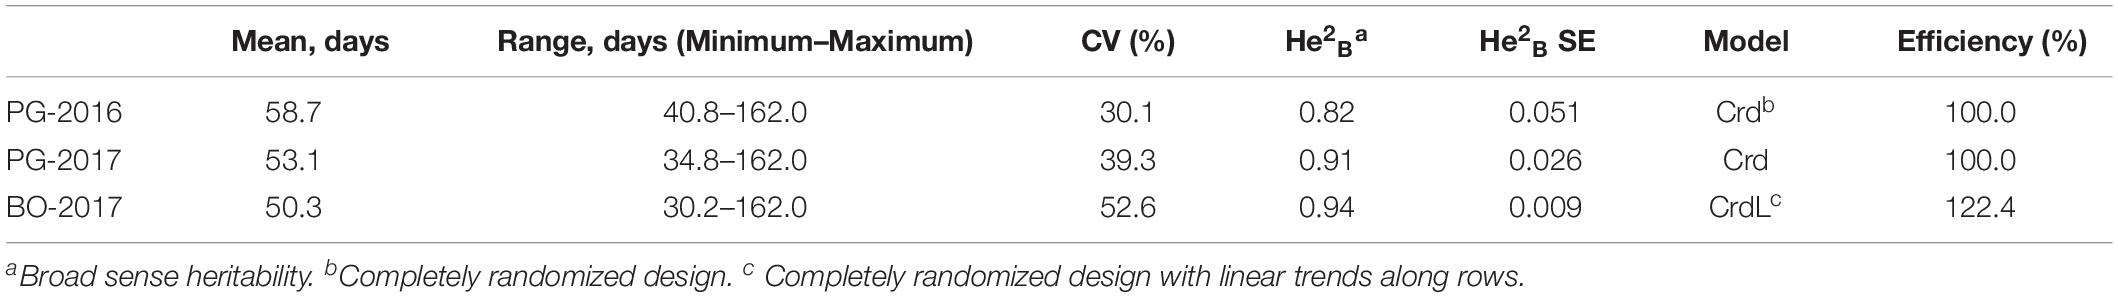
Table 1. Summary statistics, broad sense heritability, and spatial models used for the estimation of days to flowering BLUPs of 192 common bean genotypes.
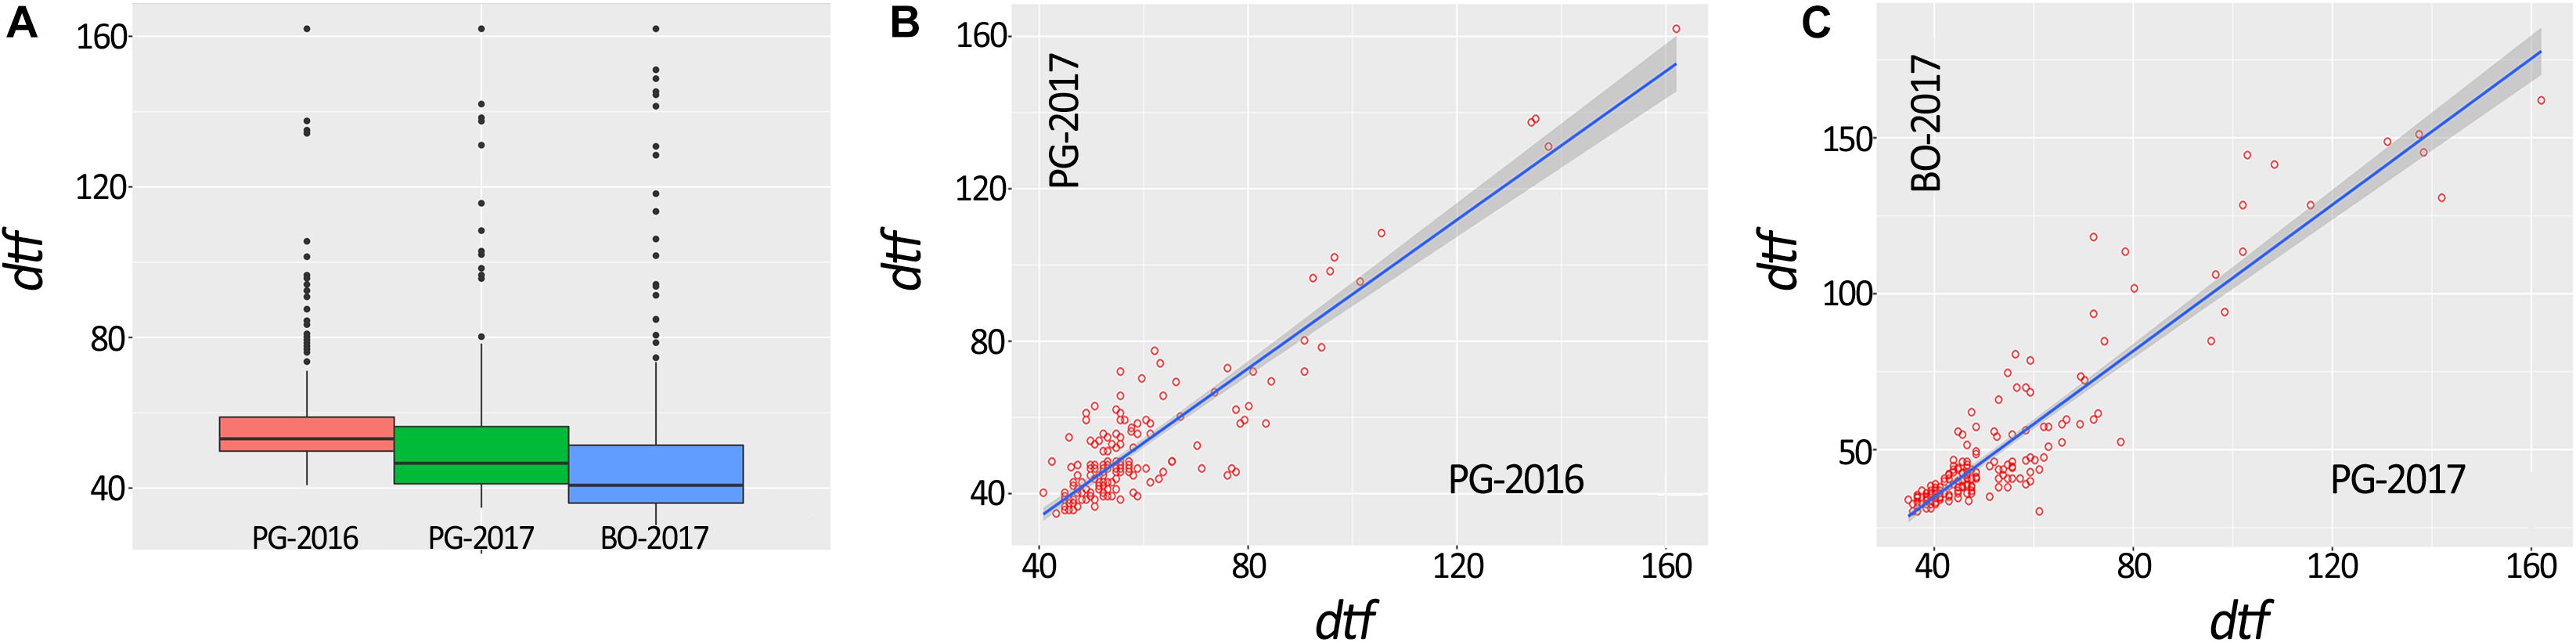
Figure 2. Box plot representation of days to flowering (dtf) BLUPs of 192 common bean genotypes (A). Correlation between dtf recorded in the same location and different years (i.e., PG-2016 vs. PG-2017) (B) and in the same year and different location (i.e., PG-2017 vs. BO-2017) (C).
Genotyping
The ddRAD-seq genotyping generated a dataset of 106,072 polymorphic loci, of those 99.3% (105,319) were mapped on the reference genome v.1.0 (Pvulgaris_218_v1.0.fasta) (Schmutz et al., 2014). The full genotyping dataset is available at: https://www.ebi.ac.uk/ena/data/view/PRJEB33063.
After quality control, no genotype was excluded and a dataset of 49,518 SNPs markers evenly distributed over the 11 common bean chromosomes was retained for association analyses. A graphical representation of SNPs’ distribution over the eleven bean chromosomes is reported in Figure 3.
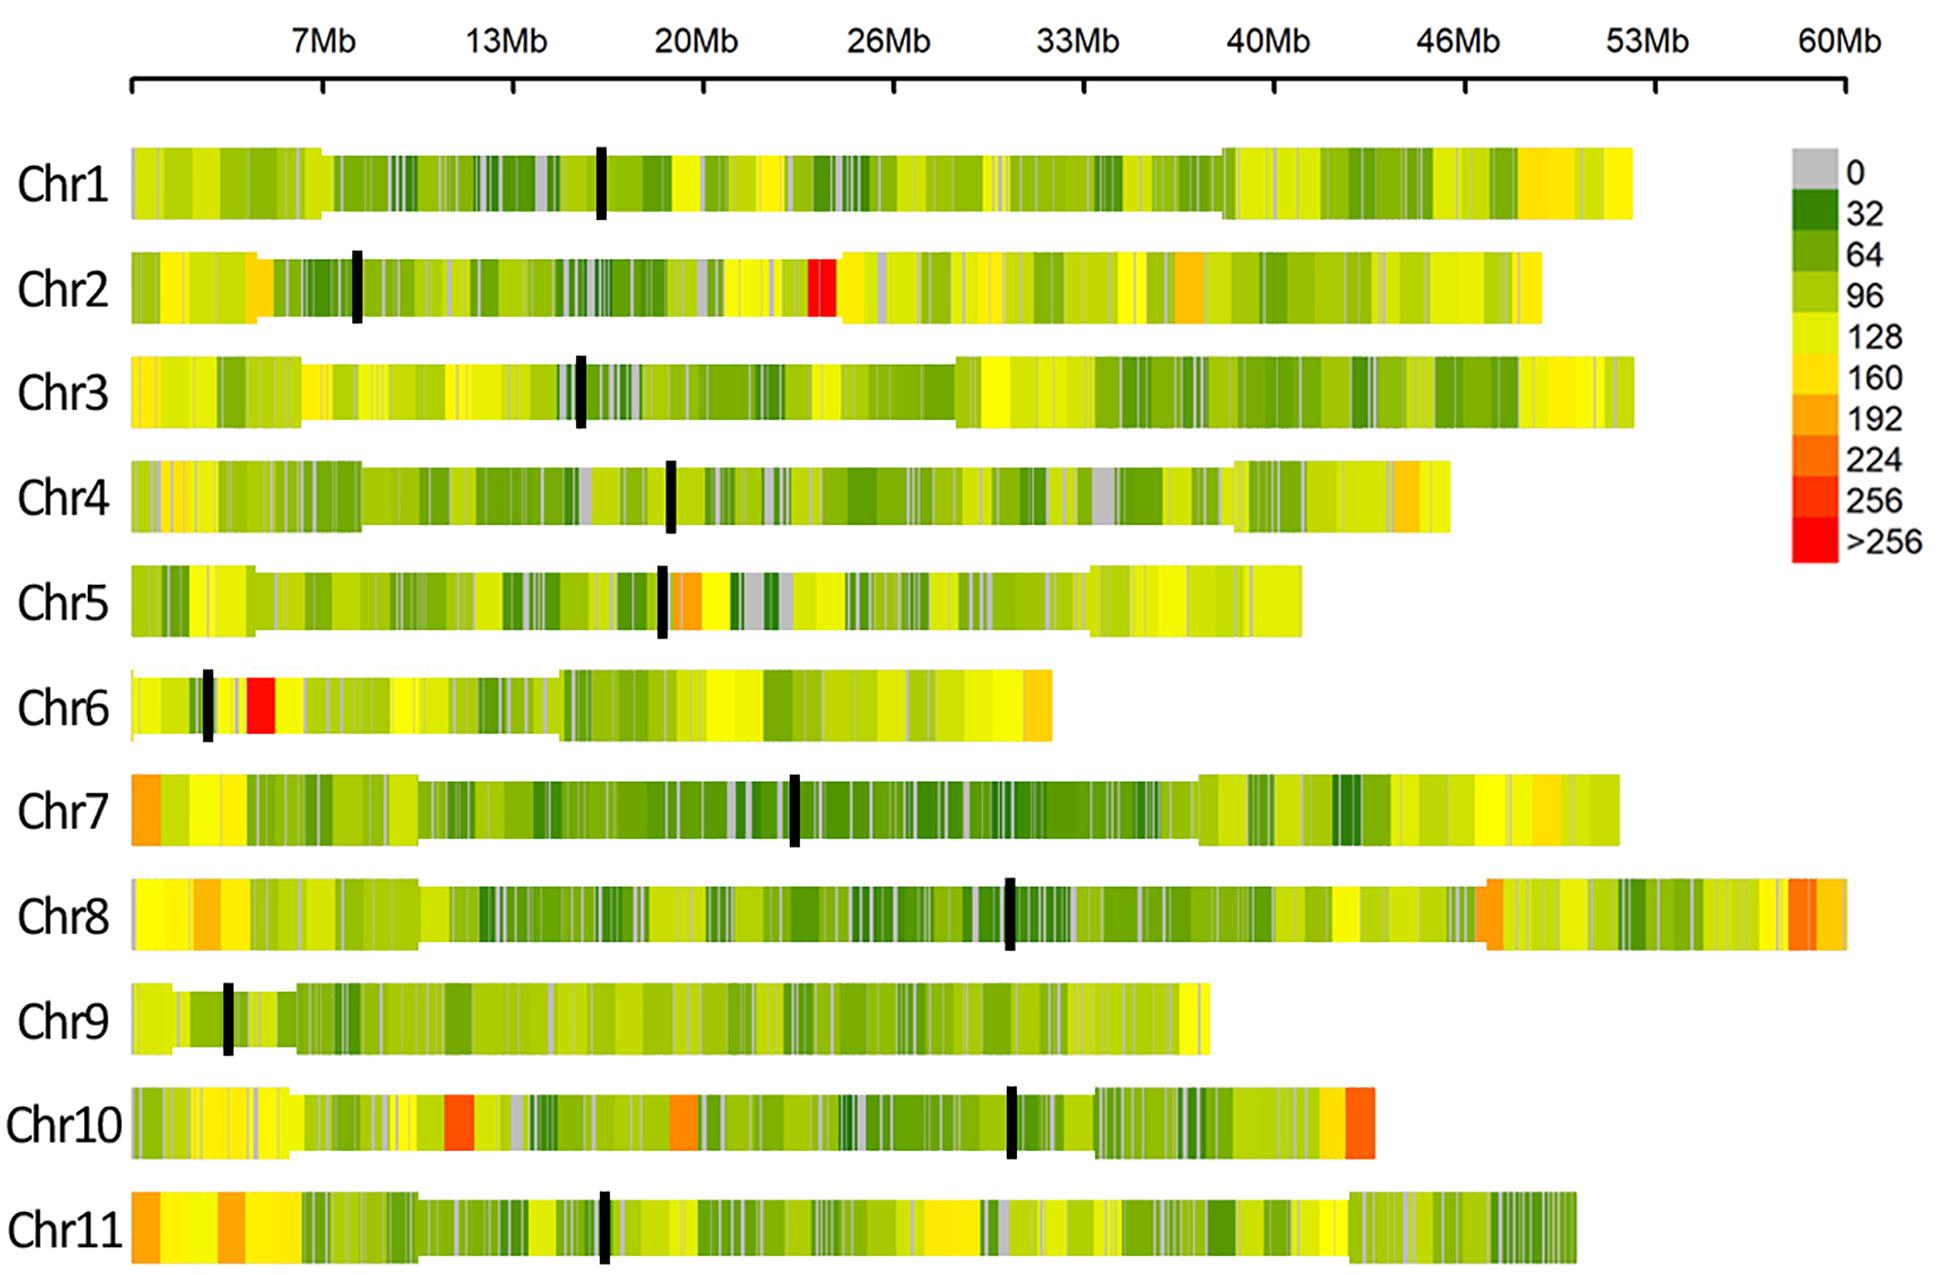
Figure 3. SNP density within 1 Mb window size, different colors represent different density levels. In the Figure “Chr” refers to common bean chromosomes, where centromeric (black line) and pericentromeric regions (thinner bar sections) are reported according to Schmutz et al. (2014).
Genetic Structure and Cryptic Relatedness
After removing SNP markers in strong LD (r2 ≥ 0.3) a dataset of 2,518 SNP was generated and used to perform STRUCTURE and cryptic relatedness analyses (Supplementary Figure 2). Results of the Evanno test clearly indicated K = 2 as the most suitable level of population subdivision to explain the genetic structure of the studied panel. STRUCTURE group attributions were strongly consistent with the two common bean genepools (i.e., Mesoamerican and Andean). A graphic representation of the genetic structure of the panel is reported in Figure 4. Considering a threshold of q ≥ 0.8 (Bitocchi et al., 2012; Klaedtke et al., 2017), 11 out of 192 genotypes resulted product of admixture between the two genetic groups. All the eleven admixed genotypes derived from European accessions (153) indicating a level of hybridization, between Andean and Mesoamerican genepools, equal to 7.2% (11 out of 153). The admixed entries derived from 9 landrace accessions (Pv_072, Pv_073, Pv_077, Pv_086, Pv_092, Pv_128, Pv_131, Pv_134, and Pv_190) and 2 cultivars (Pv_059 and Pv_064).
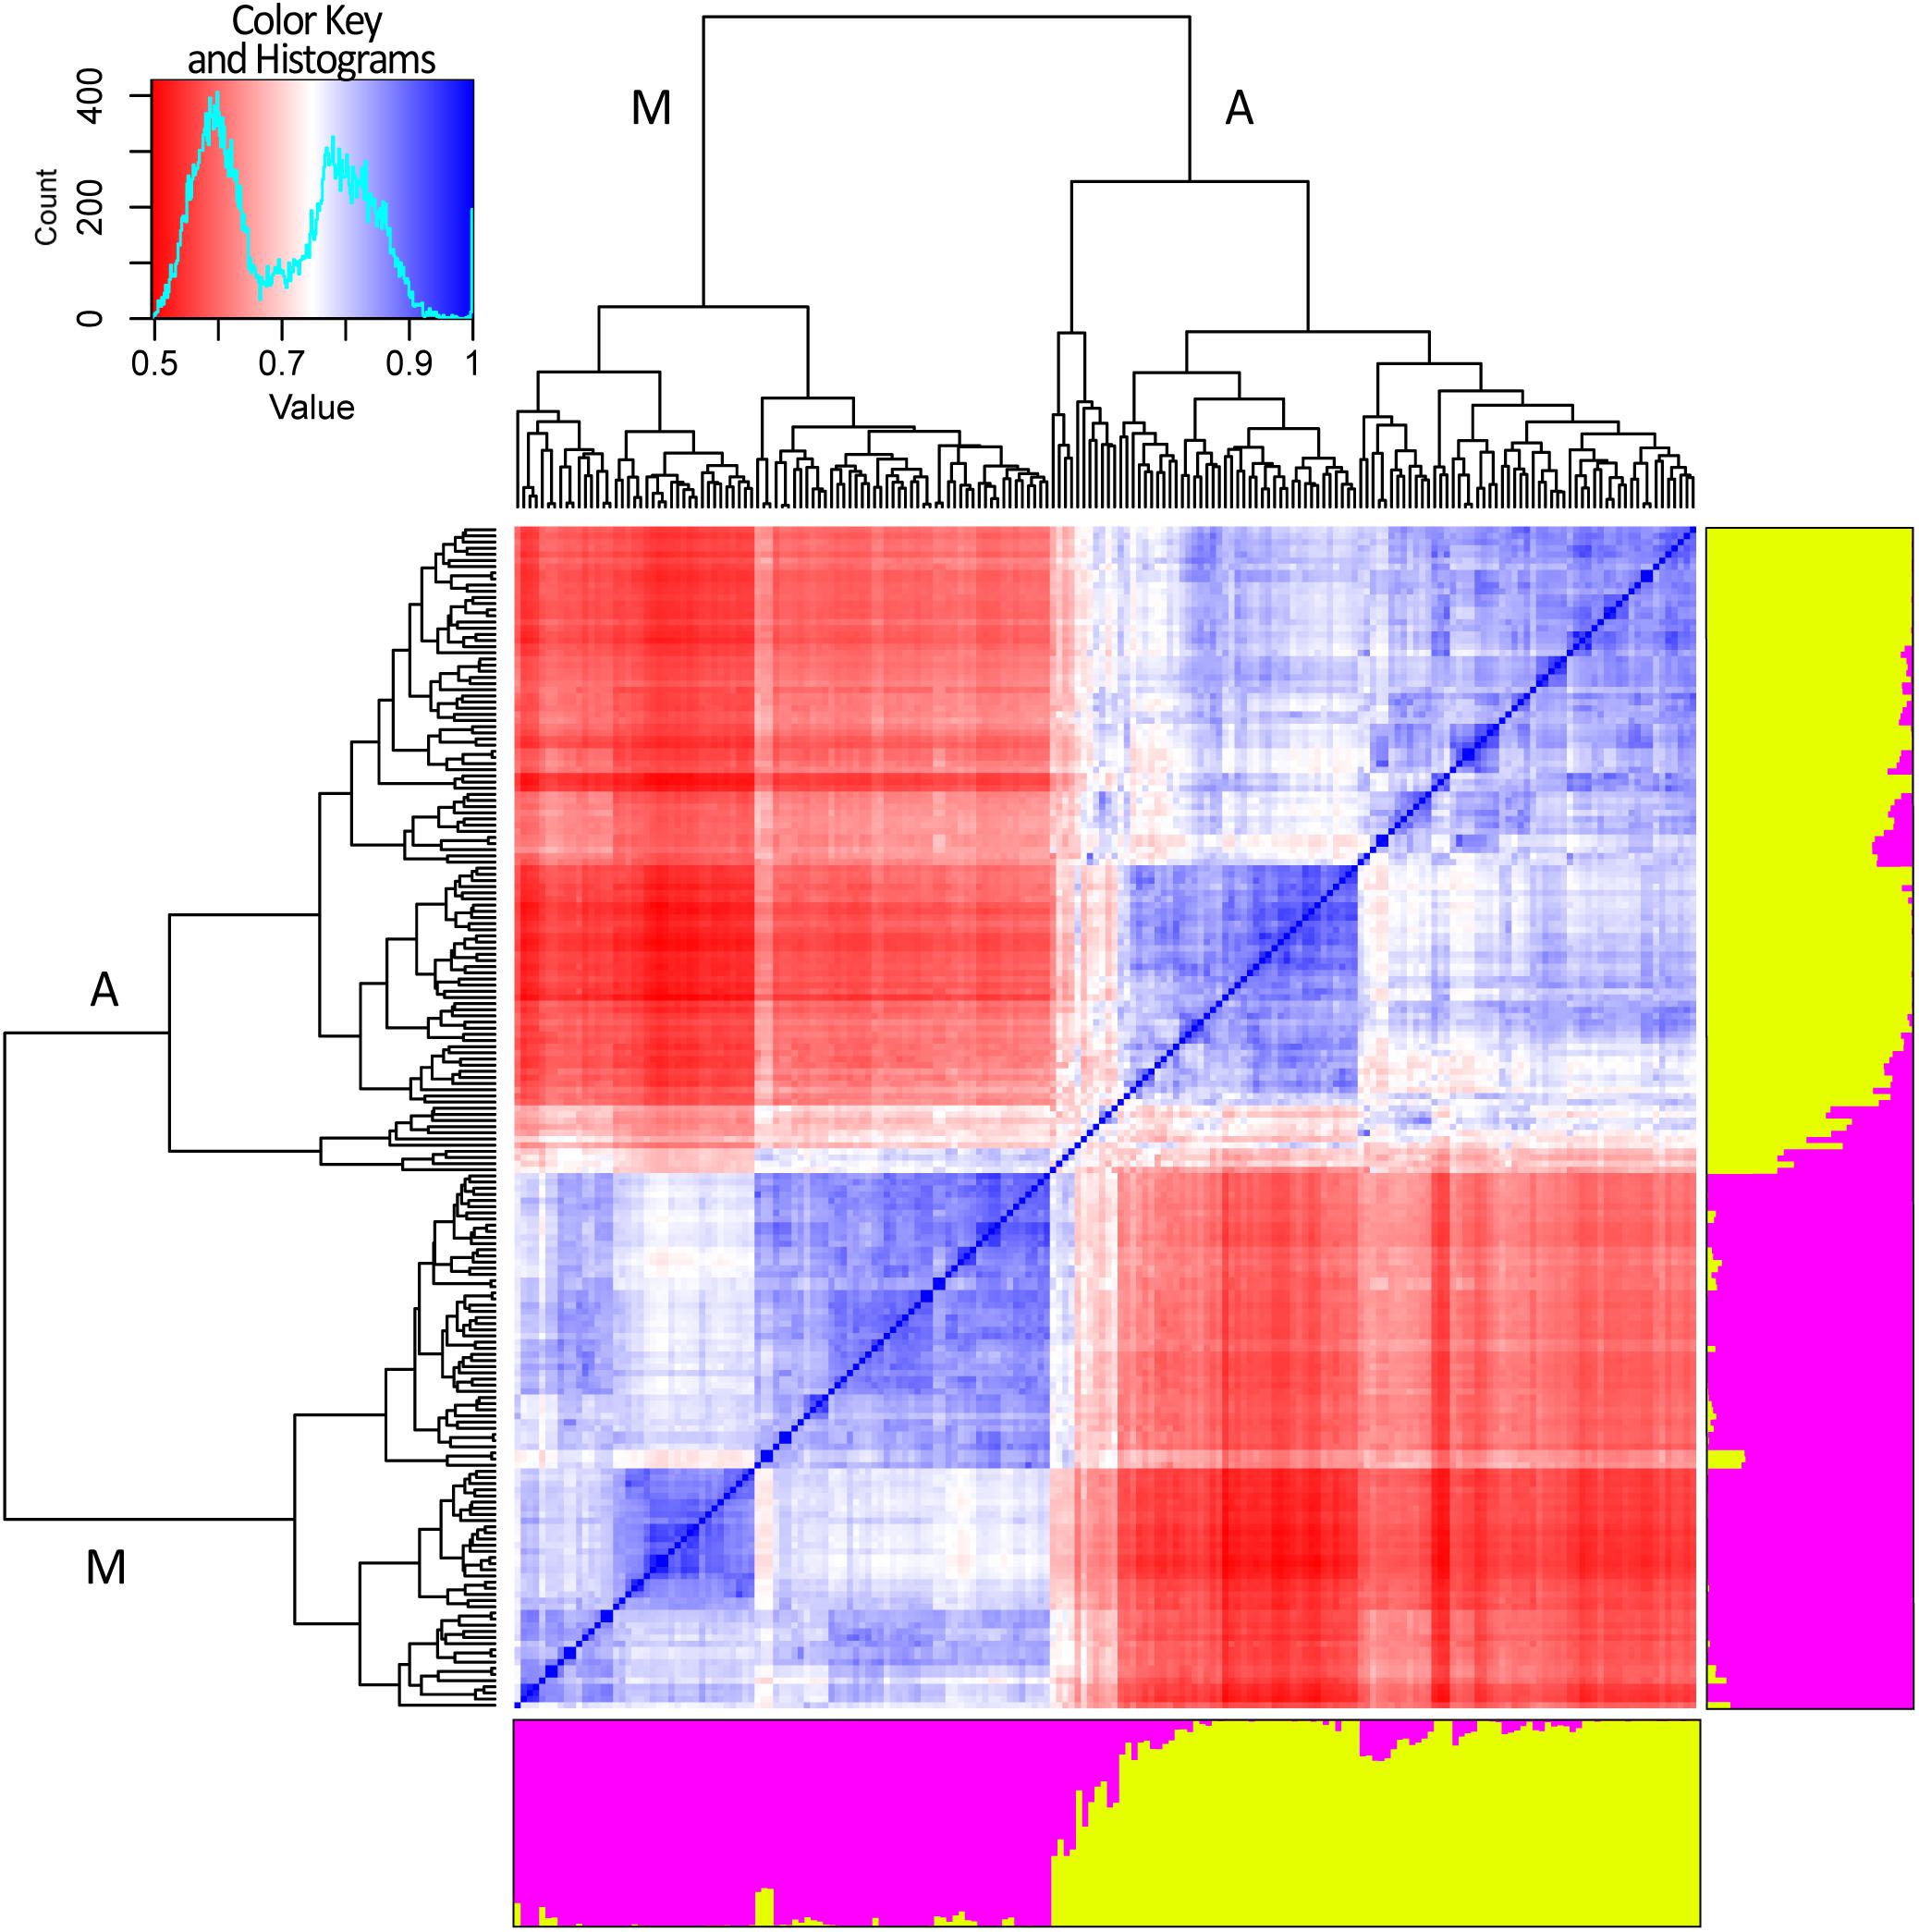
Figure 4. Genetic structure and relatedness among 192 genotypes of common bean. Genetic structure (right and bottom side). Each genotype is represented by a column divided into two colored segments (yellow and magenta) whose length indicates the proportions of the genome attributed to each of the two main clusters. Cryptic relatedness (center). Heatmap of pairwise similarities between all the genotypes: red, white, and blue for low, medium, and high similarities, respectively. Hierarchical clustering of the panel. The two main groups are indicated with “A” and “M” letters standing for Andean and Mesoamerican, respectively (top and left side).
Results of cryptic relatedness are also graphically presented in Figure 4. According to genotype origins, inferred using the available information about phaseolins, the blueish square, bottom-left part of the heatmap, includes most of the genotypes of Mesoamerican origin (72). The plot also indicates a further possible sub-structure of the Mesoamerican genotypes into 3 subgroups, the largest of which includes about 50% of all the Mesoamerican samples (Figure 4). On the other hand, the bluish square, top-right part of the heatmap, groups the Andean genotypes (94) with very few exceptions. In this case too, a further subdivision of the group is evident but only one sub-group is clearly distinct (Figure 4). The 11 admixed genotypes are grouped right in the middle of the heatmap; they are characterized by average relatedness values in regard to all other genotypes (light blue, light red, or white color).
Genome-Wide Association Analysis
Across all the trials, high and consistent He values were observed for dtf confirming the suitability of the trait to perform GWAS. The Bonferroni correction for multiple testing, calculated considering the number of independent recombination blocks (2,443), resulted in a threshold equal to 5.4 (–log10(p)). GWAS results showed that multiple regions are associated with dtf in the common bean genome (Table 2). The lowest p-value (i.e., the strongest association) was obtained for SNP 123164_60 on chromosome Pv08. Significant associations were also found for SNPs 66929_307, 17455_7, 95297_22, 59746_63, 59746_36, 116028_71, and 17777_7. In total, 8 significant SNPs for dtf were identified in 4 different common bean chromosomes: Pv01, Pv04, Pv06, and Pv08 (Table 2). The Manhattan plot of GWAS results, based on the 49,518 SNP markers, is reported in Figure 5.
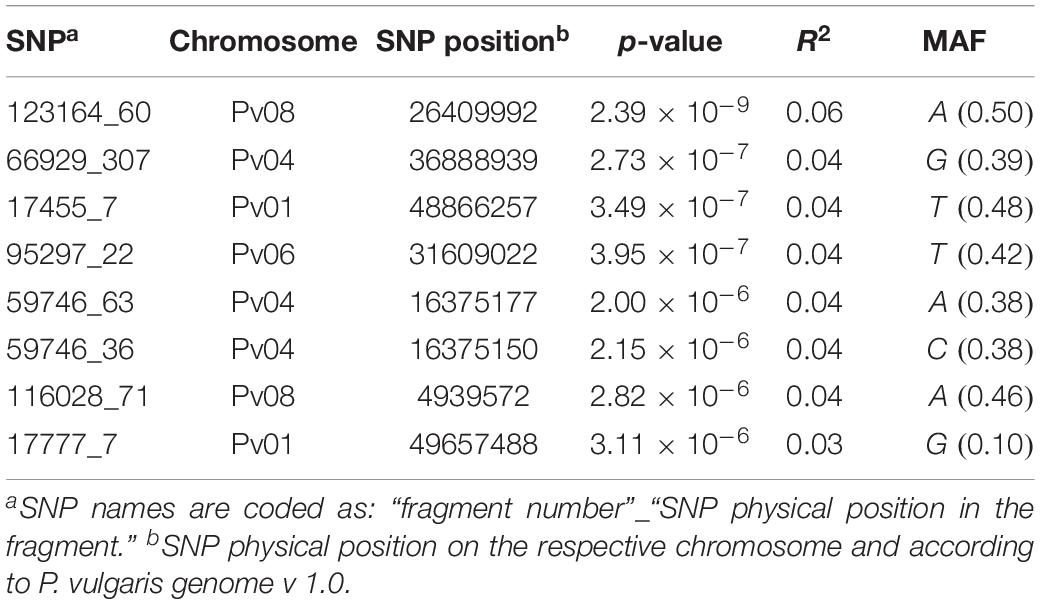
Table 2. List of the significant SNPs identified in the study including physical position, association level, phenotypic variation explained by the SNP and MAF.
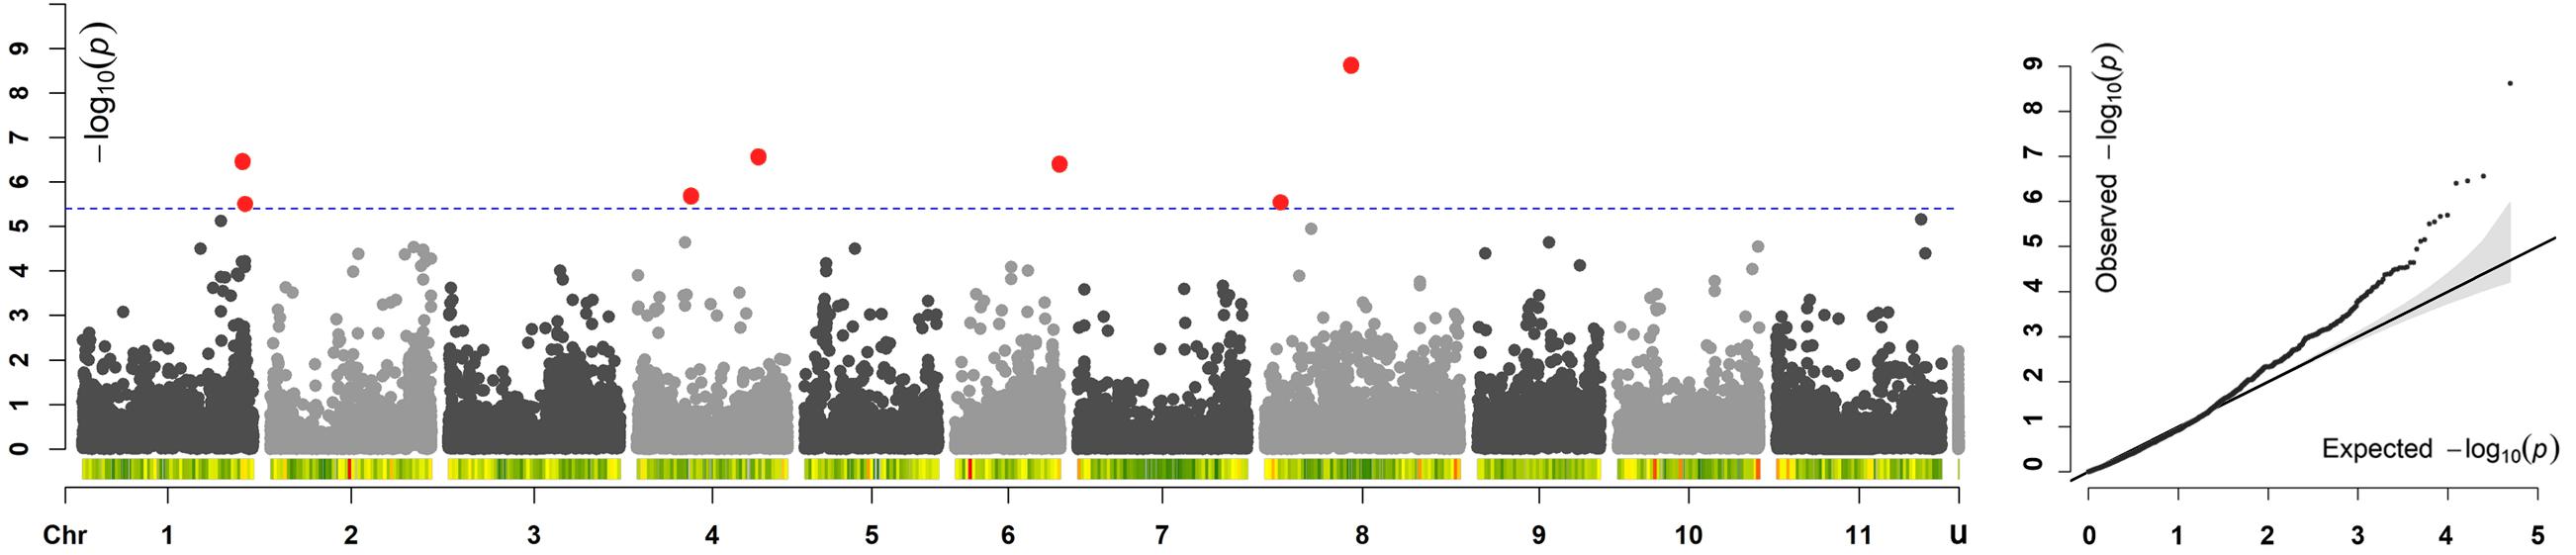
Figure 5. Manhattan and quantile–quantile (Q–Q) plots of dtf; In the Manhattan plot, SNPs are ordered by physical position and grouped by chromosome; unmapped SNPs are grouped in “u.” Under each chromosome information on SNP density within 1 Mb window size is also given. The blue dashed line indicates the genome-wide significance threshold. SNPs associated after Bonferroni correction are highlighted in red.
Candidate Gene Identification
The search of possible candidate genes for the most meaningful identified SNP, carried out using Phytozome (v. 12.2) and TAIR, resulted on the identification of 7 possible candidates.
When aligned to the P. vulgaris reference genome, the sequenced fragment containing SNP 123164_60 produced multiple hits making the discovery of an associated candidate gene rather complex. However, our analysis detected a relevant gene, Phvul.008G149900, located 100 kb upstream of a highly significant hit. Even if no functional annotation was found on the common bean reference genome for this gene, it is noteworthy that its encoded protein is highly similar to Arabidopsis At3G12810. This protein, similar to ATP dependent chromatin-remodeling proteins of the ISWI family, is encoded by Photoperiod-Independent Early flowering 1 (PIE1) that is involved in multiple flowering pathways.
Located only 50 kb downstream of the SNP 66929_307, on Pv04, Phvul.004G112100 is our best candidate to explain the phenotypic variation associated with this marker. The gene encodes for a NAD(P)-binding Rossmann-fold superfamily protein, carrying out oxidoreductase activity in the chloroplast.
The search of the best candidate gene for marker SNP 17455_7 resulted in the identification of Phvul.001G227200. In this case, the SNP is located in the first intron of the gene. Phvul.001G227200 is homologous of the A. thaliana At1G56260, also known as Meristem Disorganization 1 (MD1) that is required for the maintenance of stem cells through a reduction in DNA damage (TAIR, 2019b). Phvul.001G236000 is the best candidate to explain the phenotypic variation associated with the second peak observed in the same region on Pv01 (i.e., SNP 17777_7) as displayed in Figure 6A. The gene, located only 10 kb upstream of the SNP, encodes for a protein phosphatase 2C 3-Receptor, involved in abscisic acid signal transduction.
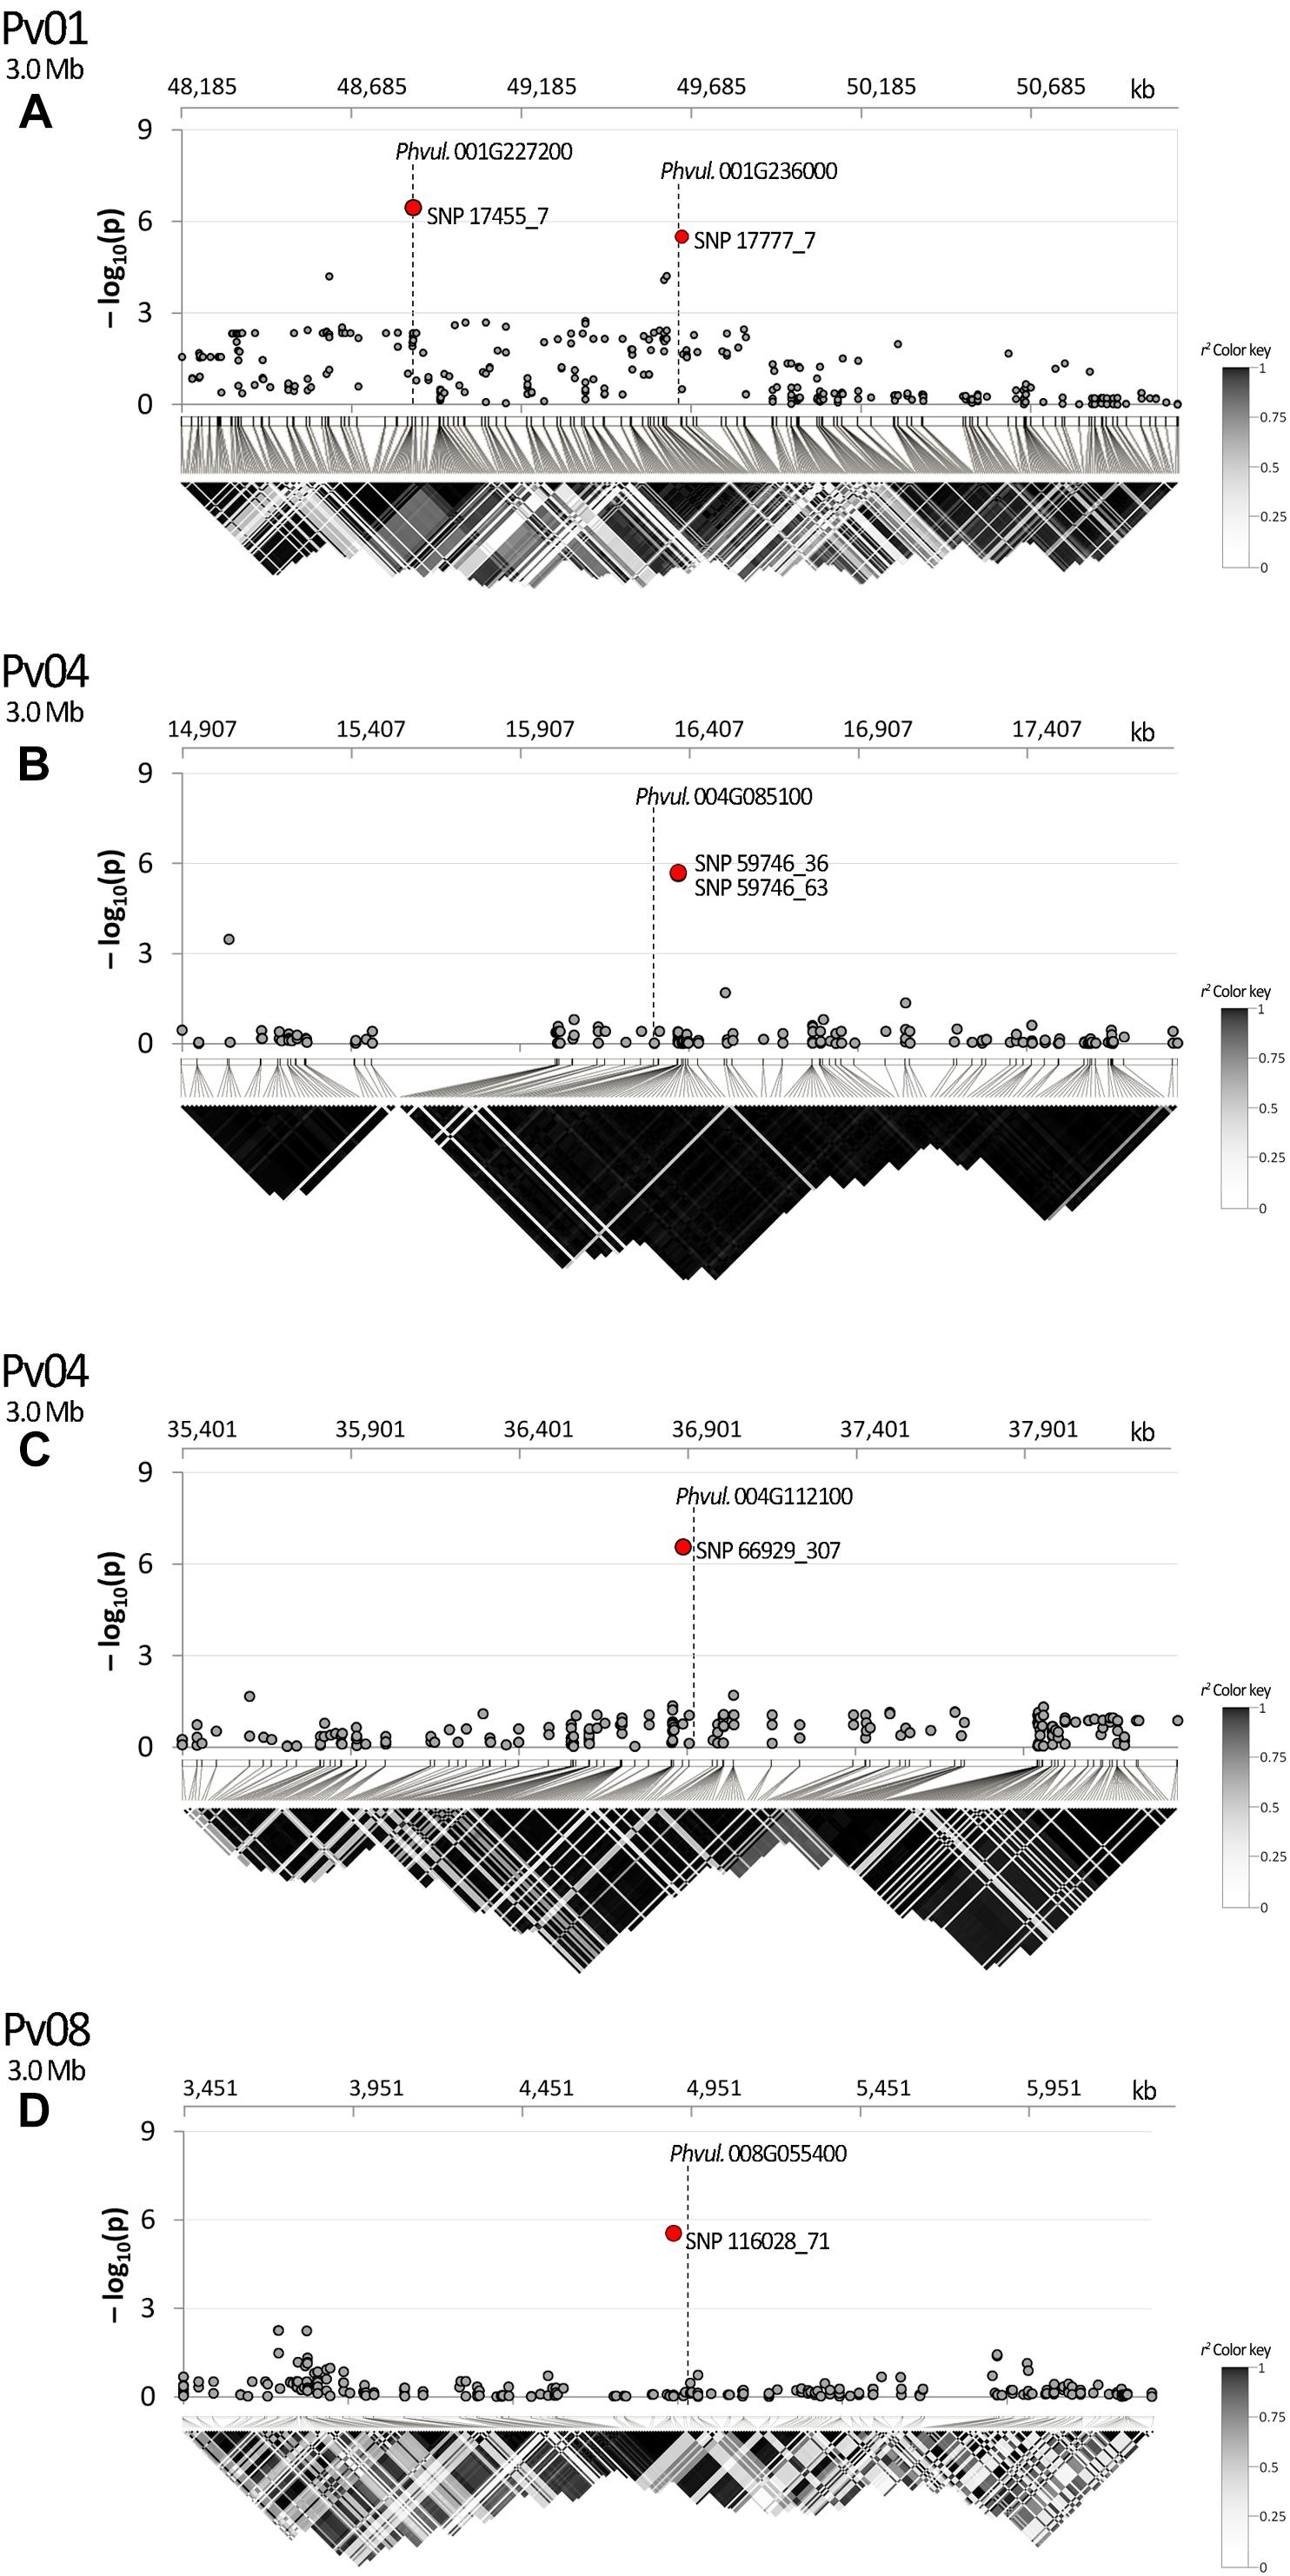
Figure 6. Manhattan plot of dtf and LD heatmap over a chromosome region of ±1.5 Mb surrounding SNPs: (A) 17777_7; (B) 59746_36, 59746_63; (C) 666929_307; (D) 116028_71. SNPs associated after Bonferroni correction are highlighted in red; candidate genes are placed according to their physical position. In the LD heatmap colors are coded according to the r2 color key.
Phvul.006G215800 resulted as the best candidate to explain the effect of the SNP 95297_22 detected on Pv06. The gene encodes for Potassium Channel AKT2/3.
The two significant SNPs detected on Pv04 (SNP 59746_36 and 59746_63) co-localize on the same chromosome region being separated by 27 bp only. Located 40 kb upstream of the signal, Phvul.004G085100 is the best candidate gene explaining the effect of the markers. The homolog gene in Arabidopsis encodes for a sucrose transporter protein: AtSUC2.
Finally, we identified Phvul.008G055400 as the most meaningful candidate gene associated to the SNP 116028_71. The gene encodes for a Leucine-Rich Repeat Receptor-Like Protein, also known as Clavata2 (CLV2).
Linkage Disequilibrium
In the studied panel, LD decays in an average distance of circa 240 kb. According to the results of LD analysis, SNP 17777_7 and the candidate Phvul.001G236000 are in the same recombination block showing the association between the marker and the identified gene (Figure 6A). In the same figure section SNP 17455_7 is also displayed due to its position near to SNP 17777_7. In this case LD analysis was not necessary as the marker is physically located in the first intron of the corresponding candidate (Phvul.001G227200); it is noteworthy that several recombination events occurred between the two markers. A clear association was also observed for SNPs 59746_36 and 59746_63 with Phvul.004G085100 (Figure 6B) and for SNP 66929_307 with Phvul.004G112100 (Figure 6C). A fairly high average r2 value was observed between Phvul.008G055400 recombination block and the SNP 116028_71 (Figure 6D).
Discussion
The SSD strategy used in this study allowed to produce a panel of highly homozygous common bean genotypes starting from 179 different landraces each of which putatively characterized by relatively high levels of diversity (Tiranti and Negri, 2007; Negri and Tiranti, 2010). Indeed, molecular data demonstrated that the genotypes in our panel are genetically uniform with a very low level of heterozygosity. At the same time, the panel retained a high level of among-genotypes diversity due to the different origin of the initially selected landraces (Figure 4). This approach allowed to build a panel of common bean pure lines that can be indefinitely used for association analyses on a plethora of traits of interest for both basic biology studies as well as for plant breeding. Sample seeds of each developed pure lines are currently conserved, using long-term storage conditions, in the genebank held by DSA3 (FAO code: ITA-363).
Results of the phenotypic characterization for dtf showed a rather high level of diversity within the panel (Rodiño et al., 2003; Raggi et al., 2014; Rana et al., 2015). Results of the partially replicated experimental design indicated high levels of dtf He that is a crucial parameter to find meaningful and promising associations. Indeed, such design has been already used on barley for association analysis on yield performance (Al-Abdallat et al., 2017). In our study, the use of such experimental design also allowed to test, and to possibly correct, the existence of any bias related to the sample position within the experimental plots such as soil fertility and light exposure. As expected, Crd was the best model for BLUP calculation in two out of three cases since biases were not detected. It is also noteworthy that this particular experimental design allowed to maximize the number of phenotypic datapoints and, at the same time, reducing costs and space needed to characterize such a collection of germplasm.
Among different methods that can be used to generate SNP datasets, the selection of ddRAD-seq approach resulted in a very high number of SNPs evenly distributed over the eleven common bean chromosomes (Figure 3). Regarding the ddRAD-seq used protocol, the in silico digestion of the common bean reference genome allowed to select the best enzyme combination maximizing the number of sequenced loci. It is noteworthy that in our study, ddRAD-seq overcame available common bean SNP chips in terms of number of markers successfully genotyped (Cichy et al., 2015; Kamfwa et al., 2015a, b; Moghaddam et al., 2016). In addition, we believe that the technique used for genotyping can help in reducing the ascertainment bias deriving from the use of chip arrays for genotyping of non-elite material.
GWAS is a powerful tool to dissect the genetic control of quantitative traits, potentially providing a higher resolution than QTL mapping. Therefore, in recent years, the interest on this approach arose in both academic and commercial sectors (Davey et al., 2011). In our study, association analysis allowed to detect eight significant SNPs associated with dtf on four common bean chromosomes: Pv01, Pv04, Pv06, and Pv08. The analysis of the genomic regions surrounding the detected SNPs allowed the identification of seven meaningful candidate genes that could have an important role in controlling the studied trait. In previous studies, QTL for dtf on common bean chromosome Pv01 has been widely reported (Blair et al., 2006; Perez-Vega et al., 2010; Mukeshimana et al., 2014). Moreover, recent research based on GWAS further confirmed the presence of genomic regions involved in the control of this trait on the same chromosome (Kamfwa et al., 2015b; Moghaddam et al., 2016). Similarly, QTL on Pv08 was already reported (Koinange et al., 1996; Perez-Vega et al., 2010) and also confirmed in the above-mentioned studies based on GWAS. According to the mentioned bibliographic records and data produced in our study, the associations on Pv01 and Pv08 are likely to be stable across different environments and genetic background (Kamfwa et al., 2015b). In addition, we observed significant associations on chromosomes Pv04 that were reported by a QTL mapping (Mukeshimana et al., 2014) and GWAS (Moghaddam et al., 2016) study. Finally, Blair et al. (2006) indicated the presence of a QTL for dtf on common bean chromosome Pv06 that was also detected in our study.
The first candidate gene identified in this study, Phvul.008G149900, encodes for a protein that is highly similar to PIE1. It is noteworthy that mutations of PIE1 in A. thaliana resulted in the suppression of Flowering Locus C-mediated delay of flowering and causes early flowering even during non-inductive photoperiods (Noh and Amasino, 2003).
Phvul.004G112100 resulted the best candidate to explain the phenotypic variation associated with SNP 66929_307. In A. thaliana mutants for the homologous gene (At4G23430) showed an early-flowering phenotype (TAIR, 2019d) suggesting a role for Phvul.004G112100 in common bean flowering time control. Mapping homologous Arabidopsis sequences for photoperiod sensitivity in common bean, Kwak et al. (2008) located one of the homolog of Terminal Flower1 (PvTFLx) on chromosome Pv04. In particular, PvTFLx is located 2 Mb downstream our best candidate suggesting that this region harbors different genes involved in flowering time control.
Phvul.001G227200, homolog of MD1 in Arabidopsis, was the resulting candidate to explain the significance of the SNP 17455_7. Interestingly, in A. thaliana mutants of this gene showed several development defects such as abnormal phyllotaxy and plastochron, stem fasciation and reduced root growth (Hashimura and Ueguchi, 2011). In the same study the authors reported that in mutants “leaves and floral buds did not develop in a spatially and temporally regulated manner” opening for a possible role of the gene in flowering control. It is also noteworthy that, in maize, shoot apical meristem development has been associated with flowering time (Leiboff et al., 2015). Further analyses, within the same chromosomic region of the previous candidate, revealed that Phvul.001G236000 is the best candidate to explain the phenotypic variation of the marker 17777_7. In A. thaliana mutants of the homologous At4G26080 showed a late flowering phenotype. It is noteworthy that this narrow chromosomic region (circa 1.3 Mb) contains the two candidate genes detected in this study on Pv01 together with Phvul.001G221100 that encodes for Phytocrome A (Kamfwa et al., 2015b). Finally, this chromosomic region overlaps with a QTL for days to flowering identified by Blair et al. (2006) using a by-parental mapping approach: one of the two flanking markers of the QTL falls in the same above-mentioned chromosomic region. All these experimental evidences suggest the presence of a gene cluster involved in flowering time control in chromosome Pv01.
Phvul.006G215800, the best proposed candidate for the marker 9529_7 on chromosome Pv06, encodes for Potassium Channel AKT2/3, a photosynthate and light-dependent inward rectifying potassium channel with unique gating proprieties that are regulated by phosphorylation (TAIR, 2019e). It has been demonstrated that loss of function of AKT2/3 affects sugar loading into the phloem of A. thaliana and mutants show delayed flower induction and rosette development (Deeken et al., 2002). Such phenotype strongly corroborates our hypothesis of the involvement of Phvul.006G215800 in flowering.
Phvul.004G085100 on the chromosome Pv04 encodes for a sucrose transport protein. Interestingly, in A. thaliana, a mutation of the homolog (At1G22710) causes dwarfism, delayed development and it has been reported that such plants can occasionally flower, but never produce viable seeds (TAIR, 2019a). At1G22710, also known as AtSUC2, was one of the first genes associated with sucrose transporters (Sauer and Stolz, 1994); this gene is required for phloem loading of sucrose and its activity has been described in detail by Chandran et al. (2003). It is well known that sucrose is a relevant element within the flowering induction process (Corbesier et al., 1998); in plants, sucrose is the main form of fixed carbon that is transported in phloem and also serves as specific signaling molecule (Teng et al., 2005; Solfanelli et al., 2006). An increase in carbohydrate export from leaves has been generally associated with floral induction in Arabidopsis (Corbesier et al., 1998). Consistently, in Nicotiana tabacum L., a decreased phloem loading of sucrose, induced by antisense repression of the NtSUT1 causes delayed flowering (Burkle et al., 1998). Moreover, in A. thaliana sucrose availability on the aerial part of the plant promotes flowering even in dark conditions (Roldán et al., 1999). All these evidences strongly suggest a role of Phvul.004G085100 in controlling flowering time in P. vulgaris. In addition, it is also relevant to mention that Mukeshimana et al. (2014) found two QTLs for days to flowering on the mid-terminal part of Pv04 that might roughly correspond to the chromosome region in which Phvul.004G085100 is located. However, since in above-mentioned study SNP marker positions are expressed as cM, it is difficult to ascertain whether our candidate falls within these regions.
In conclusion, Phvul.008G055400, the candidate gene identified in relation the marker 116028_71 on the chromosome Pv08, encodes for CLV2. In A. thaliana a mutation of the homolog of this gene (At1G65380) causes altered flower development, late flowering or interrupted flowering caused by a temporary termination of the main inflorescence flower meristem (TAIR, 2019c). In a recent paper, Basu et al. (2019) identified four Clavata genes, including Clavata2, that are highly associated with days to flowering in Cicer arietinum L.
As from the discussed evidences and related bibliographic records, homolog of most of the genes that we propose as candidates for explaining observed flowering time variation in the studied common bean panel are involved in different pathways regulating flowering in Arabidopsis, tobacco, maize, and chickpea. Indeed, results of this research are an important step forward in understanding flowering time control in one of the most important pulses world-wide. Although this diversity panel is representative of a large portion of the European common bean diversity, performing similar analyses on a wider and/or more diverse panel would help in confirming the detected associations. In addition, the application of gene knockout to the proposed candidates would further confirm their involvement in the genetic control of flowering time and allow to measure their contribution to its expression under different experimental conditions (e.g., short vs. long day treatments). The exploitation of the genes identified in this research will hopefully allow the development of new common bean varieties able to better adapt to changing climatic conditions.
Data Availability
NCBI BioSample accessions of the 192 common bean lines from: SAMN12035168 to SAMN12035359. The full genotyping dataset of the same samples is available at: https://www.ebi.ac.uk/ena/data/view/PRJEB33063.
Author Contributions
VN and LR conceived and designed the experiments. LC and AC performed plant phenotyping. LR, LC, and AC performed phenotypic data analyses. LR and LC performed GWAS and candidate gene data analyses. AC and VN contributed to phenotyping costs. VN funded reagents, materials, and analysis tools. All authors wrote the manuscript.
Funding
This research was partially funded by “Novel characterization of crop wild relative and landrace resources as a basis for improved crop breeding” (PGR Secure) project, European Community’s Seventh Framework Program [GA n. 266394], “Strategies for Organic and Low input Integrated Breeding and Management” (SOLIBAM) project, European Community’s Seventh Framework Program [GA n. 245058], “Networking, partnerships and tools to enhance in situ conservation of European plant genetic resources” (Farmer’s Pride) project, European Community H2020 Framework Program [GA n.774271], and “Progetto per l’attuazione delle attività contenute nel programma triennale 2017–2019 per la conservazione, caratterizzazione, uso e valorizzazione delle risorse genetiche vegetali per l’alimentazione e l’agricoltura” (RGV-FAO project) [DM N.0011746].
Conflict of Interest Statement
The authors declare that the research was conducted in the absence of any commercial or financial relationships that could be construed as a potential conflict of interest.
Acknowledgments
This work is an integral part of LC Ph.D. thesis, carried out under the supervision of VN and LR. The authors wish to acknowledge Professor S. Ceccarelli for his contribution in carrying out spatial analyses, Dr. Thâmara Figueiredo Menezes Cavalcanti for her contribution to the phenotyping activities and all the field technicians of the DSA3-UNIPG (Sant’Andrea d’Agliano) and CREA-CI (Anzola) for managing the trials.
Supplementary Material
The Supplementary Material for this article can be found online at: https://www.frontiersin.org/articles/10.3389/fpls.2019.00962/full#supplementary-material
References
Akaike, H. (1974). A new look at the statistical model identification. IEEE Trans. Automat. Contr. 19, 716–723. doi: 10.1109/TAC.1974.1100705
Akibode, S., and Maredia, M. (2011). Global and regional trends in production, trade and consumption of food legume crops. Dep. Agric. Food Resour. Econ 87, 1–83.
Al-Abdallat, A. M., Karadsheh, A., Hadadd, N. I., Akash, M. W., Ceccarelli, S., Baum, M., et al. (2017). Assessment of genetic diversity and yield performance in jordanian barley (Hordeum vulgare L.) landraces grown under Rainfed conditions. BMC Plant Biol. 17:191. doi: 10.1186/s12870-017-1140-1
Andrews, M., and Andrews, M. E. (2017). Specificity in legume-rhizobia symbioses. Int. J. Mol. Sci 18:E705. doi: 10.3390/ijms18040705
Angioi, S. A., Desiderio, F., Rau, D., Bitocchi, E., Attene, G., and Papa, R. (2009). Development and use of chloroplast microsatellites in Phaseolus spp. and other legumes. Plant Biol. 11, 598–612. doi: 10.1111/j.1438-8677.2008.00143.x
Angioi, S. A., Rau, D., Attene, G., Nanni, L., Bellucci, E., Logozzo, G., et al. (2010). Beans in Europe: origin and structure of the European landraces of Phaseolus vulgaris L. Theor. Appl. Genet. 121, 829–843. doi: 10.1007/s00122-010-1353-2
Annicchiarico, P., Nazzicari, N., Wei, Y., Pecetti, L., and Brummer, E. C. (2017). Genotyping-by-sequencing and its exploitation for Forage and cool-season grain legume breeding. Front. Plant Sci. 8:679. doi: 10.3389/fpls.2017.00679
Barilli, E., Cobos, M. J., Carrillo, E., Kilian, A., Carling, J., and Rubiales, D. (2018). A high-density integrated DArTseq SNP-based genetic Map of Pisum fulvum and identification of QTLs controlling rust resistance. Front. Plant Sci. 9:167. doi: 10.3389/fpls.2018.00167
Barrett, J. C., Fry, B., Maller, J., and Daly, M. J. (2005). Haploview: analysis and visualization of LD and haplotype maps. Bioinformatics 21, 263–265. doi: 10.1093/bioinformatics/bth457
Basu, U., Narnoliya, L., Srivastava, R., Sharma, A., Bajaj, D., Daware, A., et al. (2019). CLAVATA signaling pathway genes modulating flowering time and flower number in chickpea. Theor. Appl. Genet. 132, 2017–2038. doi: 10.1007/s00122-019-03335-y
Bäurle, I., and Dean, C. (2006). The timing of developmental transitions in plants. Cell 125, 655–664. doi: 10.1016/j.cell.2006.05.005
Bitocchi, E., Nanni, L., Bellucci, E., Rossi, M., Giardini, A., Zeuli, P. S., et al. (2012). Mesoamerican origin of the common bean (Phaseolus vulgaris L.) is revealed by sequence data. Proc. Natl. Acad. Sci. U.S.A 109, E788–E796. doi: 10.1073/pnas.1108973109
Blair, M. W., Astudillo, C., Rengifo, J., Beebe, S. E., and Graham, R. (2011). QTL analyses for seed iron and zinc concentrations in an intra-genepool population of andean common beans (Phaseolus vulgaris L.). Theor. Appl. Genet. 122, 511–521. doi: 10.1007/s00122-010-1465-8
Blair, M. W., Iriarte, G., and Beebe, S. (2006). QTL analysis of yield traits in an advanced backcross population derived from a cultivated andean × wild common bean (Phaseolus vulgaris L.) cross. Theor. Appl. Genet. 112, 1149–1163. doi: 10.1007/s00122-006-0217-2
Bradbury, P. J., Zhang, Z., Kroon, D. E., Casstevens, T. M., Ramdoss, Y., and Buckler, E. S. (2007). TASSEL: software for association mapping of complex traits in diverse samples. Bioinformatics 23, 2633–2635. doi: 10.1093/bioinformatics/btm308
Brim, C. A. (1966). A modified pedigree method of selection in soybeans. Crop Sci. 6:220. doi: 10.2135/cropsci1966.0011183X000600020041x
Broughton, W., Hernandez, G., and Blair, M. (2003). Beans (Phaseolus spp.) – model food legumes. Plant Soil 252, 55–128. doi: 10.1023/a:1024146710611
Burkle, L., Hibberd, J. M., Quick, W. P., Kuhn, C., Hirner, B., and Frommer, W. B. (1998). The H+-sucrose cotransporter NtSUT1 is essential for sugar export from tobacco leaves. Plant Physiol. 118, 59–68. doi: 10.1104/pp.118.1.59
Caproni, L., Raggi, L., Tissi, C., Howlett, S., Torricelli, R., and Negri, V. (2018). Multi-Environment evaluation and genetic characterisation of common bean breeding lines for organic farming systems. Sustainability 10:777. doi: 10.3390/su10030777
Catchen, J., Hohenlohe, P. A., Bassham, S., Amores, A., and Cresko, W. A. (2013). Stacks: an analysis tool set for population genomics. Mol. Ecol. 22, 3124–3140. doi: 10.1111/mec.12354
Chandran, D., Reinders, A., and Ward, J. M. (2003). Substrate specificity of the Arabidopsis thaliana sucrose transporter AtSUC2. J. Biol. Chem. 278, 44320–44325. doi: 10.1074/jbc.M308490200
Cichy, K. A., Wiesinger, J. A., and Mendoza, F. A. (2015). Genetic diversity and genome-wide association analysis of cooking time in dry bean (Phaseolus vulgaris L.). Theor. Appl. Genet. 128, 1555–1567. doi: 10.1007/s00122-015-2531-z
Corbesier, L., Lejeune, P., and Bernier, G. (1998). The role of carbohydrates in the induction of flowering in Arabidopsis thaliana: comparison between the wild type and a starchless mutant. Planta 206, 131–137. doi: 10.1007/s004250050383
Davey, J. W., Hohenlohe, P. A., Etter, P. D., Boone, J. Q., Catchen, J. M., and Blaxter, M. L. (2011). Genome-wide genetic marker discovery and genotyping using next-generation sequencing. Nat. Rev. Genet. 12, 499–510. doi: 10.1038/nrg3012
de Mendiburu, F. (2017). Rpackage “Agricolae.”. 1–153. Available at: http://tarwi.lamolina.edu.pe/f̃mendiburu/ (accessed February 5, 2019).
Deeken, R., Geiger, D., Fromm, J., Koroleva, O., Ache, P., Langenfeld-Heyser, R., et al. (2002). Loss of the AKT2/3 potassium channel affects sugar loading into the phloem of Arabidopsis. Planta 216, 334–344. doi: 10.1007/s00425-002-0895-1
Earl, D. A., and vonHoldt, B. M. (2012). STRUCTURE HARVESTER: a website and program for visualizing STRUCTURE output and implementing the evanno method. Conserv. Genet. Resour 4, 359–361. doi: 10.1007/s12686-011-9548-7
Esquinas-Alcázar, J. T. (1993). “Plant genetic resources,” in Plant Breeding: Principales and Prospects, eds M. D. Hayward, N. O. Bosemark, and I. Romagosa (London, UK: Chapman & Hall), 33–51.
Evanno, G., Regnaut, S., and Goudet, J. (2005). Detecting the number of clusters of individuals using the software STRUCTURE: a simulation study. Mol. Ecol. 14, 2611–2620. doi: 10.1111/j.1365-294X.2005.02553.x
Gabriel, S. B., Schaffner, S. F., Nguyen, H., Moore, J. M., Roy, J., Blumenstiel, B., et al. (2002). The structure of haplotype blocks in the human genome. Science. 296, 2225–2229. doi: 10.1126/science.1069424
Gepts, P., Kmiecik, K., Pereira, P., and Bliss, F. (1988). Dissemination pathways of common bean (Phaseolus vulgaris L). Econ. Bot. 42:86. doi: 10.1007/bf02859038
Gioia, T., Logozzo, G., Kami, J., Spagnoletti Zeuli, P., and Gepts, P. (2013). Identification and characterization of a homologue to the Arabidopsis INDEHISCENT gene in common bean. J. Hered. 104, 273–286. doi: 10.1093/jhered/ess102
Goodstein, D. M., Shu, S., Howson, R., Neupane, R., Hayes, R. D., Fazo, J., et al. (2012). Phytozome: a comparative platform for green plant genomics. Nucleic Acids Res. 40, D1178–D1186. doi: 10.1093/nar/gkr944
Goulden, C. H. (1939). “Problems in plant selection,” in Proceeding of the Seventh International Genetical Congress, (Edinburgh), 132–133.
Hao, Y., Xu, Y., Khan, A., He, Z., Rasheed, A., Varshney, R. K., et al. (2017). Crop breeding chips and genotyping platforms: progress, challenges, and perspectives. Mol. Plant 10, 1047–1064. doi: 10.1016/j.molp.2017.06.008
Hashimura, Y., and Ueguchi, C. (2011). The Arabidopsis MERISTEM DISORGANIZATION 1 gene is required for the maintenance of stem cells through the reduction of DNA damage. Plant J. 68, 657–669. doi: 10.1111/j.1365-313X.2011.04718.x
Jensen, E. S., Peoples, M. B., Boddey, R. M., Gresshoff, P. M., Henrik, H. N., Alves, B. J. R., et al. (2012). Legumes for mitigation of climate change and the provision of feedstock for biofuels and biorefineries. Agron. Sustain. Dev. 32, 329–354. doi: 10.1007/s13593-011-0056-7
Johnson, W. C., and Gepts, P. (2002). The role of epistasis in controlling seed yield and other agronomic traits in an andean x mesoamerican cross of common bean (Phaseolus vulgaris L.). Euphytica 125, 69–79. doi: 10.1023/A:1015775822132
Jung, C., and Müller, A. E. (2009). Flowering time control and applications in plant breeding. Trends Plant Sci. 14, 563–573. doi: 10.1016/j.tplants.2009.07.005
Kamfwa, K., Cichy, K. A., and Kelly, J. D. (2015a). Genome-wide association analysis of symbiotic nitrogen fixation in common bean. Theor. Appl. Genet. 128, 1999–2017. doi: 10.1007/s00122-015-2562-5
Kamfwa, K., Cichy, K. A., and Kelly, J. D. (2015b). Genome-wide association study of agronomic traits in common bean. Plant Genome 8, 1–12. doi: 10.3835/plantgenome2014.09.0059
Kelly, J. D., Gepts, P., Miklas, P. N., and Coyne, D. P. (2003). Tagging and mapping of genes and QTL and molecular marker-assisted selection for traits of economic importance in bean and cowpea. F. Crop. Res. 82, 135–154. doi: 10.1016/S0378-4290(03)00034-0
Klaedtke, S., Caproni, L., Klauck, J., de la Grandville, P., Dutartre, M., Stassart, P., et al. (2017). Short-term local adaptation of historical common bean (Phaseolus vulgaris L.) varieties and implications for in situ management of Bean Diversity. Int. J. Mol. Sci. 18:E493. doi: 10.3390/ijms18030493
Koinange, E. M. K., Singh, S. P., and Gepts, P. (1996). Genetic control of the domestication syndrome in common-bean. Crop Sci. 36, 1037–1045. doi: 10.2135/cropsci1996.0011183X003600040037x
Ksiazkiewicz, M., Rychel, S., Nelson, M. N., Wyrwa, K., Naganowska, B., and Wolko, B. (2016). Expansion of the phosphatidylethanolamine binding protein family in legumes: a case study of Lupinus angustifolius L. FLOWERING LOCUS T homologs, LanFTc1 and LanFTc2. BMC Genomics 17:820. doi: 10.1186/s12864-016-3150-z
Kwak, M., and Gepts, P. (2009). Structure of genetic diversity in the two major gene pools of common bean (Phaseolus vulgaris L., Fabaceae).Theor. Appl. Genet. 118, 979–992. doi: 10.1007/s00122-008-0955-4
Kwak, M., Velasco, D., and Gepts, P. (2008). Mapping homologous sequences for determinacy and photoperiod sensitivity in common bean (Phaseolus vulgaris). J. Hered. 99, 283–291. doi: 10.1093/jhered/esn005
Laurie, R. E., Diwadkar, P., Jaudal, M., Zhang, L., Hecht, V., Wen, J., et al. (2011). The medicago FLOWERING LOCUS T homolog, MtFTa1, is a key regulator of flowering time. Plant Physiol. 156, 2207–2224. doi: 10.1104/pp.111.180182
Leiboff, S., Li, X., Hu, H. C., Todt, N., Yang, J., Li, X., et al. (2015). Genetic control of morphometric diversity in the maize shoot apical meristem. Nat. Commun. 6, 1–10. doi: 10.1038/ncomms9974
Lejeune-Hénaut, I., Hanocq, E., Béthencourt, L., Fontaine, V., Delbreil, B., Morin, J., et al. (2008). The flowering locus Hr colocalizes with a major QTL affecting winter frost tolerance in Pisum sativum L. Theor. Appl. Genet. 116, 1105–1116. doi: 10.1007/s00122-008-0739-x
Li, H., and Durbin, R. (2009). Fast and accurate short read alignment with Burrows-wheeler transform. Bioinformatics 25, 1754–1760. doi: 10.1093/bioinformatics/btp324
Liu, H., Bayer, M., Druka, A., Russell, J. R., Hackett, C. A., Poland, J., et al. (2014). An evaluation of genotyping by sequencing (GBS) to map the Breviaristatum-e (ari-e) locus in cultivated barley. BMC Genomics 15:104. doi: 10.1186/1471-2164-15-4
Maras, M., Šuštar-Vozliè, J., Kainz, W., and Megliè, V. (2013). Genetic diversity and dissemination pathways of common bean in Central Europe. J. Am. Soc. Hortic. Sci. 138, 297–305. doi: 10.21273/jashs.138.4.297
Miklas, P. N., Kelly, J. D., Beebe, S. E., and Blair, M. W. (2006). Common bean breeding for resistance against biotic and abiotic stresses: from classical to MAS breeding. Euphytica 147, 105–131. doi: 10.1007/s10681-006-4600-5
Moghaddam, S. M., Mamidi, S., Osorno, J. M., Lee, R., Brick, M., Kelly, J., et al. (2016). Genome-wide association study identifies candidate loci underlying agronomic traits in a Middle American diversity panel of common bean. Plant Genome 9, 1–21. doi: 10.3835/plantgenome2016.02.0012
Mukeshimana, G., Butare, L., Cregan, P. B., Blair, M. W., and Kelly, J. D. (2014). Quantitative trait loci associated with drought tolerance in common bean. Crop Sci. 54, 923–938. doi: 10.2135/cropsci2013.06.0427
Negri, V., and Tiranti, B. (2010). Effectiveness of in situ and ex situ conservation of crop diversity. What a Phaseolus vulgaris L. landrace case study can tell us. Genetica 138, 985–998. doi: 10.1007/s10709-010-9485-5
Nelson, M. N., Książkiewicz, M., Rychel, S., Besharat, N., Taylor, C. M., Wyrwa, K., et al. (2017). The loss of vernalization requirement in narrow-leafed lupin is associated with a deletion in the promoter and de-repressed expression of a Flowering Locus T (FT) homologue. New Phytol. 213, 220–232. doi: 10.1111/nph.14094
Noh, Y.-S., and Amasino, R. M. (2003). PIE1, an ISWI family gene, is required for FLC activation and floral repression in Arabidopsis. Plant Cell 15, 1671–1682. doi: 10.1105/tpc.012161
Patishtan, J., Hartley, T. N., Fonseca de Carvalho, R., and Maathuis, F. J. M. (2018). Genome-wide association studies to identify rice salt-tolerance markers. Plant Cell Environ. 41, 970–982. doi: 10.1111/pce.12975
Payne, R. W., Harding, S. A., Murray, D. A., Soutar, D. M., Baird, D. B., Glaser, A. I., et al. (2011). The Guide to GenStat Release 14, Part 2: Statistics. Hemel Hempstead: VSN International.
Perez-Vega, E., Paneda, A., Rodriguez-Suarez, C., Campa, A., Giraldez, R., and Ferreira, J. J. (2010). Mapping of QTLs for morpho-agronomic and seed quality traits in a RIL population of common bean (Phaseolus vulgaris L.). Theor. Appl. Genet. 120, 1367–1380. doi: 10.1007/s00122-010-1261-5
Perseguini, J. M. K. C., Oblessuc, P. R., Rosa, J. R. B. F., Gomes, K. A., Chiorato, A. F., Carbonell, S. A. M., et al. (2016). Genome-wide association studies of anthracnose and angular leaf spot resistance in common bean (Phaseolus vulgaris L.). PLoS One 11:e0150506. doi: 10.1371/journal.pone.0150506
Peterson, B. K., Weber, J. N., Kay, E. H., Fisher, H. S., and Hoekstra, H. E. (2012). Double digest RADseq: an inexpensive method for de novo SNP discovery and genotyping in model and non-model species. PLoS One 7:e37135. doi: 10.1371/journal.pone.0037135
Petry, N., Boy, E., Wirth, J. P., and Hurrell, R. F. (2015). Review: the potential of the common bean (Phaseolus vulgaris) as a vehicle for iron biofortification. Nutrients 7, 1144–1173. doi: 10.3390/nu7021144
Pierre, J. B., Bogard, M., Herrmann, D., Huyghe, C., and Julier, B. (2011). A CONSTANS-like gene candidate that could explain most of the genetic variation for flowering date in Medicago truncatula. Mol. Breed. 28, 25–35. doi: 10.1007/s11032-010-9457-6
Pierre, J. B., Huguet, T., Barre, P., Huyghe, C., and Julier, B. (2008). Detection of QTLs for flowering date in three mapping populations of the model legume species Medicago truncatula. Theor. Appl. Genet. 117, 609–620. doi: 10.1007/s00122-008-0805-4
Pignone, D., De Paola, D., Rapanà, N., and Janni, M. (2015). Single seed descent: a tool to exploit durum wheat (Triticum durum Desf.) genetic resources. Genet. Resour. Crop Evol. 62, 1029–1035. doi: 10.1007/s10722-014-0206-2
Poland, J. A., Brown, P. J., Sorrells, M. E., and Jannink, J.-L. (2012). Development of high-density genetic maps for barley and wheat using a novel two-enzyme genotyping-by-sequencing approach. PLoS One 7:e32253. doi: 10.1371/journal.pone.0032253
Pritchard, J. K., Stephens, M., and Donnelly, P. (2000). Inference of population structure using multilocus genotype data. Genetics 155, 945–959. doi: 10.1111/j.1471-8286.2007.01758.x
Purcell, S., Neale, B., Todd-Brown, K., Thomas, L., Ferreira, M. A. R., Bender, D., et al. (2007). PLINK: a tool set for whole-genome association and population-based linkage analyses. Am. J. Hum. Genet. 81, 559–575. doi: 10.1086/519795
Putterill, J., Laurie, R., and Macknight, R. (2004). It’s time to flower: the genetic control of flowering time. BioEssays 26, 363–373. doi: 10.1002/bies.20021
Raggi, L., Ciancaleoni, S., Torricelli, R., Terzi, V., Ceccarelli, S., and Negri, V. (2017). Evolutionary breeding for sustainable agriculture: selection and multi-environmental evaluation of barley populations and lines. F. Crop. Res. 204, 76–88. doi: 10.1016/j.fcr.2017.01.011
Raggi, L., Tiranti, B., and Negri, V. (2013). Italian common bean landraces: diversity and population structure. Genet. Resour. Crop Evol. 60, 1515–1530. doi: 10.1007/s10722-012-9939-y
Raggi, L., Tissi, C., Mazzucato, A., and Negri, V. (2014). Molecular polymorphism related to flowering trait variation in a Phaseolus vulgaris L. collection. Plant Sci. 21, 180–189. doi: 10.1016/j.plantsci.2013.11.001
Rana, J. C., Sharma, T. R., Tyagi, R. K., Chahota, R. K., Gautam, N. K., Singh, M., et al. (2015). Characterisation of 4274 accessions of common bean (Phaseolus vulgaris L.) germplasm conserved in the Indian gene bank for phenological, morphological and agricultural traits. Euphytica 205, 441–457. doi: 10.1007/s10681-015-1406-3
Reay, D. S., Davidson, E. A., Smith, K. A., Smith, P., Melillo, J. M., Dentener, F., et al. (2012). Global agriculture and nitrous oxide emissions. Nat. Clim. Chang. 2, 410–416. doi: 10.1038/nclimate1458
Rodiño, A. P., Santalla, M., De Ron, A. M., and Singh, S. P. (2003). A core collection of common bean from the iberian peninsula. Euphytica 131, 165–175. doi: 10.1023/A:1023973309788
Roldán, M., Gómez-Mena, C., Ruiz-García, L., Salinas, J., and Martínez-Zapater, J. M. (1999). Sucrose availability on the aerial part of the plant promotes morphogenesis and flowering of Arabidopsis in the dark. Plant J. 20, 581–590. doi: 10.1046/j.1365-313X.1999.00632.x
Rollins, J. A., Drosse, B., Mulki, M. A., Grando, S., Baum, M., Singh, M., et al. (2013). Variation at the vernalisation genes Vrn-H1 and Vrn-H2 determines growth and yield stability in barley (Hordeum vulgare) grown under dryland conditions in Syria. Theor. Appl. Genet. 126, 2803–2824. doi: 10.1007/s00122-013-2173-y
Rosenberg, N. A. (2003). distruct: a program for the graphical display of population structure. Mol. Ecol. Notes 4, 137–138. doi: 10.1046/j.1471-8286.2003.00566.x
Sauer, N., and Stolz, J. (1994). SUC1 and SUC2: two sucrose transporters from Arabidopsis thaliana; expression and characterization in baker’s yeast and identification of the histidine-tagged protein. Plant J. 6, 67–77. doi: 10.1046/j.1365-313x.1994.6010067.x
Schmutz, J., McClean, P. E., Mamidi, S., Wu, G. A., Cannon, S. B., Grimwood, J., et al. (2014). A reference genome for common bean and genome-wide analysis of dual domestications. Nat. Genet. 46, 707–713. doi: 10.1038/ng.3008
Singh, M., Ceccarelli, S., and Grando, S. (1997). Precision of the genotypic correlation estimated from variety trials conducted in incomplete block designs. TAG Theor. Appl. Genet. 95, 1044–1048. doi: 10.1007/s001220050660
Singh, M., Malhotra, R. S., Ceccarelli, S., Sarker, A., Grando, S., and Erskine, W. (2003). Spatial variability models to improve dryland field trials. Exp. Agric. 39, S0014479702001175. doi: 10.1017/S0014479702001175
Singh, S. P., Gepts, P., and Debouck, D. G. (1991a). Races of common bean (Phaseolus vulgaris. Fabaceae). Econ. Bot. 45, 379–396. doi: 10.1007/bf02887079
Singh, S. P., Nodari, R., and Gepts, P. (1991b). Genetic diversity in cultivated common bean: I. Allozymes. Crop Sci. 31, 19–23. doi: 10.2135/cropsci1991.0011183X003100010004x
Snape, J. W., and Riggs, T. J. (1975). Genetical consequences of single seed descent in the breeding of self-pollinating crops. Heredity 35, 211–219. doi: 10.1038/hdy.1975.85
Solfanelli, C., Poggi, A., Loreti, E., Alpi, A., and Perata, P. (2006). Sucrose-specific induction of the anthocyanin biosynthetic pathway in Arabidopsis. Plant Physiol. 140, 637–646. doi: 10.1104/pp.105.072579
TAIR (2019a). AT1G22710. Available at: https://www.arabidopsis.org/servlets/TairObject?type=locus&name=AT1G22710 (accessed March 25, 2019).
TAIR (2019b). AT1G56260. Available at: https://www.arabidopsis.org/servlets/TairObject?accession=locus:2011781 (accessed March 25, 2019).
TAIR (2019c). AT1G65380. Available at: https://www.arabidopsis.org/servlets/TairObject?type=locus&name=At1g65380 (accessed March 25, 2019).
TAIR (2019d). AT4G23430. Available at: https://www.arabidopsis.org/servlets/TairObject?type=locus&name=AT4G23430 (accessed March 25, 2019).
TAIR (2019e). ATG22200. Available at: https://www.arabidopsis.org/servlets/TairObject?type=locus&name=AT4G22200 (accessed March 25, 2019).
Teng, S., Keurentjes, J., Bentsink, L., Koornneef, M., and Smeekens, S. (2005). Sucrose-specific induction of anthocyanin biosynthesis in Arabidopsis requires the MYB75/PAP1 gene. Plant Physiol. 139, 1840–1852. doi: 10.1104/pp.105.066688.1840
Tiranti, B., and Negri, V. (2007). Selective microenvironmental effects play a role in shaping genetic diversity and structure in a Phaseolus vulgaris L. landrace: implications for on-farm conservation. Mol. Ecol. 16, 4942–4955. doi: 10.1111/j.1365-294X.2007.03566.x
United Nations. (2017). World Population Prospect: The 2017 revision. San Francisco: United Nations.
Visioni, A., Tondelli, A., Francia, E., Pswarayi, A., Malosetti, M., Russell, J., et al. (2013). Genome-wide association mapping of frost tolerance in barley (Hordeum vulgare L.). BMC Genomics 14:424. doi: 10.1186/1471-2164-14-424
Visscher, P. M., Wray, N. R., Zhang, Q., Sklar, P., McCarthy, M. I., Brown, M. A., et al. (2017). 10 Years of GWAS discovery: biology, function, and translation. Am. J. Hum. Genet. 101, 5–22. doi: 10.1016/j.ajhg.2017.06.005
Yan, L., Hofmann, N., Li, S., Ferreira, M. E., Song, B., Jiang, G., et al. (2017). Identification of QTL with large effect on seed weight in a selective population of soybean with genome-wide association and fixation index analyses. BMC Genomics 18:529. doi: 10.1186/s12864-017-3922-0
Yin, L. (2016). R package “CMPlots.”. Available at: https://github.com/YinLiLin/R-CMplot (accessed February 5, 2019).
Zander, P., Amjath-Babu, T. S., Preissel, S., Reckling, M., Bues, A., Schläfke, N., et al. (2016). Grain legume decline and potential recovery in European agriculture: a review. Agron. Sustain. Dev. 36:26. doi: 10.1007/s13593-016-0365-y
Zeven, A. C. (1997). The introduction of the common bean (Phaseolus vulgaris L.) into Western Europe and the phenotypic variation of dry beans collected in The Netherlands in 1946. Euphytica 94, 319–328. doi: 10.1023/A:1002940220241
Keywords: Phaseolus vulgaris L., flowering time control, ddRAD-seq, GWAS, candidate gene analysis
Citation: Raggi L, Caproni L, Carboni A and Negri V (2019) Genome-Wide Association Study Reveals Candidate Genes for Flowering Time Variation in Common Bean (Phaseolus vulgaris L.). Front. Plant Sci. 10:962. doi: 10.3389/fpls.2019.00962
Received: 12 April 2019; Accepted: 10 July 2019;
Published: 24 July 2019.
Edited by:
Matthew Nicholas Nelson, Agriculture & Food (CSIRO), AustraliaReviewed by:
Elena Bitocchi, Marche Polytechnic University, ItalyMonica Rodriguez, University of Sassari, Italy
Copyright © 2019 Raggi, Caproni, Carboni and Negri. This is an open-access article distributed under the terms of the Creative Commons Attribution License (CC BY). The use, distribution or reproduction in other forums is permitted, provided the original author(s) and the copyright owner(s) are credited and that the original publication in this journal is cited, in accordance with accepted academic practice. No use, distribution or reproduction is permitted which does not comply with these terms.
*Correspondence: Lorenzo Raggi, lorenzo.raggi@unipg.it; lorenzo.raggi@gmail.com
†These authors have contributed equally to this work as first authors