Ultrastructure of dendritic spines: correlation between synaptic and spine morphologies
- 1 Instituto Cajal, Madrid, Spain
- 2 HHMI, Department of Biological Sciences, Columbia University, New York, USA
Dendritic spines are critical elements of cortical circuits, since they establish most excitatory synapses. Recent studies have reported correlations between morphological and functional parameters of spines. Specifically, the spine head volume is correlated with the area of the postsynaptic density (PSD), the number of postsynaptic receptors and the ready-releasable pool of transmitter, whereas the length of the spine neck is proportional to the degree of biochemical and electrical isolation of the spine from its parent dendrite. Therefore, the morphology of a spine could determine its synaptic strength and learning rules.
To better understand the natural variability of neocortical spine morphologies, we used a combination of gold-toned Golgi impregnations and serial thin-section electron microscopy and performed three-dimensional reconstructions of spines from layer 2/3 pyramidal cells from mouse visual cortex. We characterized the structure and synaptic features of 144 completed reconstructed spines, and analyzed their morphologies according to their positions. For all morphological parameters analyzed, spines exhibited a continuum of variability, without clearly distinguishable subtypes of spines or clear dependence of their morphologies on their distance to the soma. On average, the spine head volume was correlated strongly with PSD area and weakly with neck diameter, but not with neck length. The large morphological diversity suggests an equally large variability of synaptic strength and learning rules.
Introduction
Dendritic spines must be essential for the function of the cerebral cortex. As predicted by Cajal (Ramón y Cajal, 1899 ), they establish synaptic connections (Gray, 1959b ), and are the recipient of most excitatory inputs to pyramidal cells (Colonnier, 1968 ), the most abundant cortical neuronal type. Yet, dendritic shafts of non-spiny neurons also form excitatory synaptic contacts, therefore, spines must be carrying out a specific function, one that is particular to pyramidal cells. Many different ideas have been suggested as to what is the specific function of the spine (Harris and Kater, 1994 ; Shepherd, 1996 ). The introduction of novel imaging techniques has recently demonstrated that spines can compartmentalize calcium and, therefore, can serve as biochemical compartments that isolate synaptic inputs from each other (Yuste and Denk, 1995 ) and, thus, could implement input-specific learning rules (Koch and Zador, 1993 ; Wickens, 1988 ). In addition, spines can also serve an electrical function, since the spine neck can filter membrane potentials and can therefore isolate inputs from each other (Araya et al., 2006a ; Araya et al., 2006b ; Diamond et al., 1970 ; Jack et al., 1975 ; LlinÁs and Hillman, 1969 ; Segev and Rall, 1988 ).
The morphology of dendritic spines is very diverse, and this has prompted a long history of speculations as whether it is of any functional significance (Crick, 1982 ; Ramón and Cajal, 1899 ). Rall and his collaborators, after an initial suggestion by Chang (1952) , explored quantitatively the impact of the morphology of the spine on synaptic function, predicting that the shortening of the spine neck could lead to an increase in synaptic strength (for a compilation of early work by him see Rall, 1995 ). These predictions lead to the study of activity-dependent changes in spine fine structure (Fifkova and Van Harrefeld, 1977 ), and to recent research that has described changes in spines after functional manipulations (reviewed in Yuste and Bonhoeffer, 2001 ). This recent work has highlighted the potential relation between spine shape and synaptic function, a possibility that has become more likely since morphological rearrangements of spines have been found in vitro and in vivo (Dunaevsky et al., 1999 ; Fischer et al., 1998 ; Lendvai et al., 2000 ;), and appear to be associated in some cases with developmental or behavioral plasticity (Trachtenberg et al., 2002 ; although see Grutzendler et al., 2002 ).
Several potential links between spine morphology and synaptic function have been reported. In some of the early reconstructions of neocortical spines, Freire (Freire, 1978 ) and Spacek and Hartmann (Spacek and Hartmann, 1983 ) showed correlation between the volume of spines and the surface area of the synapse, but these authors did not analyzed separately head and neck, and therefore they could not dissect the major role that the head volume plays in that relationship. More recently, in rat CA1 pyramidal cells, the volume of the spine head was reported to be proportional to the postsynaptic density (PSD) area and to the number of presynaptic vesicles (Harris and Stevens, 1989 ). Also, in mouse hippocampal and olfactory cortical neurons, the spine head volume was also found proportional to the PSD area and to the number of docked vesicles (Schikorski and Stevens, 1999 ). The PSD area is itself proportional to the number of postsynaptic receptors (Nusser et al., 1998 ), whereas the number of docked vesicles is proportional to the ready-releasable pool of transmitter (Dobrunz and Stevens, 1997 ). Therefore, the volume of the spine head is likely to be directly proportional to the average reliability and strength of its synapse. In addition, the spine neck length has also been shown to be related to functional parameters of the spine, more specifically to the time constant of calcium compartmentalization (Majewska et al., 2000 ; Yuste et al., 2000 ; but see Sabatini et al., 2002 ) and also proportional to the filtering of electrical potentials (Araya et al., 2006b ; but see Svoboda et al., 1996 ). Thus, the spine neck could also play a major functional role in the regulation of the strength of a synapse or in determining the properties of its calcium-dependent learning rules.
The diverse morphologies of dendritic spines were described early (Jones and Powell, 1969 ; Peters and Kaiserman-Abramof, 1970 ; Ramón y Cajal, 1893 ) and this diversity has been hypothesized as a possible factor influencing spine stability and function (Harris and Kater, 1994 ; Koch and Poggio, 1983 ; Peters and Kaiserman-Abramof, 1970 ; Rall, 1978 ; Segev and Rall, 1988 ). Peters and Kaiserman-Abramof proposed the classical distinction between stubby, thin, and mushroom spines based on optical microscopy and observation of spines in single sections at the electron microscope (EM) (Peters and Kaiserman-Abramof, 1970 ). This classification has been widely adopted and is used in almost every study on spines at the optical microscope level. However, Peters and Kaiserman-Abramof also indicated that some spines had intermediate forms and were difficult to classify in those types, and this limitation clearly arises when the detailed morphology of spines is examined with EM. Since the original work of Gray (Gray, 1959a , 1959b ), numerous ultrastructural studies have described the morphologies of neocortical spines (Jones and Powell, 1969 ; Peters and Kaiserman-Abramof, 1969 ; Peters and Kaiserman-Abramof, 1970 ; Spacek, 1985a , 1985b ; Spacek and Hartmann, 1983 ). At the same time, these studies are mostly qualitative, and normally report spine samples from the neuropil, so the spines analyzed may belong to many different types of neurons. To circumvent this problem and characterize the distribution of morphologies in a cortical neuron, a number of studies have labeled individual cells with a histological marker and then performed serial thin-section reconstructions of their spines (see for example Megias et al., 2001 ). Unfortunately, most markers are peroxidase-based and they obscure the postsynaptic cytoplasm, making it difficult to visualized the PSD and ascertain its presence and extension.
To quantitatively characterize the morphological variability present in dendritic spines of an identified population of cortical neurons, we used Golgi impregnations and then performed gold-toning and serial thin-section electron microscopy of a sample of spines from layer 2/3 pyramidal neurons from mouse primary visual cortex. In a previous study, we used this material and focused our analysis on the small proportion of spines that did not established a synaptic contact (Arellano et al., 2007 ). In the present study, we report our results from the quantitative study of the remaining spines, in fact the large majority of them, which formed synapses.
Our results indicate that there are no detectable correlations between spine head volume and spine neck length, although a weak correlation is found between head volume and neck diameter. Also, in our population of spines analyzed, while the area of the PSD is proportional to the spine head volume and neck diameter, it appears uncorrelated with the spine neck length. Finally, we encounter a large diversity along each of the morphological variables measured, without a clear evidence for different classes of spines.
Materials and Methods
Sample Preparation
Adult ICR male mice (8–12 weeks old) were terminally anaesthetized with ketamine-xylazine, and perfused through the ascending aorta with 4% paraformaldehyde and 1% glutaraldehyde in 0.12 M phosphate buffer (PB). Animals were left overnight at 4 °C and brains were removed from skull the next morning, washed in several changes of 0.12 M PB. The crania were placed in a Kopf stereotaxic apparatus and the brains were repositioned. Blocks between 2 and 3 mm thick were trimmed, containing the primary visual cortex according to the coordinates of Paxinos and Franklin (between -0.38 and 4.21 mm to Bregma, and 2 and 3 mm to the midline) (Paxinos and Franklin, 2001 ). Trimmed blocks were embedded in 4% agar. The rapid Golgi method was performed by immersion of the blocks in 2.4% potassium dichromate and 0.2% osmium tetroxyde in darkness at 18 °C, for 4 days, followed by 0.75% silver nitrate for 1 day, also in darkness. Brains were dehydrated in an ascending series of glycerol into anhydrous glycerol, cut into 120 μm thick sections in a sliding microtome, and gold toned according to a standard method (Fairen et al., 1977 ). Sections were dehydrated in increasing series of ethanol followed by absolute acetone and embedded in araldite resin on silicon-coated slides. Araldite-embedded sections were cured at 60 °C for 48 hours.
Electron Microscopy
Four pyramidal cells from layer 2/3 of visual cortex were chosen based on the quality of Golgi impregnation, isolation from other impregnated neurons and relative preservation of the dendritic arbor (Figure 1 A). These neurons were digitalized with Neurolucida (MBF Biosciences, Williston, VT, USA) to obtain a three-dimensional model of the dendritic arborization. Small pieces of the section containing the neuron of interest were removed from the slide with the help of a razor blade and glued to an araldite block using cyanocrilate glue under a dissecting microscope. After trimming the block (Figure 1 A), ultrathin serial sections (50–70 nm thick) were cut in a Reichert ultramicrotome with a diamond knife (Diatome Ultra 45°) and mounted in formvar-coated nickel slot grids (Figure 1 B), stained for 1 hour with 1% uranil acetate in bidistilled water, and for 30 minutes with lead citrate (Venable and Coggeshall, 1965).
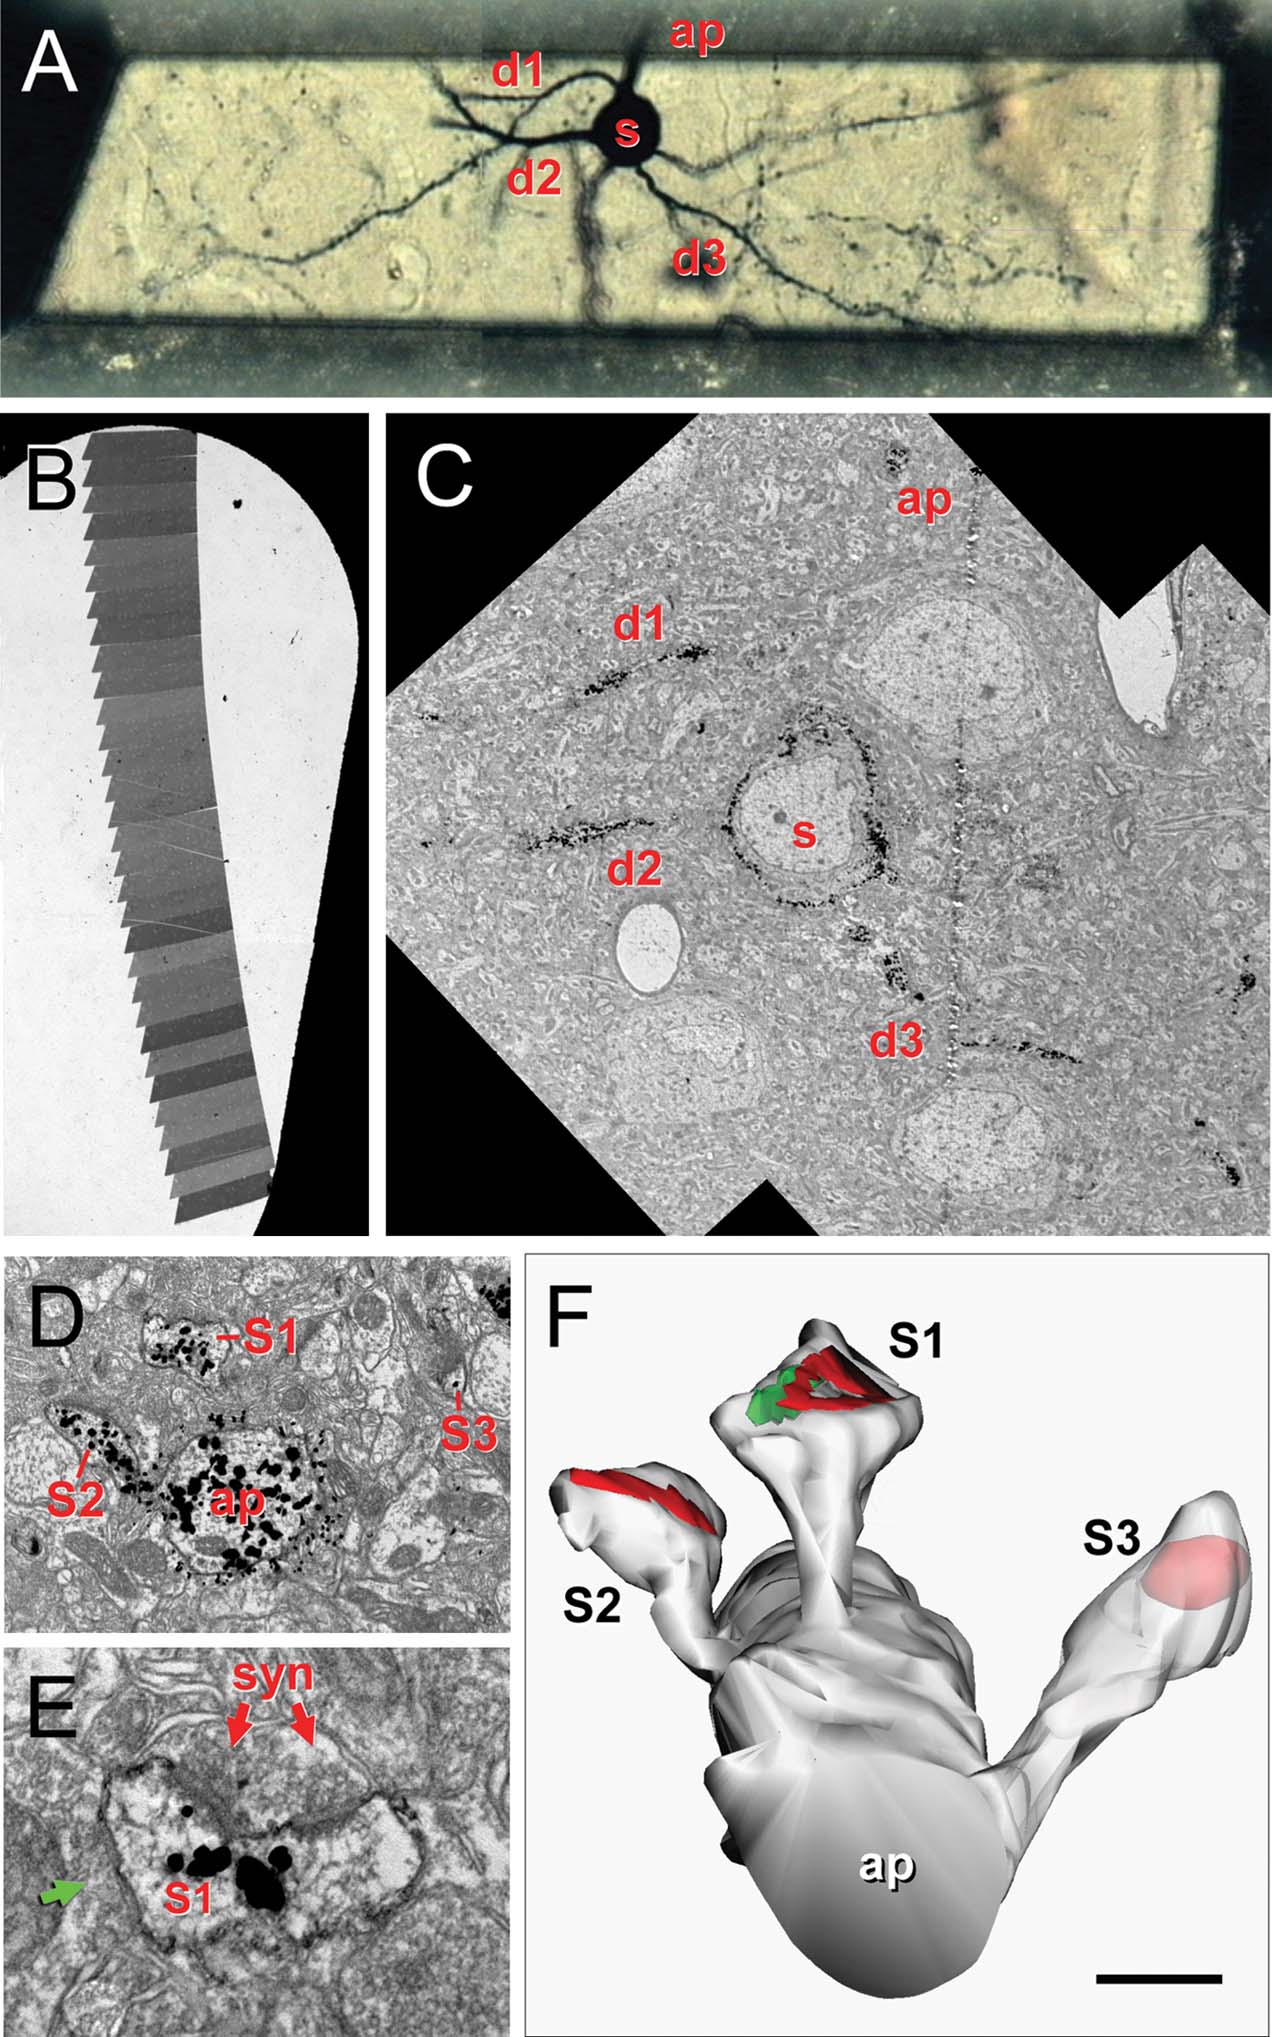
Figure 1. Correlative optical-electron microscopy. (A) Trimmed resin block containing a selected Golgi-impregnated gold-toned neuron. The soma (s), some basal dendrites (d1–d3) bearing dendritic spines and the beginning of the apical dendrite (ap) are indicated. (B) Slot grid with a ribbon of serial sections for ultrastructural analysis. (C) Electron microscopic panoramic images of the neuron in A; the soma (s), d1–d3 basal dendrites and the apical (ap) dendrite are indicated. (D) Detail of the apical dendrite (ap) with three spines (s1, s2, s3). (E) Detail of the asymmetrical synapse (syn) on s1; note the perforated PSD, the synaptic cleft and the presynaptic terminal with rounded vesicles. This spine also established a symmetrical synapse (green arrow). (F) Three-dimensional reconstruction of the same apical dendritic segment; the rendering has been slightly shifted down to show the synaptic junctions and S3 is partially transparent to show the location of the PSD. Scale bar is 24 μm in A; 250 μm in B; 10 μm in C; 1 μm in D; 0.3 μm in E, and 0.6 μm in F.
Digital pictures of selected dendritic processes (Figures 1 C–E) were captured at a magnification of 30 000–60 000 in a Jeol 150 transmission EM, equipped with a SIS Megaview III CCD digital camera. Fifteen series were analyzed, ranging from 21 to 52 sections. Series were composed of a variable number of pictures per section (1–12) arranged in a mosaic to reconstruct the stained dendritic segments.
Ultrastructural Reconstructions
Dendritic spines were three-dimensionally reconstructed (Figures 1 F and 2 ) with the aid of Reconstruct software (Reconstruct 1.0.5.7; available from http://synapses.mcg.edu/ ; (Fiala, 2005 )). Independent traces were drawn for the neck and head of each spine, and three-dimensional distances were measured for the spine length, neck length and neck diameter of spines located at a distance of 13–127 μm from the cell body. Since the neck diameter was not constant, an average diameter was calculated from three measurements obtained proximal, intermediate and distal to the insertion of the spine to the dendrite. Depending on the angle of visualization of the spine, sometimes the head was difficult to distinguish from the neck. In these cases, the border between the head and the neck was traced after rotating the spine in order to view the spine at different angles (Figure 2 B). In 14 spines, it was not possible to distinguish a clear head (Figure 2 ). Since the head usually presented an irregular shape (Figures 1 F and 2 ), an average head diameter was estimated from the measured head volume and length, considering the head as a cylinder (head diameter = 2× square root (head volume/head length/π)). Volumes were measured directly from the three-dimensional reconstructions.
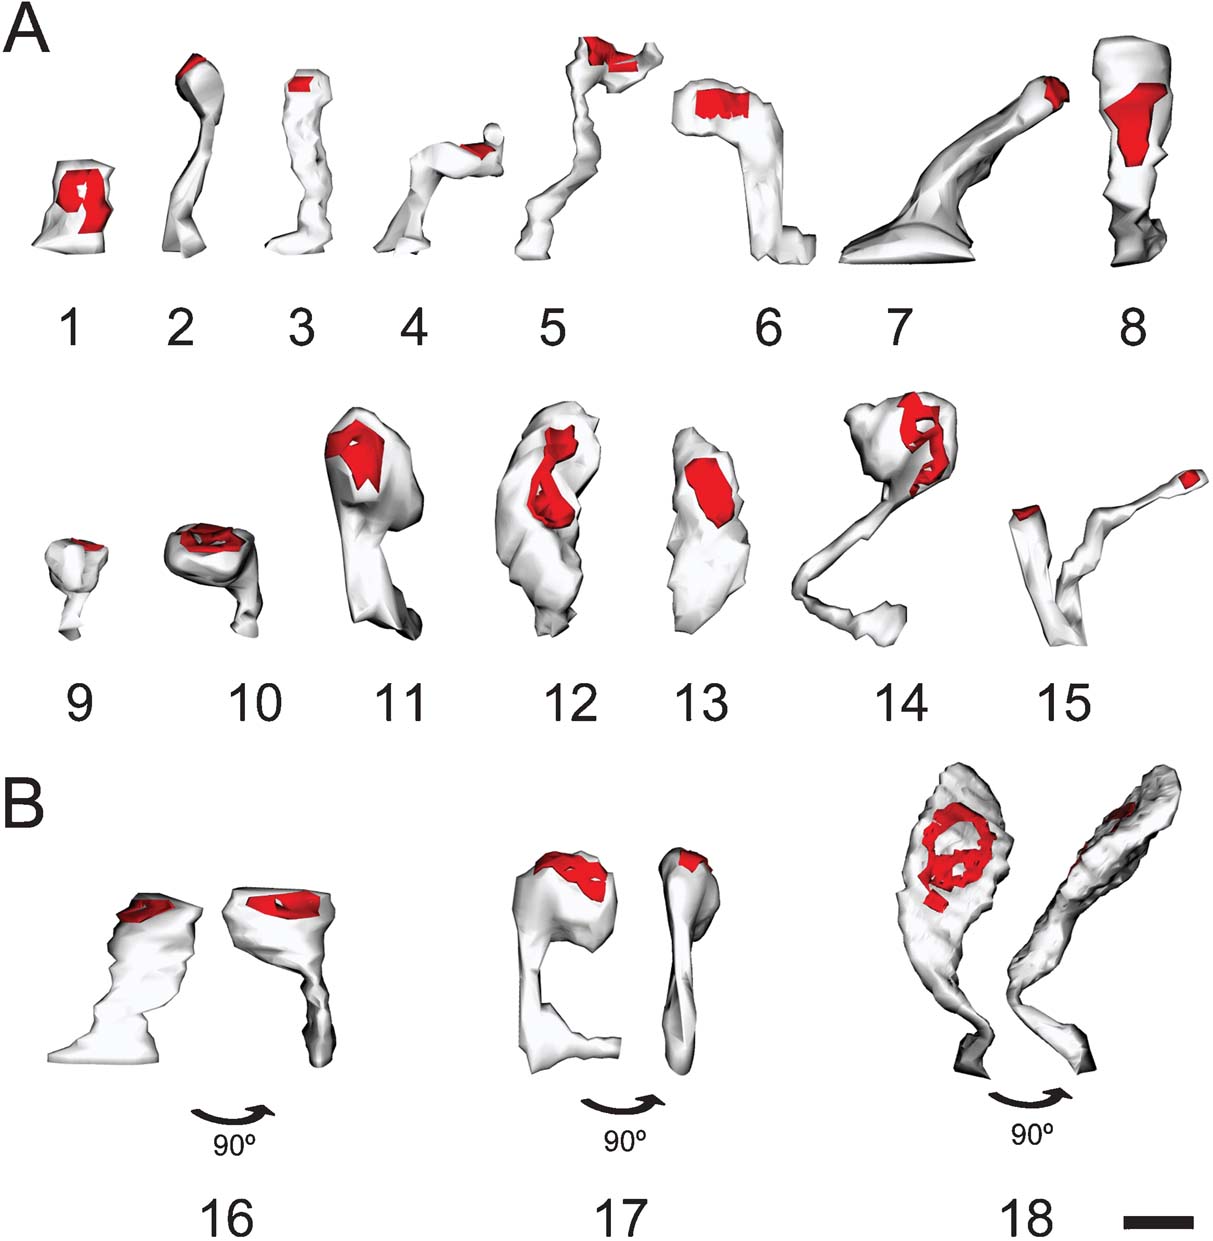
Figure 2. Morphological variability of spines. Three-dimensional reconstruction of spines showing the variability in their morphology. (A) Spines showing different types: stubby (1), thin (2), mushroom (9–11), and ramified (15). We would caution the reader that most reconstructed spines were atypical or intermediate types (3–8, 12–14). (B) Spines appear different depending on the angle of observation. 16–18 illustrate three spines from two points of view after 90° rotation. Scale bar is 0.5 μm.
Synapses were identified by the presence of a PSD facing an axon terminal with synaptic vesicles (Figure 1 E). Synapses were most frequently cut transversally and were traced as lines that followed the length of the PSD, while those cut tangentially were traced as closed contours to obtain a consistent estimation of synaptic surface area. Tangentially cut postsynaptic densities frequently appeared in adjacent sections with overlapping distribution. In these cases, redundant regions were traced only in one section to avoid overestimation of the surface area. In addition, the average diameter of the PSD was calculated from the values of PSD surface area, assuming a circular shape of the PSD.
The presence of perforations and segregations in the PSD (Figure 1 E) allowed the classification of synapses as simple or complex. PSDs resembling disks were considered simple and will be referred as macular, while complex PSDs were considered those with a single or multiple perforations in the PSD, or a segregation of the PSD associated to a single axon terminal.
Statistical Analysis
Analysis of the morphological and synaptic data of synaptic spines were performed with the aid of SPSS statistical package (SPSS Inc., Chicago, IL, USA). Correlation analysis between the parameters quantified was performed with non-parametric Spearman analysis since most parameters did not exhibit a normal distribution. Significant correlations were classified as weak (Spearman rho (r) value lower than 0.40), moderate (0.4 < r < 0.7) and strong (r > 0.7).
Results
Ultrastructural Reconstructions of Gold-toned Golgi Material
In this work, we aimed at quantitatively describing the morphologies of a representative population of neocortical spines from an identified cell type. For this reason, rather than collecting spines from an unknown origin, it was essential to label a particular neuron type with a histological marker that could be detected at the ultrastructural level. At the same time, in order to adequately visualize synaptic structures, we needed to use a marker that would not obscure the postsynaptic cytoplasm, as commonly happens with peroxidase-based stains. For this purpose we used gold-toning Golgi method, a very useful technique by which the silver deposits obtained in a Golgi stained-neuron are then substituted with gold particles during a series of chemical processing steps (Fairen et al., 1977 ; Figure 1 ).
We chose to study layer 2/3 pyramidal cells of the visual cortex of young adult mice. This is a population of cells whose spines we have previously studied quantitatively at the light microscope level (Ballesteros-Yanez et al., 2006 ; Benavides-Piccione et al., 2002 ; Konur et al., 2003 ), so we could compare our ultrastructural data with this previous work. Moreover, layer 2/3 pyramidal cells are one of the most common neocortical neuronal types, and the mouse neocortex has been studied for many decades (Lorente de Nó, 1922 ; White, 1989 ). Furthermore, the mouse primary visual cortex is a standard preparation for structural (Kozloski et al., 2001 ) or functional (Gordon and Stryker, 1996 ; Hensch et al., 1998 ) studies of cortical circuits.
A total of 365 spines were studied, 144 of which could be completely reconstructed from electron microscopy series (Figures 1 B and 2 ; Table 1 ). One hundred three spines were located on basal dendrites, 31 on apical dendrites and 10 were on dendrites of undetermined origin. Six of those (4.2%) had two branches that established a single synapse in their distal end. From the 138 non-branching spines, 133 had a single synapse that could be classified as asymmetrical in most cases, while the other 5 spines did not exhibit a PSD. In our sample, we detected one clear example of a symmetrical synapse on a spine head (Figure 1 E). Non-synaptic spines represented, therefore, 3.6% of the non-branching spines analyzed and 3.3% of the total number of spine ‘heads’ (n = 150) studied. The characteristics of these non-synaptic spines have been described elsewhere (Arellano et al., 2007 ), whereas the present manuscript focuses on the description of the ultrastructure and morphological analysis of completely reconstructed synaptic spines. Not all variables were clearly measurable in all spines, therefore the number of spines used to calculate each morphological variable differs (Table 1 )
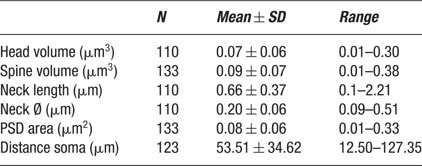
Table 1. Summary of spine morphological variables.
Analysis of Total Spine and Spine Heads Volumes
We first focused on the characterization of spine head volumes (Figure 3 A), given that it has been reported to be correlated with pre- and postsynaptic functional parameters (Harris and Stevens, 1989 ; Schikorski and Stevens, 1999 ). Spine heads ranged from 0.01 to 0.30 μm3 in volume, with an average of 0.07 ± 0.06 μm3 (mean ± SD; n = 110). The distribution of spine head volumes displayed a peak at 0.03 μm3 and was broad and asymmetrical (Figure 3 A). Specifically, most of the spines (75%) had a head volume of less than 0.1 μm3 and the remaining distributed in a long tail of spines with larger head volume. Aside from the modal peak, there was not a clear second peak in the distribution.
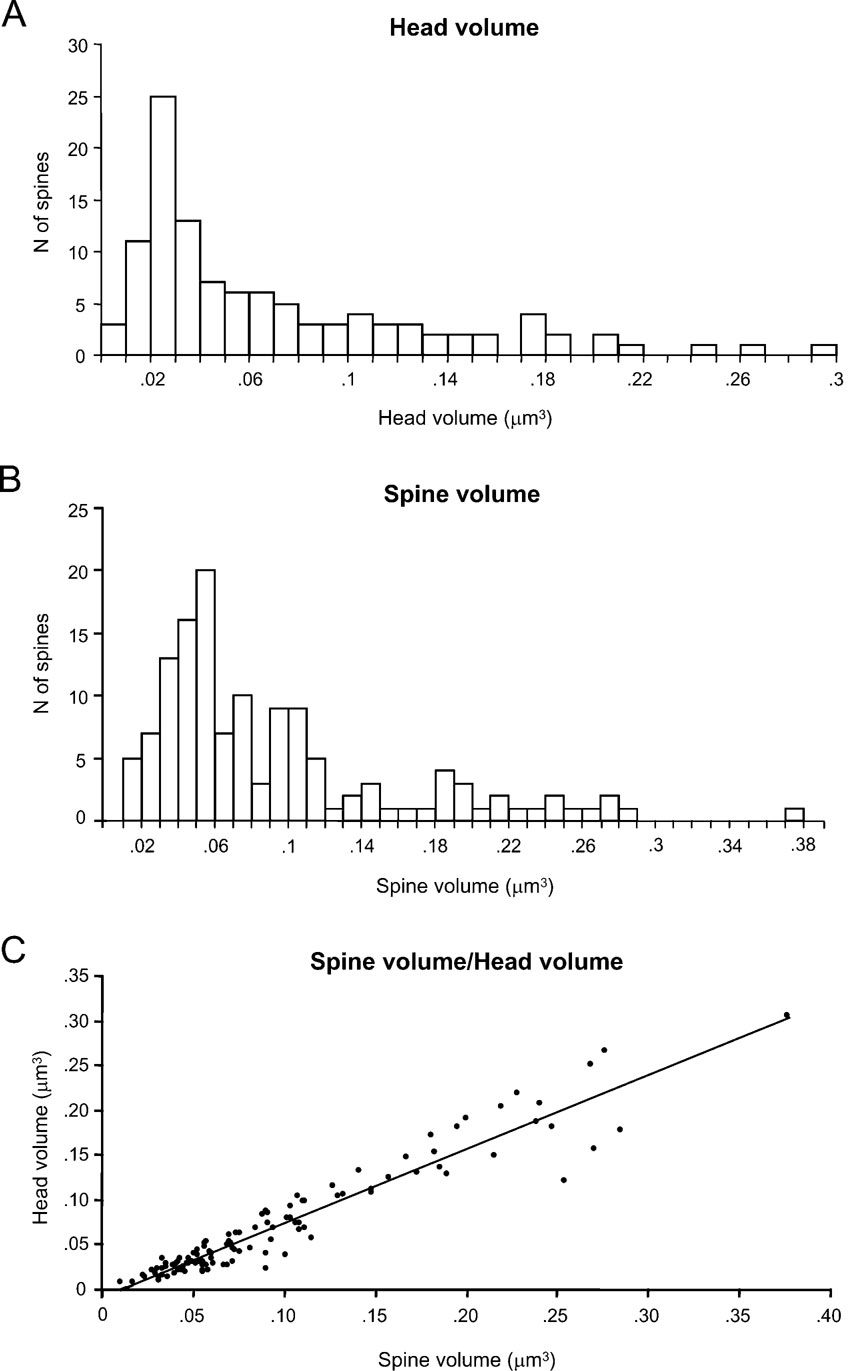
Figure 3. Analysis of spine volumes.
We also analyzed the total spine volume, that is the combination of spine head and spine neck volumes (Figure 3 B). Total spines volume averaged 0.09 ± 0.07 μm3 and ranged from 0.01 to 0.38 μm3 (n = 133). The mode peak value was 0.06 μm3. The overall shape of the distribution of spine total volumes was similar to that of spine head volume. This is to be expected, given that the spine head dominates most of the spine volume. Indeed, both parameters were highly correlated (Figure 3 C; r = 0.93; p < 0.0001, n = 110).
Analysis of Spine Neck Lengths and Diameters
We then turned our attention to the analysis of the morphology of the spine neck, focusing on two morphological parameters: the total neck length and the neck diameter (Figure 4 ). Since the diameters of the necks were not constant along its length, for each spine we estimated the average diameter (see Materials and Methods).
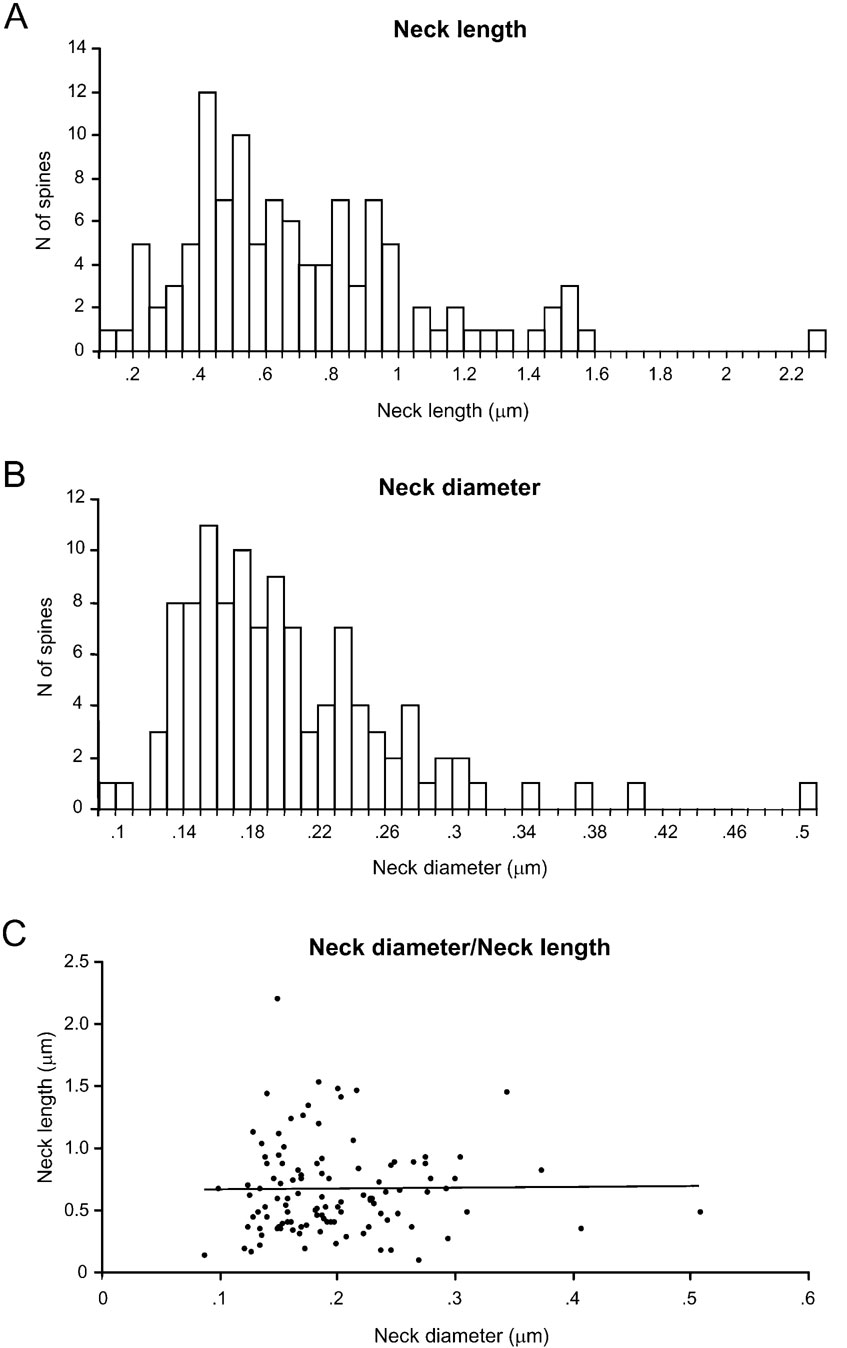
Figure 4. Analysis of spine neck diameters and lengths.
Spine neck length ranged from 0.1 to 2.21 μm, with an average value of 0.66 ± 0.37 μm (n = 110), and displayed a broad, asymmetrical distribution, with a blunt peak at about 0.45 μm and a long tail of longer necks (Figure 4 A). Spine neck diameters ranged from 0.09 to 0.51 μm, with an average value of 0.2 ± 0.06 μm (n = 110) and a distribution similar to that of spine neck lengths (Figure 4 B).
We then examined the potential correlation between the spine neck length and diameter, finding that there was not significant correlation between them (Figure 4 C; r = 0.06; p = 0.55, n = 110). Thus, for each spine it appears that the spine neck and its diameter are independently regulated.
Analysis of PSD Areas
PSD areas ranged from 0.01 to 0.33 μm2, with an average value of 0.08 ± 0.06 μm2 (n = 133). Their distribution was broad (Figure 5 A), with a clear peak at 0.05 μm2 and again displaying a long tail for larger synapses.
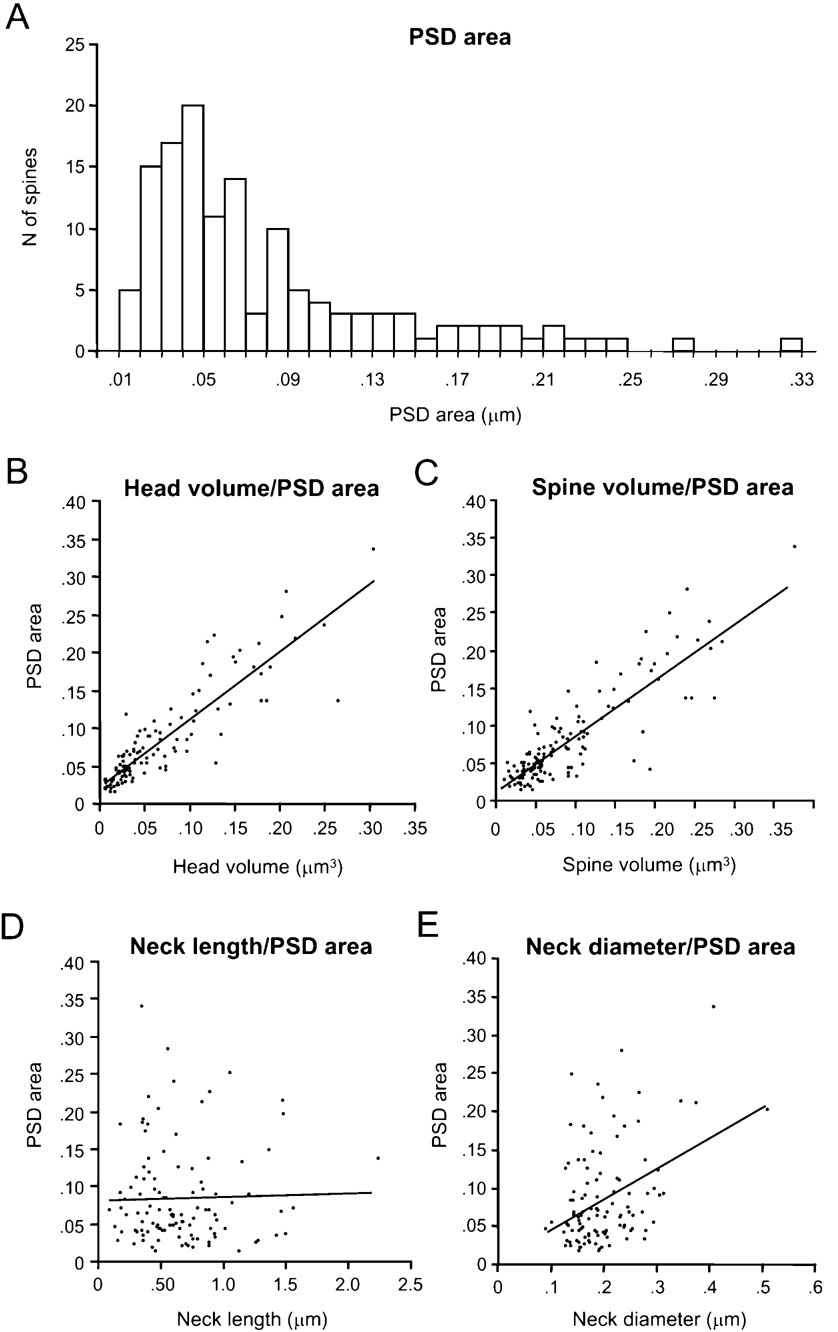
Figure 5. Analysis of spine PSD areas.
Most of the synapses presented a single PSD surface, but 20% were complex and exhibited perforations. A strong correlation between the surface area and the complexity of the PSD was found, such that simple synapses exhibited on average 0.06 ± 0.06 μm2 of PSD surface (n = 106), while complex synapses averaged 0.14 ± 0.04 μm2 and 0.19 ± 0.08 μm2 for single perforated (n = 17) and multiperforated (n = 7) PSDs, respectively. Only three segregated PSDs were found with an average surface of 0.17 ± 0.04 μm2.
A spine apparatus was present in approximately 60% of stubby and headed spines, but only in 4 out of the 14 spines without a clear head. The presence and extension of the spine apparatus was clearly correlated with the PSD surface (r = 0.71; p < 0.0001) and with the complexity of the synapse, with 96% of the perforated (complex) synapses having spine apparatus as compared with only 40% of macular (simple) synapses.
We examined whether there was any correlation between head volume and synaptic area. Indeed, as reported (Harris and Stevens, 1989 ; Schikorski and Stevens, 1999 ), we detected a significant correlation between both variables, with a r = 0.88; p < 0.0001, n = 110; Figure 5 B). As one would expect from the correlation between head volume and spine total volume, a similar correlation was found between the PSD area and the spine total volume (Figure 5 C; r = 0.79; p < 0.0001, n = 133). As suspected from the correlation between synapse surface and complexity, there was also correlation between the head volume of the spines and the complexity of the PSD.
We also examined whether the PSD area was correlated with the morphological parameters of the spine neck. The neck length (Figure 5 D) was not correlated with the PSD area (r = -0.05; p = 0.62, n = 110), but the neck diameter showed a weak correlation (r = 0.28; p < 0.005, n = 110; Figure 5 E). Further analysis indicated that this weak correlation was product of the moderate correlation between neck diameter and the PSD surface present in apical dendritic spines (r = 0.66; p = 0.0006; n = 23), that was diluted by the lack of correlation in basal dendritic spines (r = 0.11; p = 0.35; n = 79). Similar results were found when analyzing the correlation between PSD area and the estimated cross-sectional area of the neck (assuming a circular cross-section), since the electrotonic filtering of the spine neck should be inversely proportional to the square of the radius of the neck (not shown). These differences suggest a different design of apical and basal dendritic spines.
Correlation Between Spine Head and Neck Morphological Variables
We wondered whether there was a potential coregulation of the spine head and neck morphologies, as if, for example, spines with bigger heads had longer or perhaps thicker necks. For this purpose, we plotted the spine head volume versus neck length and diameter (Figures 6 A and B). In this analysis we did not detect correlation between head volume and neck length (r = -0.05; p = 0.61, n = 110), although there was a weak correlation between head volume and neck diameter (r = 0.22; p < 0.05, n = 110). Again, more detailed analysis revealed that this correlation was due to a moderate correlation between the head volume and the neck diameter of apical spines (r = 0.66; p < 0.001; n = 23), obscured by the lack of correlation of those variables in basal spines (r = 0.02; p = 0.73; n = 79). Similarly, the neck length was not correlated with the total spine volume (r = 0.18; p = 0.064; n = 110; Figure 6 C). However, the neck diameter showed a weak correlation with the total spine volume (r = 0.39; p < 0.0001, n = 110; Figure 6 D). As expected from the strong dependence of spine volume on head volume, this correlation between the neck diameter and the spine volume was again due to a strong correlation present in apical spines (r = 0.74; p < 0.0001, n = 23), that was absent in basal spines (r = 0.20; p = 0.08, n = 79).
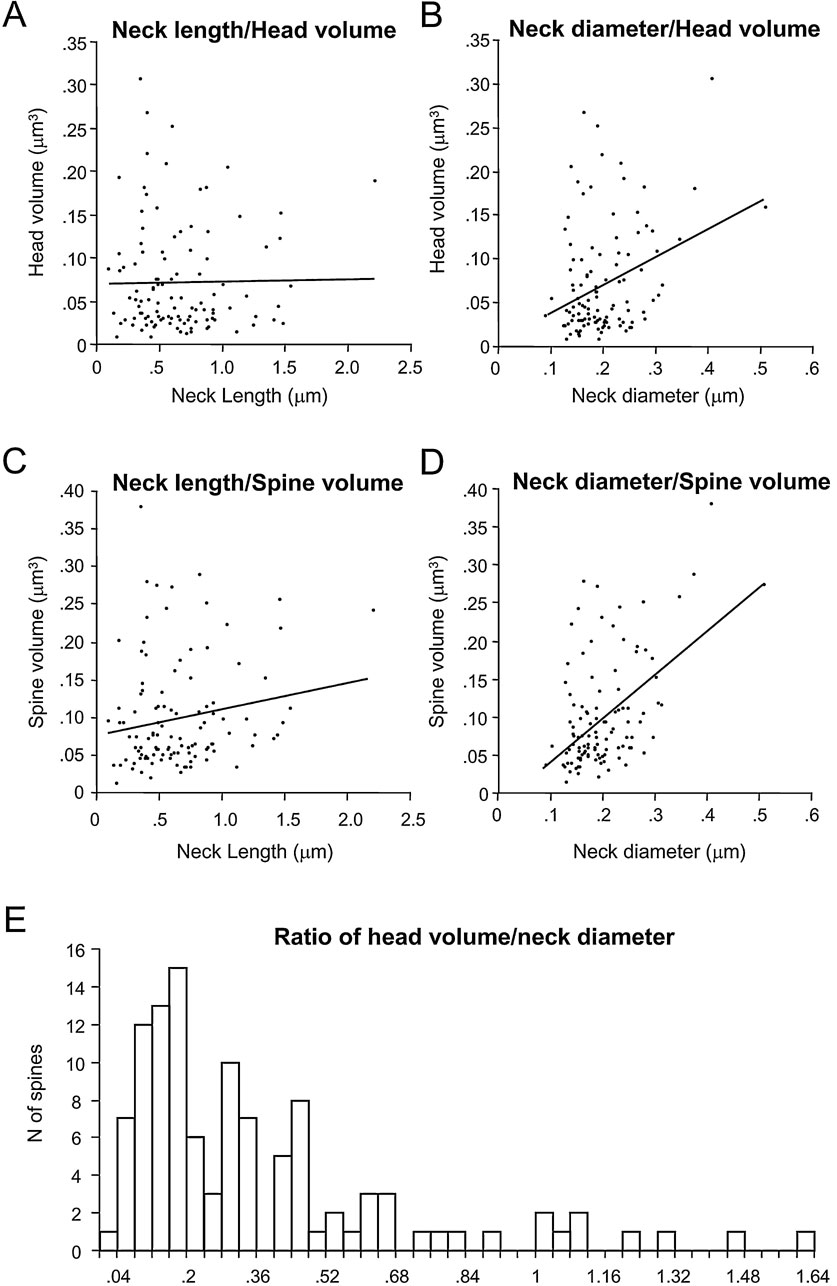
Figure 6. Correlation between spine head and neck variables.
Similar results were obtained when analyzing the morphological parameters of the spine head versus the cross-sectional area of the neck: there was a weak correlation between this variable with the head and spine volume, a correlation that was determined by the strong correlation present in apical spines (not shown).
The relation between spine head volume and neck diameter has been used by Harris and coworkers to quantitatively differentiate among different morphological types of spines (Harris et al., 1992 ; Harris and Kater, 1994 ). In our analysis of head volume versus neck diameter (Figure 6 B), however, we were not able to detect clear segregation in our samples. Nevertheless, to better explore whether such categories were also present in our database, we computed the ratio of spine head volume to neck diameter and plotted the distribution of those ratios (Figure 6 E). This distribution, like the distribution of other morphological variables measured (Figures 3 A, B, 4 A, B and 5 A), had a single peak with a long tail toward the higher ratios, but without a clear evidence for bi- or multimodality.
Lack of Correlation Between Spine Morphological Variables and Distance to the Soma
Finally, we examined whether any of the measured morphological variables of the spines was correlated with the distance from the soma, an effect that has been reported in previous studies. Specifically, in neocortical pyramidal neurons, Jones and Powell, described that spines that were further away from the soma were longer and had larger heads (Jones and Powell, 1969 ). Moreover, in CA1 pyramidal neurons, Megias et al. reported that the spines located in the distal portions of the apical dendrite had larger heads (Megias et al., 2001 ). In fact, in our own previous light microscope studies, we also detected a similar effect in Golgi-impregnated CA1 pyramidal neurons, albeit not in neocortical pyramidal cells from layers 2/3, 4, 5, and 6 (Konur et al., 2003 ). Unfortunately, the relatively low resolution of the light microscope may have limited our ability to detect this correlation. Thus, in the present study, we used our ultrastructural reconstructions to re-examine this possibility again both quantitatively and systematically.
In our sample of spines from layer 2/3 pyramidal neurons, no significant relation was found between distance from the soma and spine head volume (Figure 7 A; r = 0.03; p = 0.74, n = 100), total spine volume (Figure 7 B; r = 0.12; p = 0.17, n = 123), PSD area (Figure 7 C; r = 0.02; p = 0.85, n = 123), spine neck length (Figure 7 D; r = 0.09; p = 0.376, n = 100) and neck diameter (Figure 7 E; r = 0.03; p = 0.76, n = 100). This analysis was applied also to apical and basal spines separately, with similar results. Thus, the position of the spines along the length of the dendritic tree of layer 2/3 pyramidal neurons appears unrelated to the mechanisms that control the morphology of spines.
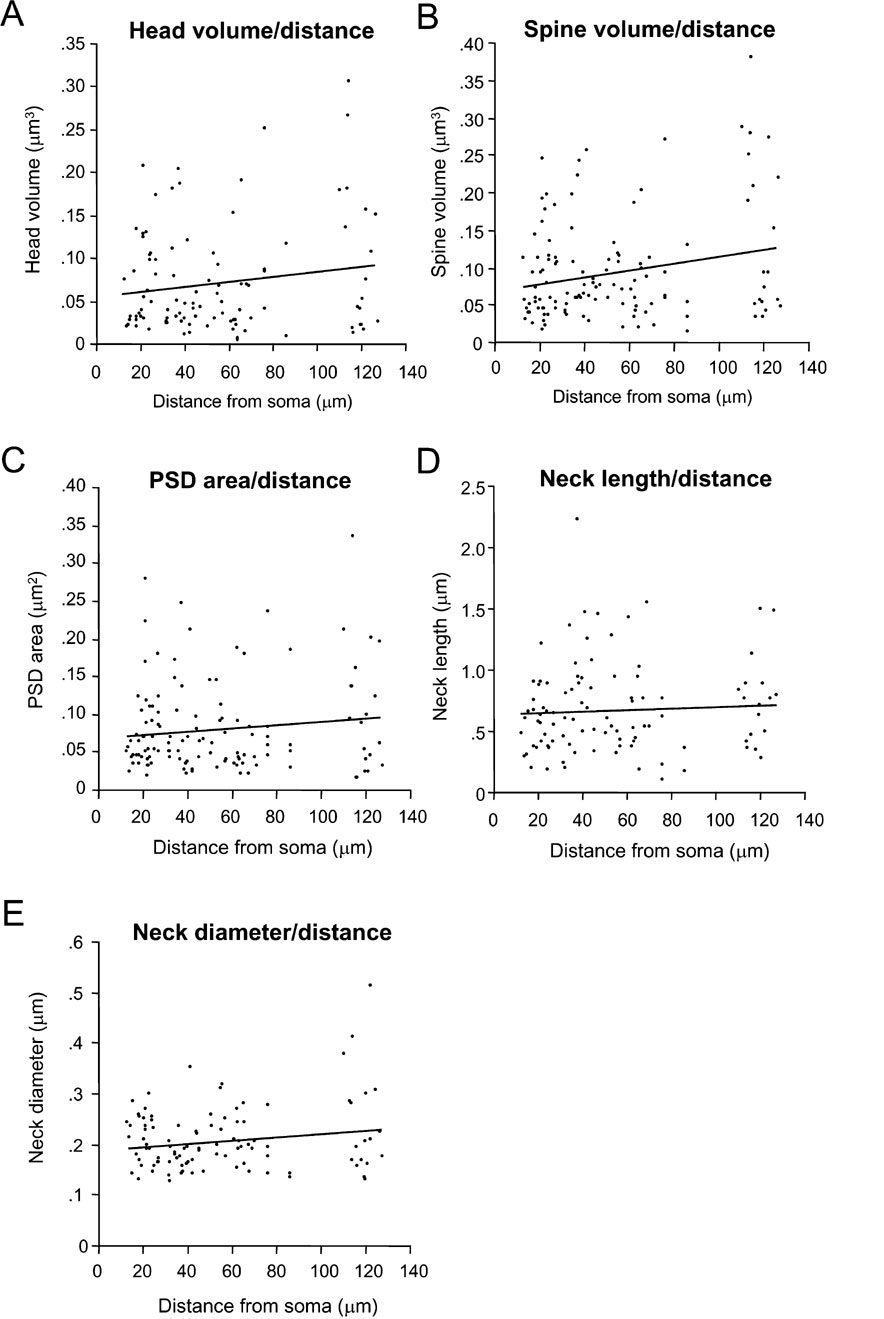
Figure 7. Lack of correlation between spine morphology and distance to soma.
Discussion
In this study, we present the results from complete three-dimensional reconstructions of a sample of spines from one of the most common neuronal types in the neocortex, the layer 2/3 pyramidal cell. Quantitative morphological analysis appears to us to be of essential importance, not only because it is necessary to know and understand the structure of the basic types of neocortical neurons but also, because the exact morphologies of the spines could be intricately related to their function (Yuste et al., 2000 ). In terms of techniques, we chose a combination of light and electron microscopy approach that enabled us to select spines from identified neurons, without obscuring the postsynaptic densities with opaque deposits.
A Continuum of Spine Morphological Types
One of the goals of our study was to obtain objective criteria to distinguish between spine types, given that the classification of spines into different morphological subgroups, (such as thin, mushrooms, and sessile/stubbies) is, on the one hand, common in the literature, yet at the same time, there is a dearth of objective quantitative criteria on which these classifications are based. In our sample, by visual inspection, the classification of the spines into these traditional categories was not possible, with many spines having intermediate characteristics. In fact, Peters and Kaiserman-Abramof indicated that some spines had intermediate forms and were difficult to classify according to their criteria (Peters and Kaiserman-Abramof, 1970 ), and this observation has been consistently stressed in other studies using serial section analysis of neocortical (Spacek and Hartmann, 1983 ), striatal (Wilson et al., 1983 ) and hippocampal spines (Harris et al., 1992 ; Harris and Kater, 1994 ; Trommald and Hulleberg, 1997 ). For example, Spacek and Hartmann defined two additional classes of spines with intermediate morphologies between stubby and mushroom, and thin and mushroom (Spacek and Hartmann, 1983 ).
An objective method to segregate spine types was proposed by Harris and coworkers (Harris et al., 1992 ; Harris and Kater, 1994 ), based on the graphical segregation of plotting the neck diameter versus the head volume. Unfortunately, in our sample this method still did not yield segregated spine types, with the majority of spines distributed as a continuous and unimodal distribution of ratios (Figure 6 E), confirming the presence of intermediate shapes between the typical stubby, thin and mushroom shapes and the lack of clear statistical grouping of the data. Our results thus differ from those of Harris et al. (1992) , although these differences could be related to the different species and cell types studied (for Harris et al: rat CA1 vs. mouse neocortex in our sample).
Indeed, perhaps the most striking feature of the morphologies of spines analyzed was the continuum of their variability in shape and size. No clear subgrouping of spines could be detected in the distributions of morphological variables, which were unimodal with asymmetric tails (Figures 3 4 5 6 ). While it could be argued that the distribution of some spine morphological measurements could occasionally display potential multimodal features, the number of spines per bin in our sample was still relatively small. Therefore, we do not put too much weight on the statistical significance of these peaks and would propose instead that the traditional classification of spines according to their shape do not apply to the sample studied. Nevertheless, we cannot rule out that the gathering of further data, or perhaps the use of a more sophisticated analysis, could reveal different types of spines.
Comparison with Previous Work
Given the large variability encountered, our measured values of spine head volumes and neck sizes are within the range of previously reported estimates in the literature. Spacek and Hartmann (Spacek and Hartmann, 1983 ) studied also the spines of the mouse visual cortex, although their results are not readily comparable with ours, since they did not analyzed identified neurons, or measured spine head and neck parameters separately. These authors reported values for the spine length and neck diameter (1.5 and 0.23 μm, respectively) that are very close to the ones we report here; however, other parameters such as spine volume or synaptic active zone (0.21 and 0.21 μm2, respectively) are more than double of our measurements. These differences can probably be explained by the different methodology employed in both studies, considering that they analyzed spines located in layers 1 and 2, therefore, potentially belonging to terminal dendritic branches of pyramidal cells, whose spines could be larger than those of proximal dendrites (Jones and Powell, 1969 ). Moreover Spacek and Hartmann might have studied spines from layer 5 pyramidal neurons, that are on average bigger than those from layer 2/3 pyramidal (Konur et al., 2003 ). Freire (Freire, 1978 ) studied spines of layer 4 neurons in visual cortex of 19 days old mice, and reported average volumes of 0.12 μm3 for the spines, and an area surface of 0.14 μm2 for the PSD, values also higher than ours. However, our averages of 0.09 ± 0.07 μm3 spine volume, 0.07 ± 0.06 μm3 spine head volume, 0.08 ± 0.06 μm2 PSD area, 0.66 ± 0.3 μm spine neck length, and 0.2 ± 0.06 μm spine neck diameter are comparable to published averages from rat CA1 pyramidal cells (0.06 ± 0.08 μm3 spine volume; 0.05 ± 0.07 μm3 head volume; 0.069 ± 0.08 μm2 PSD area, 0.45 ± 0.29 μm neck length, and 0.15 ± 0.06 μm neck diameter; (Harris and Stevens, 1989 )) and mouse CA1 pyramidal neurons (0.038 ± 0.036 μm3 spine volume and 0.043 ± 0.31 μm2 PSD area; (Schikorski and Stevens, 1999 )) and layer 1b olfactory pyramidal cells (0.071 ± 0.073 μm3 spine volume; 0.1 ± 0.87 μm2 PSD area; (Schikorski and Stevens, 1999 )). Moreover, our measurements are also in the range of values that we previously estimated from light microscopy analysis of spines from layer 2/3 pyramidal cells from mouse visual cortex (0.42 ± 0.129 μm average head diameter in (Konur et al., 2003 ); 0.67 ± 0.01 μm length neck in (Benavides-Piccione et al., 2002 )).
Moreover, we have encountered a clear statistical correlation between spine head volume and the area of the PSD, as previously reported. Like in rat hippocampal pyramidal neurons (Harris and Stevens, 1989 ) and mouse CA1 pyramidal neurons and olfactory cortical cells (Schikorski and Stevens, 1999 ), our sample of mouse pyramidal neurons also display this correlation. If indeed, the volume of the spine head is proportional to the synaptic strength or to the release probability, our data would imply that there is a large heterogeneity of synaptic strength and release properties in a layer 2/3 mouse pyramidal neuron, in agreement with the electrophysiological distributions of miniature potentials and release probabilities (Bekkers et al., 1990 ).
Relation Between Spine Head and Neck Morphological Variables
We encountered that there is no clear correlation between the spine head volume and spine neck length. This finding is consistent with our previous estimates from light microscopy level analysis of spines from mouse layer 2/3 pyramidal cells, where we also found a lack of correlation between spine neck length and head volume (Benavides-Piccione et al., 2002 ). Interestingly, the morphology of the spine appears to be controlled, at least in part, by the Rho family of small GTPases (Luo, 2000 ; Tashiro and Yuste, 2003 ), and different GTPases could affect differentially the spine neck length, without significantly altering the spine head. Specifically, C3 transferase, a blocker of Rho1, produces the elongation of the neck of the spines whereas Rho V14, a constitutively active form of Rho, appears to specifically shorten the spine neck (Tashiro et al., 2000 ). Therefore there could be molecular mechanisms that independently control the neck length or head volume.
Also, we found no correlation between the morphology of the PSD and that of the neck length (Figures 5 D and E). This agrees with the lack of correlation between head volume and neck length (since the PSD area is correlated with the head volume), and indicates that the effect of the neck length in filtering membrane potentials (Araya et al., 2006b ) is independent from the regulation of the head volume or PSD size, so therefore, their contributions to shape the strength of a synapse should be considered additive.
Finally, we observed that the neck diameter exhibited a moderate correlation with the head and spine volume and with the PSD area in the apical spines, that was not present in the basal spines. This results point to an apparent morphological difference between apical and basal dendrites, and suggest a coordinated regulation of the neck diameter and synaptic strength in apical spines, that could have functional implications, since the electrotonic filtering of the neck is inversely proportional to its diameter. However, we would caution the reader that the sample of apical spines used to obtain the correlation was relatively small (n = 23), and most of those apical spines were located in a single main apical shaft (n = 18). Therefore, this relation could be product of a local effect on this particular neuron, and we cannot conclude it will be a general feature of apical dendrites. Further studies are necessary to clarify this question.
The Spine Morphology Does Not Depend on its Distance From Soma
CA1 pyramidal neurons show a larger spine size with increasing distance from the soma (Konur et al., 2003 ; Megias et al., 2001 ), as if synaptic weight was systematically compensating for the dendritic electrotonic filtering. Here, on the other hand, we find no evidence for the regulation of spine size or morphology according to the distance from the soma. None of the five morphological parameters measured (head size, spine volume, PSD area, neck length, and neck diameter) displayed any correlation with their position along the dendritic tree. Although our results would appear inconsistent with the qualitative observations of Jones and Powell in the neocortex (Jones and Powell, 1969 ) and the mentioned CA1 data (Konur et al., 2003 ; Megias et al., 2001 ), we would caution the reader that we only reconstructed spines relatively close to the soma (up to 127 μm) from layer 2/3 pyramidal cells. Therefore it is possible that spines located in the distal dendritic tree, or spines from other types of neocortical pyramidal neurons, could be different. For example, the reported increase in spine volume with increasing distance from the soma that occurs in CA1 pyramidal cells was only significant in the very distal tips of the apical dendritic tree, once it enters the stratum oriens (Konur et al., 2003 ; Megias et al., 2001 ). Nevertheless, we would remark that Konur et al also did not detect any significant modulation of spine size versus distance in mouse neocortical pyramidal neurons (Konur et al., 2003 ), so it is possible that neocortical pyramidal cells could be significantly different in this respect from CA1 pyramidal neurons.
Functional Implications
Our study did not explore the result of physiological manipulations on spine ultrastructure but was motivated instead to provide a baseline with which interpret these morphological changes. Moreover, because our sample of animals were raised in a caged, impoverish environment, it is possible that our results could differ when compared with animals that have been raised in enriched environments (for a review see Yuste and Bonhoeffer, 2001 ).
Nevertheless, our results provide a quantitative database of the morphologies of spines from a subtype of neocortical pyramidal neuron, and given the reported correlation between morphological and functional parameters (Araya et al., 2006b ; Harris and Stevens, 1989 ; Majewska et al., 2000 ; Schikorski and Stevens, 1999 ; Schikorski and Stevens, 2001 ; Yuste et al., 2000 ), it is interesting to speculate what our data could reveal in terms of the functional structure of the cell. At face value, the large variability along every single morphological axis studied would imply that the functional properties of neocortical spines should be expected to be equally variable. The lack of systematic correlations in these variables with respect to the position of the spine, and the morphological heterogeneity of spines even for a local small portion of the dendrite (Figures 1 and 2 ), is consistent with the idea that synapse strength is regulated locally, at the level of a single spine. This, and the great local variability in spine neck length, which, by being correlated with the calcium compartmentalization, would agree with the idea that the learning rules that operate on neocortical inputs are local, and affect input individually.
Finally, when considering our work together with that of previous studies (Araya et al., 2006b ; Dobrunz and Stevens, 1997 ; Freire, 1978 ; Harris and Stevens, 1989 ; Nusser et al., 1997 ; Nusser et al., 1998 ; Schikorski and Stevens, 1999 ; Spacek and Hartmann, 1983 ), the presence of distinct and statistically significant correlations between morphological and functional parameters, in both spine head volume, PSD size, neck length and now even neck diameter (at least in some population of spines), could enable the reconstruction of the functional map of inputs onto a given neuron. This approach, which in principle could be applied to every single dendritic spine in a given cell, could permit the systematic determination of the complete input connectivity of a neuron, an important step in understanding its computational function. Therefore, a century after Cajal, it could become particularly useful, now more than ever, to characterize morphologically the spines of single neurons, with as much detail and completeness as possible.
Conflict of Interest Statement
The authors declare that the research was conducted in the absence of any commercial or financial relationships that should be construed as a potential conflict of interest.
Acknowledgments
This work was carried out in J. D.'s laboratory at the Cajal Institute, where R. Y. was a visiting researcher. We especially thank A. Fairen and A. Espinosa for all the histological material that made this study possible. J. A., J. D. and A. F. were supported by Spanish Ministry of Education and Science (grants BFU2006-13395 and BFU2004-04660, respectively). J. A. and R.Y. were supported by the NEI and the John Merck Fund.
References
Araya, R., Eisenthal, K. B., and Yuste, R. (2006a). Dendritic spines linearize the summation of excitatory potentials. Proc. Natl. Acad. Sci. USA 103, 18779-18804.
Araya, R., Jiang, J., Eisenthal, K. B., and Yuste, R. (2006b). The spine neck filters membrane potentials. Proc. Natl. Acad. Sci. USA 103, 17961-17966.
Arellano, J. I., Espinosa, A., Fairen, A., Yuste, R., and DeFelipe, J. (2007). Non-synaptic dendritic spines in neocortex. Neuroscience 145, 464-469.
Ballesteros-Yanez, I., Benavides-Piccione, R., Elston, G., Yuste, R., and DeFelipe, J. (2006). Density and morphology of dendritic spines in mouse neocortex. Neuroscience. 138, 403-409.
Bekkers, J. M., Richerson, G. B., and Stevens, C. F. (1990). Origin of variability in quantal size in cultured hippocampal neurons and hippocampal slices. Proc. Natl. Acad. Sci. USA 87, 5359-5362.
Benavides-Piccione, R., Ballesteros-Yañez, I., DeFelipe, J., and Yuste, R. (2002). Cortical area and species differences in dendritic spine morphology. J. Neurocytol. 31, 337-346.
Chang, H. T. (1952 Cortical neurons with particular reference to the apical dendrite. Cold Spring Harb. Symp. Quant. Biol. 17, 189-202.
Colonnier, M. (1968). Synaptic patterns on different cell types in the different laminae of the cat visual cortex. An electron microscope study. Brain Res. 9, 268-87.
Diamond, J., Gray, E. G., and Yasargil, G. M. (1970). The function of dendritic spines: A hypothesis. In Excitatory Mechanisms, Proceedings of 5th Internation Meeting of Neurobiologists, P. Andersen, J. Jansen eds. (Oslo, Universitets Forlaget), 213-222.
Dobrunz, L. E., and Stevens, C. F. (1997). Heterogeneity of release probability, facilitation, and depletion at central synapses. Neuron 18, 995-1008.
Dunaevsky, A., Tashiro, A., Majewska, A., Mason, C. A., and Yuste, R. (1999). Developmental regulation of spine motility in mammalian CNS. Proc. Natl. Acad. Sci. USA 96, 13438-13443.
Fairen, A., Peters, A., and Saldanha, J. (1977). A new procedure for examining Golgi impregnated neurons by light and electron microscopy. J. Neurocytol. 6, 311-337.
Fiala, J. C. (2005). Reconstruct: a free editor for serial section microscopy. J. Microsc. 218, 52-61.
Fifkova, E. Van Harrefeld, A. (1977). Long-lasting morphological changes in dendritic spines of dentate granular cells following stimualtion of the entorhinal area. J. Neurocytol. 6, 211-30.
Fischer, M., Kaech, S., Knutti, D., and Matus, A. (1998). Rapid actin-based plasticity in dendritic spine. Neuron 20, 847-854.
Freire, M. (1978). Effects of dark rearing on dendritic spines in layer IV of the mouse visual cortex. A quantitative electron microscopical study. J. Anat. 126, 193-201.
Gordon, J. A., and Stryker, M. P. (1996). Experience-dependent plasticity of binocular responses in the primary visual cortex of the mouse. J. Neurosci. 16, 3274-3286.
Gray, E. G. (1959a). Axo-somatic and axo-dendritic synapses of the cerebral cortex: An electron microscopic study. J. Anat. 83, 420-433.
Gray, E. G. (1959b). Electron microscopy of synaptic contacts on dendritic spines of the cerebral cortex. Nature 183, 1592-1594.
Grutzendler, J., Kasthuri, N., and Gan, W. B. (2002). Long-term dendritic spine stability in the adult cortex. Nature 420, 812-816.
Harris, K. M., Jensen, F. E., and Tsao, B. (1992). Three-dimensional structure of dendritic spines and synapses in rat hippocampus (CA1) at postnatal day 15 and adult ages: implications for the maturation of synaptic physiology and long-term potentiation. J. Neurosci. 12, 2685-2705.
Harris, K. M., and Kater, S. B. (1994). Dendritic spines: cellular specializations imparting both stability and flexibility to synaptic function. Annu. Rev. Neurosci. 17, 341-371.
Harris, K. M., and Stevens, J. K. (1989). Dendritic spines of CA1 pyramidal cells in the rat hippocampus: serial electron microscopy with reference to their biophysical characteristics. J. Neurosci. 9, 2982-2997.
Hensch, T. K., Fagliolini, M., Mataga, N., Stryker, M. P., Baekkeskov, S., and Kash, S. F. (1998). Local GABA circuit control of experience-dependent plasticity in developing visual cortex. Science 282, 1504-1507.
Jack, J. J. B., Noble, D., and Tsien, R. W. (1975). Electric current flow in excitable cells. (London, Oxford University Press).
Jones, E. G., and Powell, T. P. S. (1969). Morphological variation in the dendritic spines of the neocortex. J. Cell. Sci. 5, 509-529.
Koch, C., and Poggio, T. (1983). A theoretical analysis of electrical properties of spines. Proc. R Soc. Lond., B, Biol. Sci. 213, 455-477.
Koch, C., and Zador, A. (1993). The Function of Dendritic Spines - Devices Subserving Biochemical Rather Than Electrical Compartmentalization. J. Neurosci. 13, 413-422.
Konur, S., Rabinowitz, D., Fenstermaker, V., and Yuste, R. (2003). Systematic regulation of spine head diameters and densities in pyramidal neurons from juvenile mice. J. Neurobiol. 56, 95-112.
Kozloski, J., Hamzei-Sichani, F., and Yuste, R. (2001). Stereotyped position of local synaptic targets in neocortex. Science 293, 868-872.
Lendvai, B., Stern, E., Chen, B., and Svoboda, K. (2000). Experience-dependent plasticity of dendritic spines in the developing rat barrel cortex in vivo. Nature 404, 876-881.
Llinás, R., and Hillman, D. E. (1969). Physiological and morphological organization of the cerebellar circuits in various vertebrates. In Neurobiology of Cerebellar Evolution and Development, R. Llinas, ed. (Chicago, Am. Med. Assoc. Educ. Res. Found.), 43-73.
Lorente de Nó, R. (1922). La corteza cerebral del ratón. Trab. Lab. Invest. Bio. (Madrid). 20, 41-78.
Majewska, A., Tashiro, A., and Yuste, R. (2000). Regulation of spine calcium compartmentalization by rapid spine motility. J. Neurosci. 20, 8262-8268.
Megias, M., Emri, Z., Freund, T. F., and Gulyas, A. I. (2001). Total number and distribution of inhibitory and excitatory synapses on hippocampal CA1 pyramidal cells. Neuroscience 102, 527-540.
Nusser, Z., Cull-Candy, S., and Farrant, M. (1997). Differences in synaptic GABA(A) receptor number underlie variation in GABA mini amplitude. Neuron 19, 697-709.
Nusser, Z., Lujan, R., Laube, G., Roberts, J., Molnar, E., and Somogyi, P. (1998). Cell type and pathway dependence of synaptic AMPA receptor number and variability in the hippocampus. Neuron 21, 545-559.
Paxinos, G., and Franklin, K. B. J. (2001). The mouse brain in stereotaxic coordinates, 2nd edn. (San Diego, Academic Press).
Peters, A., and Kaiserman-Abramof, I. (1969). The small pyramidal neuron of the rat cerebral cortex. The synapses upon dendritic spines. Z. Zellforsch. Mikrosk. Anat. 100, 487-506.
Peters, A., and Kaiserman-Abramof, I. R. (1970). The small pyramidal neuron of the rat cerebral cortex. The perikaryon, dendrites and spines. Am. J. Anat. 127, 321-356.
Rall, W. (1978). Dendritic spines and synaptic potency. In Studies in Neurophysiology, R. Porter, ed. (Cambridge, Cambridge University Press), PP. 203-209.
Rall, W. (1995). In The Theoretical Foundation of Dendritic Function, Segev, I. et al., eds., (Massachusetts, MIT Press).
Ramón, y., and Cajal, S. (1893). Nuevo concepto de la Histología de los Centros nerviosos (Barcelona).
Ramón, y, Cajal, S. (1899). La Textura del Sistema Nerviosa del Hombre y los Vertebrados (Madrid, Moya (Primera Edicion)).
Sabatini, B. L., Oertner, T. G., and Svoboda, K. (2002). The life cycle of Ca(2+) ions in dendritic spines. Neuron 33, 439-452.
Schikorski, T., and Stevens, C. (1999). Quantitative fine-structural analysis of olfactory cortical synapses. Proc. Natl. Acad. Sci. USA. 96, 4107-4112.
Schikorski, T., and Stevens, C. F. (2001). Morphological correlates of functionally defined synaptic vesicle populations. Nat. Neurosci. 4, 391-395.
Segev, I., and Rall, W. (1988). Computational study of an excitable dendritic spine. J. Neurophysiol. 60, 499-523.
Shepherd, G. (1996). The dendritic spine: a multifunctional integrative unit. J. Neurophysiol. 75, 2197-2210.
Spacek, J. (1985a). Three-dimensional analysis of dendritic spines. II. Spine apparatus and other cytoplasmic components. Anat. Embryol. 171, 235-243.
Spacek, J. (1985b). Three-dimensional analysis of dendritic spines. III. Glial sheath. Anat. Embryol. 171, 245-252.
Spacek, J., and Hartmann, M. (1983). Three-dimensional analysis of dendritic spines. I. Quantitative observations related to dendritic spine and synaptic morphology in cerebral and cerebellar cortices. Anat. Embryol. 167, 289-310.
Svoboda, K., Tank, D. W., and Denk, W. (1996). Direct measurement of coupling between dendritic spines and shafts. Science 272, 716-719.
Tashiro, A., Minden, A., and Yuste, R. (2000). Regulation of dendritic spine morphology by the Rho family of small GTPases: antagonistic roles of Rac and Rho. Cereb. Cortex 10, 927-938.
Tashiro, A., and Yuste, R. (2003). Structure and molecular organization of dendritic spines. Histol. Histopathol. 18, 617-634.
Trachtenberg, J. T., Chen, B. E., Knott, G. W., Feng, G., Sanes, J. R., Welker, E., and Svoboda, K. (2002). Long-term in vivo imaging of experience-dependent synaptic plasticity in adult cortex. Nature 420, 788-794.
Trommald, M., and Hulleberg, G. (1997). Dimensions and density of dendritic spines from rat dentate granule cells based on reconstructions from serial electron micrographs. J. Comp. Neurol. 377, 15-28.
Wickens, J. (1988). Electrically coupled but chemically isolated synapses: dendritic spines and calcium in a rule for synaptic modification. Prog. Neurobiol. 31, 507-528.
Wilson, C., Groves, P., Kitai, S., and Linder, J. (1983). Three-dimensional structure of dendritic spines in the rat neostriatum. J. Neurosci. 3, 383-388.
Yuste, R., and Bonhoeffer, T. (2001). Morphological changes in dendritc spines associated with long-term synaptic plasticity. Ann. Rev. Neurosci. 24, 1071-1089.
Yuste, R., and Denk, W. (1995). Dendritic spines as basic units of synaptic integration. Nature 375, 682-684.
Keywords: Pyramidal, electron microscopy, PSD, serial section
Citation: Jon I. Arellano, Ruth Benavides-Piccione, Javier DeFelipe and Rafael Yuste (2007). Ultrastructure of dendritic spines: correlation between synaptic and spine morphologies. Front. Neurosci. 1:1. 131-143. doi: 10.3389/neuro.01/1.1.010.2007
Received: 15 August 2007; Paper pending published: 01 September 2007;
Accepted: 01 September 2007; Published online: 15 October 2007
Edited by:
Idan Segev, Hebrew University, IsraelReviewed by:
Gordon M. Shepherd, Yale University School of Medicine , USAKristen M. Harris, The University of Texas at Austin, USA
Copyright: © 2007 Arellano, Benavides-Piccione, DeFelipe and Yuste. This is an open-access article subject to an exclusive license agreement between the authors and the Frontiers Research Foundation, which permits unrestricted use, distribution, and reproduction in any medium, provided the original authors and source are credited.
*Correspondence: Javier DeFelipe and Yuste, Instituto Cajal (CSIC), Ave. Dr. Arce, 37, 28002 Madrid, Spain. Tel.: +34 91 585 4735; fax: +34 91 585 4754; HHMI, Department of Biological Sciences, 1212 Amsterdam Av., New York, NY 10027, USA. Tel.: +1 212 854 2354; fax: +1 212 854 4619. e-mail: defelipe@cajal.csic.es; rmy5@columbia.edu
aPresent address: Department of Neurobiology, Yale University School of Medicine, New Haven, CT 06520, USA.