Neurosciences Sensorielles Comportement Cognition, CNRS – UMR5020 – Université Claude Bernard Lyon 1, Lyon, France
Progress in experimental tools and design is allowing the acquisition of increasingly large datasets. Storage, manipulation and efficient analyses of such large amounts of data is now a primary issue. We present OpenElectrophy, an electrophysiological data- and analysis-sharing framework developed to fill this niche. It stores all experiment data and meta-data in a single central MySQL database, and provides a graphic user interface to visualize and explore the data, and a library of functions for user analysis scripting in Python. It implements multiple spike-sorting methods, and oscillation detection based on the ridge extraction methods due to Roux et al. (2007)
. OpenElectrophy is open source and is freely available for download at http://neuralensemble.org/trac/OpenElectrophy
.
Recent developments in electrophysiology experimental techniques have lead to increases in the amount of data produced. It is now common to record continuous signals simultaneously from many electrodes with a sampling rate of 10 kHz or more. This increase in raw data flow has been accompanied by an increase in the complexity of the experimental protocol and the subsequent analyses. Indeed, each experiment is controlled by a large number of parameters that are either set by the experimenter (e.g., according to the stimuli applied or the state of the subject) or constrained by the experimental setup (e.g., electrode properties). These parameters are the meta-data associated with the experiment. A variety of new software aiming to facilitate data storage, exploration and analysis are appearing to help scientists handle such large amounts of data and experimental parameters.
Several commercial software products have been developed to tackle the increasing data management demands of state-of-the-art electrophysiology. However, as such commercial software products have not always evolved as rapidly as the needs of the field, several open source projects have appeared which are developed by the researcher community. Among them are open source software that performs commonly used analysis methods (e.g., averaging, time–frequency analysis) for analyzing magnetoencephalography (MEG) or electroencephalography (EEG) data. These programs generally have a highly developed graphical user interface (GUI). In contrast, in the field of spike sorting, various toolboxes are available, and these toolboxes usually require the researcher to write-specific scripts in order to use the toolbox for a specific set of data. Thus, there are at least two different approaches with regard to purpose and user interface in open source software design. None of the available software or toolboxes addresses the problem of how to simply and conjointly manipulate experimental data and meta-data.
OpenElectrophy was designed more as a framework for data analysis than a piece of completely frozen analysis software. For example, it is not specific to a given type of electrophysiological signal, and does not directly perform a specific type of analysis at the request of a researcher with a “point-and-click” scheme. Rather, it provides tools to facilitate data storage, exploration and analysis script writing. It gathers the best of the two open source approaches described previously, both in terms of purpose (time–frequency analysis and spike sorting) and in terms of user interface (GUI and toolboxes). In addition, it includes generic tools for conjointly manipulating both experimental data and meta-data. The project’s main philosophy has three parts: first, for each experiment, the data and meta-data are all stored in a single central database. This strategy allows for flexibility in mixing both types of data in the subsequent analyses. Second, it provides a GUI that is useful for exploring the data and detecting events of interest (oscillations or spikes). Third, it contains a library of “methods” (high-level functions) to aid in the writing of analysis scripts, both in the interfacing of these scripts with the database and in the manipulation of the data.
OpenElectrophy was developed through a collaboration of people working on electrophysiological signals, such as extra- or intracellular recordings or EEG signals. In these fields, people are especially interested in detecting and analyzing transient oscillations or neuronal spikes. When this project was started, the conjoint analysis of both spikes and oscillations could not be performed using any available software. Thus, one of the main goals of OpenElectrophy was to provide a complete and convenient way to detect spikes and transient oscillations, store all of the detected events in the same database as the original data, and then manipulate them conjointly. Subsequent analyses could then include simultaneously detected events, raw data and meta-data. We emphasize that OpenElectrophy is one of the few currently available open source tools designed to work simultaneously with spikes and oscillations.
This article presents the design and use of OpenElectrophy. It is organized into five sections. We first compare OpenElectrophy to similar projects and detail the advantages, drawbacks and differences of purpose for each project. Second, we explain how we used the database manager MySQL and the scripting language Python (and its scientific module SciPy) to construct the core architecture of OpenElectrophy. Third, we present the OpenElectrophy work flow and the general way in which it is used. Fourth, we briefly describe the spike and oscillation detection methods that are currently implemented. Last, we present an example of the standard usage of OpenElectrophy to analyze extracellular local field potential (LFP) recordings and obtain information about action potential locking on LFP oscillation.
Commercial products like Plexon
1
, Tucker Davis
2
or Spike2
3
exist for the analysis of electrophysiological signals and are in wide-spread use. We will not go into detail about these software programs, but we will point out that despite their high quality GUIs, support and continuous development, they use proprietary languages, which present barriers for code sharing and reuse, and which have limited uptake of tools being developed by the scientific computing community compared to languages such as Python. Moreover, the file format specifications are generally not available, making long-term storage or sharing of data problematic since anyone who wants to access the data needs the right software. To deal with this issue, Neuroshare
4
was created in an attempt to provide standardized libraries that can access proprietary file formats. However, Neuroshare provides only reading functionality, the code is not open source, and libraries are available only for the Windows 32 platform.
The various open source projects belong to two families: software and toolboxes for analyzing EEG or MEG data, and software for spike sorting. Few projects mix spike and spectral analyses.
In the EEG/MEG family, visible projects include EEGLab
5
, FieldTrip
6
and SPM
7
(EEG sub-package). These three projects are all written with MATLAB, have a comprehensive GUI for non-programmer users, use a homemade data format based on MATLAB structures and store data in the MATLAB file format. Their main features include analyses of event-related potentials, time–frequency analyses, independent component analyses (ICA) and 3D plotting methods. They also implement methods for source detection.
In the spike-sorting software family, most projects can be separated into two classes. The first class includes tools dedicated solely to spike sorting: WavClus
8
, Mclus
9
, Spike-O-Matic
10
and Klustakwik
11
. They do not perform any data management, but can load one or several data formats and store the results (detected spikes) in custom file formats. They generally provide only basic GUIs, except for Klustakwik, which provides no GUI. WavClus and Mclus are written in MATLAB; Spike-O-Matic is written with R; Klustakwik is a C++ library. In general, these projects were written to introduce a new spike-sorting method: WavClus is based on superparamagnetic clustering (SPC) and wavelet projection, Spike-O-Matic is based on Monte Carlo Markov Chain methods, and Mclus and Klustakwik are based on a classification expectation maximization algorithm. The second class of projects is dedicated to the analysis of spike trains: Spike Train Analysis Toolkit
12
, NeuroTools
13
, and Pandora
14
. These three projects are collections of scripts for analyzing spike trains after spike sorting has already been completed. The Spike Train Analysis Toolkit is based on MATLAB and provides functions related to entropy and information theory. NeuroTools is written in Python and provides functions for analyzing simulated datasets generated from models. Pandora is MATLAB-based; it is one of the few projects that uses the concept of a database for managing datasets, but it uses a custom-built database system written in MATLAB, as opposed to employing an established database system such as MySQL.
Finally, we must mention three projects that mix spike firing analyses and spectral analyses on an LFP signal: FIND
15
, MEA-tools
16
and Chronux
17
. These projects were all written with the same primary goal as that of OpenElectrophy: to function as a framework for sharing analyses. They provide most of the standard analysis tools and others developed more recently, all written in MATLAB, but they include no database framework or meta-data management.
OpenElectrophy was written for several reasons:
• To have a project that is useful for all types of electrophysiological signals and experiments that mix time–frequency studies, spike-sorting and spike train analyses, and that uses pre-existing scripts or toolboxes whenever possible.
• To have a project that includes various spike-sorting methods and allows the user to choose which one best fits his data.
• To have a project that directly manages data and meta-data through a MySQL database that allows for sustainable data storage. Most previously developed projects use custom-built and language-dependent file formats. MySQL is open source and well established; datasets can be accessed with many scripting languages (Python, MATLAB, Excel, R, Statistica) and with most of the traditional software used in a neuroscience laboratory.
• To have a free project that relies only on other open source projects. Most previously developed projects are based on MATLAB; it is quite contradictory to have an open source project that forces the community to pay a license to a third party (Matworks) while free alternatives exist (Python and its scientific module SciPy).
• To have the capability to quickly design a high quality GUI. This goal is achievable with PyQt, a Python wrapper for the modern graphics library Qt. This is in contrast to MATLAB, which possesses a less appropriate object-oriented programming approach and GUI toolkit.
We must emphasize that OpenElectrophy is neither a simple GUI interface nor a library of functions, but rather a combination of both, depending on what needs to be done with the data. Hence, the GUI is used mainly for data storage, visualization, and exploration; it also guides the initial analysis steps, such as the detection of events of interest (e.g., spikes or oscillations). Script writing is necessary to perform the specific analyses that are needed by the researcher. In order to make analysis writing as simple and as flexible as possible, OpenElectrophy provides Python methods to appropriately query the database and manipulate the electrophysiological data.
Finally, we must point out that at its current development stage, OpenElectrophy is primarily designed for the LFP and spike community rather than the multi-channel EEG community. For example, it does not currently include any advanced visualization tools, such as 3D scalp plot or source localization techniques.
The development of OpenElectrophy is based on two technologies: MySQL, an open source database server, and SciPy, the Python scientific module. The GUI was implemented with PyQt4. We chose to rely on these open sources projects because they are widely used and have strong support communities that ensure free availability and reliability. Moreover, they provide efficient interfaces with other scripting or compiled languages (e.g., MATLAB, R, C/C++, Statistica, Excel). These interfaces are important to allow for interaction with previously developed methods from other open source projects. Lastly, Python is an object-oriented language that is well adapted to developing long-term projects with highly structured designs, thus facilitating collaboration between developers and users.
In this section, we present a summary of the core architecture of OpenElectrophy. In particular, we show how MySQL and Python are used to help fulfill OpenElectrophy’s goals.
MySQL
Briefly, as a reminder, it should be stated that the intrinsic concept of a database system is a collection of tables. Each table has a collection of fields of different types. Tables are linked to one another by indexes or keys. Putting data into a database is equivalent to splitting it up in an atomic way and organizing it into different tables. The logical or hierarchical organization between tables is not known a priori, but is formed while exploring the data, as opposed to file systems, which are organized into directories and sub-directories with a fixed organization. Thus, it is possible to have multiple views of the same database. This mechanism, while apparently basic, proves to be flexible and efficient. To work with this system, the user must learn structured query language (SQL). This language permits the user to reconstruct, filter and sort the data. The user can also add fields or tables at a later point without affecting previous work.
A crucial point is the design of the table’s schema: the list of tables, and their contents and links. The idea was to design a generic core schema that can deal as naturally as possible with any electrophysiological dataset. In electrophysiology, people manipulate two main types of signals: continuous signals, which come from electrodes, and discrete or stepwise signals such as triggers or time events, which come from the context of the data acquisition (e.g., stimulus, subject states). Based on this requirement, the core schema that was chosen for OpenElectrophy is detailed in Figure 1
. The three central tables are trial, epoch and electrode. The table trial includes a coherent recording of continuous or discrete events. The table electrode holds the raw continuous signals from each physical electrode. The table epoch manages all discrete events: trigger times, periods of stimulation, animal states or event markers. These three tables can accommodate a generic electrophysiological recording. The tables spike, spiketrain and cell were then added to manage neuron spike discharge. The table oscillation manages transient oscillatory events in the LFP.
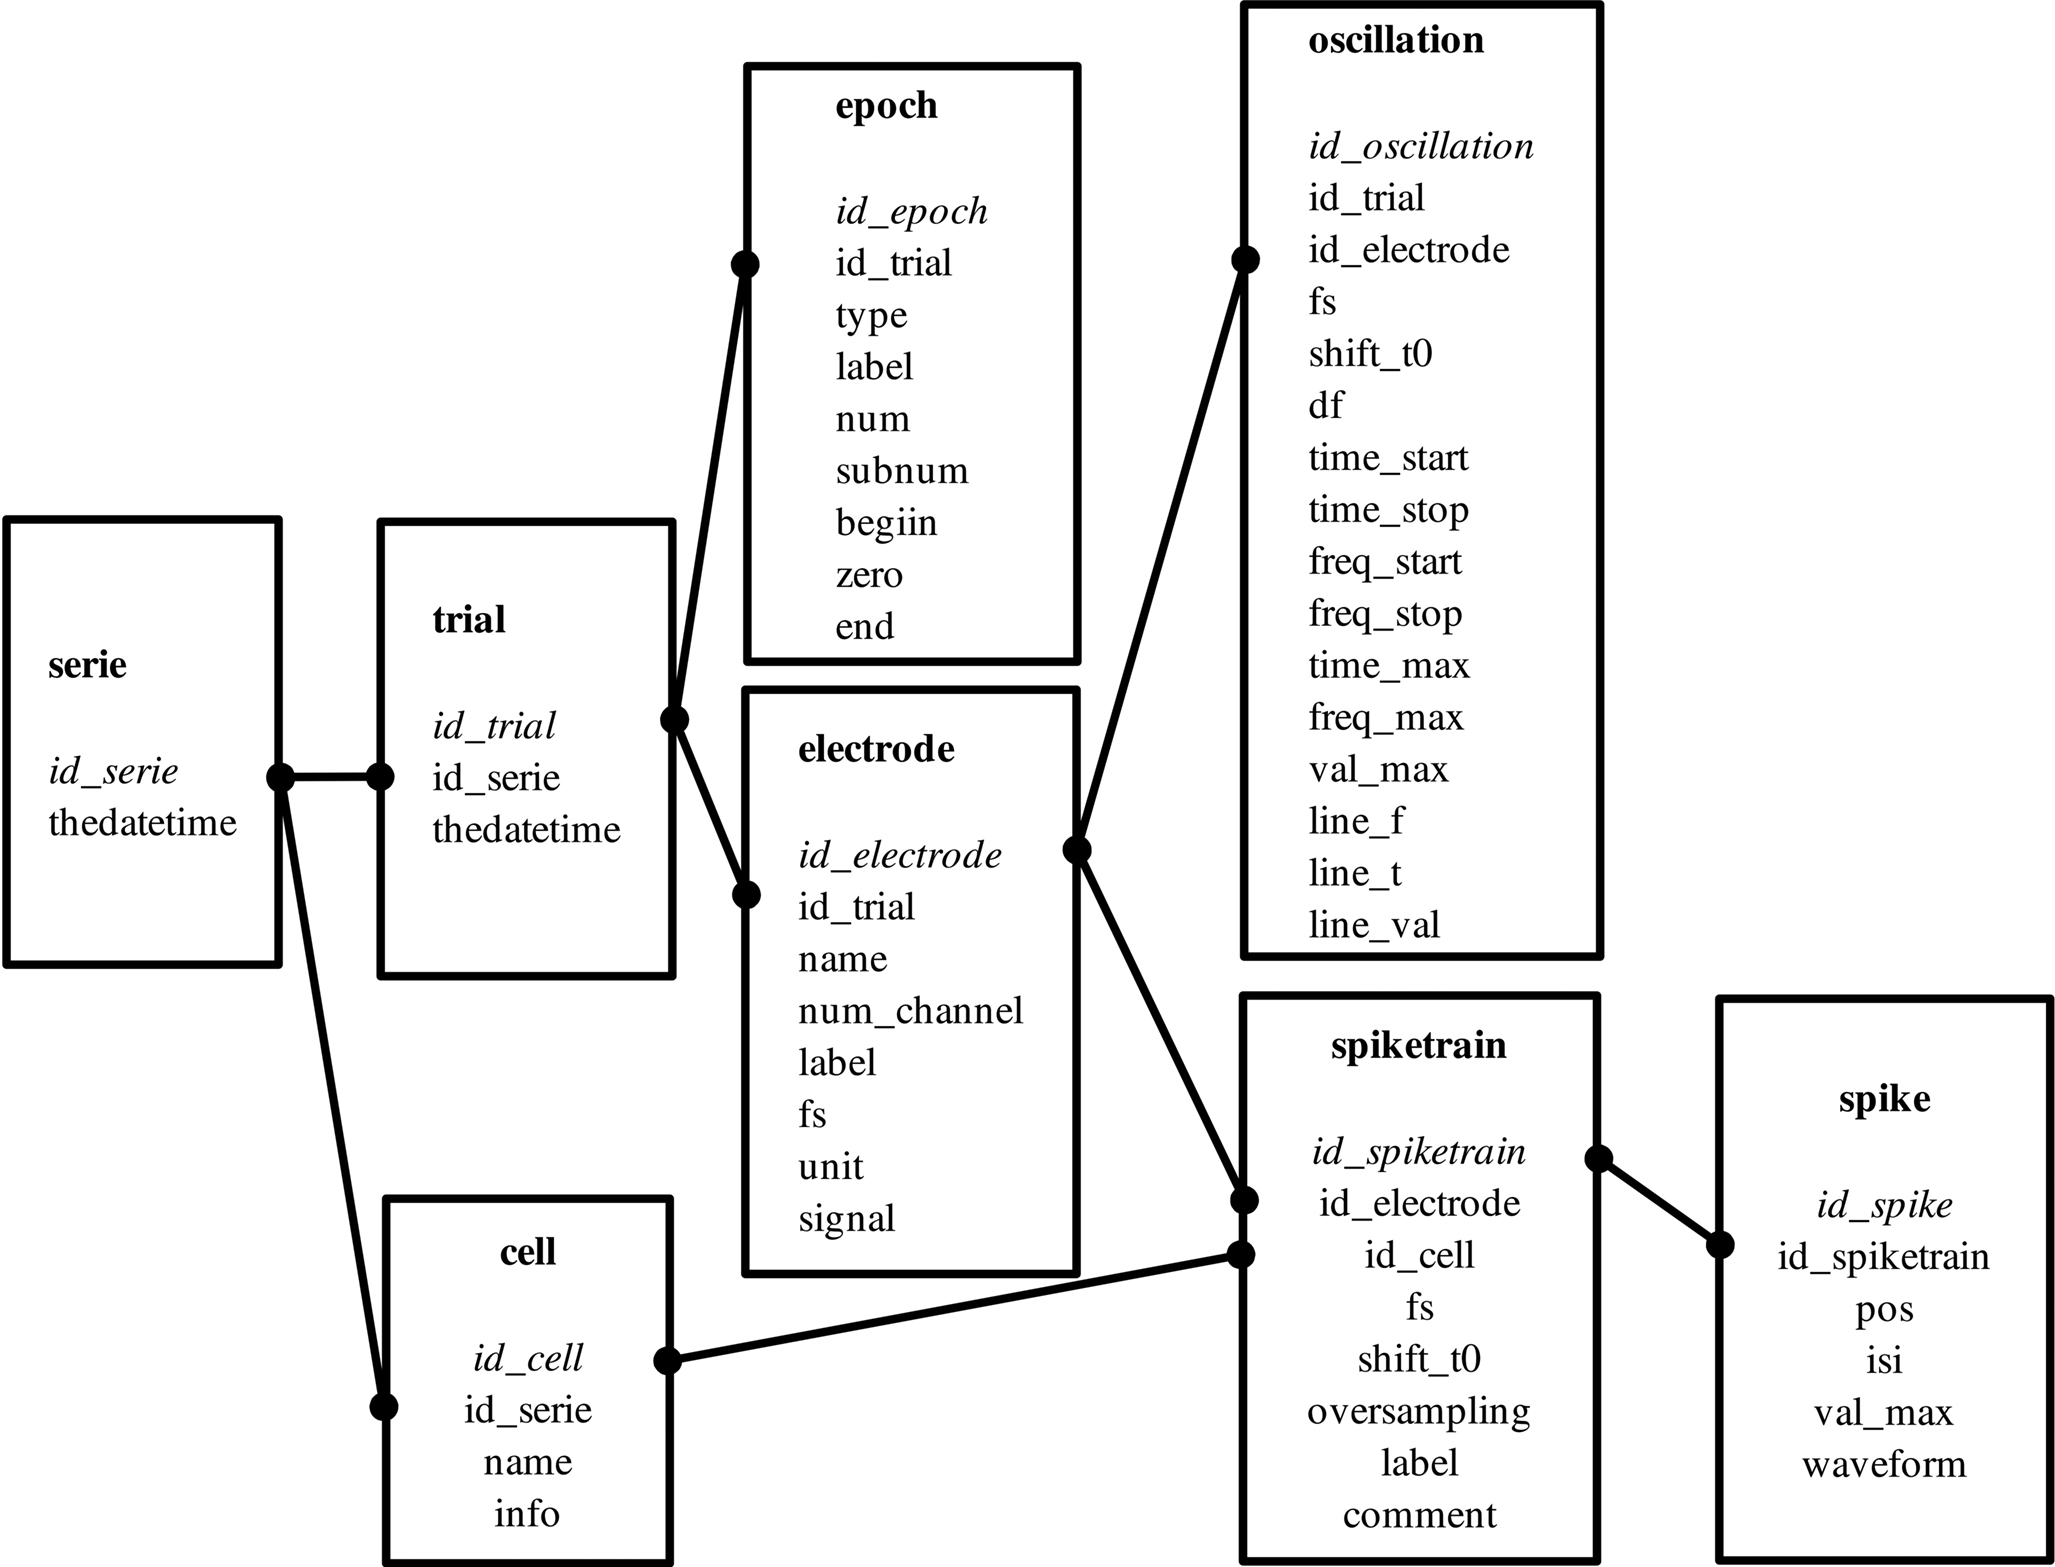
Figure 1. Database schema. This is a classical relational design. Each frame corresponds to a table that holds all of the properties of an element in its fields. For example, the table spike holds for each spike its own index (id_spike), the index of the spike train it belongs to (id_spiketrain), its position (pos), the maximum amplitude (val_max) and its raw waveform (waveform). All of the tables and fields are natively generated by OpenElectrophy; the schema is flexible and extensible to accommodate specific needs. The core of the schema includes the trial, electrode and epoch tables. A trial is a combination of several simultaneous coherent recordings. These recordings are continuous or discrete, and are stored in the electrode or epoch tables, respectively. Additional tables are as follows. The series table, which gathers a set of trials (e.g., those recorded in the same location). The spike table contains all detected spikes and their positions and shapes. The spikes are grouped according to their spike train (there may be many spike trains per electrode). The cell table groups spike trains that were recorded from the same cell but in different trials; thus, the cell table groups them relationally. Finally, the oscillation table contains all of the information related to transient oscillatory events (see Section “Oscillation Extraction”).
This schema has already been proven to be flexible enough to fit several types of experimental setups, such as one-cell intracellular recordings, extracellular multi-electrode recordings, short- or long-protocol recordings, LFP studies, multiple repetitions of stimuli, and animal behavior data. For each experiment, this design is at the core of the data management; however, each new study usually requires a short extension of the table schema. Extra fields commonly need to be added to the original tables, and new tables must sometimes be added to address new concepts such as animal position or heartbeat. The versatility of the database allows for this kind of customization without interfering with the core of OpenElectrophy.
Today, many data manipulation tools include an SQL interface; MySQL is a kind of “universal” data format that does not depend on a particular language. Another advantage of this type of data storage is the MySQL client/server design. Indeed, all of the data is collected on a single server that is simultaneously accessible by many users of OpenElectrophy (or other tools). This access does not need to be local, such that collaborations between labs working on the same dataset are possible. We note here that transferring large sets of raw data over the Internet can take a prohibitively long time, but it is generally not a problem to transfer only discrete events such as spike times (also present in the database), which can be done by using appropriate SQL queries. Another benefit of the database scheme is that each time someone makes a new entry into the database (e.g., raw data or meta-data, spikes, oscillations, a new field with a specific type of information), that information is immediately available to all of his collaborators. Lastly, MySQL offers many efficient backup capabilities (from single global or partial transfers of the whole database to continuous incremental saves) to secure the data or make them portable.
Python
Python is a high-level object-oriented programming language. It is available for a wide range of platforms and comes with a large collection of libraries (modules). For scientists and engineers dealing with computing, one of the most interesting Python modules is SciPy. This module provides N-dimensional array manipulation with the NumPy module and a fast implementation of an extensive set of scientific algorithms, such as filtering, statistics, interpolation, and linear algebra. For neuroscience studies that generate increasingly large datasets, Python is the equivalent of a Swiss army knife.
Using MySQL to explore and select data is efficient, but creating a table schema and inserting or modifying data is a repetitive and tedious task with pure SQL. Object-relational mapping (ORM) is a technical programming method that converts between a database and a Python object. Thus, OpenElectrophy incorporates a custom-built ORM to simplify read/write database access (see Section “A Typical Use-case” for an example of its use). This SQL mapper, a Python class included in OpenElectrophy, allows the user to declare a table structure with field names and types with only a few lines of code. Each instance of this class can directly map onto all of the fields of a table entry. Each SQL field becomes a member of the class instance. There are two methods (load_from_db and save_to_db) for automatically loading or saving all fields from the database without writing any SQL. The conversion from Python types to MySQL types is straightforward for basic types (int, float, str). For numpy.array (the basic type for N-dimensional arrays of the SciPy module), the conversion is automatically done by OpenElectrophy in three fields: one blob field for the buffer of the array, one field for the dimensions and one for the array element type. Thus, the user can store vectors or matrices in MySQL, which is normally not allowed. Each MySQL table corresponds to a specific Python class that inherits the SQL mapper base class and that implements methods that are specific to the table content. For example, the Electrode class can query the electrode table and implements different plotting methods (raw or filtered signals and time–frequency maps).
As a further example, the SpikeTrain class offers methods for reconstructing a spike train in different ways, such as a vector of time stamps, as sample indexes, as intervals or in Boolean form for information theoretical methods. Of course, all of these methods directly query the spike table, collect all individual spikes that are linked with an element of the spiketrain table and reorganize the results into the appropriate format. Three plotting methods are also available: raster, large dots superposed on the electrode signal and cumulative waveform.
Currently, only tables and fields that are present in the schema in Figure 1
are loaded by OpenElectrophy classes. Thus, additional fields or tables that are created for specific experiments must be accessed via SQL queries directly with a Python script. Alternatively, existing OpenElectrophy Python classes can be manually overloaded to take into account the new elements.
In this section, we describe the general workflow of OpenElectrophy as summarized as a series of steps in Figure 2
. Each step of the workflow is discussed in detail in turn below.
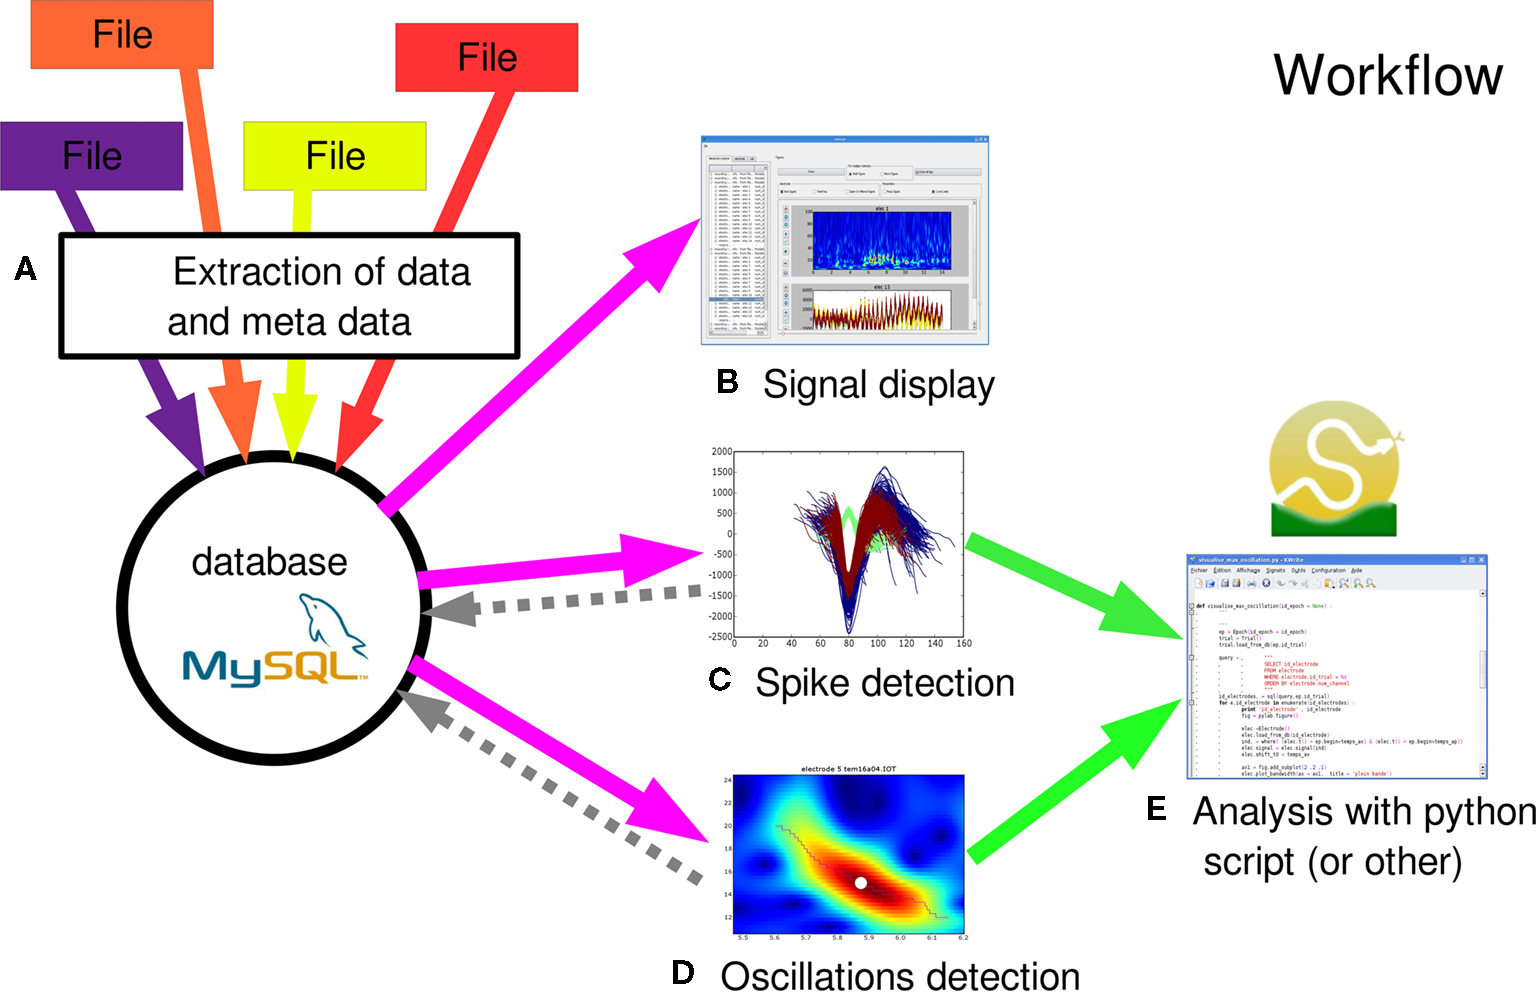
Figure 2. General work flow. The main steps for using OpenElectrophy are: (A) integration of data from a heterogeneous collection of files into the database; (B) exploration and plotting of raw signals directly from the database; (C) extraction of spikes from the raw signals and integration of these spikes into the spike, spiketrain and cell tables; (D) extraction of oscillations and integration of these oscillations into the oscillation table; (E) analysis with Python scripts using OpenElectrophy-specific classes and methods.
Data Integration
The first step of OpenElectrophy workflow involves importing data into the database. The idea is to integrate all available information into the database, including data (e.g., signal, triggers, events) and meta-data (e.g., protocol context, date, time). In so doing, during the analysis, the user no longer has to work with a heterogeneous collection of files; instead, the user works directly with the database system. OpenElectrophy is already able to integrate into the database data that is stored in different file formats, including ASCII, raw binary, Elan, TDT, Elphy, and Micromed. In the near future, many additional data formats will be incorporated. The end user can go deeper into data integration by writing new scripts that not only incorporate neural data but also setup-specific meta-data. For instance, stimulus generation software often provides lists of stimuli and context information in a clear file format. These files can be parsed and integrated during the integration of neural data. Finally, note that the database can also be directly accessed and filled or edited with a basic MySQL client editor.
At this stage, it is possible to explore the database using different hierarchical tree views and to plot raw signals (bandwidth or filtered) or wavelet-based time–frequency maps.
Spike and Oscillation Detection
The next major step is the extraction of the phenomena of interest: spikes and transient oscillatory events. In these two cases, a graphical interface helps in searching for parameters that allow for good detection. This step is crucial for subsequent stages of the analysis. There are two possible methods for detection: individual detection, which is done signal-by-signal, or bulk detection, which is done by applying the same parameters to an ensemble of signals targeted by an SQL query that is directly written in the OpenElectrophy GUI.
With regard to spike detection, methods used in OpenElectrophy will be detailed in Section “Spike Extraction”. The central idea of the framework is to store individual spike events in the MySQL spike table and group them using the spiketrain and cell tables. All studies on spike discharge will deal directly with these three tables using SQL queries, but will benefit from all of the tables when working with protocol information and context meta-data.
The oscillation detection method is based on a new approach detailed in Section “Oscillation Extraction”. The result is a list of oscillations for each signal. In this case, each oscillation is stored in the oscillation table. Thus, for studies on multi-frequency oscillatory regimes (e.g., theta, gamma, and beta bands), the analysis is computed directly in this table, although it again also benefits from the data stored in all other tables.
SQL Filtering
The ability of SQL to dynamically provide different views of the database is heavily exploited during analysis. Consequently, a basic knowledge of this language is required. Data analysis can be summarized as applying an algorithm or a statistical measure or plotting synthetic views of a subset of the data. The traditional method for analyzing data is to manipulate and aggregate the data by hand, creating a text list for each condition or factor or constructing many synthetic tables with an external knowledge of protocol factors. With SQL, this tedious work is done directly. With a few lines of code, values of interest can be rapidly and efficiently aggregated. Using SQL, there is no need to store lists, sublists or sub-sublists of data; the user only needs to store the queries and use them for each analysis. Overall, the user must manage queries that are useful for selecting data according to context and factor fields; then, the user must write new analyses in Python that can be applied to a subset of the data that is extracted with these SQL queries.
Analysis
Analysis is the final stage of the OpenElectrophy workflow, which transforms the now pre-processed data into meaningful results. The OpenElectrophy framework does not provide ready-made “point-and-click” analyses for obtaining a given result. Rather, it is necessary to write scripts in Python to perform statistical tests or other specific analyses. Here, the management of the data in a central database simplifies the selection of the data to analyze (see Section “SQL Filtering”), and the Python classes provided by OpenElectrophy ease the manipulation of the data to match a given analysis. Additionally, the Python SciPy module provides many standard and high-level analysis tools, and the Matplotlib module offers extensive 2D plotting methods.
Writing analysis scripts can seem difficult for researchers not familiar with programming, but the power and flexibility of this approach is quickly preferred over the restrictive convenience of a GUI. For example, to our knowledge none of the available software for doing spike analysis provides a GUI as an alternative to analysis scripting. Starting with simple script examples is usually sufficient to allow beginners to compose very sophisticated analyses. Thus, OpenElectrophy does not constrain data analysis with a fixed GUI, but allows for the use of user programmable scripts.
As already mentioned, a major advantage of using the Python scripting language is its ability to interface with other languages. Packages like Mlabwrap
18
, rpy
19
, cython
20
or SciPy.weave
21
enable to use pre-existent code from MATLAB, R, or C/C++. Employing these tools, the list of external modules that can be linked to OpenElectrophy to help write analysis scripts is long: the International Neuroinformatics Coordinating Facility provides a list of tools available for studying neural data
22
. In particular, OpenElectrophy, as a framework for managing data, would likely complement recent Python-based approaches to neural data studies, such as PyEntropy (Ince et al., 2009
) for information theory and PyMVPA (Hanke et al., 2009
) for machine learning.
Details on how to use OpenElectrophy classes for scripting are available on the OpenElectrophy wiki page
23
.
Spike Extraction
One crucial part of multi-extracellular electrophysiological recordings is spike detection and sorting. All subsequent interpretations rely on the accuracy of these steps. Many approaches to this challenge already exist. Some systems use in-line, real-time, and unsupervised spike sorting, while others, including OpenElectrophy, prefer off-line and semi-automatic spike sorting. There is no perfect method; a compromise must exist between fully automatic and fully supervised processing. Several numerical algorithms for spike sorting have been published. Processing can be separated into four steps: filtering, detection, decomposition (or projection) and clustering. The literature on projection and clustering is extensive (Lewicki, 1998
; Pouzat et al., 2004
; Quiroga et al., 2004
; Wood et al., 2006
). Less effort has been put into filtering and detection. These two steps cannot be neglected, however, as bad filtering directly influences spike shape, and can thereby generate strange results even with a good clustering algorithm. To overcome these difficulties, OpenElectrophy is designed in a modular way and offers several methods for each step. Thus, spike extraction can be tuned for many experimental setups, and new methods can be added to the framework by external contributors.
At the moment, the implemented algorithms are:
• Filtering: “fast Fourier transform”-based filter, Bessel, Butterworth, median sliding filter for removing slow components.
• Detection: threshold on maximum amplitude.
• Projection: principal component (PCA) of the spike shape, independent component (ICA), raw waveform shape. Wavelet projection will be implemented soon. PCA and ICA projections are done with the Modular toolkit for Data Processing, a machine learning package for Python (Zito et al., 2008
).
• Clustering: “k-means” method and “SPC” (Blatt et al., 1996
).
A future step for OpenElectrophy will be to incorporate additional spike-sorting methods developed in other open source projects (see Section “Comparisons with Other Projects and the Main Goals of OpenElectrophy”).
Oscillation Extraction
The detection of non-stationary oscillations in LFPs by OpenElectrophy is based on a new method described by S. Roux (Roux et al., 2007
). Classical studies on oscillatory phenomena have used time–frequency Morlet scalograms. The Roux method goes further to use the scalogram to extract individual oscillations with a ridge extraction method. This method is useful when signals have oscillations in different frequency bands, when oscillation frequencies shift as a function of time or when there is no a priori knowledge of the signal.
The main steps in the processing are:
• computing the Morlet scalogram
• choosing a significant threshold for the detection of oscillations
• detecting local maxima above this threshold in the frequency bands of interest
• extracting ridges point by point, starting from the maximum and continuing until the threshold is reached.
Finally, each ridge is a time–frequency line that describes a trajectory in time and frequency point by point; it is a complex number. The complex modulus estimates the energy envelope of the oscillation, and the angle from the real axis estimates its instantaneous phase.
From each extracted line, the oscillatory epoch duration and onset can be estimated, as well as the frequency, phase and amplitude evolution as a function of time. In short, this method allows for the extraction of all oscillation parameters.
This approach introduces a more intuitive and more accurate method to analyze non-stationary local fields with oscillations. Statistics can be applied, for example to the duration or frequency shift, as analyses become quantitative.
A Python class associated with a MySQL table manages all oscillations. All parameters are stored in the appropriate fields; the time–frequency line itself is directly stored as a “numpy.array”.
In this section, we will present an example of how OpenElectrophy might typically be used and demonstrate its GUI. We consider an experiment in which the extracellular LFP was recorded in the piriform cortex of an anesthetized rat. The aim of this experiment was to study the relationship between local field oscillatory activity (network level) and single unit activity (neuron level) (Litaudon et al., 2008
).
The raw signal was first saved into the database as previously explained. The next step was then to extract oscillatory events. Upon completion of the extraction, the GUI is as shown in Figure 3
A. On the left of the screen are all of the parameters that are used for detection; these parameters can be modified by the user and saved for later use. These parameters cover the time/frequency space and the precision used for the detection, as well as the threshold above which oscillations are detected (an absolute level or relative to a reference period in the same signal); in addition, some of these parameters are used to remove overlapping or unwanted short oscillations. On the right of the screen, the list of oscillations detected for this electrode is shown. Below, their trajectories are plotted superimposed both on the electrode Morlet scalogram and on the electrode raw signal (lower right of the screen). When the user is satisfied with the results, he can save it to the database. Note that in this example, the detection of oscillations was done for a single electrode. Another GUI can be used to detect oscillations for many electrodes simultaneously. In this case, the GUI presents the same parameters as for the single electrode GUI, but with an additional window in which the user may provide the SQL query to select the electrodes for detection.
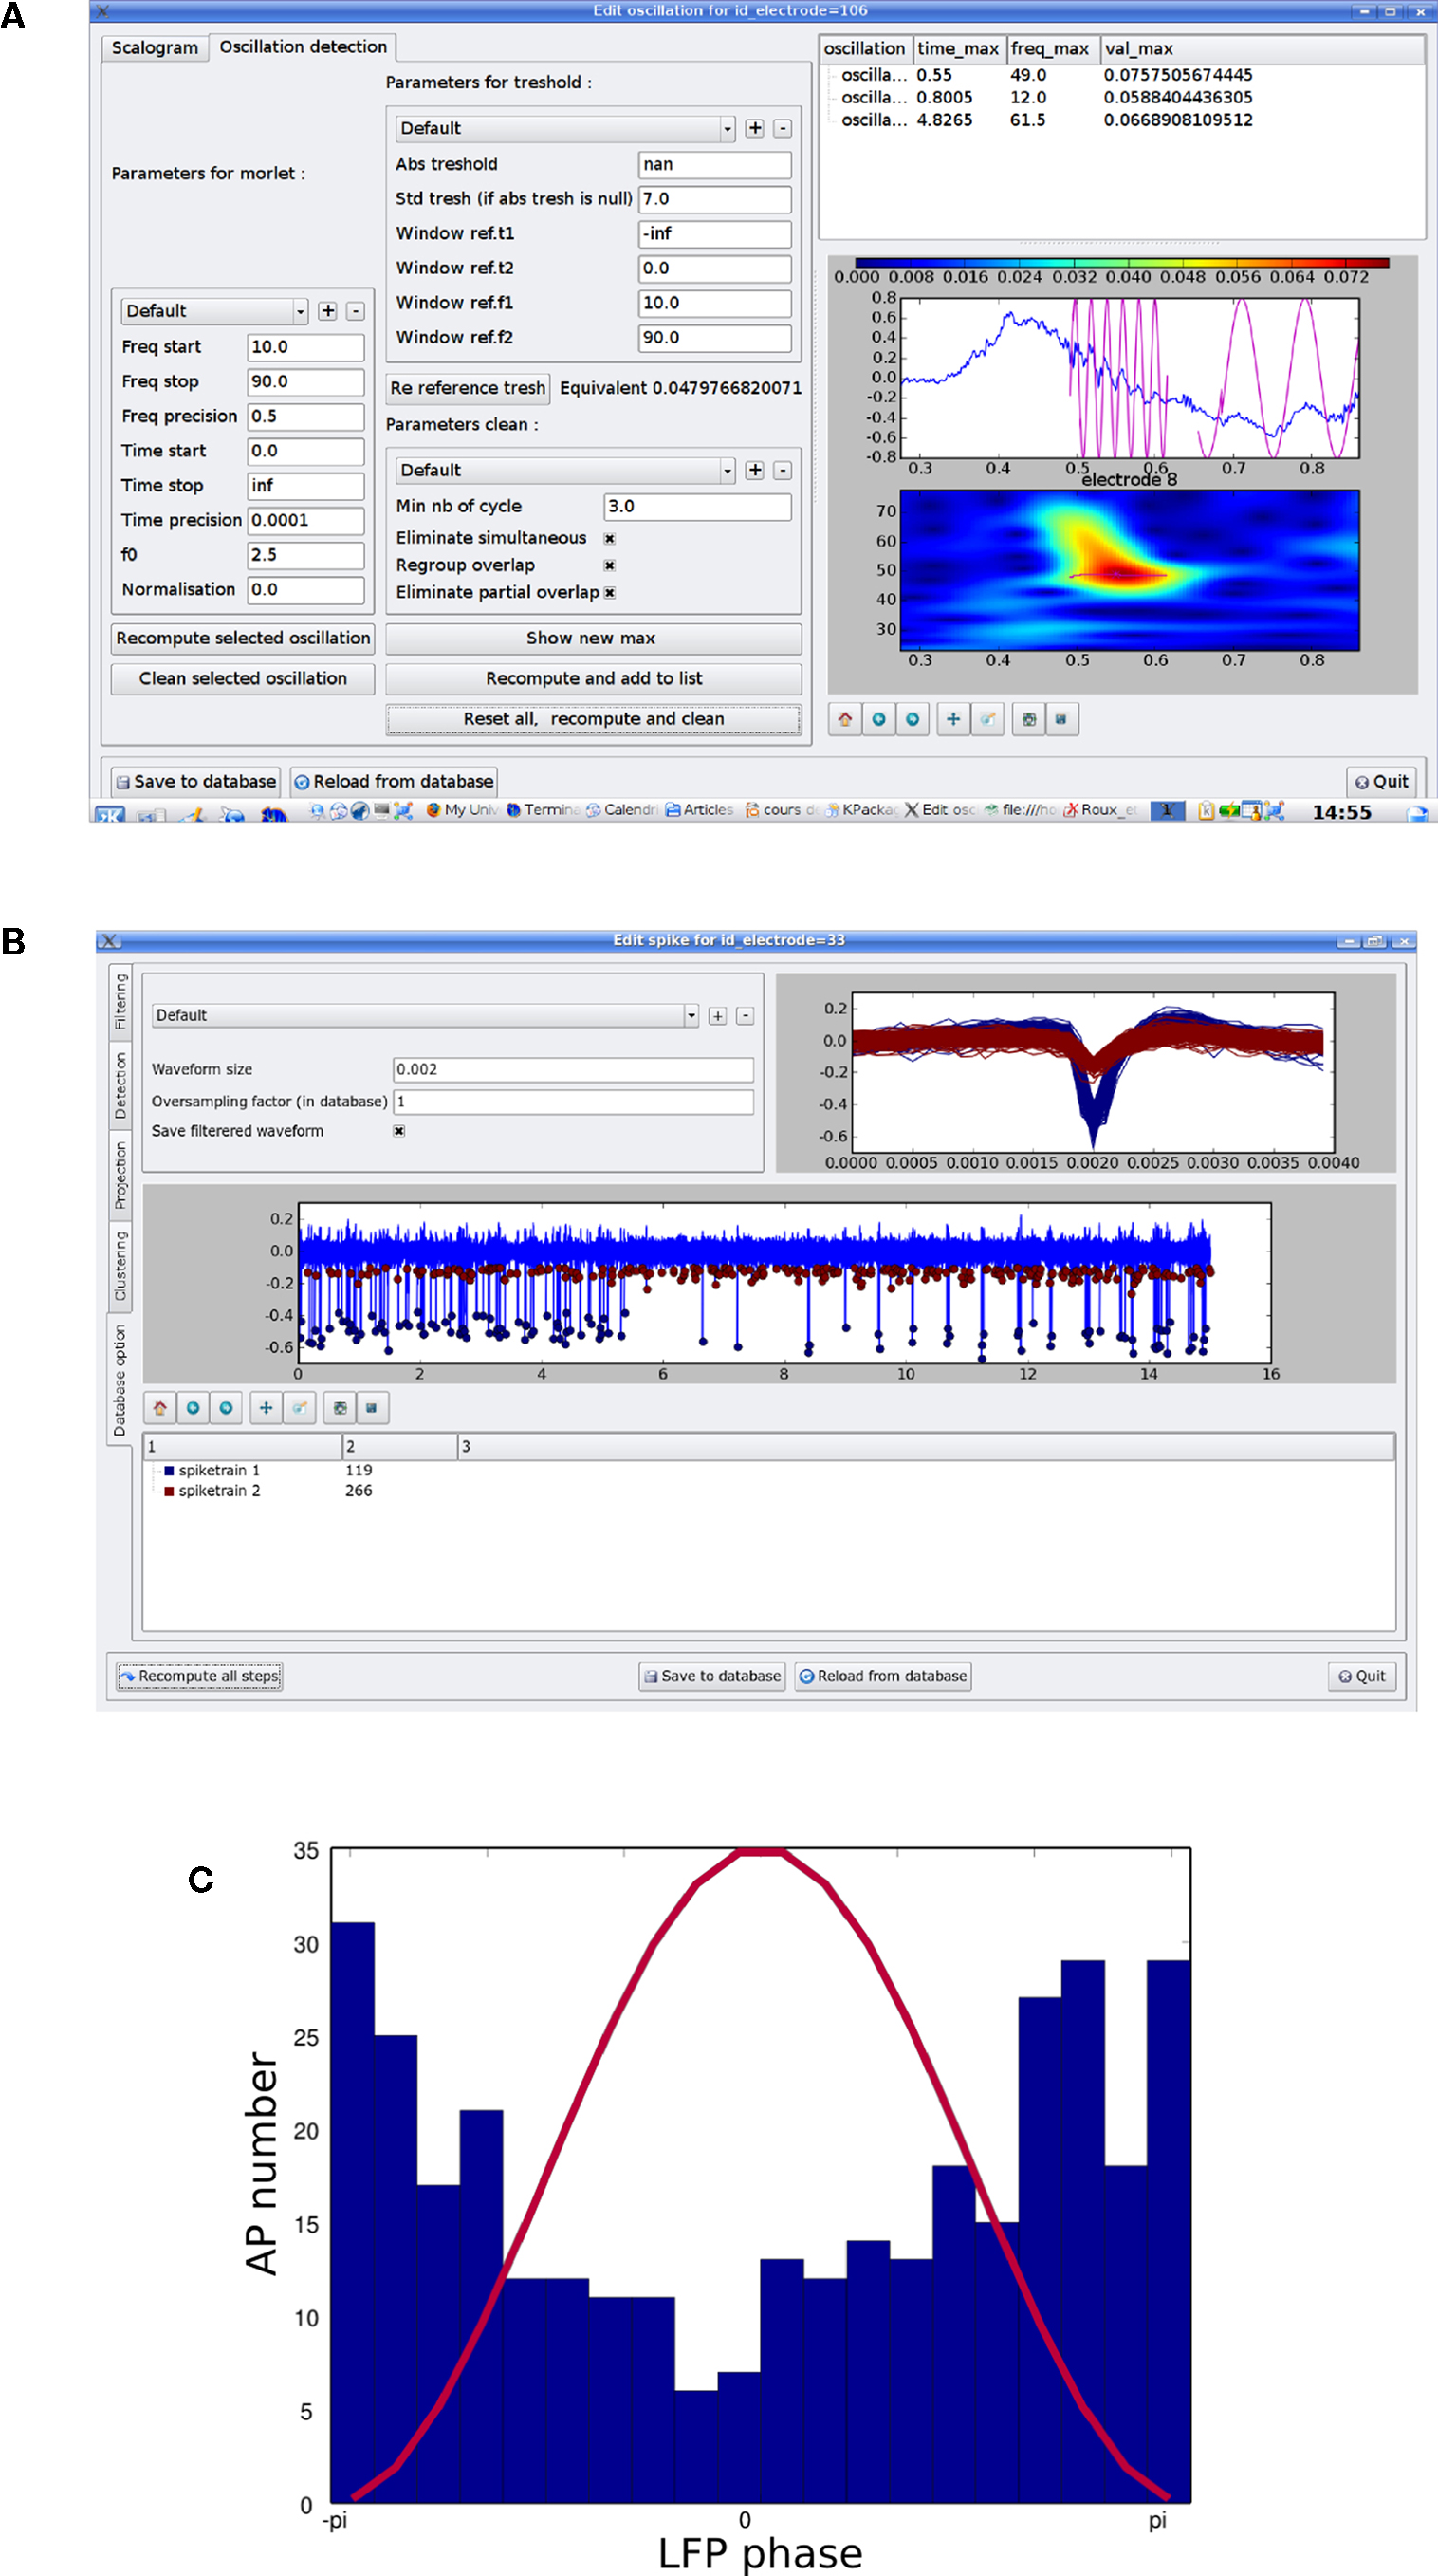
Figure 3. (A) Snapshot of the oscillation detection dialog. On the left side, frames encapsulate different kinds of parameters: for the Morlet scalogram, the threshold definition and “cleaning” the detection. On upper right, there is a list of detected oscillations. On lower right, there is a zoomed picture of one time–frequency line, which represents an oscillatory event, and the relative phase reconstruction superimposed on the raw signal. When the detection is done, the results can be stored in the MySQL database. (B) Snapshot of the spike detection dialog. On the left, there are different tabs corresponding to the different steps of spike extraction: filtering, detection, projection and clustering. The result of a particular detection that can be saved into the database is on the shown tab. (C) Example of how spike and oscillatory events can be mixed, showing how a spike train is phase locked on the LFP phase. One oscillation cycle is depicted in red, and a histogram of the phases of spike discharge is shown in blue.
The next step was the detection of spikes in the same signal. The GUI shown in Figure 3
B presents five tabs corresponding to the four steps used in the spike detection (see Section “MySQL”) and a fifth for the database options (which summarizes the results and, in the case of multiple detected spike trains, allows the user to choose which results should be saved to the database). At any step, the parameters can be set and saved for later use. Spike detection can be done in its entirety or in a step-by-step fashion, with various plots on each tab dedicated to the intermediate results. Again, this task can be performed for multiple electrodes simultaneously with a similar GUI that includes all tabs (without graphic feedback) and a window to specify the SQL query. A special case is the detection of spikes from the same electrode channel across all trials from a given series. In this case, the signals from all trials are pooled before spike detection, and the resulting spike trains (one for each trial) are linked in the database via the cell table, so that it can be documented that they are all associated with the same neuron.
The final step was the analysis of the results, which here consisted of a histogram of spike phases (relative to the oscillations). This analysis has already been implemented in OpenElectrophy, and the user needs only to specify a list of oscillations and a list of spike trains with two SQL queries to obtain the graph in Figure 3
C. To demonstrate how this process can be done using an external script, we present here the Python code that was used in this analysis:

In summary, we have presented OpenElectrophy, an open source project aimed at facilitating the management and manipulation of electrophysiological data along with experiment meta-data. The key contribution of OpenElectrophy is the framework architecture: MySQL married to Python + SciPy, all of which are reliable, widely used and free tools. We have shown how the use of a MySQL database allows for long-term storage, easy access and sharing of data. In particular, all of the data and meta-data are recorded in a central database and can be combined for further analyses, allowing the user, for example, to fuse electrophysiological and behavioral data. We have also shown how OpenElectrophy uses the Python language to simplify interaction with the database and manipulation of data during the writing of analysis scripts. Another primary feature of OpenElectrophy is the integration of the detection and storage of spikes and transient oscillatory events found in electrophysiological recordings. We note that the CARMEN
24
project has recently been created and appears to pursue goals similar to ours, but it is now primarily a repository of diverse methods without much global integration.
The OpenElectrophy project is free and open source, which means that anyone can download, use, modify or extend it and then share his work with the whole user community. It is hosted in a forge with a Trac system
25
, which offers SVN as a version control system and a wiki for live documentation. A mailing listing for discussion between users and developers is available
26
.
Like many other free projects, the success of OpenElectrophy depends on the size of the community using it and developing it. For the moment, OpenElectrophy is a young project and the community is relatively small (about 20 people). Its development has thus mostly involved addressing the needs of this small community. Nonetheless, we hope to have designed the foundations of OpenElectrophy with enough care in terms of flexibility and technological choices such that adapting it to a wider range of needs and use cases would require minimal effort.
At the moment, the OpenElectrophy GUI adequately covers the exploration of data, spike sorting and detection of transient oscillations. The analyses must be computed with Python scripts, which need to be provided by the user. Obviously, these scripts can be written from scratch, but as we already have mentioned, one of the advantages of Python is that it can be interfaced with previously developed analysis toolboxes. Thus, it will be useful in the future to provide, either directly in OpenElectrophy or as script examples (which could be available on the wiki pages for OpenElectrophy), simple ways to interface the data managed by OpenElectrophy with other open source toolboxes, such as the ones presented in this issue, e.g., PyMVPA, PyEntropy or NeuroTools. Additionally, one possible extension would be to write an intuitive GUI for launching some simple analyses in order to make OpenElectrophy more attractive to users who do not write scripts.
Finally, with regard to the more technical aspects of OpenElectrophy, we must mention two future improvements. The first is the integration of a standard ORM such as SQLAlchemy for mapping data to OpenElectrophy objects. At the moment, the SQL mapper is homemade, but it has the advantage of incorporating “numpy.array”. Using SQLAlchemy instead will allow for the direct use of database systems other than MySQL, such as SQLlite or PostgreeSQL. Second, use of the concept of BLOB streaming
27
while using MySQL to read continuous electrode data should be a great improvement. This technique consists in loading BLOB (binary) fields into a stream chunk by chunk. This is a definitive solution for long recordings at high sample rates and solves memory problems.
In the present article, it has been argued that MySQL is a good choice for a data storage architecture, given its powerful features to store, organize, and provide dynamic views of data. However, its socket-based architecture might raise concerns of performance over other scientific binary formats. A simple comparison of read and write performance with the widely used and performant hdf5
28
for an array of 10e7 elements shows OpenElectrophy (local MySQL server) has only slight penalties for read (factor of 1.4) and moderate penalties for write (factor of 4). Assuming that in a normal study cycle, we spend more time in reading than writing, we believe that the architectural advantages of MySQL mentioned previously counterbalance the moderate performance penalty, and it remains an attractive alternative to hdf5.
In developing OpenElectrophy, we have endeavored to follow the fundamental philosophy that the integration of database storage and object-oriented programming paves the way for more efficient and usable data management and analysis systems. In this task, we have built on open source tools as other researchers in the growing community of neuroscientist Python users, represented in this special issue. Emerging from this community are new solutions to promote data and code sharing, and we encourage others to participate and join in the development of a new generation of software to benefit to the whole neuroscience community.
The authors declare that the research was conducted in the absence of any commercial or financial relationships that could be construed as a potential conflict of interest.
We thank Nathalie Buonviso, Tristan Cenier and Phillipe Litaudon for being the courageous first users of OpenElectrophy, Stephan Roux for original contributions to this project, and Eilif Muller for helpful proofreading of this manuscript.
- ^ http://www.plexoninc.com/
- ^ http://www.tdt.com/
- ^ http://www.ced.co.uk/
- ^ http://neuroshare.org/
- ^ http://sccn.ucsd.edu/eeglab
- ^ http://www.ru.nl/neuroimaging/fieldtrip
- ^ http://www.fil.ion.ucl.ac.uk/spm/
- ^ http://www.vis.caltech.edu/∼rodri/Wave_clus/Wave_clus_home.htm
- ^ http://www.neuroinf.org/lists/comp-neuro/Archive/2000/0065.html
- ^ http://www.biomedicale.univ-paris5.fr/SpikeOMatic
- ^ http://klustakwik.sourceforge.net/
- ^ http://neuroanalysis.org/toolkit/
- ^ http://neuralensemble.org/trac/NeuroTools
- ^ http://userwww.service.emory.edu/∼cgunay/pandora/
- ^ http://find.bccn.uni-freiburg.de/
- ^ http://material.brainworks.uni-freiburg.de/research/meatools/
- ^ http://chronux.org/
- ^ http://mlabwrap.sourceforge.net/
- ^ http://rpy.sourceforge.net/
- ^ http://www.cython.org/
- ^ http://www.scipy.org/Weave
- ^ http://software.incf.org
- ^ http://neuralensemble.org/trac/OpenElectrophy/wiki/OEScriptTutorial
- ^ http://www.carmen.org.uk/
- ^ http://neuralensemble.org/trac/OpenElectrophy
- ^ http://groups.google.fr/group/openelectrophy
- ^ http://blobstreaming.org/
- ^ http://www.hdfgroup.org/HDF5//