Dimensional Errors Due to Overhanging Features in Laser Powder Bed Fusion Parts Made of Ti-6Al-4V


1
Institute for Automation and Applied Informatics (IAI), Karlsruhe Institute of Technology (KIT), 76344 Eggensten-Leopoldshafen, Germany
2
Faculty of Engineering, Port Said University, Port Fuad 42526, Egypt
3
3D Systems, 3001 Leuven, Belgium
4
Karlsruhe Nano Micro Facility, Hermann-von-Helmholtz-Platz 1, 76344 Eggenstein-Leopoldshafen, Germany
*
Author to whom correspondence should be addressed.
Appl. Sci. 2020, 10(7), 2416; https://doi.org/10.3390/app10072416
Submission received: 6 March 2020
/
Revised: 24 March 2020
/
Accepted: 30 March 2020
/
Published: 1 April 2020
(This article belongs to the Special Issue Micro/Nano Manufacturing II)
Abstract
:The rise in popularity of Additive Manufacturing technologies and their increased adoption for manufacturing have created a requirement for their fast development and maturity. However, there is still room for improvement when compared with conventional manufacturing in terms of the predictability, quality, and robustness. Statistical analysis has proven to be an excellent tool for developing process knowledge and optimizing different processes efficiently and effectively. This paper uses a novel method for printing overhanging features in Ti-6Al-4V metal parts, by varying process parameters only within the down-facing area, and establishes a methodology for predicting dimensional errors in flat 45° down-facing surfaces. Using the process parameters laser power, scan speed, scan spacing, scan pattern, and layer thickness, a quadratic regression equation is developed and tested. An Analysis of variance (ANOVA) analysis concluded that, within the down-facing area, the laser power is the most significant process parameter, followed by the layer thickness and scan speed. Comparatively, the scanning pattern is determined to be insignificant, which is explained by the small down-facing area where the various scanning patterns play no role. This paper also discusses the interaction effects between parameters. Some thoughts on the next steps to be taken for further validation are discussed.
1. Introduction
Additive Manufacturing (AM), colloquially known as 3D printing, is a rapidly evolving group of fabrication techniques that are currently revolutionizing design and production practises across industries [1]. They have displayed potential to disrupt and beneficially affect globally established process chains and business models [2,3]. Their main advantages include an increased design freedom, shortening of lead times, and reduction in material usage [4]. Additionally, combined with their ability to print on demand, AM techniques align well with today’s industrial trends of digital manufacturing and mass customization [5,6]. Therefore, this combination of competencies that AM offers and modern trends has allowed AM to arrive as a unique solution for current and future demands.
Laser-based powder bed fusion (L-PBF) is one of the AM techniques that is gaining an increased market acceptance and penetration, particularly in a wide range of industrial applications that include automotive, aerospace, medical/dental, and robotics industries [4]. In addition to all the advantages mentioned above, the availability of printable super-alloys, such as Ti-6Al-4V, allows metal products with superior properties to be produced, i.e. high strength-to-weight ratio and corrosion resistance, which were not easily obtainable using conventional manufacturing methods [7,8,9]. This makes AM techniques prime candidates for applications where low-density and excellent corrosion-resistant materials are required, such as in the aerospace industry [10].
However, the L-PBF process still faces some technological challenges that need addressing in order to improve the robustness and repeatability of the parts produced. In particular, when compared to other conventional manufacturing technologies, AM, and L-PBF in particular, lags behind when it comes to being able to predict different quality-based performance indicators of the parts produced, such as the dimensional accuracy and surface quality.
Therefore, a significant portion of current AM research is focussed on investigating these different aspects of precision, namely the repeatability, predictability, and robustness of the process. Various approaches have been employed for this purpose, including investigating the design for precision AM using topology optimization [11], computational modeling of the L-PBF process [12], and statistical process optimization studies [13]. These methods are also complemented by studies on improving methods for the finishing of parts [14], as well as for metrology [15].
In particular, Sinico et al. compared two topology optimization (TO) techniques—one based on commercial software and another based on an in-house developed TO method that also compensates for localized overheating caused during part manufacturing. This work discusses the precision benefits that are achieved when manufacturing constraints are included within topology optimization, rather than just purely geometric constraints [11]. Bayat et al. developed a multi-physic numerical model of the L-PBF process, which was then used to track the formation of porosities that cause imprecision while printing. Their results indicate that porosities are largely caused due to the improper fusion of particles between tracks [12]. Charles et al. investigated the effects of process parameters on the surface texture of a down-facing part and showed that the interaction and interdependency of process parameters have the greatest effect on the surface roughness as they directly affect the degree of dross formation due to the various levels of energy density applied to the powder [13]. Solheid et al. investigated improving the precision of AM-produced surfaces by carrying out a subsequent laser polishing step after printing. This early study investigated the various process parameters and discussed their effect on the achieved surface. They were able to achieve a significant reduction in surface roughness (Ra) by using higher values of laser power under lower values of the feed rate and scan speed [14]. Baier et al. developed a methodology for precise measurement of the focal spot of a Computed tomography (CT) scanner as it is one of the essential factors in determining the uncertainty in CT dimensional measurements of AM parts. Their results showed progress towards defining the optimal process parameters to be used for desired resolutions [15].
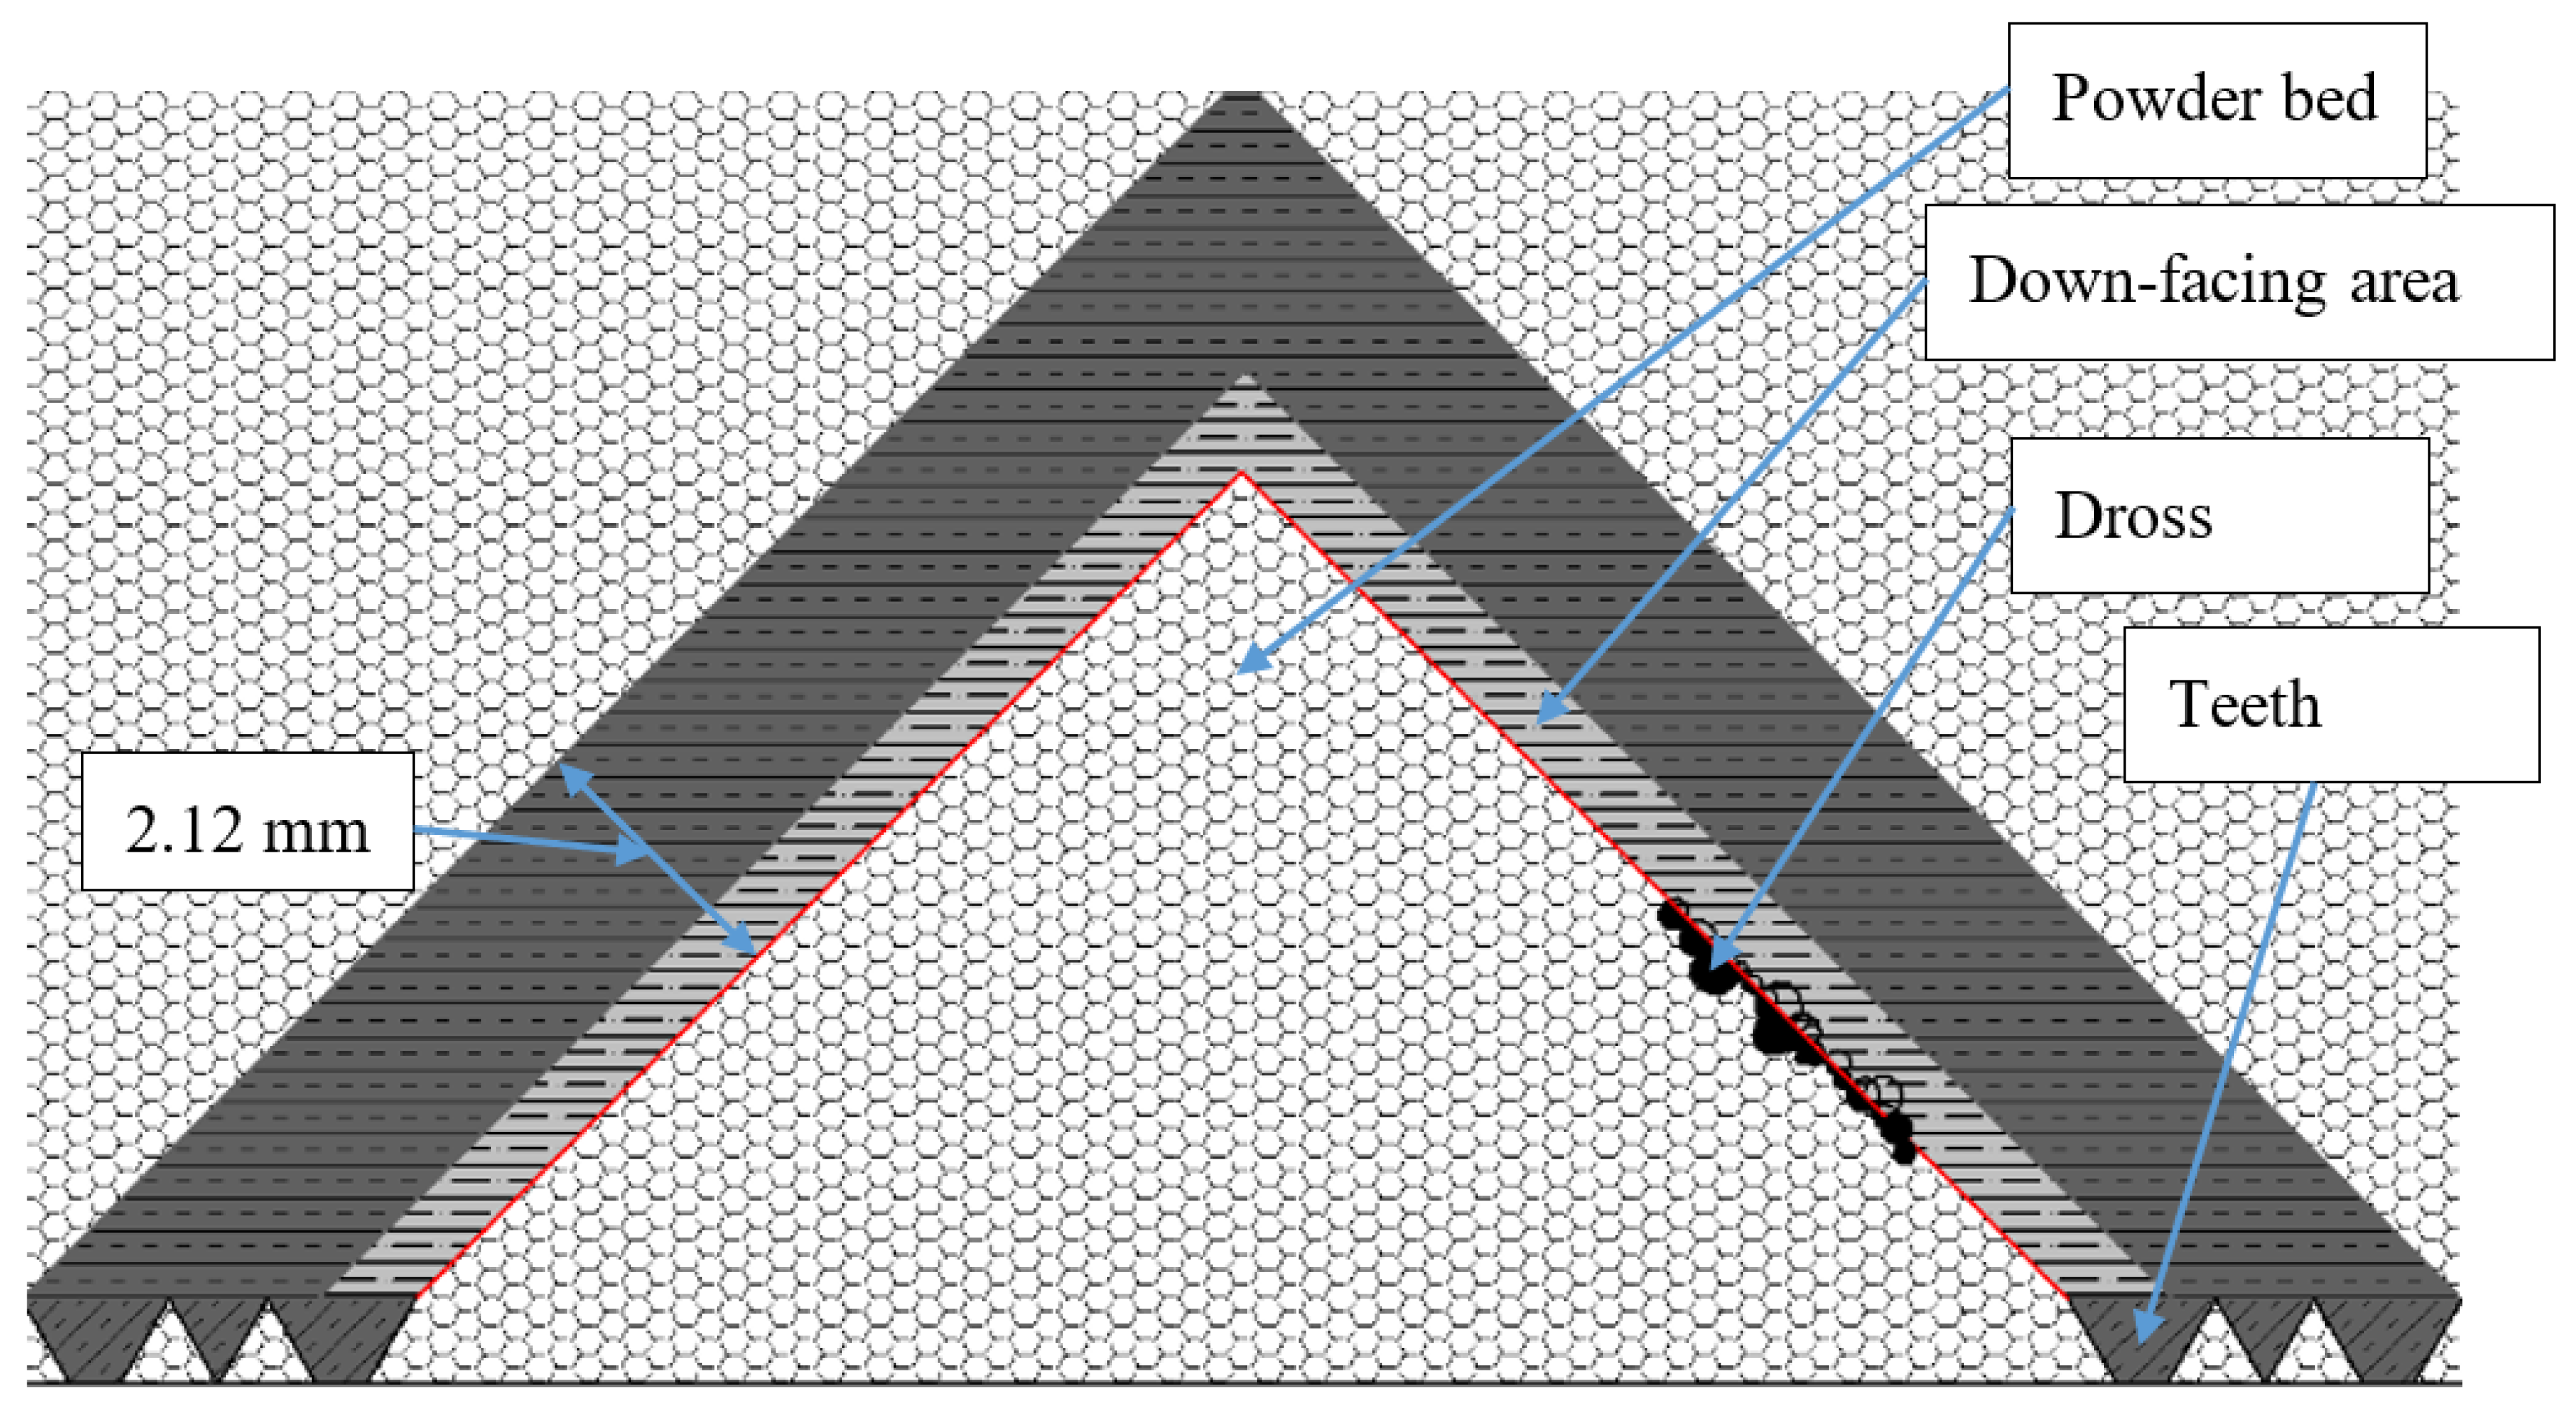
L-PBF, down-facing, or down-skin surfaces are present on parts that contain overhanging features that are not printed over solid bulk material, but on lose powder (as seen in Figure 1). It is especially difficult to print these surfaces as they normally show large dimensional errors and require support structures, thereby necessitating extra process steps for support removal and finishing. The main cause of these dimensional deviations is dross formation, which is seen in Figure 1 [16]. This is the result of the melting of excess material. This excess melting is caused by the overheating of lose powder, resulting in the formation of large dimensional deviations from the Computer-aided design (CAD) model. The degree of dross formation is dependent on the process parameters and the effect of dross formation on the dimensional deviation and surface topography can vary [13,17].
A number of studies have investigated overhangs and down-facing surfaces, as well as the accompanying support structures required by overhangs, with the aim of improving the printability and processability of these structures. Cacace et al. approached this issue from a mathematical point of view, and proposed a level set-based method to create object-dependent support structures for filament-based 3D printing [18]. In a similar shape optimization study, Zhang et al. demonstrated a topology optimization framework that considers overhangs as a constraint during topology optimization and proposes printable designs [19]. Similarly, Driessen et al. proposed a density gradient-based approach for determining the overhang constraint and their results showed promise for the inclusion of build orientation into topology optimization in an effective way [20]. Mertens et al. conducted an experimental parameter optimization study for down-facing surfaces in L-PBF and compared the results to a thermal simulation model. Their research showed that for inclined surfaces, low powers exhibited better surface qualities, but at an inclination angle of 60° to the build platform [21].
An alternative approach to improving the quality of overhangs without the use of support structures is achieved through the use of contact-free support structures. Cooper et al. have demonstrated and highlighted its benefits in terms of it not requiring or only requiring very little post processing, while effectively reducing overhang distortion and deformation. Their conclusions remain positive for the adoption of the contact-free support structures technique for industrial applications [22]. In subsequent research, Wang et al. proposed two different minimal contact supports, namely a thin wall tooth contact and a non-contact design. They showed promising results in terms of heat dissipation and reduced distortions [23]. Paggi et al. developed a novel contactless support structure, specifically a thin blade parallel to the critical down-facing area, to transfer heat away from the melt pool via conduction through the powder bed instead of through direct contact and also conducted numerical modeling in order to understand the parameters that define the optimal distance between the down-facing area and the support structure [24].
Fox et al. analysed the inter relationships between the laser power, scan speed, and various overhang angles and their results indicated that certain surface texture parameters (Rpc, RSm, and Rc) could indicate a shift between surfaces dominated by partially melted particles and surfaces dominated by material from re-solidified melt tracks. Another conclusion from their work also indicated that distinct correlations between process parameters and the surface texture parameter Ra were not conclusive; however they mentioned that further analysis on down-facing surfaces is warranted [17].
A number of researchers have employed different analytical and statistical approaches to build predictive process models for various fields within Additive Manufacturing [25,26]. Tapia et al. developed a Gaussian process regression formula for the prediction of porosity in L-PBF processes and discussed the difficulty in modeling the L-PBF processes due to the low process repeatability [27]. Sun et al. used the Taguchi method for parametric optimization of the L-PBF process. They conducted an ANOVA analysis and established a regression equation that revealed a linear relationship between the part density, laser power, scan speed, powder thickness, and scan strategy [28]. Similarly, a popular method for the modeling and optimization of processes is conducted through the use of artificial neural networks (ANN). Marrey et al. used an artificial neural network to develop an ANN model based on the results of a series of experiments and were able to draw conclusions on the effects of different process parameters on the mechanical properties of L-PBF parts [29]. Charles et al. also employed a similar methodology to create an ANN model for L-PBF parts to predict surface roughness in down-facing surfaces [30]. However, a research gap does exist in correlating the L-PBF process responses with input parameters to predict the dimensional deviation that occurs in overhangs. This is the problem that this research starts to solve for parts made of Ti-6Al-4V metal alloys.
Therefore, this current work aims to understand the effects of process parameters on the dimensional accuracy of printed parts, considering the stochastic effect of down-facing surfaces on the obtainable dimensional accuracy. In particular, a statistical analysis of the L-PBF processes for the hard-to-process 45° down-facing surfaces produced with a Ti-6Al-4V titanium alloy was conducted. Then, a quadratic regression equation was formulated for the dimensional error in down-facing areas of L-PBF parts using various scanning strategies, layer thicknesses, and down-facing process parameters and the equation was tested by printing a number of samples in order to obtain its accuracy. Additionally, an ANOVA analysis determined the most significant process parameters within the down-facing area, as well as the insignificant parameters.
2. Methodology
2.1. Experimental Design
Since this paper focusses on investigating down-facing surfaces, a simple design with a 45° inclined down-facing surface was used as the test piece. Although the printing of surfaces below 45° is generally possible, 45° is conventionally considered the limit for printing high-quality down-facing surfaces without support structures [31,32,33]. For surfaces below 45°, large dimensional deviations and deteriorating surface textures are exhibited. Therefore, achieving minimal errors at an angle of 45° without support structures would represent an improvement compared to the state-of-the-art approaches. The different process parameters and their levels chosen to investigate the effect on the dimensional accuracy are listed in Table 1. All test pieces were built using a commercial laser-based powder bed fusion system manufactured by 3DSystems, the ProX® DMP 320 (3DSystems, Rock Hill, USA), and the Ti-6Al-4V metal powder used was also supplied by 3DSystems under the brand name Laserform Ti Gr23(A) (3DSystems, Rock Hill, USA).
An inscribed central composite (CCI) experimental design was used and the Design of Experiments (DoE) is shown in Table 2. A central composite design is a type of fractional factorial design of an experiment where all levels and all combinations of process parameters are not tested during the experimentation phase. Fractional factorial designs provide detailed insights into a process while still keeping the number of trials as low as possible [34]. Such a design was therefore chosen to reduce the number of experimental trials and expenditure of time and resources, without losing any insight into the process.
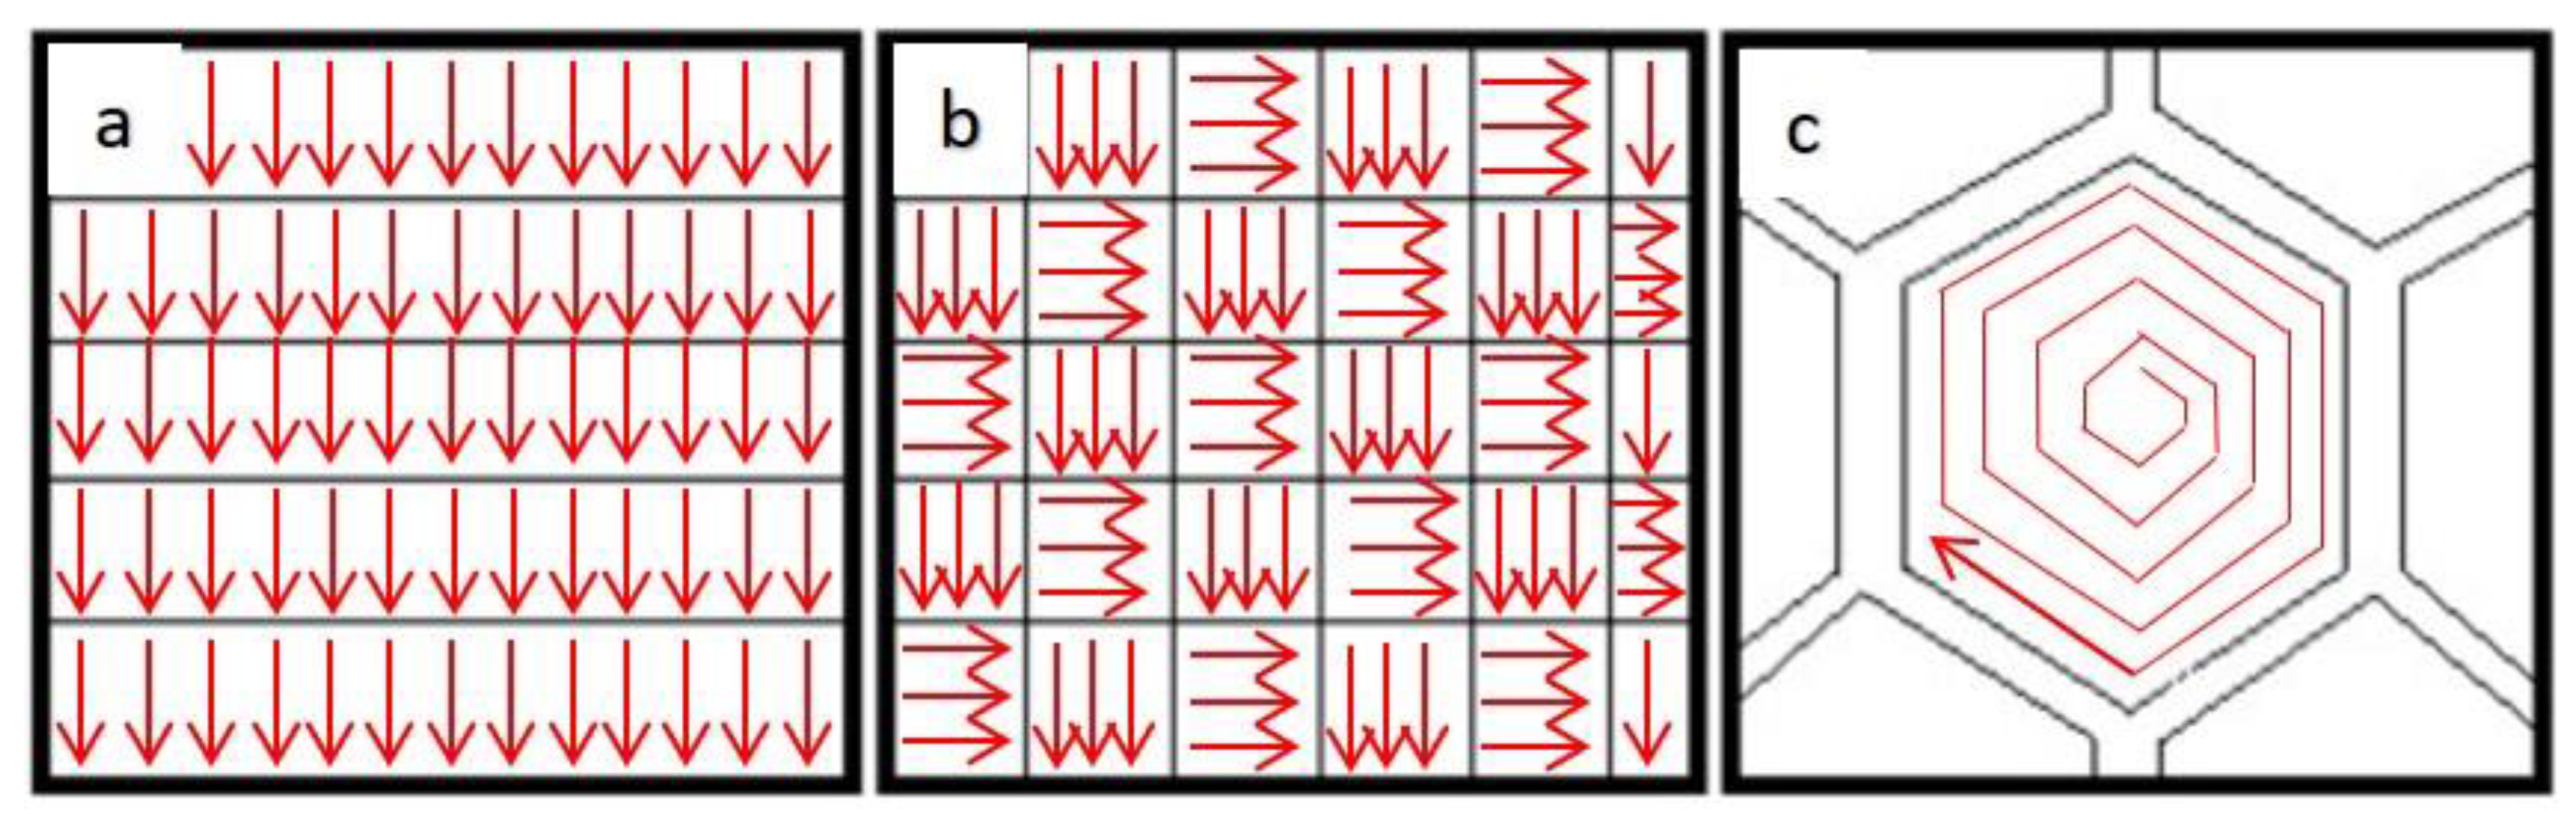
The parameters presented in Table 2 were used to print the samples for each of the various scan patterns (as seen in Figure 2) and layer thicknesses, resulting in six unique tables and a total of 144 test pieces for analysis. Trials 15 to 24 represent parts printed with the same parameters, while the test pieces were arranged in the build platform following no particular order in order to improve the randomization.
In the unique methodology followed within this research, the process parameters were only varied within the down-facing area of the part (depicted with light gray in Figure 1), while the rest of the parts were printed with the same standard printing parameters as recommended by the manufacturer for all test pieces, as seen in the image (depicted with darker gray in Figure 1). The down-facing area in this research is a flat surface and does not include any curvature in the surface.
2.2. Test Piece Design
The test piece was designed to be a 10 mm by 20 mm down-facing surface area, as seen in Figure 1. All parts were pre-processed using the 3DXpert™ (3DSystems, Rock Hill, USA) software for assigning of the process parameters and printing strategies. All parts were also printed with teeth connecting the part with the build platform. Such teeth are required for easy removal of the part from the build platform after printing.
2.3. Measurements
In order to measure the dimensional error caused by the varying parameters in the down-facing area, the thickness of the overhang was measured, and the deviation of the thickness was compared with the CAD dimension to calculate the error. The methodology of the measurement is as follows.
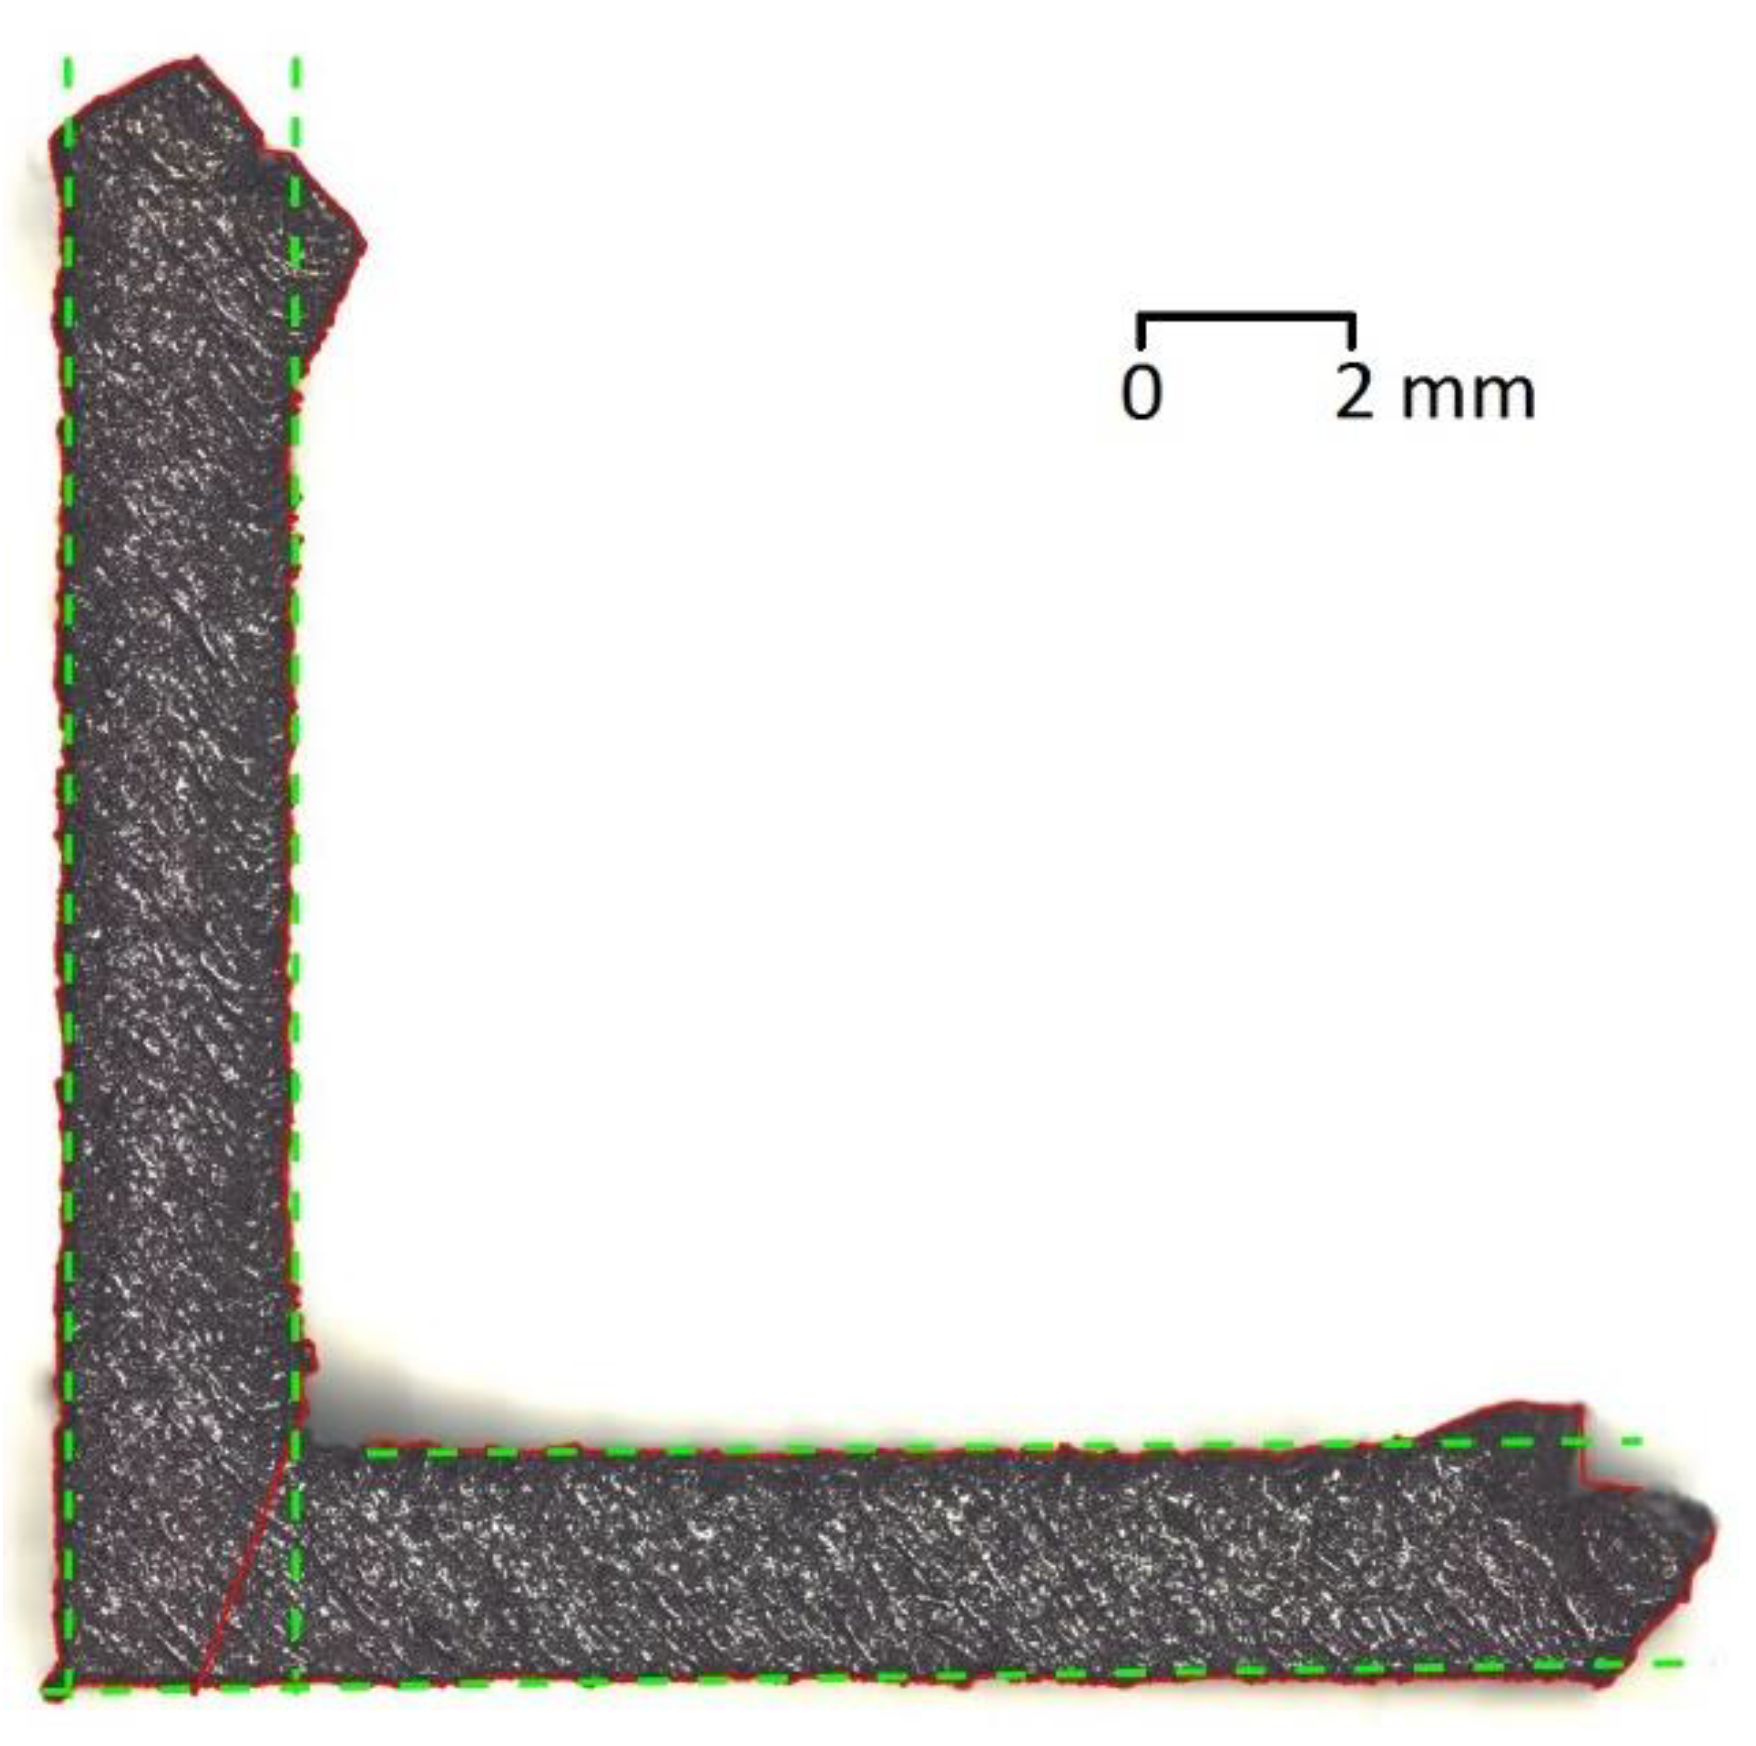
Using an optical microscope, images of the side view of all test pieces were captured. An image processing technique was developed and employed to measure the thickness of the overhanging surface. The image processing technique first works by gray scaling the image and applying a threshold, in order to detect the edges of the test piece. The program then scans the image both vertically and horizontally and extrapolates a straight line though the detected edge points. As the scale of the image is known, it is then possible to calculate the distance between the two straight lines, which gives the thickness of the overhanging surfaces of the parts. The measured thickness was then compared to the CAD design to determine the error in the printed part and the percentage of this error. Both sides of the part were measured to detect any differences in thickness within the same part. As seen in Figure 3, the dotted lines depict the detected edge of the part, which are used to measure the thickness. The obtained measurements were validated by comparing them with Vernier Calliper measurements.
3. Results and Discussion
3.1. Data Processing and Analysis
Data processing and statistical analysis were conducted using MATLAB (R2019a) (MathWorks, Natick, USA). A regression equation was developed to describe the relationship between the different process parameters and the dimensional error percentage. A number of regression formulas were created and tested, with the quadratic regression equation being the optimal one. A quadratic regression method was used to fit the second-order polynomial in Equation (1) to the measured data:
Where y is the output variable which, in our case, is the dimensional error %; b0,bi, bii, and bjj are the regression coefficients or predictors; and xi is the value of the ith factor.
The developed equation resulting from the quadratic regression formulation with a robust fit presented 21 terms for the five process parameters that were studied in this work and the values obtained for each coefficient are presented in Equation (2), where x1 is the laser power, x2 is the scan speed, x3 is the scan spacing, x4 is the scan pattern, x5 is the layer thickness, and y is the dimensional error %.
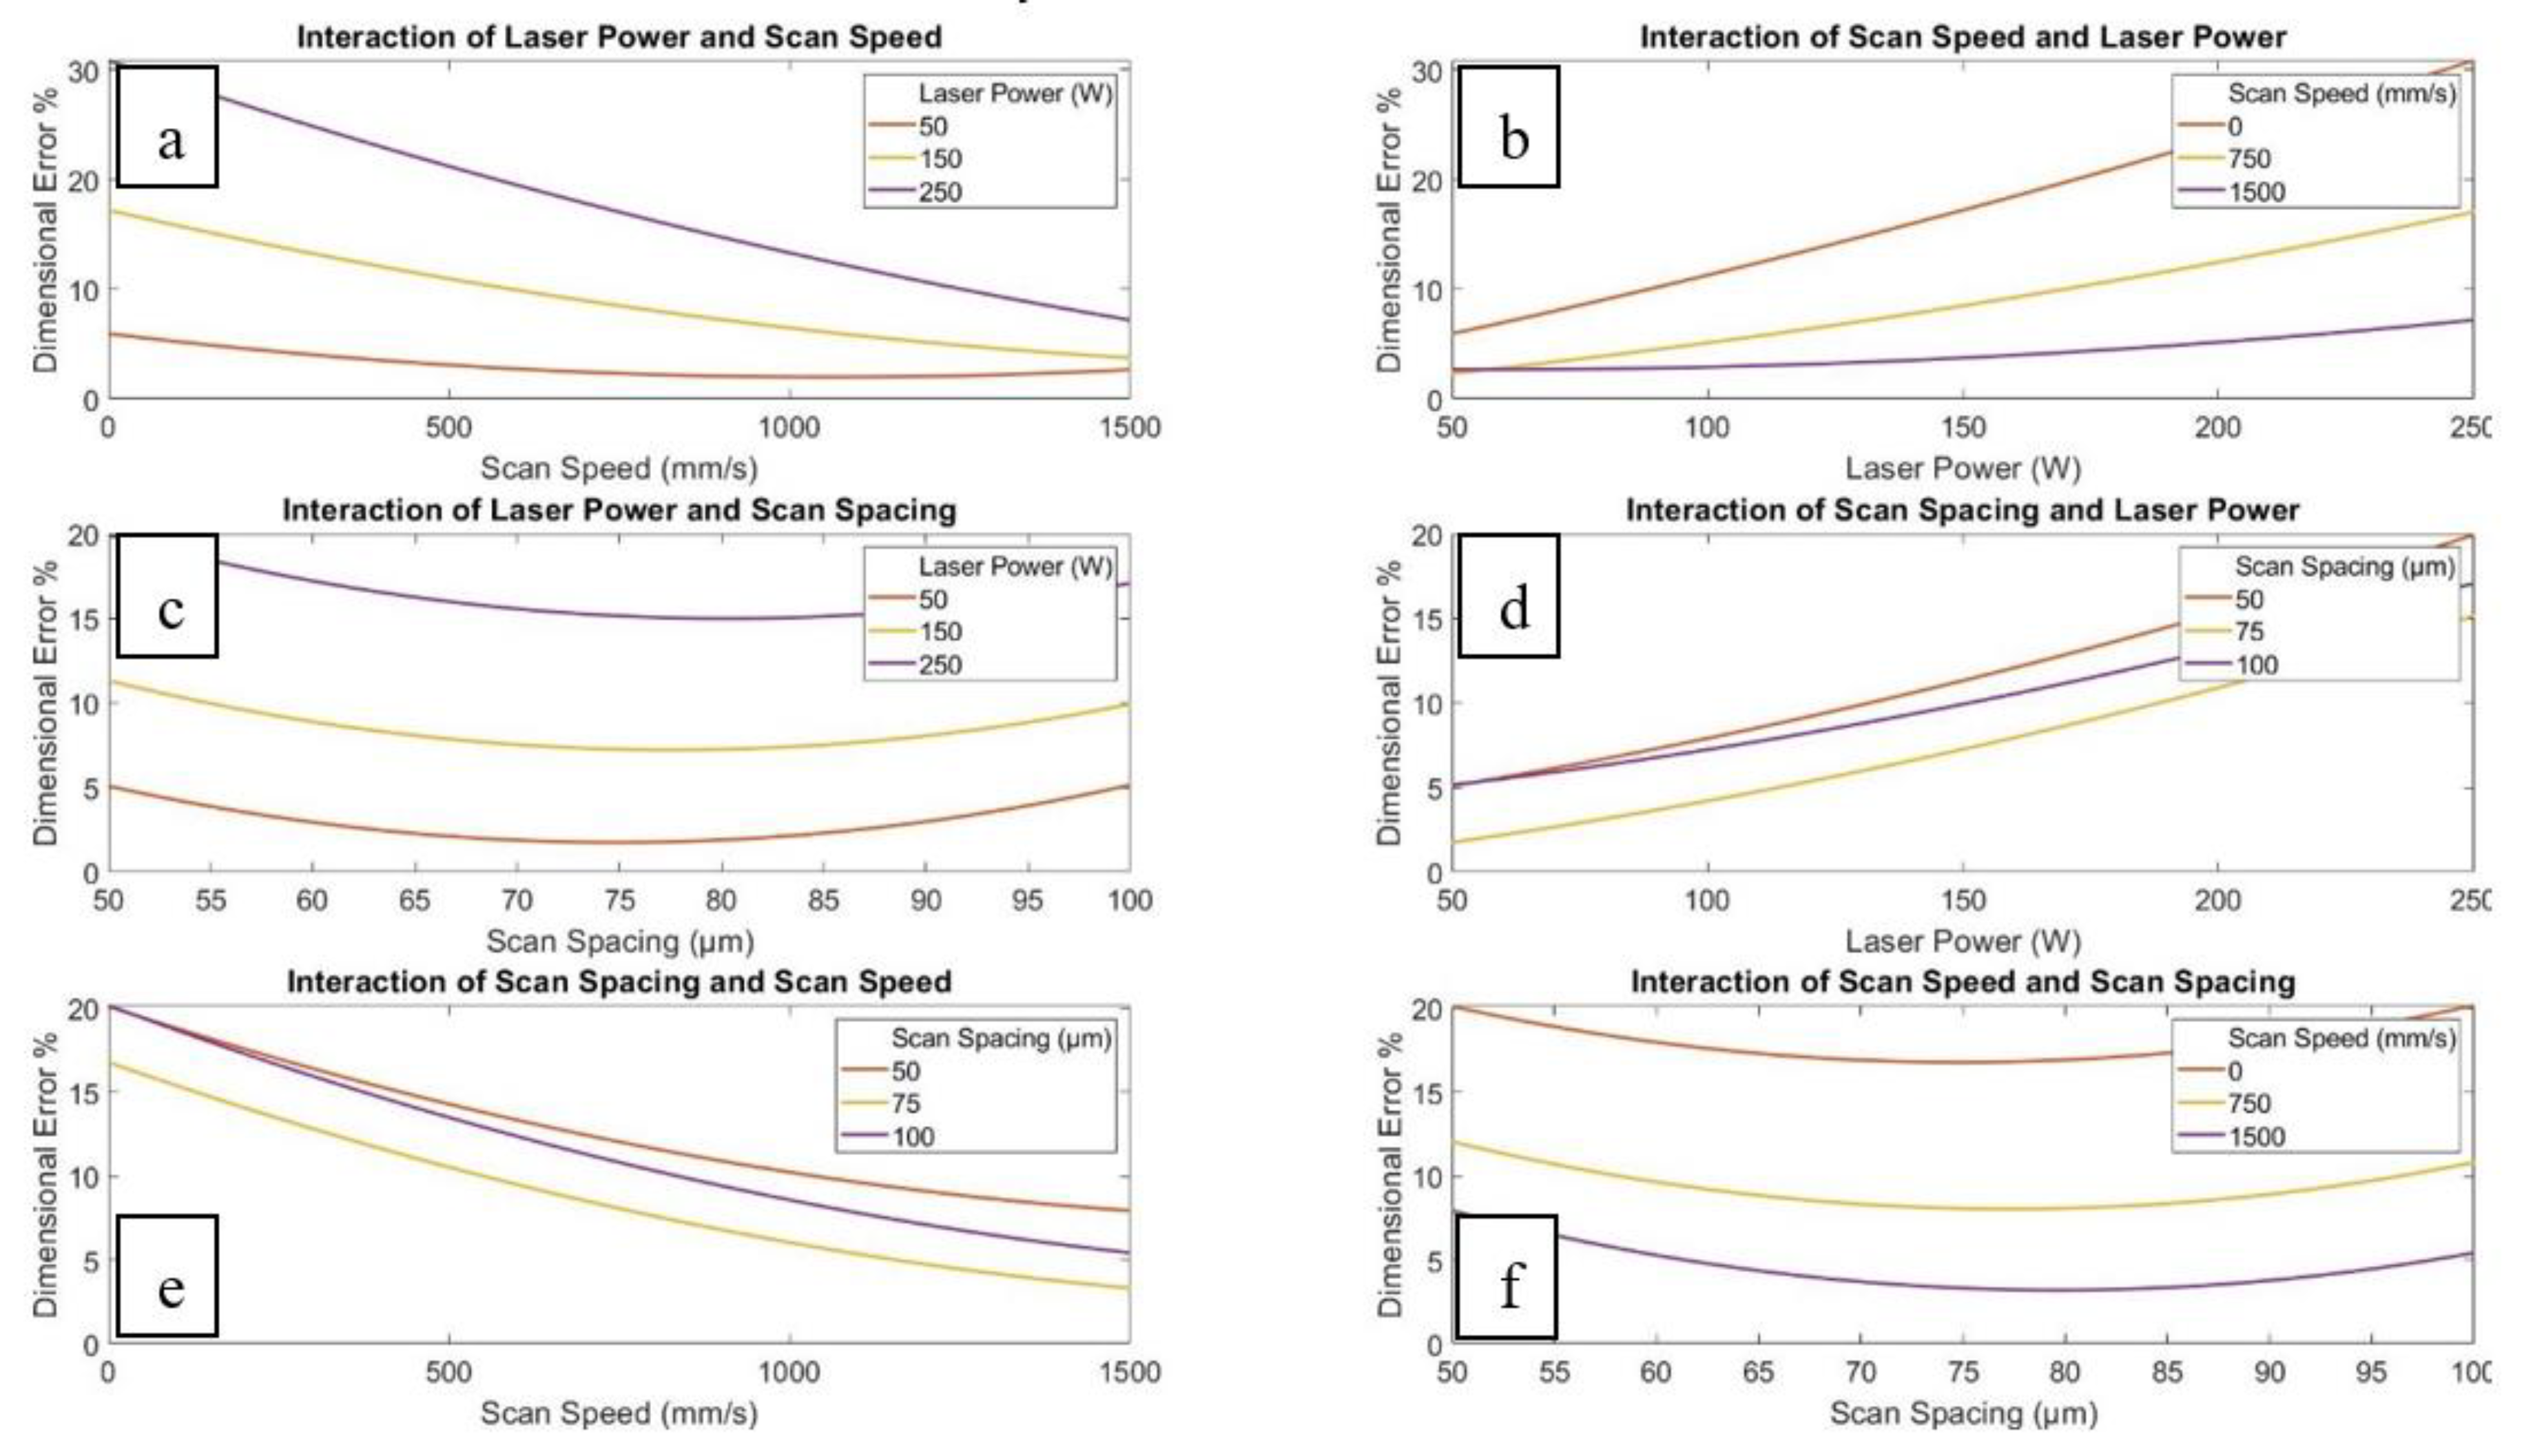
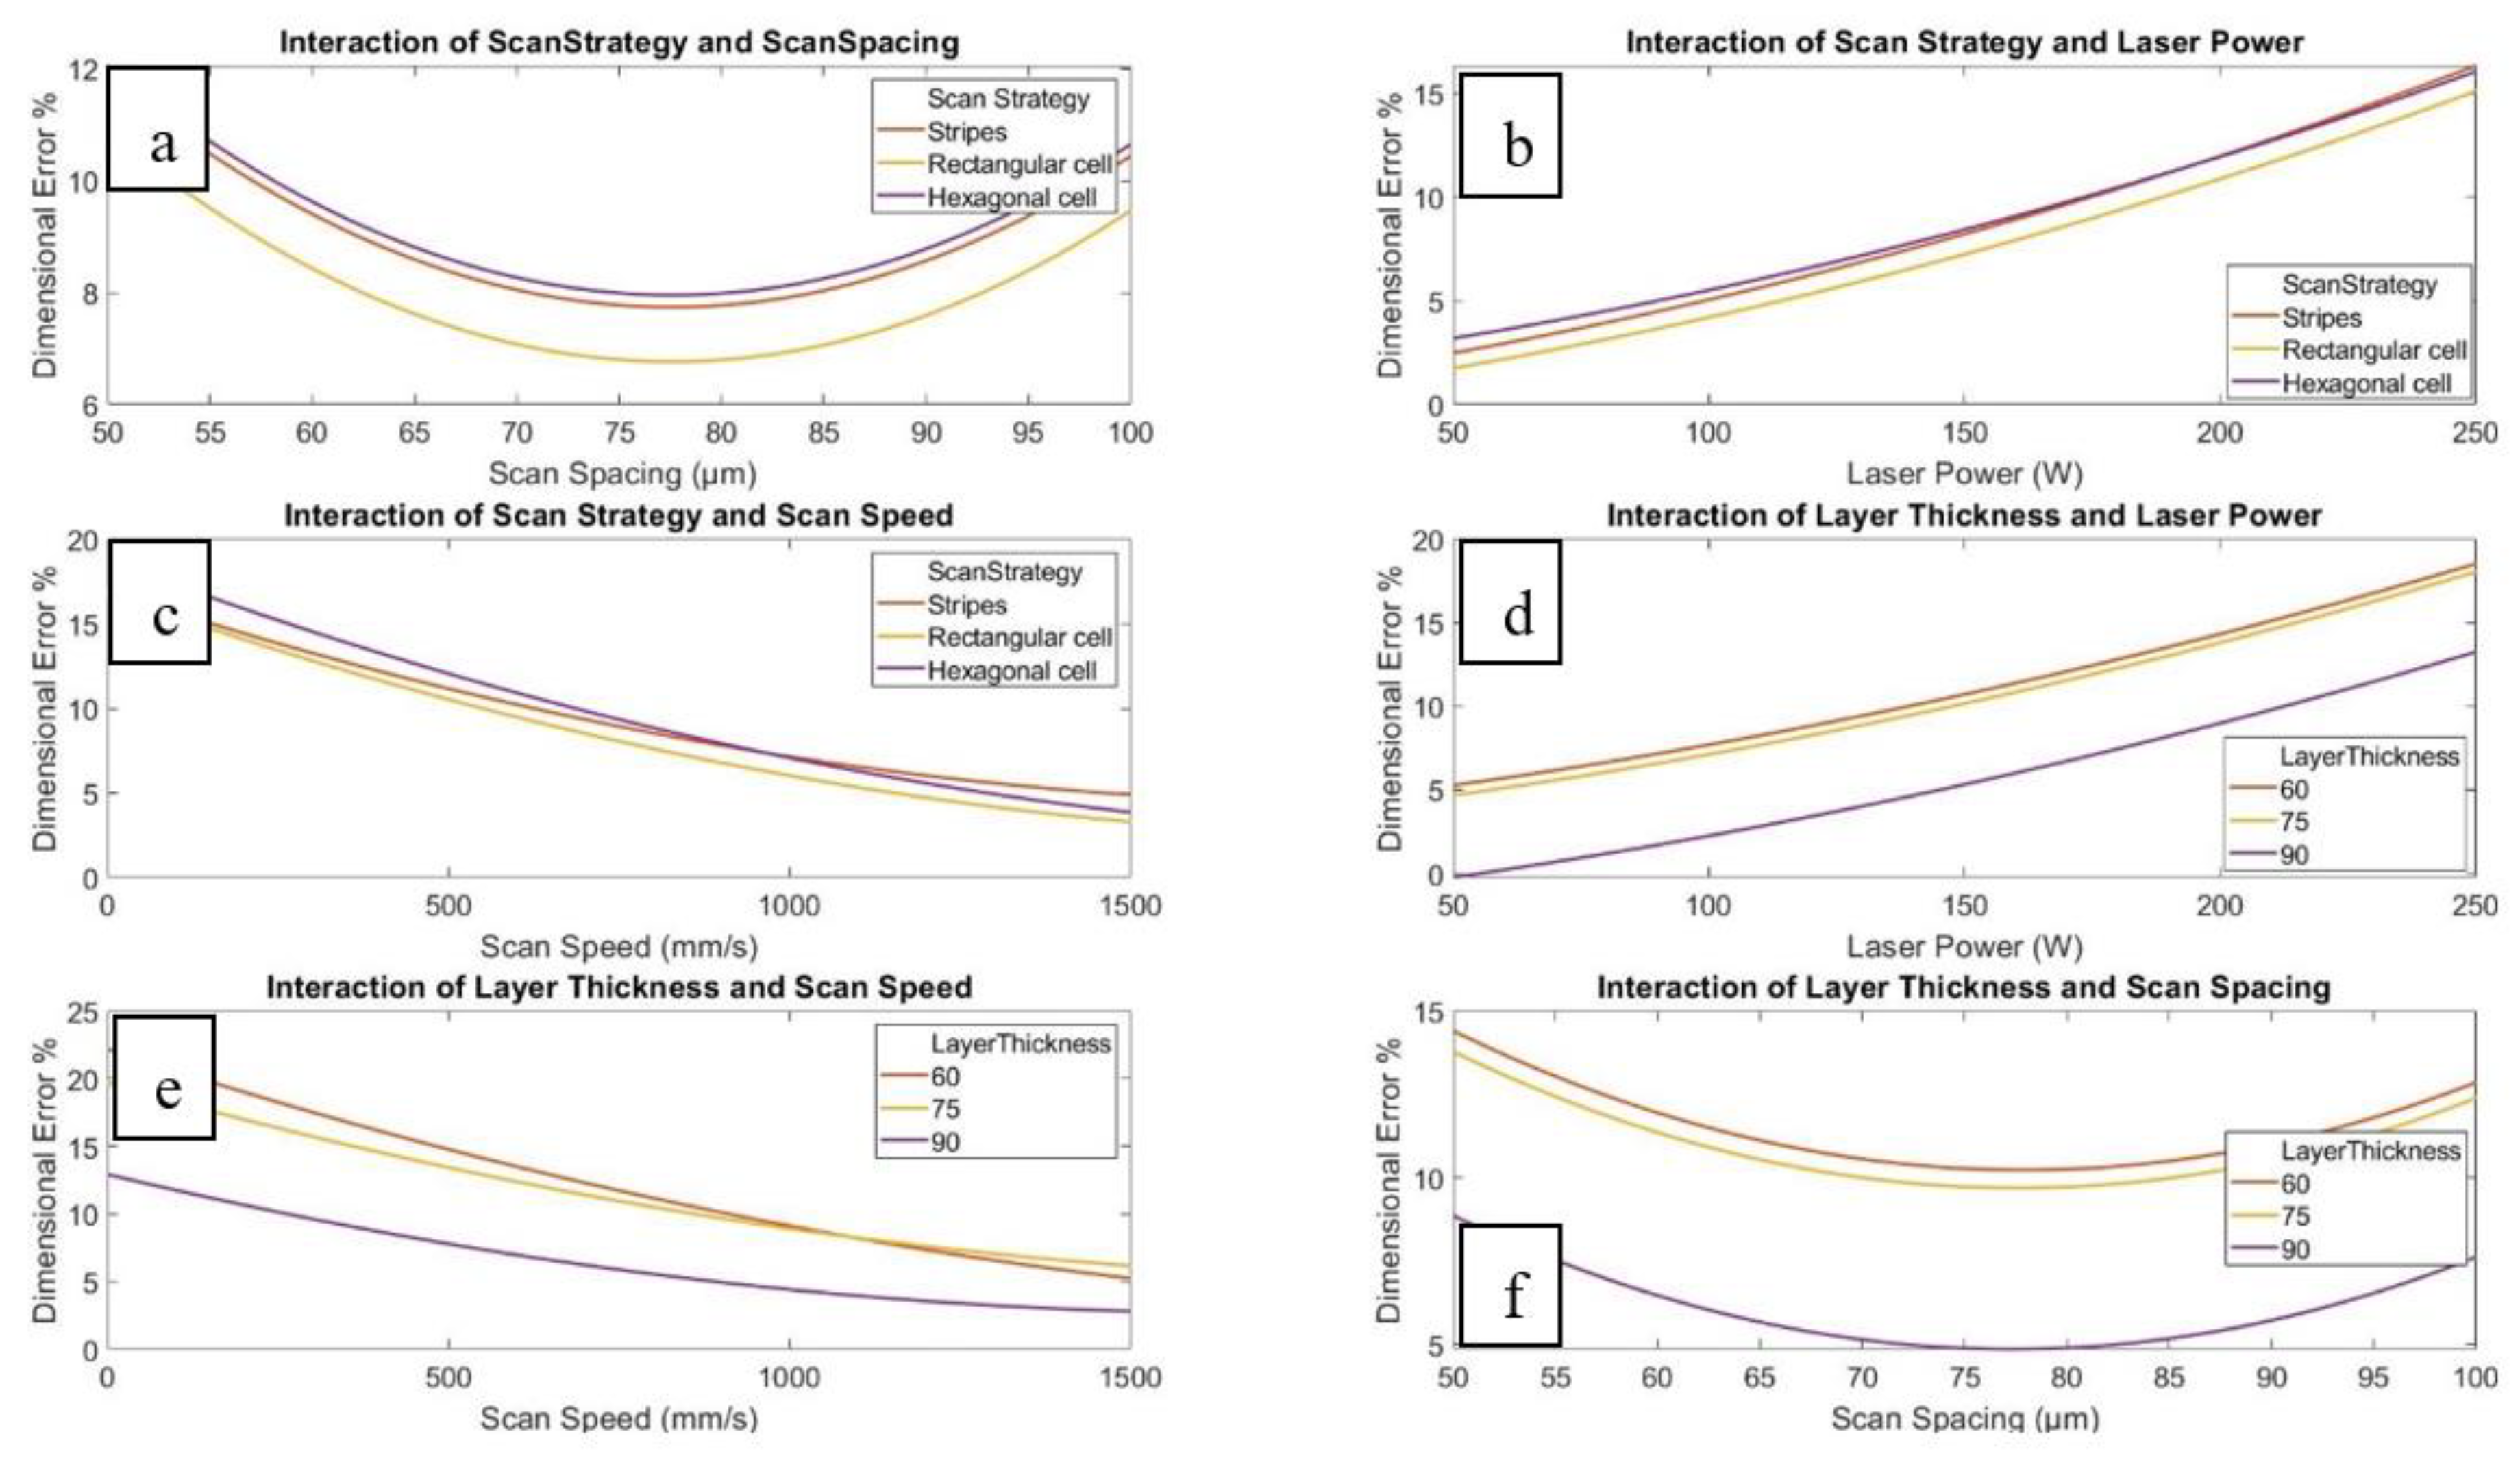
This equation was then used to generate the interaction plots, as seen in Figure 4 and Figure 5. The interaction effects depicted below show the estimated effects on the response from changing each variable value while averaging the effects of the other process parameters. Based on the interaction effects, some of the insights gained are as follows:
- As seen in Figure 4a, increasing the scan speed tends to decrease the dimensional error at all laser powers; however, to different degrees. This can be explained as the meltpool and thus the associated heat-affected zone caused by high speeds is expected to be smaller than that caused by lower speeds. A smaller meltpool and heat-affected zone would reduce the seepage of molten material into the powder bed, which would mean that the dross formation and the associated dimensional inaccuracy would be reduced;
- As seen in Figure 4c, increasing laser powers at any scan spacing value increases the dimensional error. This can be explained as increasing the laser power causes more energy to be absorbed by the powder, causing greater overheating of loose powder and larger dross formations due to the larger melt pools, and thus a larger associated heat-affected zone;
- As seen in Figure 4f, increasing the scan speed at any scan spacing value decreases the dimensional error up to a certain point of around 80 µm, after which it begins to increase once again;
- Figure 4d, e show that with an increasing laser power, the dimensional error increases and decreases with an increase in scan speed. The reasons for this have already been discussed in the previous points. However, it can also be noted that the scan spacing of 75 µm always displayed a better dimensional accuracy than 50 µm and 100 µm;
- The variation in the effect of the different scan strategies is small, as the graphs in Figure 4a–c show that all three lines of ‘Stripes’, ‘Rectangular Cell’, and ‘Hexagonal Cell’ are quite close together and always follow the same trend. This can be explained due to the small size of the down-facing area. Therefore, it can be concluded that the choice of scanning strategy plays a minimal role within the down-facing area;
- While looking at the effect of layer thickness in Figure 5d, it is clear that the dimensional error % increased with an increase in laser power, while it decreased while increasing the scan speed. However, with regards to the scan spacing in Figure 5f, the dimensional error % decreases at first, but at a level of around 80 µm, it increases once again. Figure 5e shows that at both layer thicknesses, the dimensional error % decreases while increasing the scan speed.
These observations can help us understand the effect of individual process parameters on the dimensional error and indicate the trend that is produced while varying the process parameters.
ANOVA analysis was also conducted in order to get a deeper understanding of the significance of the process parameters on the dimensional accuracy, as it also considers the interaction effects. The results indicate that the laser power (P-Value = 0.00088723) is the most significant process parameter, followed by the layer thickness (P-Value = 0.0032135) and scan speed (P-Value = 0.0048101). The next highest significance is given to the interaction effect of the laser power and scan speed (P-Value = 0.30819). These were the four most significant effects. It is also important to note that the scan strategy was determined to be one of the most insignificant parameters, with a P-Value of 0.94519.
The information obtained from the ANOVA analysis and the effect plots seen in Figure 4 and Figure 5 can help to determine the best process parameters that must be chosen for conducting further validation experiments and for actual optimization of the process itself.
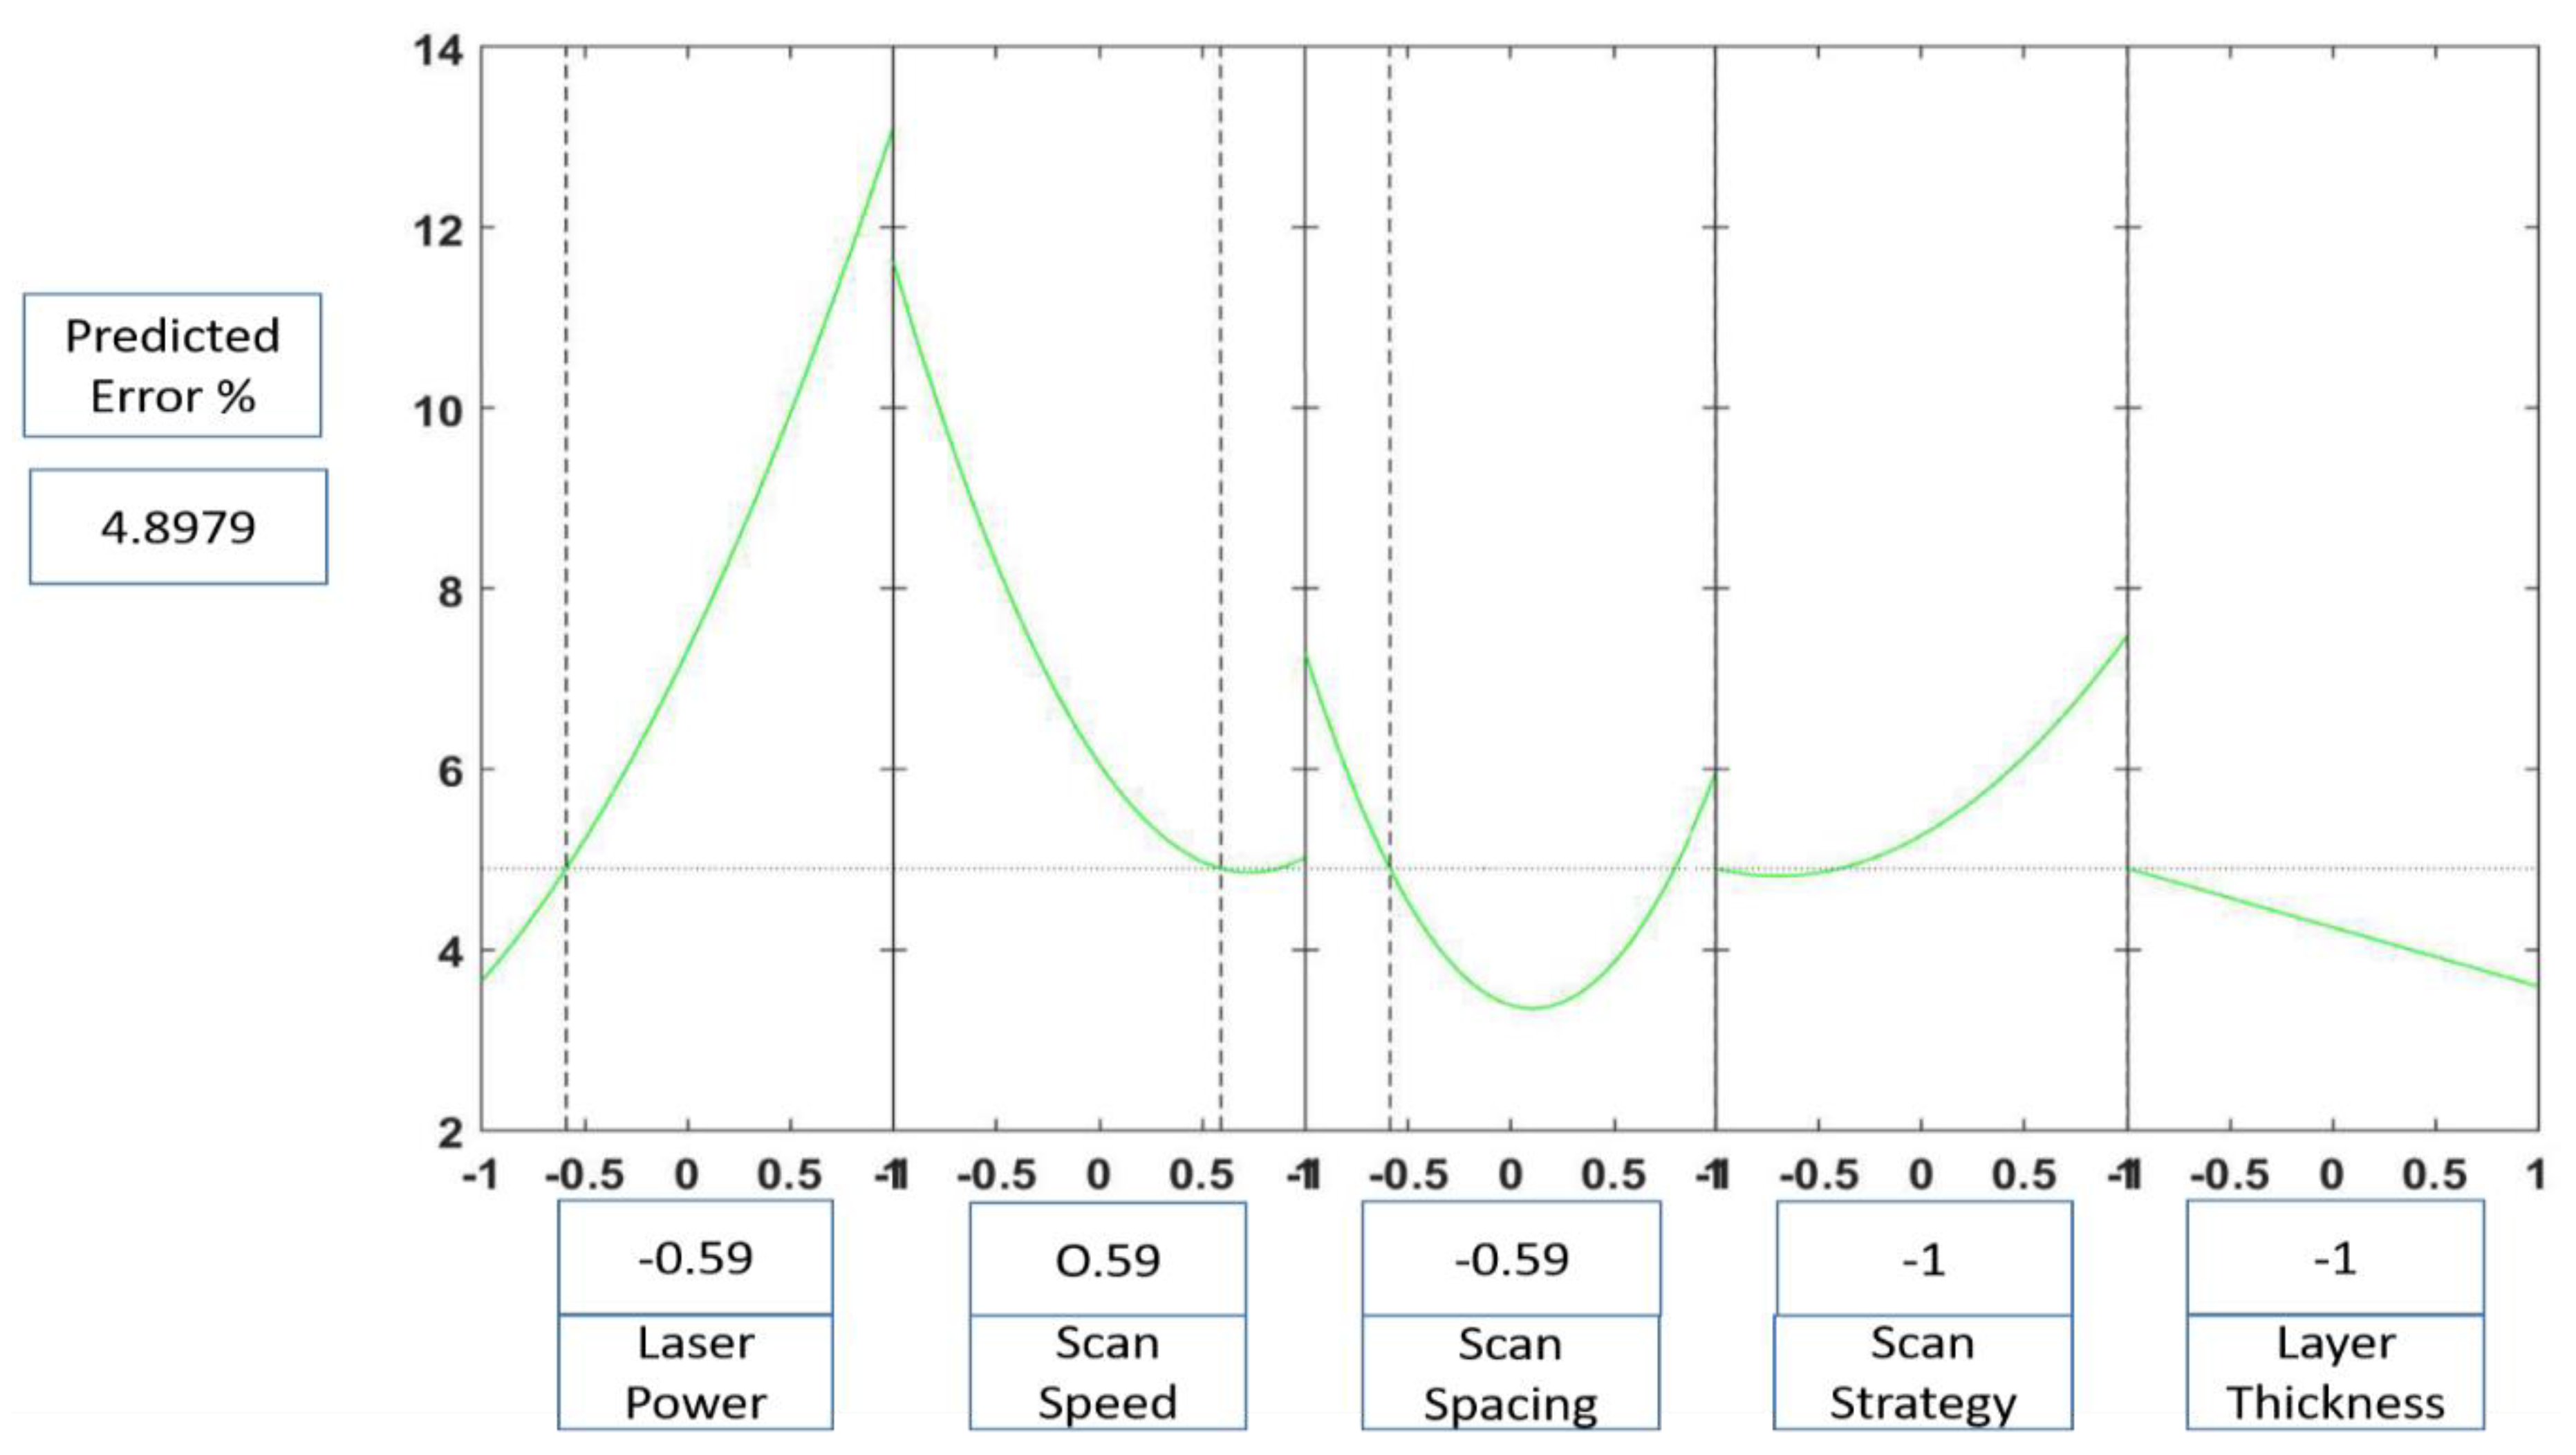
The regression equation was then used to generate the empirical prediction slice plots, as shown in Figure 6. The prediction slice plot shows the main effect of each process parameter and displays the estimated dimensional error percentage. The prediction slice plot can be used to determine the predicted dimensional error in a part at various process parameters, as well as scanning strategies and layer thicknesses. The plot was tested against the initial experimental results and its predictions were found to be a maximum of 5% away from the measured value. In the case of Figure 4, the equation predicted an error percentage of 4.8%, while the actual measured error percentage for this parameter combination was 2.02%.
3.2. Testing of Prediction Slice Plot
The empirical prediction slice plot that was created based on the regression equation was then tested by the printing of new samples using various process parameters. For these test prints, a strip scanning strategy was chosen and the new samples were printed with a layer thickness of 60 µm. The results can be seen below in Table 3.
These results indicate a high level of prediction accuracy in samples which have a lower dimensional error and as the inherent dimensional error of the sample increases, the predicted error percentage also increases, as seen in Table 1. In sample 1, the predicted error was 4.45% and the measured error % was 4.08%, while in sample 5, the predicted error % was 26.04% and the measured error % was 29.74%. The reason for this needs to be further explored, and full-scale validation will be conducted in the next step of the research.
However, the prediction accuracy of this regression equation at this stage is considered to be good, as the accuracy is quite high at lower dimensional deviations. This is required since the prediction accuracy only decreases as the dimensional deviations increase and in our tests that is when the dross formation leads to a dimensional error % of around 20%, which realistically, would never be an acceptable printing window anyway.
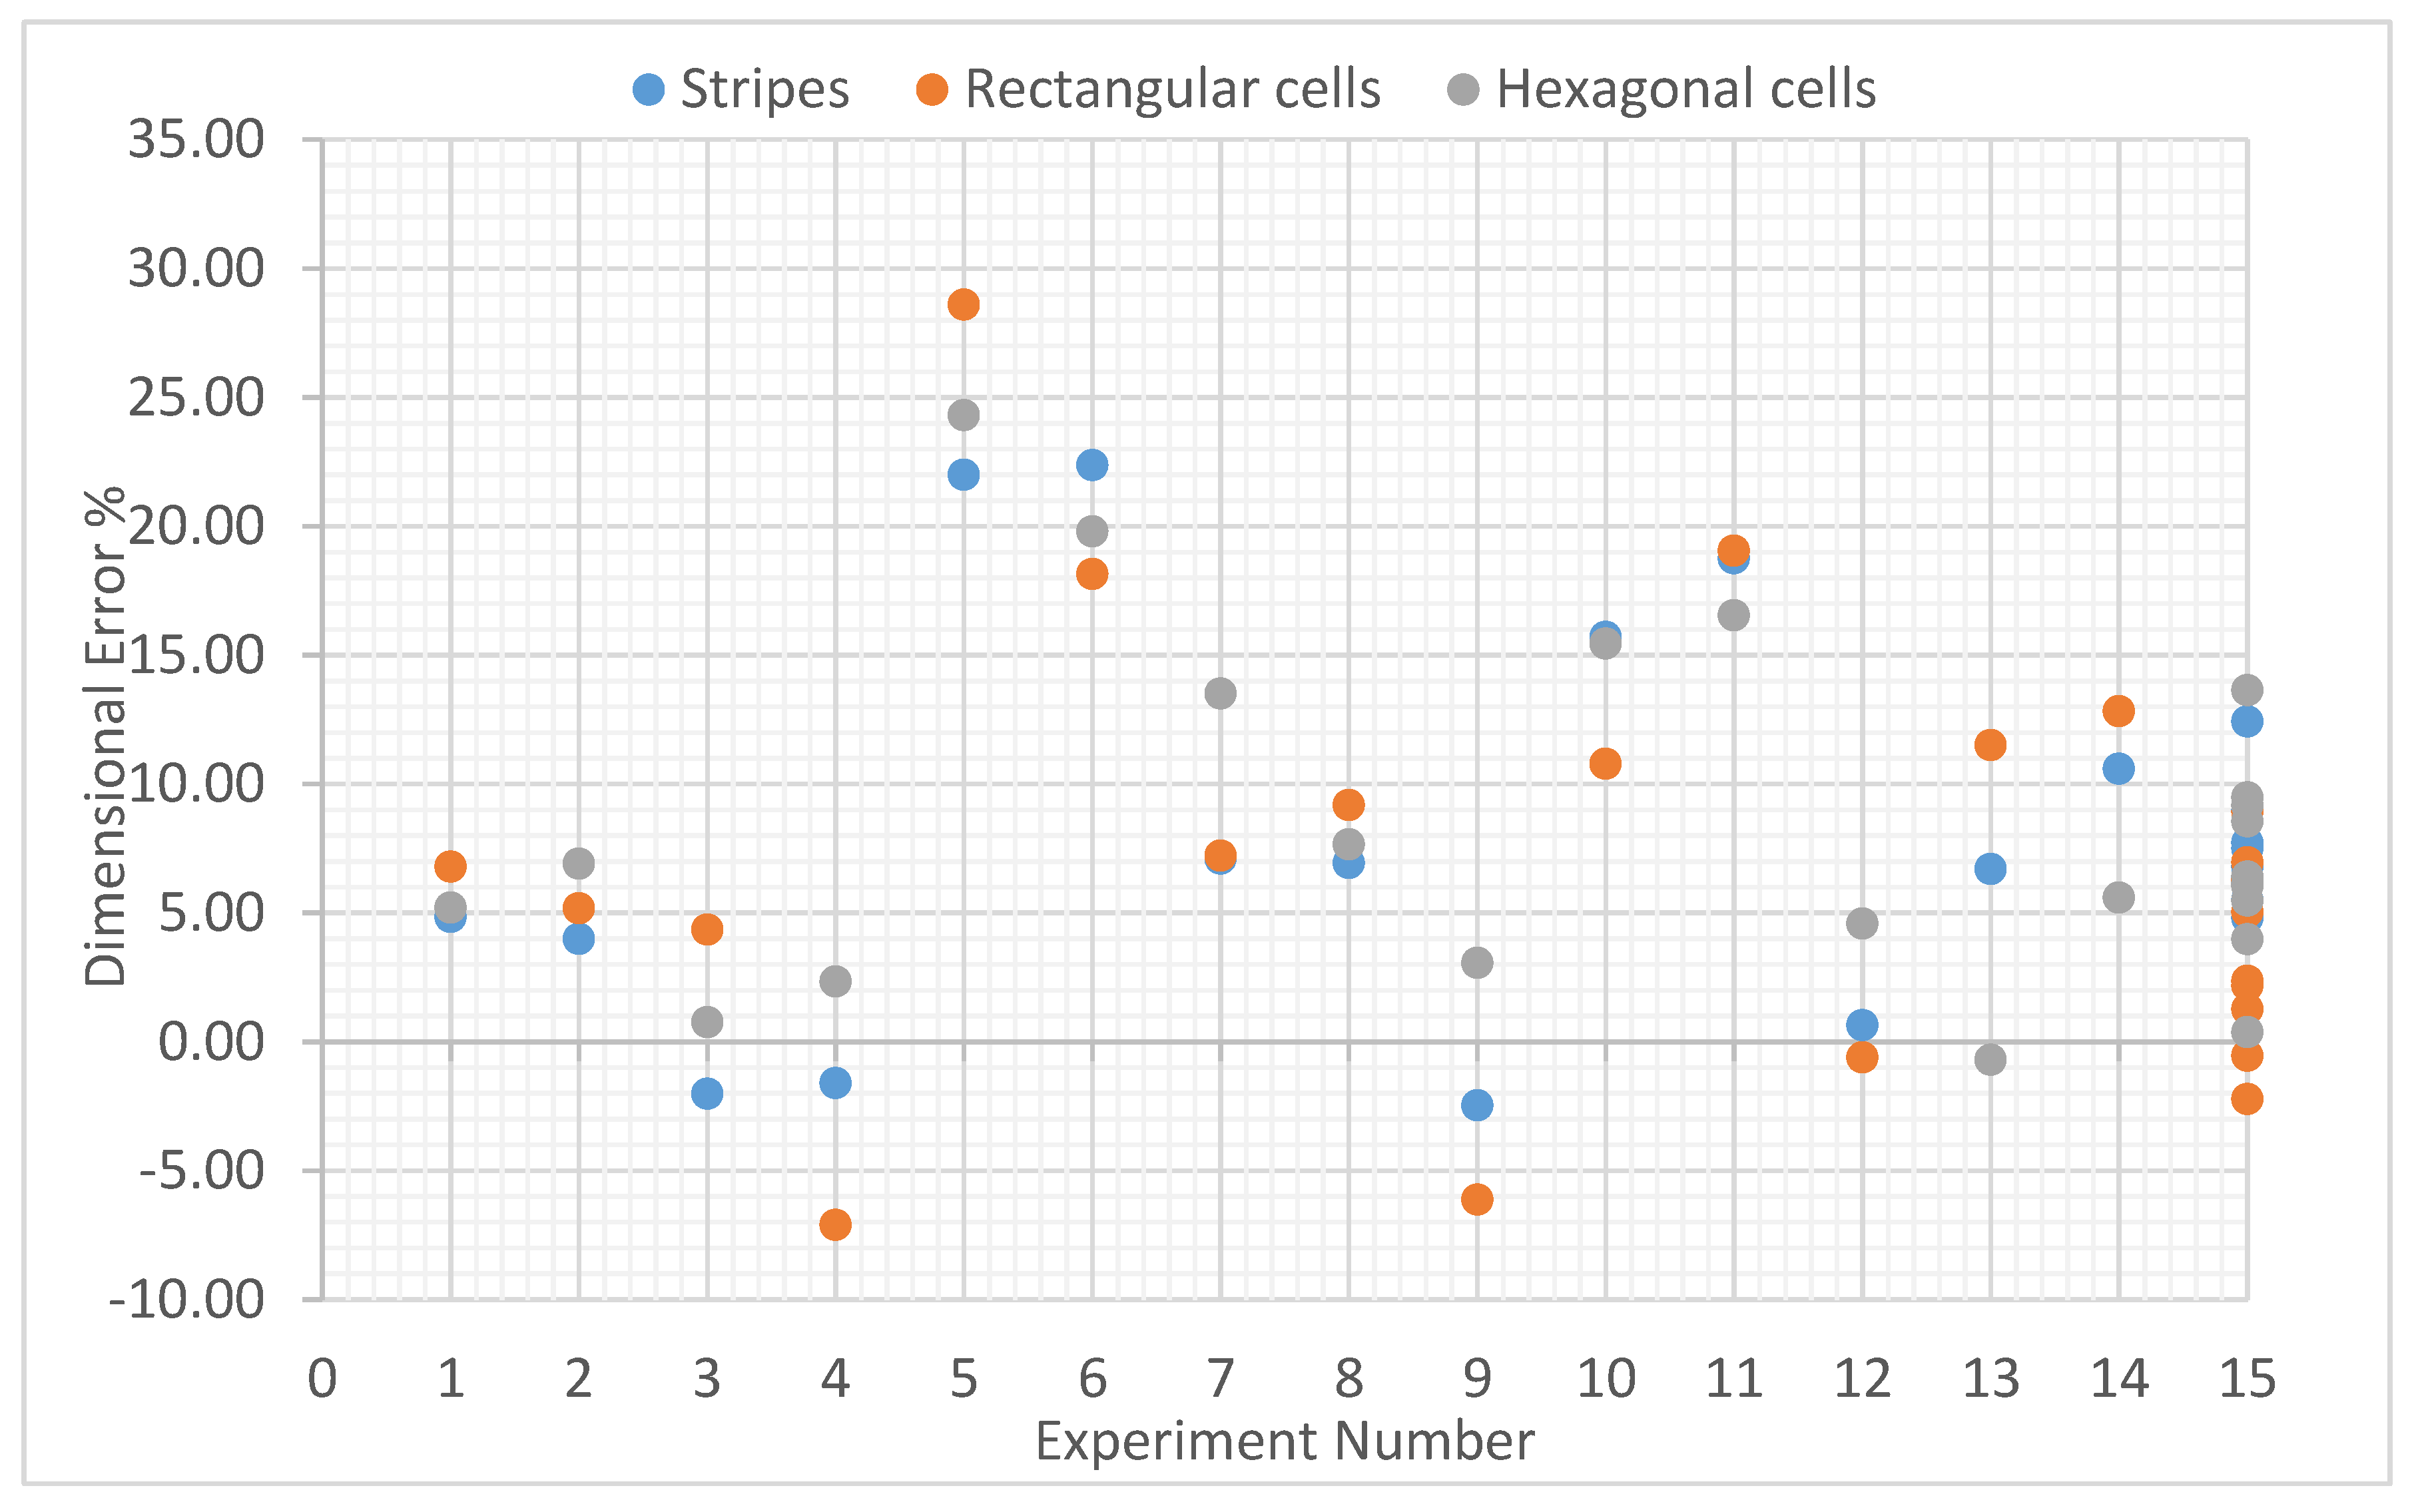
Figure 7 depicts the average measured error % of the samples with a 60 µm layer thickness and various scanning patterns. The measured points depict an average of five measurements and it can be seen that for most of the trials, even the average measurements display significant overlap or are close to each other. For trial 15, which includes the repeated center point samples, it can be seen that there is significant overlap among the different scanning patterns and the variation of the other trial points also established the stability of the process and thus the analysis process.
This can be explained as the effective area where the parameters are varied is relatively small, since the down-facing area only extends for approximately 200 µm into the part and the three different scanning strategies that were tested were not different enough to have a significant effect. The reason for this is that the cells in the rectangular and hexagonal cell scanning strategies are normally much larger than the entire down-facing area and the effective scanning strategy that was employed was thus similar to the stripe scanning strategy, regardless of the chosen strategy. Therefore, in further studies, the scanning strategy will not be considered as a parameter for optimization within the down-facing area. It is important to stress that the scanning strategy does play a significant role when varied within the bulk of the part and this has been the focus of other studies.
Therefore, one can recommend that while choosing a scanning pattern, specifically one for within the down-facing area, the focus can be placed on choosing the best pattern that contributes the most towards productivity or a decreased build time. Alternatively, simply the scanning pattern that is employed within the bulk of the part can be confidently chosen for the down-facing area. The layer thickness plays a significant role in the productivity of the process [35] and should therefore be chosen depending on the required build times and quality. The quadratic regression equation can be used to make this decision as this paper also shows the effect of the layer thickness on the dimensional error of the L-PBF part.
4. Conclusions
This paper has presented the first results of a statistical analysis of the dimensional error in L-PBF parts. The process parameters under investigation were the laser power, scan speed, scan spacing, scan strategy, and the layer thickness. An image processing technique was developed to measure the thickness of printed samples. A statistical study was conducted and a quadratic regression equation was developed. The interaction effects of the process parameters were plotted and clear trends can be seen in their effects on the dimensional error, which have been summarized.
The ANOVA analysis showed that the laser power was the most significant process parameter in terms of the dimensional error, which is in accordance with previous research and results. In terms of the significance, the laser power was the most significant, followed by the layer thickness, scan speed, and the interaction effect of the laser power and scan speed. In the context of an optimization problem, it is also important to realize the process parameters that are insignificant for the purposes of parameter optimization within the down-facing area of an L-PBF printed part, namely the scanning pattern. In particular, the effects of the three different scanning strategies were similar and almost identical at certain points. The ANOVA analysis explained this, as the expected significance of the scanning pattern was inherently low. Therefore, any variation in the scanning pattern is only going to have a minimal effect on the overall dimensional error % of the test piece.
This study establishes a starting point which can encourage further work in the area of the process modeling of the L-PBF process and characterization of dross formation in unsupported down-facing surfaces. The main inferences can be summarized as follows:
- At this stage, the experimental trial conducted under the parameters of laser power of 90 w, scan speed of 1235, and scan spacing of 60 µm; laser power of 90 w, scan speed of 1235, and scan spacing of 90 µm; and laser power of 150 w, scan speed of 1599, and scan spacing of 75 µm, gave the lowest dimensional error percentages;
- The regression equation establishes a first step and when tested with new prints, gives promising results, and validation through further data collection is required in order to improve the prediction;
- The effect of different scanning patterns within down-facing areas is negligible and any one can be chosen based on the designers’ preference;
- This model must also consider other quality aspects of down-facing surfaces, such as the surface topography and curvature in the surface, and is the focus of parallel current work. In this work, the bulk area was first printed and the down-facing area (with down-facing parameters) was then printed. There is room for incorporation of the gradual changing of process parameters between bulk and down-facing areas such that they are scanned simultaneously. The current work can act as a starting point for such research;
- The data-driven process analysis methodology has shown potential to provide acceptable predictions of the dimensional performance of the L-PBF process and further work will be done to characterize dross formation in an effective and productive manner. The authors conclude on a positive note given the promising result obtained by modeling the L-PBF process, as this is often plagued by a low process repeatability, especially within the down-facing area, where the complex dross formation phenomenon further decreases the process’s stability.
Although understanding the effect of individual process parameters will help to improve the overall process knowledge, using the individual process parameters as such for drawing inferences can be difficult. Therefore, it is the opinion of the authors that all proceeding work must consider the inclusion of combined process parameters for characterizing the process. This includes the use of parameters such as the line energy density and popular volumetric energy density. This might be even more useful for the purposes of this study as dross formation is caused by the creation of an overheated zone. The overheated zone results in the formation of a large meltpool, which, due to its higher wettability property, is able to seep deeper into the powder bed, where, upon solidification, dross is manifested. Therefore, a correlation between the energy density and dross formation can potentially be drawn and this will be further qualitatively and quantitatively explored in a future study.
Author Contributions
Conceptualization, A.C., A.E, L.T., and S.G.S.; methodology, A.C, A.E., L.T., and S.G.S.; software, A.C. and A.E.; validation, A.C. and A.E.; formal analysis, A.C.; investigation, A.C.; resources, L.T., S.G.S.; data curation, A.C. and A.E.; writing—original draft preparation, A.C. and A.E.; writing—review and editing, A.E., L.T., and S.G.S.; visualization, A.C. and A.E.; supervision, L.T. and S.G.S.; project administration, L.T. and S.G.S.; funding acquisition, L.T. and S.G.S. All authors have read and agreed to the published version of the manuscript.
Funding
This work was conducted as part of the H2020-MSCA-ITN-2016 project PAM2, Precision Additive Metal Manufacturing, which is funded by The EU Framework Programme for Research and Innovation—Grant Agreement No. 721383.
Acknowledgments
The authors acknowledge the support provided by the KIT-Publication Fund of the Karlsruhe Institute of Technology. Support provided by the Karlsruhe Nano Micro Facility (KNMF-LMP, http://www.knmf.kit.edu/), Helmholtz research infrastructure at KIT, as well as the support of the Deutsche Forschungsgemeinschaft is gratefully acknowledged.
Conflicts of Interest
The authors declare no conflict of interest.
References
- Tofail, S.A.M.; Koumoulos, E.P.; Bandyopadhyay, A.; Bose, S.; O’Donoghue, L.; Charitidis, C. Additive manufacturing: Scientific and technological challenges, market uptake and opportunities. Mater. Today 2018, 21, 22–37. [Google Scholar] [CrossRef]
- Jiang, R.; Kleer, R.; Piller, F.T. Predicting the future of additive manufacturing: A delphi study on economic and societal implications of 3d printing for 2030. Technol. Forecast. Soc. Chang. 2017, 117, 84–97. [Google Scholar] [CrossRef]
- Savolainen, J.; Collan, M. How additive manufacturing technology changes business models?—Review of literature. Addit. Manuf. 2020, 32, 101070. [Google Scholar] [CrossRef]
- Attaran, M. The rise of 3-d printing: The advantages of additive manufacturing over traditional manufacturing. Bus. Horiz. 2017, 60, 677–688. [Google Scholar] [CrossRef]
- Berman, B. 3-d printing: The new industrial revolution. Bus. Horiz. 2012, 55, 155–162. [Google Scholar] [CrossRef]
- Ngo, T.D.; Kashani, A.; Imbalzano, G.; Nguyen, K.T.Q.; Hui, D. Additive manufacturing (3d printing): A review of materials, methods, applications and challenges. Compos. Part B Eng. 2018, 143, 172–196. [Google Scholar] [CrossRef]
- Froes, F.; Boyer, R.; Dutta, B. Introduction to aerospace materials requirements and the role of additive manufacturing. In Additive Manufacturing for the Aerospace Industry; Froes, F., Boyer, R., Eds.; Elsevier: Amsterdam, The Netherlands, 2019; pp. 1–6. [Google Scholar]
- Moshiri, M.; Candeo, S.; Carmignato, S.; Mohanty, S.; Tosello, G. Benchmarking of laser powder bed fusion machines. J. Manuf. Mater. Process. 2019, 3, 85. [Google Scholar] [CrossRef] [Green Version]
- Liu, S.; Shin, Y.C. Additive manufacturing of ti6al4v alloy: A review. Mater. Des. 2019, 164, 107552. [Google Scholar] [CrossRef]
- Najmon, J.C.; Raeisi, S.; Tovar, A. Review of additive manufacturing technologies and applications in the aerospace industry. In Additive Manufacturing for the Aerospace Industry; Froes, F., Boyer, R., Eds.; Elsevier: Amsterdam, The Netherlands, 2019; pp. 7–31. [Google Scholar]
- Sinico, M.; Ranjan, R.; Moshiri, M.; Ayas, C.; Langelaar, M.; Witvrouw, A.; Keulen, F.; Dewulf, W. A Mold Insert Case Study on Topology Optimized Design for Additive Manufacturing. In Proceedings of the Solid Freeform Fabrication Symposium 2019—An Additive Manufacturing Conference, Austin, TX, USA, 12–14 August 2019. [Google Scholar]
- Bayat, M.; Mohanty, S.; Hattel, J.H. Multiphysics modelling of lack-of-fusion voids formation and evolution in in718 made by multi-track/multi-layer l-pbf. Int. J. Heat Mass Transf. 2019, 139, 95–114. [Google Scholar] [CrossRef]
- Charles, A.; Elkaseer, A.; Thijs, L.; Hagenmeyer, V.; Scholz, S. Effect of process parameters on the generated surface roughness of down-facing surfaces in selective laser melting. Appl. Sci. 2019, 9, 1256. [Google Scholar] [CrossRef] [Green Version]
- Solheid, J.; Elkaseer, A.; Wunsch, T.; Charles, A.; Seifert, H.; Pfleging, W. Effect of Process Parameters on Surface Texture Generated by Laser Polishing of Additively Manufactured ti-6al-4v; SPIE: Bellingham, WA, USA, 2020; Volume 11268. [Google Scholar]
- Baier, M.; Zanini, F.; Savio, E.; Carmignato, S. A New Conversion Approach between Different Characterization Methods to Measure the Spot Size of Micro Computed Tomography Systems. In Proceedings of the euspen 2018, Venice, Italy, 4–8 June 2018. [Google Scholar]
- Wang, D.; Mai, S.; Xiao, D.; Yang, Y. Surface quality of the curved overhanging structure manufactured from 316-l stainless steel by slm. Int. J. Adv. Manuf. Tech. 2016, 86, 781–792. [Google Scholar] [CrossRef]
- Fox, J.C.; Moylan, S.P.; Lane, B.M. Effect of process parameters on the surface roughness of overhanging structures in laser powder bed fusion additive manufacturing. Procedia Cirp 2016, 45, 131–134. [Google Scholar] [CrossRef] [Green Version]
- Cacace, S.; Cristiani, E.; Rocchi, L. A level set based method for fixing overhangs in 3d printing. Appl. Math. Model. 2017, 44, 446–455. [Google Scholar] [CrossRef] [Green Version]
- Zhang, K.; Cheng, G.; Xu, L. Topology optimization considering overhang constraint in additive manufacturing. Comput. Struct. 2019, 212, 86–100. [Google Scholar] [CrossRef]
- Driessen, A.J.M. Overhang constraint in topology optimisation for additive manufacturing: A density gradient based approach. Master’s Thesis, Delft University of Technology, Delft, The Netherlands, 2016. [Google Scholar]
- Mertens, R.; Clijsters, S.; Kempen, K.; Kruth, J.-P. Optimization of scan strategies in selective laser melting of aluminum parts with downfacing areas. J. Manuf. Sci. Eng. 2014, 136, 061012. [Google Scholar] [CrossRef]
- Cooper, K.; Steele, P.; Cheng, B.; Chou, K. Contact-free support structures for part overhangs in powder-bed metal additive manufacturing. Inventions 2018, 3, 2. [Google Scholar] [CrossRef] [Green Version]
- Wang, X.; Chou, K. Effect of support structures on ti-6al-4v overhang parts fabricated by powder bed fusion electron beam additive manufacturing. J. Mater. Process. Technol. 2018, 257, 65–78. [Google Scholar] [CrossRef]
- Paggi, U.; Ranjan, R.; Thijs, L.; Ayas, C.; Langelaar, M.; van Keulen, A.; van Hooreweder, B. New support structures for reduced overheating on downfacing regions of direct metal printed parts. In 30th Annual International Solid Freeform Fabrication Symposium; University of Texas: Austin, TX, USA, 2019. [Google Scholar]
- Charles, A.; Elkaseer, A.; Thijs, L.; Hagenmeyer, V.; Scholz, S. Prediction of Dimensional Error in Down-Facing Surfaces for Laser Powder Bed Fusion Parts. In Proceedings of the World Congress on Micro and Nano Manufacturing, Raleigh, NC, USA, 10–12 September 2019. [Google Scholar]
- Elkaseer, A.; Schneider, S.; Scholz, S. Fdm Process Optimisation for Low Surface Roughness and Energy Consumption. In Proceedings of the World Congress on Micro and Nano Manufacturing, Raleigh, NC, USA, 10–12 September 2019; pp. 270–273. [Google Scholar]
- Tapia, G.; Elwany, A.H.; Sang, H. Prediction of porosity in metal-based additive manufacturing using spatial gaussian process models. Addit. Manuf. 2016, 12, 282–290. [Google Scholar] [CrossRef]
- Sun, J.; Yang, Y.; Wang, D. Parametric optimization of selective laser melting for forming ti6al4v samples by taguchi method. Opt. Laser Technol. 2013, 49, 118–124. [Google Scholar] [CrossRef]
- Marrey, M.; Malekipour, E.; El-Mounayri, H.; Faierson, E.J. A framework for optimizing process parameters in powder bed fusion (pbf) process using artificial neural network (ann). Procedia Manuf. 2019, 34, 505–515. [Google Scholar] [CrossRef]
- Charles, A.; Elkaseer, A.; Salem, M.; Thijs, L.; Scholz, S. Ann-Based Modelling of Dimensional Accuracy in l-pbf. In Proceedings of the euspen/ASPE 2019, Nantes, France, 16–18 September 2019; pp. 39–42. [Google Scholar]
- Thomas, D.; Bibb, R. Identifying the Geometric Constraints and Process Specific Challenges of Selective Laser Melting. In Proceedings of the Time Compression Technologies Rapid Manufacturing Conference, Coventry, UK, October 2008. [Google Scholar]
- Calignano, F. Design optimization of supports for overhanging structures in aluminum and titanium alloys by selective laser melting. Mater. Des. 2014, 64, 203–213. [Google Scholar] [CrossRef]
- Han, Q.; Gu, H.; Soe, S.; Setchi, R.; Lacan, F.; Hill, J. Manufacturability of alsi10mg overhang structures fabricated by laser powder bed fusion. Mater. Des. 2018, 160, 1080–1095. [Google Scholar] [CrossRef]
- Montgomery, D.C. Design and Analysis of Experiments, 10 ed.; John Wiley: Chichester, UK, 2019; Volume xii. [Google Scholar]
- de Formanoir, C.; Paggi, U.; Colebrants, T.; Thijs, L.; Li, G.; Vanmeensel, K.; Van Hooreweder, B. Increasing the productivity of laser powder bed fusion: Influence of the hull-bulk strategy on part quality, microstructure and mechanical performance of ti-6al-4v. Addit. Manuf. 2020, 33, 101129. [Google Scholar] [CrossRef]
Figure 1.
Depiction of dross formation on the down-facing surfaces of a part produced by laser-based powder bed fusion.
Figure 1.
Depiction of dross formation on the down-facing surfaces of a part produced by laser-based powder bed fusion.

Figure 2.
The three different scan patterns used in the study were (a) stripes, (b) rectangular cells, and (c) hexagonal cells.
Figure 2.
The three different scan patterns used in the study were (a) stripes, (b) rectangular cells, and (c) hexagonal cells.

Figure 3.
Printed part that underwent image processing, where green lines indicate the detected edges that were used for measurement.
Figure 3.
Printed part that underwent image processing, where green lines indicate the detected edges that were used for measurement.

Figure 4.
Plots depicting the interaction effects of the laser power, scan speed, and scan spacing.

Figure 5.
Plots depicting the interaction effects of the scan strategy and layer thickness with the laser power, scan speed, and scan spacing.
Figure 5.
Plots depicting the interaction effects of the scan strategy and layer thickness with the laser power, scan speed, and scan spacing.

Figure 6.
Prediction slice plots created using the developed regression equation.

Figure 7.
Average measurements of dimensional error % amongst three scan strategies for a 60 µm layer thickness.
Figure 7.
Average measurements of dimensional error % amongst three scan strategies for a 60 µm layer thickness.


Table 1.
Process parameters and levels.
| Parameter | Levels |
|---|---|
| Laser Power (W) | 50, 90, 150, 210, 250 |
| Scan Speed (mm/s) | 200, 465, 850, 1235, 1500 |
| Scan Spacing (µm) | 50, 60, 75, 90, 100 |
| Scan Pattern | Stripes, rectangular cells, hexagonal cells |
| Layer Thickness (µm) | 60, 90 |
Table 2.
Design of Experiments (DoE) for experimental trials.
| Experiment Nr. | Laser Power (W) | Scan Speed (mm/s) | Scan Spacing (µm) |
|---|---|---|---|
| 1 | 90 | 465 | 60 |
| 2 | 90 | 465 | 90 |
| 3 | 90 | 1235 | 60 |
| 4 | 90 | 1235 | 90 |
| 5 | 210 | 465 | 60 |
| 6 | 210 | 465 | 90 |
| 7 | 210 | 1235 | 60 |
| 8 | 210 | 1235 | 90 |
| 9 | 50 | 850 | 75 |
| 10 | 250 | 850 | 75 |
| 11 | 150 | 200 | 75 |
| 12 | 150 | 1500 | 75 |
| 13 | 150 | 850 | 50 |
| 14 | 150 | 850 | 100 |
| 15–24 | 150 | 850 | 75 |
Table 3.
Test results.
| Laser Power (W) | Scan Speed (mm/s) | Scan Spacing (µm) | Measured Error % | Prediction Made by the Regression Equation (%) | Difference in Prediction % | Error of the Equation (%) |
|---|---|---|---|---|---|---|
| 150 | 1500 | 75 | 4.08 | 4.45 | 0.37 | 8.47 |
| 140 | 1000 | 75 | 6.43 | 6.53 | 0.09 | 1.49 |
| 200 | 500 | 90 | 20.93 | 18.03 | 2.90 | 16.10 |
| 175 | 390 | 60 | 17.44 | 18.05 | 0.60 | 3.32 |
| 250 | 370 | 90 | 29.74 | 26.04 | 3.70 | 14.20 |
© 2020 by the authors. Licensee MDPI, Basel, Switzerland. This article is an open access article distributed under the terms and conditions of the Creative Commons Attribution (CC BY) license (http://creativecommons.org/licenses/by/4.0/).
Share and Cite
MDPI and ACS Style
Charles, A.; Elkaseer, A.; Thijs, L.; Scholz, S.G. Dimensional Errors Due to Overhanging Features in Laser Powder Bed Fusion Parts Made of Ti-6Al-4V. Appl. Sci. 2020, 10, 2416. https://doi.org/10.3390/app10072416
AMA Style
Charles A, Elkaseer A, Thijs L, Scholz SG. Dimensional Errors Due to Overhanging Features in Laser Powder Bed Fusion Parts Made of Ti-6Al-4V. Applied Sciences. 2020; 10(7):2416. https://doi.org/10.3390/app10072416
Chicago/Turabian StyleCharles, Amal, Ahmed Elkaseer, Lore Thijs, and Steffen G. Scholz. 2020. "Dimensional Errors Due to Overhanging Features in Laser Powder Bed Fusion Parts Made of Ti-6Al-4V" Applied Sciences 10, no. 7: 2416. https://doi.org/10.3390/app10072416
Note that from the first issue of 2016, this journal uses article numbers instead of page numbers. See further details here.