Modified Levy Flight Optimization for a Maximum Power Point Tracking Algorithm under Partial Shading
by
 , and
, and
Chanuri Charin
1,2, 
Dahaman Ishak
1 ,
,
Muhammad Ammirrul Atiqi Mohd Zainuri
3,* and
Baharuddin Ismail
2,4 1
School of Electrical and Electronic Engineering, Universiti Sains Malaysia, Pulau Pinang 14300, Malaysia
2
Centre of Excellence for Renewable Energy (CERE), Universiti Malaysia Perlis, Perlis 02600, Malaysia
3
Department of Electrical, Electronic and Systems Engineering, Faculty of Engineering and Built Environment, Universiti Kebangsaan Malaysia, Selangor 43600, Malaysia
4
Faculty of Electrical Engineering Technology, Universiti Malaysia Perlis, Perlis 02600, Malaysia
*
Author to whom correspondence should be addressed.
Appl. Sci. 2021, 11(3), 992; https://doi.org/10.3390/app11030992
Submission received: 15 October 2020
/
Revised: 23 November 2020
/
Accepted: 25 November 2020
/
Published: 22 January 2021
(This article belongs to the Section Energy Science and Technology)
Abstract
:Featured Application
This paper introduces a new optimization technique for tracking the maximum power point especially under partial shading conditions. The proposed technique overcomes the failure to track the global maximum power point under partial shading conditions, low tracking speed, and low efficiency. The proposed algorithm will therefore allow the best performance without any additional cost and complexity for any implemented photovoltaic configuration, thereby maximizing the use of photovoltaic renewable energy for any significant application.
Abstract
This paper presents a novel modified Levy flight optimization for a photovoltaic PV solar energy system. Conventionally, the Perturb and Observe (P&O) algorithm has been widely deployed in most applications due to its simplicity and ease of implementation. However, P&O suffers from steady-state oscillation and stability, besides its failure in tracking the optimum power under partial shading conditions and fast irradiance changes. Therefore, a modified Levy flight optimization is proposed by incorporating a global search of beta parameters, which can significantly improve the tracking capability in local and global searches compared to the conventional methods. The proposed modified Levy flight optimization is verified with simulations and experiments under uniform, non-uniform, and dynamic conditions. All results prove the advantages of the proposed modified Levy flight optimization in extracting the optimal power with a fast response and high efficiency from the PV arrays.
1. Introduction
Greater awareness of clean energy has undoubtedly forced many governments and private sectors to adopt renewable energy resources [1,2]. Typically, the energy demand in a household is around 7% of the total energy usage daily [3,4]. Mainly, the energy supply is driven by fossil fuels. For many decades, fossil fuel has been used in modern civilization as the main source of electricity. The burning of fossil fuels causes global warming. The carbon emitted from fossil fuel has become an environmental pollutant. Thus, the need for low carbon-based sources of electricity (green energy) such as wind, solar, biomass, etc., is essential in the coming future [5,6]. Among these sources, solar photovoltaic (PV) energy is seen as the best potential candidate due to its availability and cleanliness [7,8,9,10]. Thus, due to this interest, focusing on solar PV energy is prioritized.
Operating a PV system to the utmost efficiency is essential for more commercial and economic reasons [2]. However, due to the non-linear characteristics of PV cells and rapid changes in environmental conditions such as temperature and irradiance, the effort of tracking maximum PV power may become challenging [11,12]. The optimal performance of a PV system can only be realized by incorporating the maximum power point tracker (MPPT) algorithm in conjunction with the power converters [13,14]. Maximum power is extracted by the MPPT algorithm from the PV array. Numerous MPPT techniques proposed by researchers are capable of tracking the optimum power of the PV system. Typically, the most preferable methods are Perturb and Observe (P&O) [15,16,17] and Incremental Conductance (IC) [18]. These two conventional methods generally work well under uniform conditions and are easy to implement [19].
The high demand for high maximum power output from the PV source can only be realized by connecting several PV panels in series and parallel to meet the current and voltage of the system. Thus, due to the large footprint of PV panels, the environmental condition such as shadows from buildings, trees, and moving clouds are unavoidable [20]. The situation may be worsened when considering non-uniform irradiances that penetrate each PV module [21]. This creates an unwanted condition known as partial shading condition (PSC) [22]. Under PSC, few peaks occur in the power-voltage (P-V) and current-voltage (I-V) curves. Those unreal peaks are known as the local maxima power point (LMPP), and only one real peak is known as the global maxima power point (GMPP) [23,24,25,26]. The conventional P&O and IC methods would most likely fail to distinguish the GMPP. The algorithms of P&O and IC may get trapped at a local peak which significantly affects the energy conversion and lowers the PV system efficiency [2,12,25,27]. Despite this disadvantage, both techniques also suffer from continuous oscillation around the MPP area. Various efforts are carried out to reduce the oscillation but this is accomplished to the extent of reducing the tracking speed [28,29].
Soft computing techniques have been adopted by several researchers to mainly overcome the problem associated with shading conditions [30,31,32,33]. A few notable ones such as Fuzzy Logic Control (FL) [29] and Particle Swarm Optimization (PSO) [34,35] are implemented by researchers in tracking the global maximum power point (GMPP). PSO is the most preferable method among all due to its simple formula, uncomplicated implementation, high efficiency, fast response, and zero steady-state oscillations [34,36,37]. However, recent studies indicate that PSO has intermittent performance under PSCs [38]. PSO tends to fail at LMPP under certain shading conditions [39]. In the PSO algorithm, the challenge is to define the random coefficient between the exploration and exploitation parameters. The perturbation of particles in PSO depends on the summation of vector position and velocity in which if a large perturbation is selected, it increases the perturbation but may cause the particles to overlook the optimum point. If a small perturbation is chosen, it may increase the number of iterations where a longer time is taken to reach the MPP [40].
Lately, the interest in metaheuristics optimization has caught the attention of many researchers [41]. The biological behavior of animals or birds can be simulated to search the optimum solution of a given problem. Metaheuristics optimization algorithms are implemented in MPPT such as Ant Colony Optimization, Artificial Bee Colony [2], Cuckoo search [40], and the Fireflies Algorithm [42]. The performance of these algorithms in MPPT application shows good results in terms of tracking speed, steady-state oscillation, and stability.
Levy flight has been applied in various fields, especially in biology and engineering [43]. The study done by authors [44,45] reveals that the technique of using Levy flight in PSO by replacing the Levy distribution in PSO shows a great advantage in terms of the time response compared to the conventional PSO technique. In their studies, this technique is compared with a set of problems with different benchmark functions. The research reveals that Levy-based PSO outperforms the conventional PSO with a fast response time due to the characteristics of the Levy flight distribution with fat-tailed characteristics [43]. This significantly inspired the authors to apply this technique in MPP.
This paper presents a modified LFO algorithm that incorporates some modifications to the conventional Levy flight search. The proposed method is inspired by PSO behavior in the search of MPPT, and the formula of Levy flight with modification of the β parameter to the global best particles is included. This has significantly improved the performance of the conventional Levy flight with the global search capability in the algorithm. The response time and efficiency of MPPT in tracking local and global optimums are significantly improved. Section 2 explains the PV configuration, modeling, and converter system. Section 3 presents the overview of Levy flight optimization. Section 4 describes MPPT with the modified Levy Flight Optimization. Section 5 and Section 6 present the results and discussion from the simulation and experiment, respectively. Lastly, the conclusion is given in Section 7.
2. PV System Configuration
Generally, a standalone PV system is configured which consists of a PV array as the input source, dc–dc boost converter, and a resistive load as shown in Figure 1 [3,46,47]. In this system, a MOSFET is used as a switching device. The gate signal is controlled by a PWM control technique. The variation of the duty cycle is controlled by the MPPT algorithm to track the maximum power point of the PV arrays.
2.1. Modeling of the PV Module
A single-diode model of a PV cell is depicted in Figure 2 [13]. The accuracy of the single-diode model is high and its complexity is low [48,49,50,51,52] compared to two-diode modeling [52,53,54,55]. A single-diode model is widely used by researchers [13,56] and is a reliable model for MPPT algorithm analysis [48,57,58,59,60]. The physics of the p-n junction of a PV cell are governed by five main parameters which are photon current Iph, output current I, terminal voltage V, shunt resistor Rsh, and series resistance Rs. The shunt resistor, Rsh, shows the leakage current of the p-n junction, while series resistance, Rs, represents the combination of the contact resistance, metal grid, and p and n layers [59].
The characteristics of the single-diode model of the PV cell are illustrated in Equation (1) [61,62]. It is noted that the characteristics of the PV cell involve nonlinearity [59].
I represents the output current of the PV cell, Iph indicates the photon current, Io represents the reverse saturation current of the cell, q indicates the electronics charge, V is the output voltage of the cell, n is the ideality factor, K is Boltzmann’s constant, and T is the absolute operating temperature. Ns is the total number of cells in series. Ish indicates the current flow through the shunt resistor.
The photon current is denoted by Equation (2) [63].
S represents the actual irradiance (W/m2), Sref is the irradiance under the reference condition (W/m2), Iph,ref is the light current under the reference condition (A), µIsc is the manufacturer-supplied temperature coefficient of the short-circuit current (A/K), TC is the actual cell temperature (K), and TC,ref is the actual reference temperature (K).
The reserve saturation current is given by Equation (3) [64].
Ego is the band gap energy, and n is the ideality factor.
2.2. Dc–dc Boost Converter Model
The selection of the converter for the MPPT controller depends on the option of using it either with or without a battery [3]. The presence of the battery requires the design of the converter to meet its voltage criteria at a constant load. For a system without a battery, the output voltage depends on the load chosen (load matching), and the power transfer follows the maximum power transfer theory [3]. Maximum power transfer can only occur when the load resistance matches the internal resistance of the PV panel as shown in Figure 3 [3].
The complexity to design the converter comes in due to the non-linearity of the PV module characteristics [13]. A few important steps in designing the converter are considered. Firstly, the range of the output resistance, Rload, needs to be determined. The range of Rload is calculated based on Equation (4) [13].
where Rm is the value of the resistance at the maximum power point and D is the duty cycle. The range of the optimum Rload is determined as shown in Equation (5) [13].
where Rm(max) denotes the resistance at the maximum power point at maximum irradiance, Dmin is the minimum duty cycle, Rload(opt) is the optimum load resistance, Rm(min) is resistance at the maximum power point at minimum irradiance, and Dmax is the maximum duty cycle. The determination of the range of the load resistance is crucial to ensure the maximum power transfer is achievable. The output voltage of the boost converter is determined by Equation (6) [13].
where Vom is the output voltage and VmG is the maximum voltage at maximum irradiance. The value of the inductor, L, is given in Equation (7) [13].
where ∆iL represents inductor ripple current and f is the switching frequency. The minimum input capacitance, Cin, is calculated as shown in Equation (8) [13].
where γVm is the voltage factor at the maximum power point. The minimum output capacitance, Cout, is determined by Equation (9) [13].
Here, represents the ripple factor of the output voltage.
3. Overview of Levy Flight
This algorithm is inspired by the brood parasitism strategy of cuckoo birds [40,65]. Typically, this obligate parasite lays its eggs without taking care of its young but letting the host take care of them. Cuckoo birds have an interesting behavior that can imitate the host color and shape of the eggs. Another incredibly interesting action to take note of is that the cuckoo egg tends to hatch earlier than the host bird. As early as its hatches, the cuckoo wipes off the host eggs. However, the probability of being noticed by the host bird is there as once caught by the host bird, the egg is destroyed. This will force the cuckoo bird to migrate and build another new nest [40]. The crucial part of a cuckoo bird’s brood parasitism strategy is hunting for the host nest. The hunting for the nest is randomly executed, and trajectories of the direction are modeled using mathematical equations. Typically, a random search is modeled with Levy flight [40,65]. In a cuckoo search, Levy flight reflects the hunting effort for the host nest.
The random distribution of Levy flight is expressed in Equation (10). The distribution pattern is based on the following power law.
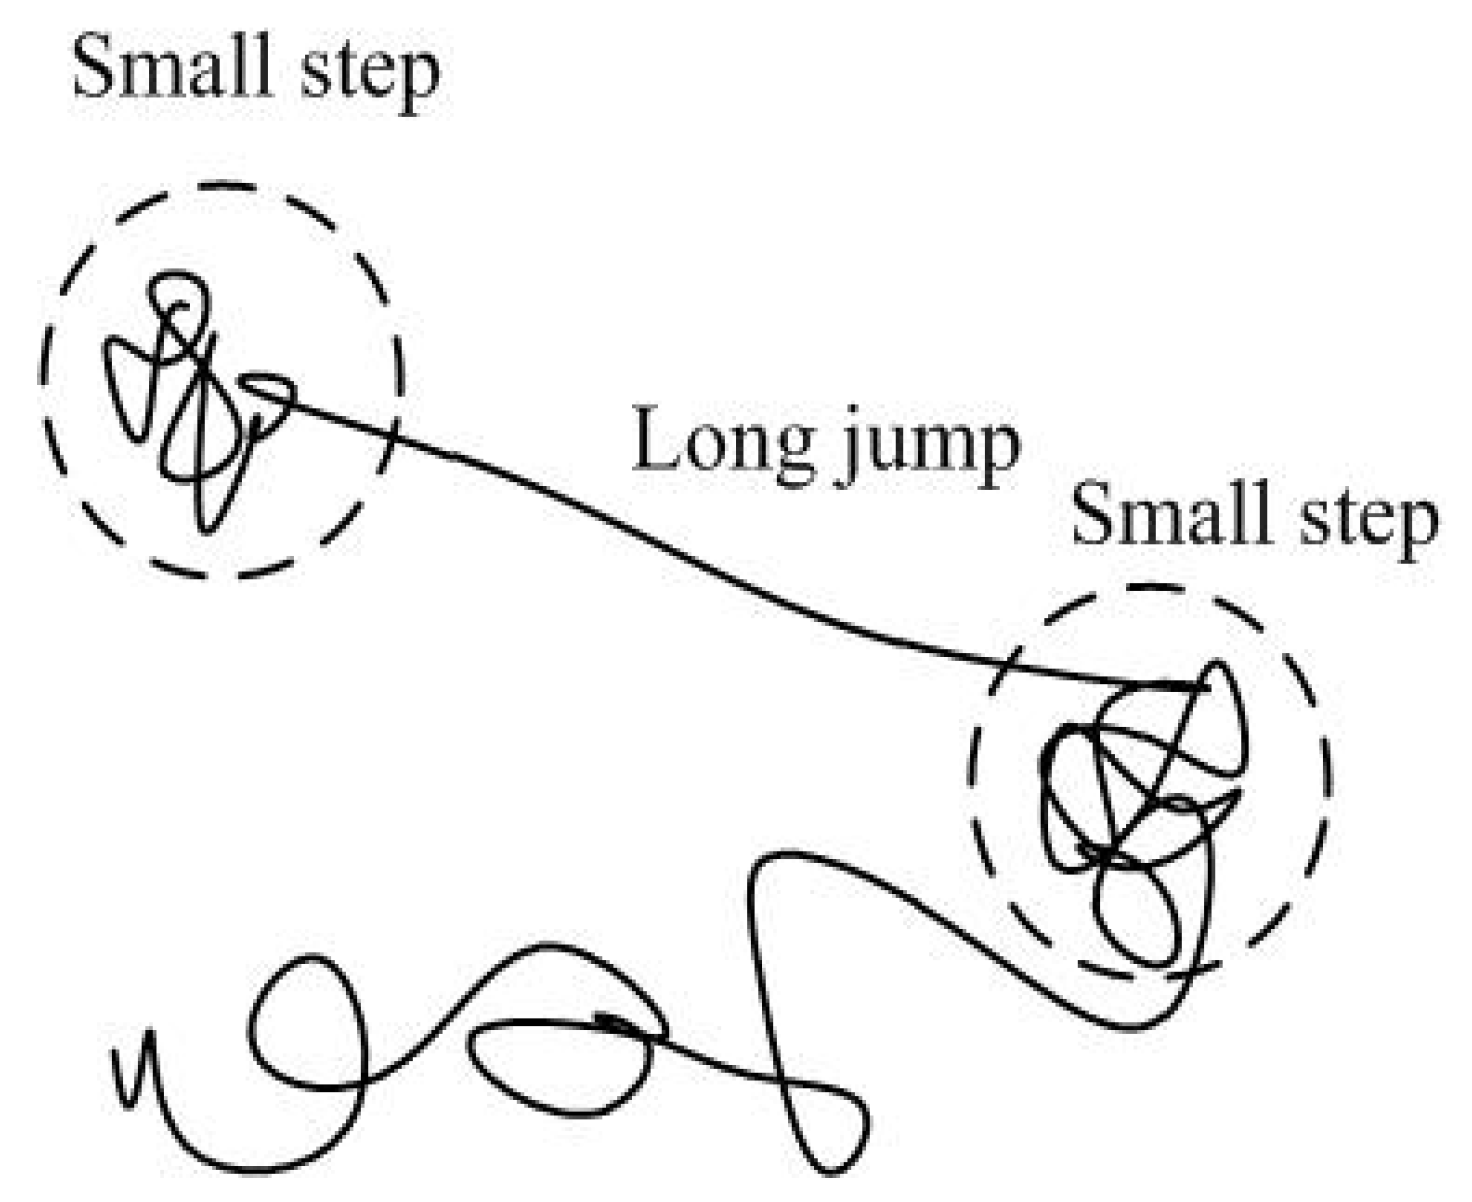
where is the length of the flight, represents the variance, and q is infinite variance at . The distribution pattern of the Levy flight is shown in Figure 4 [40]. It is observed that the pattern of the Levy distribution is inconsistent as the step varies in the form of a large step, small step, and long-distance jump [40,65]. Thus, if this pattern is incorporated in metaheuristic algorithms, especially in nonlinear situations, it will significantly improve the search efficiency [40].
In the cuckoo search algorithm, the algorithm starts with the brood parasitism mechanism [40,66]. Firstly, the algorithm is executed based on the hunting process for the host nest. Then, the best host nest is found, and lastly, there is the possibility that the host will discover the cuckoo’s eggs with given probability, Pa which is 0 < Pa < 1. Once the cuckoo’s eggs are found by the host, the host either leaves the nest or wipes off the eggs.
4. MPPT with the Modified Levy Flight Algorithm
4.1. Variables and Equations of the Proposed MPPT
There are few modifications in incorporating the modified Levy flight algorithm in MPPT. Initially, the assigned particles are needed to determine the search space. The particles represent the duty cycle, D, i.e., Di (i = 1, 2, … n). Here, n denotes the total number of particles. Next, the step size, α needs to be determined. Then, the fitness function, f’, is the power of the PV.
At the start, the initialization is first performed, where all particles are executed in the search space, and the initial value of the fitness function is the power at all respective particles. The maximum power is considered initially, and the best duty cycle at the respective power is considered the best particle sample. Soon after, the next stage is executed following the equation for Levy flight as shown in Equation (11) [38,41]; the new particles at the respective power are considered
where .
A simplified modified Levy distribution is given by Equation (12).
β = 1.5 (0 ≤ β ≤ 2), and P is the Levy multiplying coefficient. The coefficients u and υ are obtained from normal distribution curves as in Equation (13) [38,41].
Variables and are expressed in Equation (14) with symbol to denote the integral gamma function.
The power of the PV module is calculated and compared for the respective particle. The power in the respective duty cycle is compared, and the new best particle is selected. The best particle is once again compared with the global best particle at the respective power. If the best particle is not the current best particle, the new global best particle is assigned. Consequently, the iterative process is executed for all particles, and the current global best particle is evaluated over f’. This iterative process is executed until all particles achieve the maximum power point (MPP).
4.2. Mechanism of the Proposed MPPT Search
Figure 5 shows the mechanism of the movement of the particles for the proposed modified Levy flight algorithm. The particles are considered to be distributed initially along the entire P-V curve. Four initial duty cycles are chosen [38,40]. The particles are distributed at locations D1, D2, D3, and D4. The power at each respective particle, D, is read. The highest value of power at the corresponding particle, Dpm, is considered as the best particle value. Other particles are forced to move towards this particle, Dpm, as the best particle is the mark point for the movement of all other particles. The movement of the particles is guided by Levy flight as in Equation (11). The step sizes are varied towards the best particles, either in small or large jumps depending upon the boundaries of the search area. The step size becomes small as the particle moves nearer to MPP. A randomized step size in Levy flight ensures that the search would cover all the points along the P-V curve. Once all the particles reach the best particle, another evaluation is executed by comparing it with the global best particle. The comparison between the best particle and global best particle is obtained as shown in Equation (12). The new global best particle is assigned if the current best particle exceeds the global best particle. The position and velocity as shown in Equations (11) and (12) are updated. The convergence stops once all particles reach their MPP. All particle step sizes reach zero once MPP is achieved.
5. Simulation Analysis
The effectiveness of the proposed algorithm is verified with simulation in the MATLAB/Simulink environment. The circuit model is shown in Figure 6. This system consists of a PV panel, boost converter, MPPT controller, and load [67]. The boost converter is chosen in this application due to its popularity among researchers as it has a low voltage ripple [11]. The parameters of the boost converter are listed in Table 1. The converter is connected to a resistive load of 50 Ω. A PV module, PMS50W, with specifications as listed in Table 2 is used.
Initial particles D are set to 0.1, 0.2, 0.5, and 0.7. This is highly important as the initial execution process is to scan the full range before converging on the best solution. The duty cycle limit is also set from dmin to dmax. The setting of limitations on the duty cycle is included in the algorithm. Here, dmin is set to 0.1 and dmax is set to 0.75. The stopping criterion in this algorithm is set by assigning maximum iteration in the proposed algorithm. Here, the maximum iteration is set to 10. The other parameters are also set as follows: the P coefficient is set to 0.8, β1 is set to 1.5, β2 is set to 2.0, and υ is set to 1. In this simulation, the sampling time is 0.1 s with a sampling frequency of 10 Hz. Table 3 summarizes the parameter setting of the proposed algorithm.
Firstly, the proposed algorithm is evaluated under uniform irradiance (STC). The tested conditions are investigated under three different irradiances which are high (1000 W/m2), medium (600 W/m2), and low (200 W/m2) as shown in Figure 7. Based on Figure 7, it is noted that the MPP of the PV module varies with irradiance. Higher irradiance contributes to a higher value of maximum power at a constant temperature. It is also observed that there is only one peak power point for each irradiance. This peak is known as the local maximum power point (LMPP).
Next, the proposed algorithm is tested under the partial shading condition (PSC) as shown in Figure 8. The characteristics of the I-V and P-V curves under PSCs are shown for three different conditions. Based on Figure 8, it can be noted that multiple peaks occur along the curve. This phenomenon happens due to non-uniform irradiances that penetrated into the PV module as shown in Figure 9. Multiple peaks here include LMPP and GMPP. The irradiance patterns of the PSCs are summarized in Table 4.
Firstly, the proposed algorithm is tested under uniform irradiance. Figure 10 shows simulation results of the proposed modified LFO at 1000 W/m2 irradiance. As can be seen, the proposed modified LFO has successfully tracked the maximum power at 50 W under 1000 W/m2 STC. It is also observed from the simulation results that the modified LFO is stable and no oscillation at steady-state occurs.
Figure 11 shows the simulation results of the proposed modified LFO at 600 W/m2 STC. Similarly, the proposed algorithm is able to track optimum power at medium irradiance which is 30 W. The proposed algorithm of modified LFO is stable with almost zero steady-state oscillation.
Figure 12 shows the simulation results of the proposed modified LFO at low irradiance, 200 W/m2. The proposed modified LFO successfully tracks the optimum power at 10 W. Based on the simulation results, the proposed modified LFO is stable with zero steady-state oscillation.
Further testing is conducted under PSCs as described in Table 4. The shadow patterns are created as in Table 4. Non-uniform irradiances are penetrated into PV modules as in Table 4 to generate a pattern for PSCs. Based on Figure 8b, the global maximum power point is 17.5 W for PSC 1. Here, the proposed modified LFO is tested. Figure 13 shows the simulation results of the proposed modified LFO algorithm under PSC 1. The results show that the proposed algorithm can track GMPP at 17.5 W. The algorithm is stable, and no steady-state oscillation is observed.
PSC 2 as explained in Table 4 is created. The proposed modified LFO is tested under PSC 2. Based on Figure 14, the simulation results indicate that the proposed modified LFO can distinguish GMPP at 11.1 W. The algorithm is stable, and no steady-state oscillations occur.
PSC 3 is created by non-uniform irradiances on the PV panels as shown in Table 4. The modified LFO is tested. Again, as can be seen, the modified LFO has successfully tracked GMPP at 16 W as shown in Figure 15. Notably, the proposed modified LFO is stable, and no steady-state oscillation is observed.
Next, the proposed modified LFO is tested under dynamic conditions. The dynamic condition is set from STC at time 0 to 0.1 s and then it changes from STC to PSC 1 at time 0.1 s. Based on the results in Figure 16, it is noted that the proposed algorithm is capable of detecting MPP at STC, which is 50 W, and then GMPP at PSC 1, which is 17.5 W, with a 3.0 s response time. Based on these results, the proposed algorithm is stable, and no steady-state oscillation is observed.
6. Experimental Results
The effectiveness of the proposed modified LFO is further tested with a prototype. The experimental prototype has a similar rated power as that in the simulation for fair comparison. The boost converter with the same component values as in the simulation is used here. The boost converter is used as the main component in searching for MPPT and also for supplying the optimum power to the load. The PV array output is generated by a PV simulator. Two sensors are used: LA-55p and LV-25. The Hall Effect current sensor, LA-55p, is used to measure the PV input current, while the voltage sensor, LV-25, is used to measure the PV input voltage. These measured signals are fed to the Analog-to-Digital converter (ADC) of DSP TMS320F28335. The signals are used as the input for MPPT algorithm execution. The Pulse Width Modulation (PWM) is the output signal produced by the MPPT algorithm. Typically, the PWM generated by DSP is in the range of 0–5 V; thus, a gate driver, HCPL 3120, is chosen. The driver HCPL 3120 boosts up the PWM signal to ±15 V, sufficient to trigger the power switch in the boost converter. The resistive load is connected at the output. The waveforms are displayed and captured with a digital oscilloscope. The schemes of the experimental rig and experimental setup are shown in Figure 17a,b, respectively.
Firstly, the proposed modified LFO algorithm is experimentally tested under uniform irradiance. The numerical data of the I-V and P-V curves for high (1000 W/m2), medium (600 W/m2), and low (200 W/m2) irradiances at STC are loaded into the PV simulator. Once the respective numerical data are loaded, the patterns of the I-V and P-V curves are created as shown in Figure 18.
Figure 19 shows experimental results for the proposed modified LFO algorithm tested at 1000 W/m2 irradiance. Based on the results, the proposed algorithm is able to track LMPP, which is 50 W. From the results, the proposed modified LFO has excellent searching capability since it uses a random search. Once the optimum is found, the speed slows and reaches zero speed when all the particles have found the optimum point.
Figure 20 shows the experimental results of the proposed modified LFO tested at 600 W/m2. Again, as can be noted, the proposed algorithm can track LMPP at 30 W. The proposed modified LFO shows excellent results in terms of stability and steady-state oscillation.
Figure 21 shows the experimental results of the proposed modified LFO tested at low irradiance, which is 200 W/m2. Similarly, the proposed modified LFO shows excellent results in terms of stability and steady-state oscillation.
Further testing is conducted under partial shading conditions. The same patterns as those used in the simulation are tested here. All the numerical data of the shading patterns given in Table 4 are loaded into the PV simulator. Three patterns are shown in Figure 22, i.e., PSC 1, PSC 2, and PSC 3.
Figure 23 shows the experimental results for the proposed modified LFO tested under PSC 1. Based on the experimental results, the proposed algorithm is able to track GMPP at 17 W. It clearly shows that the proposed modified LFO has zero steady-state oscillation and it is stable. The proposed modified LFO is more stable due to its random searching behavior, where it has ability to control the speed, i.e., either longer or shorter jumps. Once the optimum point is reached, all the points slow down and have a shorter jump. Thus, this characteristic will facilitate the proposed modified LFO to perform better in the searching effort under PSC.
Figure 24 shows the experimental results of the proposed modified LFO under PSC 2. As can be seen, the proposed algorithm can achieve GMPP at 11 W. Here, the proposed modified LFO has 99% efficiency. Further, the proposed modified LFO is stable and has negligible steady-state oscillation.
Figure 25 shows the experimental results for the proposed modified LFO under PSC 3. Based on the experimental result, the proposed modified LFO is also able to track GMPP at 16.1 W. The proposed modified LFO is stable and has no steady-state oscillation.
Next, the prototype is experimentally tested under dynamic conditions. The same patterns as those in the simulation are tested here, i.e., STC to PSC 1. All the numerical data of the patterns are listed in Table 4 and are loaded into the PV simulator. The dynamic patterns are shown in Figure 26.
Figure 27 shows the experimental results for the proposed modified LFO tested under dynamic conditions, i.e., STC to PSC 1. As can be observed, the proposed modified LFO is capable of detecting the LMPP under STC at irradiance 1000 W/m2 with optimum power at 49.9 W, and then the operating condition is changed to PSC 1. Immediately after the change, the proposed modified LFO manages to detect the new GMPP at 17.4 W under PSC 1 with 3.0 s response time. The result in Figure 27 also indicates that the proposed modified LFO is stable, and negligible steady-state oscillation is observed.
Table 5 summarizes the performance of the proposed modified LFO. It has excellent performance under uniform and non-uniform conditions. The proposed modified LFO has successfully tracked the LMPP under STC and GMPP under PSCs. The proposed modified LFO is also stable and has negligible steady-state oscillations.
The proposed algorithm is then compared with the two most famous methods which are P&O and PSO. P&O is chosen since this method is widely used either in practice or research, while PSO is chosen due to the fact that it is the most famous and simple search-based method. Table 6 shows a comparison between P&O, PSO, and the proposed algorithm. The proposed algorithm improves the efficiency of the system compared to P&O and PSO. The efficiency of all the tested conditions is higher than 98%. The operation of the proposed algorithm under partial shading is also guaranteed.
7. Conclusions
The modified LFO is proposed in this paper based on a random search of Levy flight for a PV energy system. The new variable β is introduced to solve the global best in obtaining optimum power. The proposed algorithm has excellent performance in tracking the global maximum point under PSCs. The proposed algorithm solves three major problems, mainly intermittent tracking under non-uniform irradiances, steady-state oscillation, and stability. Simulation studies are carried out under STC, PSC, and dynamic conditions. The proposed algorithm shows excellent performance in tracking MPPT. In addition, the performance of the proposed algorithm is verified with a prototype. Both simulation and experimental results show that the proposed algorithm has zero steady-state oscillation and it is stable. The efficiency of the proposed algorithm is higher than 98%. The simulation and experimental results show that the modified LFO has successfully tracked the global maximum point for all operating conditions in which the maximum power is always extracted and fast response time is achieved.
Author Contributions
C.C. developed the simulation model, algorithm, conducted the tests, analyzed all the important findings, and wrote the manuscript; D.I. verified the simulation study, experimental and written manuscript; M.A.A.M.Z. revised and finalized the drafted manuscript. B.I. grants the permission to conduct the experiment in Centre of Excellence for Renewable Energy and support the experimental work. All authors have read and agreed to the published version of the manuscript.
Funding
This research work was supported by Geran Galakan Penyelidik Muda (GGPM-2020-004) from the Center for Research and Instrument Management (CRIM), Universiti Kebangsaan, Malaysia.
Institutional Review Board Statement
Not applicable.
Informed Consent Statement
Not applicable.
Data Availability Statement
Not applicable.
Conflicts of Interest
The authors declare no conflict of interest.
Abbreviations
| List of Acronym | PV system parameters | ||||
| Abbreviations | Iph | photon current | |||
| PV | photovoltaic | I | output current | ||
| MPPT | maximum power point tracker | V | terminal voltage | ||
| P&O | Perturb and Observe | Rsh | shunt resistor | ||
| IC | Incremental Conductance | Rs | series resistance | ||
| PSC | partial shading condition | Io | reverse saturation current of the cell | ||
| P-V | power voltage | q | electronics charge | ||
| I-V | current voltage | V | output voltage of the cell | ||
| LMPP | local maxima power point | n | ideality factor | ||
| GMPP | global maxima power point | K | Boltzmann’s constant | ||
| MPP | maximum power point | T | absolute operating temperature | ||
| FL | Fuzzy Logic Control | Ns | total number of cells in series | ||
| PSO | Particle Swarm Optimization | Ish | current flow through the shunt resistor | ||
| PSCs | Partial shading conditions | S | actual irradiance (W/m2) | ||
| PWM | Pulse Width Modulation | Sref | irradiance under the reference condition (W/m2) | ||
| Levy flight parameters | Iph,ref | light current under the reference condition | |||
| l | length of the flight | µIsc | manufacturer supplied temperature coefficient of short-circuit current (A/K) | ||
| λ | variance | TC,ref | actual reference temperature (K) | ||
| q | infinite variance | Ego | band gap energy | ||
| Pa | probability | Boost converter parameters | |||
| n | total number of particles | Rload | output resistance | ||
| α | step size | Rm | value of the resistance at the maximum power point | ||
| f’ | fitness function | D | duty cycle | ||
| υbest | best particle | Rm(max) | resistance at maximum power point at maximum irradiance | ||
| υi | current particle | Dmin | minimum duty cycle | ||
| β | beta | Rload(opt) | optimum load resistance | ||
| P | Levy multiplying coefficient | Rm(min) | resistance at maximum power point at minimum irradiance | ||
| Gbest | global best particle | Dmax | maximum duty cycle | ||
| Г | integral gamma function | Vom | output voltage | ||
| π | 3.14159 | VmG | maximum voltage at maximum irradiance | ||
| u | coefficient | L | inductor | ||
| υ | coefficient | ∆iL | inductor ripple current | ||
| σu | variable | f | switching frequency | ||
| συ | variable | Cin | minimum input capacitance | ||
| List of symbol | |||||
| Cin | input capacitor | F | Vmp | maximum power voltage | V |
| L | inductor | H | Isc | short circuit current | A |
| fs | switching frequency | Hz | Imp | maximum power current | A |
| Cout | output capacitor | F | Ns | number of series cells | |
| Pmax | maximum power | W | S | time in second | s |
| Voc | open circuit voltage | V | |||
References
- Eltawil, M.A.; Zhao, Z. MPPT techniques for photovoltaic applications. Renew. Sustain. Energy Rev. 2013, 25, 793–813. [Google Scholar] [CrossRef]
- Pilakkat, D.; Kanthalakshmi, S. An improved P&O algorithm integrated with artificial bee colony for photovoltaic systems under partial shading conditions. Sol. Energy 2019, 178, 37–47. [Google Scholar]
- Nayak, B.; Mohapatra, A.; Mohanty, K.B. Selection criteria of dc-dc converter and control variable for MPPT of PV system utilized in heating and cooking applications. Cogent Eng. 2017, 4, 1363357. [Google Scholar] [CrossRef]
- Geremew, K.; Gedefaw, M.; Dagnew, Z.; Jara, D. Current level and correlates of traditional cooking energy sources utilization in urban settings in the context of climate change and health, northwest ethiopia: A case of debre markos town. Biomed Res. Int. 2014, 2014, 572473. [Google Scholar] [CrossRef]
- Fu, Z.; Fan, Y.; Cai, X.; Zheng, Z.; Xue, J.; Zhang, K. Lithium titanate battery management system based on mppt and four-stage charging control for photovoltaic energy storage. Appl. Sci. 2018, 8, 2520. [Google Scholar] [CrossRef] [Green Version]
- Abunima, H.; Teh, J.; Jumma, H. Reactive-active power control for grid-connected PV arrays to enlarge the hosting capacity in a low voltage distribution system. J. Kejuruter. 2019, 31, 107–114. [Google Scholar]
- Saidi, K.; Maamoun, M.; Bounekhla, M. A new high performance variable step size perturb-and-observe MPPT algorithm for photovoltaic system. Int. J. Power Electron. Drive Syst. 2019, 10, 1662. [Google Scholar] [CrossRef]
- Islam, H.; Mekhilef, S.; Shah, N.B.M.; Soon, T.K.; Seyedmahmousian, M.; Horan, B.; Stojcevski, A. Performance evaluation of maximum power point tracking approaches and photovoltaic systems. Energies 2018, 11, 365. [Google Scholar] [CrossRef] [Green Version]
- Benkercha, R.; Moulahoum, S.; Taghezouit, B. Extraction of the PV modules parameters with MPP estimation using the modified flower algorithm. Renew. Energy 2019, 143, 1698–1709. [Google Scholar] [CrossRef]
- Ali, E.; Abd Elazim, S.; Abdelaziz, A. Ant Lion Optimization Algorithm for optimal location and sizing of renewable distributed generations. Renew. Energy 2017, 101, 1311–1324. [Google Scholar] [CrossRef]
- De Brito, M.A.G.; Galotto, L.; Sampaio, L.P.; e Melo, G.A.; Canesin, C.A. Evaluation of the main MPPT techniques for photovoltaic applications. IEEE Trans. Ind. Electron. 2012, 60, 1156–1167. [Google Scholar] [CrossRef]
- Li, X.; Wen, H.; Hu, Y.; Jiang, L. A novel beta parameter based fuzzy-logic controller for photovoltaic MPPT application. Renew. Energy 2019, 130, 416–427. [Google Scholar] [CrossRef]
- Ayop, R.; Tan, C.W. Design of boost converter based on maximum power point resistance for photovoltaic applications. Sol. Energy 2018, 160, 322–335. [Google Scholar] [CrossRef]
- Ding, M.; Lv, D.; Yang, C.; Li, S.; Fang, Q.; Yang, B.; Zhang, X. Global maximum power point tracking of PV systems under partial shading condition: A transfer reinforcement learning approach. Appl. Sci. 2019, 9, 2769. [Google Scholar] [CrossRef] [Green Version]
- Sera, D.; Mathe, L.; Kerekes, T.; Spataru, S.V.; Teodorescu, R. On the perturb-and-observe and incremental conductance MPPT methods for PV systems. IEEE J. Photovolt. 2013, 3, 1070–1078. [Google Scholar] [CrossRef]
- Ahmed, J.; Salam, Z. An improved perturb and observe (P&O) maximum power point tracking (MPPT) algorithm for higher efficiency. Appl. Energy 2015, 150, 97–108. [Google Scholar]
- Koad, R.B.; Zobaa, A.F. Comparison between the Conventional Methods AND PSO Based Mppt Algorithm for Photovoltaic Systems; World Academy of Science: Trieste, Italy, 2014. [Google Scholar]
- Subudhi, B.; Pradhan, R. A comparative study on maximum power point tracking techniques for photovoltaic power systems. IEEE Trans. Sustain. Energy 2012, 4, 89–98. [Google Scholar] [CrossRef]
- Veerapen, S.; Wen, H.; Li, X.; Du, Y.; Yang, Y.; Wang, Y.; Xiao, W. A novel global maximum power point tracking algorithm for photovoltaic system with variable perturbation frequency and zero oscillation. Sol. Energy 2019, 181, 345–356. [Google Scholar] [CrossRef]
- Chuang, M.-T.; Liu, Y.-H.; Ye, S.-P. A novel variable step size incremental conductance method with an adaptive scaling factor. Appl. Sci. 2020, 10, 5214. [Google Scholar] [CrossRef]
- Deshpande, A.; Patil, S.; Deopare, H. Comparative simulation of conventional maximum power point tracking methods. In 2016 International Conference on Computing, Communication and Automation (ICCCA); IEEE: Piscataway, NJ, USA, 2016; pp. 1025–1028. [Google Scholar]
- Esram, T.; Chapman, P.L. Comparison of photovoltaic array maximum power point tracking techniques. IEEE Trans. Energy Convers. 2007, 22, 439–449. [Google Scholar] [CrossRef] [Green Version]
- Manickam, C.; Raman, G.; Raman, G.; Ganesan, S.; Nagamani, C. A hybrid algorithm for tracking of global MPP based on perturb and observe and particle swarm optimization with reduced power oscillation in string inverters. IEEE Trans. Ind. Electron. 2016, 63, 6097–6106. [Google Scholar] [CrossRef]
- Ghasemi, M.A.; Foroushani, H.M.; Parniani, M. Partial shading detection and smooth maximum power point tracking of PV arrays under PSC. IEEE Trans. Power Electron. 2015, 31, 6281–6292. [Google Scholar] [CrossRef] [Green Version]
- Hajighorbani, S.; Mohd Radzi, M.A.; Ab Kadir, M.Z.A.; Shafie, S.; Mohd Zainuri, M.A.A. Implementing a novel hybrid maximum power point tracking technique in DSP via Simulink/MATLAB under partially shaded conditions. Energies 2016, 9, 85. [Google Scholar] [CrossRef] [Green Version]
- Mahmod Mohammad, A.N.; Mohd Radzi, M.A.; Azis, N.; Shafie, S.; Atiqi Mohd Zainuri, M.A. An enhanced adaptive perturb and observe technique for efficient maximum power point tracking under partial shading conditions. Appl. Sci. 2020, 10, 3912. [Google Scholar] [CrossRef]
- Mahmod Mohammad, A.N.; Mohd Radzi, M.A.; Azis, N.; Shafie, S.; Atiqi Mohd Zainuri, M.A. A novel hybrid approach for maximizing the extracted photovoltaic power under complex partial shading conditions. Sustainability 2020, 12, 5786. [Google Scholar] [CrossRef]
- Dash, S.S.; Padmanaban, S.; Morati, P.K. Maximum power point tracking implementation by Dspace controller integrated through Z-Source inverter using particle swarm optimization technique for photovoltaic applications. Appl. Sci. 2018, 8, 145. [Google Scholar]
- Na, W.; Chen, P.; Kim, J. An improvement of a Fuzzy Logic-Controlled maximum power point tracking algorithm for photovoltic applications. Appl. Sci. 2017, 7, 326. [Google Scholar] [CrossRef]
- Ramli, M.A.; Twaha, S.; Ishaque, K.; Al-Turki, Y.A. A review on maximum power point tracking for photovoltaic systems with and without shading conditions. Renew. Sustain. Energy Rev. 2017, 67, 144–159. [Google Scholar] [CrossRef]
- Ramli, M.Z.; Salam, Z. Performance evaluation of dc power optimizer (DCPO) for photovoltaic (PV) system during partial shading. Renew. Energy 2019, 139, 1336–1354. [Google Scholar] [CrossRef]
- Dolara, A.; Grimaccia, F.; Mussetta, M.; Ogliari, E.; Leva, S. An evolutionary-based MPPT algorithm for photovoltaic systems under dynamic partial shading. Appl. Sci. 2018, 8, 558. [Google Scholar] [CrossRef] [Green Version]
- Derbeli, M.; Barambones, O.; Sbita, L. A robust maximum power point tracking control method for a PEM fuel cell power system. Appl. Sci. 2018, 8, 2449. [Google Scholar] [CrossRef] [Green Version]
- Alshareef, M.; Lin, Z.; Ma, M.; Cao, W. Accelerated particle swarm optimization for photovoltaic maximum power point tracking under partial shading conditions. Energies 2019, 12, 623. [Google Scholar] [CrossRef] [Green Version]
- Liu, Y.-H.; Huang, S.-C.; Huang, J.-W.; Liang, W.-C. A particle swarm optimization-based maximum power point tracking algorithm for PV systems operating under partially shaded conditions. IEEE Trans. Energy Convers. 2012, 27, 1027–1035. [Google Scholar] [CrossRef]
- Rajendran, S.; Srinivasan, H. Simplified accelerated particle swarm optimisation algorithm for efficient maximum power point tracking in partially shaded photovoltaic systems. IET Renew. Power Gener. 2016, 10, 1340–1347. [Google Scholar] [CrossRef]
- Ishaque, K.; Salam, Z.; Amjad, M.; Mekhilef, S. An improved particle swarm optimization (PSO)–based MPPT for PV with reduced steady-state oscillation. IEEE Trans. Power Electron. 2012, 27, 3627–3638. [Google Scholar] [CrossRef]
- Eltamaly, A.M.; Al-Saud, M.; Abokhalil, A.G.; Farh, H.M. Simulation and experimental validation of fast adaptive particle swarm optimization strategy for photovoltaic global peak tracker under dynamic partial shading. Renew. Sustain. Energy Rev. 2020, 124, 109719. [Google Scholar] [CrossRef]
- Bendib, B.; Belmili, H.; Krim, F. A survey of the most used MPPT methods: Conventional and advanced algorithms applied for photovoltaic systems. Renew. Sustain. Energy Rev. 2015, 45, 637–648. [Google Scholar] [CrossRef]
- Ahmed, J.; Salam, Z. A Maximum Power Point Tracking (MPPT) for PV system using Cuckoo Search with partial shading capability. Appl. Energy 2014, 119, 118–130. [Google Scholar] [CrossRef]
- Chen, M.; Ma, S.; Wu, J.; Huang, L. Analysis of MPPT failure and development of an augmented nonlinear controller for MPPT of photovoltaic systems under partial shading conditions. Appl. Sci. 2017, 7, 95. [Google Scholar] [CrossRef] [Green Version]
- Sundareswaran, K.; Peddapati, S.; Palani, S. MPPT of PV systems under partial shaded conditions through a colony of flashing fireflies. IEEE Trans. Energy Convers. 2014, 29, 463–472. [Google Scholar]
- Chawla, M.; Duhan, M. Levy flights in metaheuristics optimization algorithms—A review. Appl. Artif. Intell. 2018, 32, 802–821. [Google Scholar] [CrossRef]
- Richer, T.J.; Blackwell, T.M. The Lévy Particle Swarm, Proceedings of the 2006 IEEE International Conference on Evolutionary Computation, Vancouver, BC, Canada, 16–21 July 2006; IEEE: Piscataway, NJ, USA, 2006; pp. 808–815. [Google Scholar]
- Cai, X.; Zeng, J.; Cui, Z.; Tan, Y. Particle Swarm Optimization Using Lévy Probability Distribution, Proceedings of the International Symposium on Intelligence Computation and Applications, Wuhan, China, 21–23 September 2007; Springer: Berlin/Heidelberg, Germany, 2007; pp. 353–361. [Google Scholar]
- Kalogerakis, C.; Koutroulis, E.; Lagoudakis, M.G. Global MPPT Based on machine-learning for PV arrays operating under partial shading conditions. Appl. Sci. 2020, 10, 700. [Google Scholar] [CrossRef] [Green Version]
- Hamidi, M.N.; Ishak, D.; Zainuri, M.A.A.M.; Ooi, C.A.; Tarmizi, T. Asymmetrical multi-level dc-link inverter for pv energy system with perturb and observe based voltage regulator and capacitor compensator. J. Mod. Power Syst. Clean Energy 2020. [Google Scholar] [CrossRef]
- Chin, C.; Babu, A.; McBride, W. Design, modeling and testing of a standalone single axis active solar tracker using MATLAB/Simulink. Renew. Energy 2011, 36, 3075–3090. [Google Scholar] [CrossRef]
- Bahrami, M.; Gavagsaz-Ghoachani, R.; Zandi, M.; Phattanasak, M.; Maranzanaa, G.; Nahid-Mobarakeh, B.; Pierfederici, S.; Meibody-Tabar, F. Hybrid maximum power point tracking algorithm with improved dynamic performance. Renew. Energy 2019, 130, 982–991. [Google Scholar] [CrossRef]
- Garg, H. Solar energy: Fundamentals and Applications; Tata McGraw-Hill Education: New York, NY, USA, 2000. [Google Scholar]
- Hashemzadeh, S.M. A new model-based technique for fast and accurate tracking of global maximum power point in photovoltaic arrays under partial shading conditions. Renew. Energy 2019, 139, 1061–1076. [Google Scholar] [CrossRef]
- Zečević, Ž.; Rolevski, M. Neural network approach to mppt control and irradiance estimation. Appl. Sci. 2020, 10, 5051. [Google Scholar] [CrossRef]
- Chin, V.J.; Salam, Z. Modifications to Accelerate the Iterative Algorithm for the Two-diode Model of PV Module, Proceedings of the2018 IEEE PES Asia-Pacific Power and Energy Engineering Conference (APPEEC), Kota Kinabalu, Malaysia, 7–10 October 2018; IEEE: Piscataway, NJ, USA, 2018; pp. 200–205.
- Dehghanzadeh, A.; Farahani, G.; Maboodi, M. A novel approximate explicit double-diode model of solar cells for use in simulation studies. Renew. Energy 2017, 103, 468–477. [Google Scholar] [CrossRef]
- Yahya-Khotbehsara, A.; Shahhoseini, A. A fast modeling of the double-diode model for PV modules using combined analytical and numerical approach. Sol. Energy 2018, 162, 403–409. [Google Scholar] [CrossRef]
- Mohamed Hariri, M.H.; Mat Desa, M.K.; Masri, S.; Mohd Zainuri, M.A.A. Grid-connected PV generation system—Components and challenges: A review. Energies 2020, 13, 4279. [Google Scholar] [CrossRef]
- Thipse, S. Non Conventional and Renewable Energy Sources; Alpha Science International Limited: Oxford, UK, 2014. [Google Scholar]
- De la Parra, I.; Muñoz, M.; Lorenzo, E.; García, M.; Marcos, J.; Martínez-Moreno, F. PV performance modelling: A review in the light of quality assurance for large PV plants. Renew. Sustain. Energy Rev. 2017, 78, 780–797. [Google Scholar] [CrossRef] [Green Version]
- Dizqah, A.M.; Maheri, A.; Busawon, K. An accurate method for the PV model identification based on a genetic algorithm and the interior-point method. Renew. Energy 2014, 72, 212–222. [Google Scholar] [CrossRef] [Green Version]
- Rhouma, M.B.; Gastli, A.; Brahim, L.B.; Touati, F.; Benammar, M. A simple method for extracting the parameters of the PV cell single-diode model. Renew. Energy 2017, 113, 885–894. [Google Scholar] [CrossRef]
- Zobaa, A.F.; Bansal, R.C. Handbook of Renewable Energy Technology; World Scientific: Singapore, 2011. [Google Scholar]
- Ramos-hernanz, J.; Lopez-guede, J.M.; Zulueta, E.; FERNANDEZ-GAMIZ, U. Reverse saturation current analysis in photovoltaic cell models. Wseas Trans. Power Syst. 2017, 12, 231–237. [Google Scholar]
- Chenni, R.; Makhlouf, M.; Kerbache, T.; Bouzid, A. A detailed modeling method for photovoltaic cells. Energy 2007, 32, 1724–1730. [Google Scholar] [CrossRef]
- Singhal, A.K.; Kirar, J.S. Matlab Based Modelling of PV Array at Different Irrediation Level Using MPPT Technique. IJECCE 2013, 4, 44–47. [Google Scholar]
- Yang, X.-S.; Deb, S. Cuckoo Search via Lévy Flights, Proceedings of the 2009 World Congress on Nature & Biologically Inspired Computing (NaBIC), Coimbatore, India, 9–11 December 2009; IEEE: Piscataway, NJ, USA, 2009; pp. 210–214.
- Yang, X.-S.; Deb, S. Multiobjective cuckoo search for design optimization. Comput. Oper. Res. 2013, 40, 1616–1624. [Google Scholar] [CrossRef]
- Darcy Gnana Jegha, A.; Subathra, M.; Manoj Kumar, N.; Subramaniam, U.; Padmanaban, S. A high gain dc-dc converter with grey wolf optimizer based MPPT algorithm for PV fed BLDC motor drive. Appl. Sci. 2020, 10, 2797. [Google Scholar] [CrossRef]
Figure 1.
Standalone PV system with boost converter and MPPT controller.

Figure 2.
Equivalent circuit of a single-diode model of a PV cell.

Figure 3.
Impedance matching for maximum power transfer.

Figure 4.
Trajectory of Levy flight.

Figure 5.
Modified Levy flight optimization.

Figure 6.
Simulation circuit of a standalone PV system with a boost converter.

Figure 7.
(a) I-V and (b) P-V curves of PMS50W at high (1000 W/m2), medium (600 W/m2), and low (200 W/m2) irradiances.
Figure 7.
(a) I-V and (b) P-V curves of PMS50W at high (1000 W/m2), medium (600 W/m2), and low (200 W/m2) irradiances.

Figure 8.
(a) I-V (b) P-V curves under three different partial shading conditions.

Figure 9.
Non-uniform irradiance penetrated into the PV modules.

Figure 10.
Modified LFO at 1000 W/m2 irradiance (a) power (b) voltage (c) current (d) duty cycle.

Figure 11.
Modified LFO at 600 W/m2 irradiance. (a) power (b) voltage (c) current (d) duty cycle.

Figure 12.
Modified LFO at 200 W/m2 irradiance. (a) power (b) voltage (c) current (d) duty cycle.

Figure 13.
Modified LFO at PSC1. (a) power (b) voltage (c) current.


Figure 14.
Modified LFO at PSC2. (a) power (b) voltage (c) current.

Figure 15.
Modified LFO at PSC3 (a) power (b) voltage (c) current.

Figure 16.
Modified LFO at STC to PSC1. (a) power (b) voltage (c) current.


Figure 17.
Experimental (a) scheme (b) setup.


Figure 18.
Uniform pattern (STC) tested with the proposed modified LFO algorithm (a) I-V (b) P-V at 1000 W/m2, 600 W/m2, and 200 W/m2.
Figure 18.
Uniform pattern (STC) tested with the proposed modified LFO algorithm (a) I-V (b) P-V at 1000 W/m2, 600 W/m2, and 200 W/m2.

Figure 19.
Modified LFO at 1000 W/m2, (a), (b), (c) reflect same result.

Figure 20.
Modified LFO at 600 W/m2, (a), (b), (c) reflect same result.


Figure 21.
Modified LFO at 200 W/m2, (a), (b), (c) reflect same result.

Figure 22.
PSCs pattern (a) P-V (b) I-V.

Figure 23.
Experimental results under PSC 1 of the proposed modified LFO, (a), (b), (c) reflect same result.
Figure 23.
Experimental results under PSC 1 of the proposed modified LFO, (a), (b), (c) reflect same result.

Figure 24.
Experimental results under PSC 2 of the proposed modified LFO, (a), (b) reflect same result.
Figure 24.
Experimental results under PSC 2 of the proposed modified LFO, (a), (b) reflect same result.

Figure 25.
Experimental result under PSC 3 of the proposed modified LFO, (a), (b) reflect same result.
Figure 25.
Experimental result under PSC 3 of the proposed modified LFO, (a), (b) reflect same result.


Figure 26.
Dynamic set-up in the PV simulator at (a) 1000 W/m2 (STC) changing over to (b) PSC 1.

Figure 27.
Dynamic changes from 1000 W/m2 to PSC 1 for the proposed modified LFO, (a), (b), reflect same result.
Figure 27.
Dynamic changes from 1000 W/m2 to PSC 1 for the proposed modified LFO, (a), (b), reflect same result.


Table 1.
Boost converter specifications.
| Parameters | Symbols | Values |
|---|---|---|
| Input capacitor | Cin | 220 uF |
| Inductor | L | 270 uH |
| Switching frequency | fs | 20 kHz |
| Output capacitor | Cout | 220 uF |
Table 2.
PV module, PMS50W.
| Parameters at STC | Specifications |
|---|---|
| Maximum power, Pmax | 50 W |
| Open circuit voltage, Voc | 22.5 V |
| Maximum power voltage, Vmp | 18.0 V |
| Short circuit current, Isc | 3.00 A |
| Maximum power current, Imp | 2.78 A |
| Number of series cells, Ns | 36 |
| Temperature coefficient of Isc | 0.05%/°C |
Table 3.
Parameter setting of the proposed algorithm.
| Parameters | Values |
|---|---|
| dmin | 0.1 |
| dmax | 0.75 |
| itermax | 10 |
| Number of particles | 4 |
| Initial position of particles | 0.1, 0.2, 0.5, 0.7 |
| P coefficient | 0.8 |
| β1 | 1.5 |
| β2 | 2.0 |
| Sigma υ | 1 |
| Sampling time | 0.1 s |
Table 4.
Detailed profiles of STC and PSCs.
| Cases | Irradiance on each PV Module (W/m2) | Peak Power (W) | |||
|---|---|---|---|---|---|
| Peak 1 | Peak 2 | Peak 3 | Peak 4 | ||
| STC | 1000, 1000, 1000, 1000 | 50 | - | - | - |
| PSC 1 | 1000, 800, 400, 200 | 6.45 | 17.54 | 16.22 | 11.76 |
| PSC 2 | 400, 200, 1000, 200 | 5.93 | 9.3 | 11.11 | - |
| PSC 3 | 1000, 400, 200, 600 | 5.93 | 13.61 | 16.05 | 11.71 |
Table 5.
Details of the proposed modified LFO algorithm.
| MPPT Algorithm | Test Conditions | Irradiance (W/m2) | Power (W) | |
|---|---|---|---|---|
| Simulation | Hardware | |||
| Modified LFO | Uniform | 1000 | 50.0 | 50.0 |
| 600 | 30.0 | 30.5 | ||
| 200 | 10.0 | 10.1 | ||
| Non-uniform | 1000, 800, 400, 200 | 17.5 | 17.0 | |
| 400, 200, 1000, 200 | 11.1 | 11.1 | ||
| 1000, 400, 200, 600 | 16.0 | 16.0 | ||
| Dynamic | 1000 to PSC 1 | 50.0→17.5 | 49.9→17.4 | |
Table 6.
Comparison between P&O, PSO, and the proposed algorithm.
| Characteristic | Types of MPPT Algorithm | ||
|---|---|---|---|
| P&O | PSO | Proposed Algorithm | |
| Complexity | Simple | High | High |
| Tracking efficiency | Low | Varies | High |
| Convergence speed | Slow | High | High |
| Capability to handle partial shading conditions | Fail | Intermittent | High |
Publisher’s Note: MDPI stays neutral with regard to jurisdictional claims in published maps and institutional affiliations. |
© 2021 by the authors. Licensee MDPI, Basel, Switzerland. This article is an open access article distributed under the terms and conditions of the Creative Commons Attribution (CC BY) license (http://creativecommons.org/licenses/by/4.0/).
Share and Cite
MDPI and ACS Style
Charin, C.; Ishak, D.; Mohd Zainuri, M.A.A.; Ismail, B. Modified Levy Flight Optimization for a Maximum Power Point Tracking Algorithm under Partial Shading. Appl. Sci. 2021, 11, 992. https://doi.org/10.3390/app11030992
AMA Style
Charin C, Ishak D, Mohd Zainuri MAA, Ismail B. Modified Levy Flight Optimization for a Maximum Power Point Tracking Algorithm under Partial Shading. Applied Sciences. 2021; 11(3):992. https://doi.org/10.3390/app11030992
Chicago/Turabian StyleCharin, Chanuri, Dahaman Ishak, Muhammad Ammirrul Atiqi Mohd Zainuri, and Baharuddin Ismail. 2021. "Modified Levy Flight Optimization for a Maximum Power Point Tracking Algorithm under Partial Shading" Applied Sciences 11, no. 3: 992. https://doi.org/10.3390/app11030992
Note that from the first issue of 2016, this journal uses article numbers instead of page numbers. See further details here.