Indirect Convective Solar Drying Process of Pineapples as Part of Circular Economy Strategy
by
 , , , and
Yaovi Ouézou Azouma
1, 
Lynn Drigalski
2,
Zdeněk Jegla
3,*,
Marcus Reppich
2,
Vojtěch Turek
3 and
Maximilian Weiß
2 1
Ecole Supérieure d’Agronomie, Université de Lomé, Lomé BP 1515, Togo
2
Faculty of Mechanical and Process Engineering, Augsburg University of Applied Sciences, An der Hochschule 1, 86161 Augsburg, Germany
3
Faculty of Mechanical Engineering, Institute of Process Engineering, Brno University of Technology, Technická 2, 61669 Brno, Czech Republic
*
Author to whom correspondence should be addressed.
Energies 2019, 12(15), 2841; https://doi.org/10.3390/en12152841
Submission received: 28 June 2019
/
Revised: 18 July 2019
/
Accepted: 20 July 2019
/
Published: 24 July 2019
(This article belongs to the Special Issue Challenges and Opportunities for the Renewable Energy Economy)
Abstract
:This study investigates the industrial-scale application of a simple convective solar drying process of pineapples as part of a circular economy strategy for developing countries. A renewable energy concept is presented, which follows the circular economy aims by effectively employing a simple system for biogas production and a two-stage drying system. Both these systems meet the requirements for implementation in the specific conditions of developing countries, of which Togo, where pineapple is a major crop, is taken as an example. With respect to earlier findings available in the literature, the paper focuses on the solar drying process, which is critical to the proposed strategy. A portable solar dryer working in indirect heating mode was built and later also modified to enhance its performance. Three main factors influencing the convective drying process, namely, drying time (270 min, 480 min), solar radiation intensity (650 W/m2, 1100 W/m2), and slice thickness (6–8 mm, 12–14 mm), were considered. The statistical Design of Experiments (DOE) method was applied to reduce the number and scope of experiments. In the best case, the moisture content was reduced from 87.3 wt % in fresh samples to 29.4 wt % in dried samples, which did not meet the quality requirements for dried fruit. An additional conventional post-solar drying procedure would, therefore, still be necessary. Nonetheless, the results show that in the case of pineapple drying the consumption of fossil fuels can be decreased significantly if convective solar pre-drying is employed.
1. Introduction
Sustainable food processing is becoming an increasingly important issue in developing countries. To improve the local living conditions and redress global inequalities, a system-oriented approach in food production considering the whole value chain, including the economic, environmental, and social impacts, is essential. Moreover, future economic development depends particularly on how processing capacities in the agricultural sector can successfully be improved instead of exporting agricultural products unprocessed, and with no value added, to foreign markets. In this way, new quality jobs can be created at the same time.
Pineapple, after banana and citrus, is the third most important tropical fruit in international trade [1]. The seasonal pineapple processing in Togo, where pineapple is a major crop, was selected for the present study. According to [2], in 2016, Togolese farmers grew pineapples on a cultivation area of 237 ha and the annual production was 1908 t. The main commercial pineapple products are currently canned pineapple slices and chunks, juice and nectar, and frozen and dried fruit. Of these, the most common are dried fruit and juice, usually in organic quality, which are exported primarily to European countries. The processing itself takes place in various decentralized small- and medium-sized enterprises. As described in [3], a typical such enterprise processes 1–2 t/d of fresh fruit, while the resulting pineapple waste (peels, cores, stems, and crowns) is about 40% of this amount. Other sources give even higher figures up to 75% [4]. The waste, together with discarded fruits with high moisture content and various other farm production wastes (cow dung, etc.) can be efficiently utilized for energy recovery via biogas production, and the resulting sludge can be used as fertilizer. While sophisticated biogas production technologies are employed in the developed countries, the technologies in developing countries must be tailored to the local conditions. Both the adaptation of European biogas production technologies to the specific requirements of pineapple waste processing in Togo and the corresponding experimental results were discussed by the authors of the present paper in [3].
1.1. Key Role of the Drying Process
Drying—that is, a continuous or intermittent process associated with heat and mass transfer—significantly influences the shelf life, appearance, composition, taste, shape, structure, and other characteristics of the product. With respect to the fact that this process is probably the most energy-intensive one in the food processing industry [5], any small increase in energy efficiency will contribute to sustainable development in the respective industrial sector. It is obvious that moisture content in fresh fruit (generally about 85 wt % [1]) is of crucial importance. Water activity, that is, the ratio of vapor pressure to saturation vapor pressure at a given temperature, must also be considered, because it too affects the shelf life of a food product [6]. This ratio should be around 20% to reduce physical, chemical, and biochemical reactions and to minimize microbiological growth in a food product [7].
Recent developments in drying technologies of agricultural produce in general were discussed in [8], while another study [9] focused solely on fruits and vegetables. Comprehensive reviews of various drying technologies used in Africa [10] or just the sub-Saharan zone [11], but without any special focus on the feasibility of (semi-)industrial-scale indirect solar drying of pineapples, are also available. Similarly, reviews focusing on the drying of single fruit (e.g., fig [12], mango [13], or mulberry [14]) or vegetable varieties (e.g., chili peppers [15]) have been published as well.
Hot air dryers have been addressed abundantly in the literature, mainly with respect to the properties of the dried produce. One can find studies discussing color change [16], shrinkage [17], remaining bioactive compounds [18], microstructure [19], effective moisture diffusivity [20], surface polyphenol accumulation [21], or even shear strength [22]. Apart from those mentioned above, there are also papers focusing on the optimum hot air dryer setup [23], real-time monitoring of the properties of the product being dried [24], the effects of pre-treatments [25], low-temperature drying [26], or various combined drying processes such as, for example, freezing-hot air drying [27], ultrasound-assisted hot air drying [28], or pressure drop-assisted hot air drying [29].
Considering the solar drying process in particular, one can encounter review articles covering both solar drying in specific African countries [30] and regions outside of Africa [31]. Analogously, there are papers focusing on the solar drying of banana [32], date [33], apple [34], coconut [35], Moroccan sweet cherry [36], grapes [37], blackberry [38], cocoa beans [39], tomato [40], potato [41], black turmeric [42], lemon balm leaves [43], medicinal plants [44], ber fruit [45], or algae [46]. Studies discussing in detail the solar drying of pineapple, however, are relatively rare, and they involve prohibitively long drying times [47] (which are not really feasible if the process is to be implemented (semi-)industrially), focus more on product shelf life and sensorial and bromatological analysis [48] than on the actual drying process, discuss a specific dryer chamber design in terms of a Computational Fluid Dynamics (CFD) simulation of air flow therein [49], or address drying of thin pineapple slices pre-treated with a sucrose solution of various concentrations [50] or coated with different edible coatings [51]. Other studies focus on drying in a ventilated tunnel [52] instead of in a drying chamber into which hot air is supplied from a solar thermal collector, or employ various mixed mode [53] or hybrid [54] dryers, where both direct and indirect solar radiation is in effect or different hot media are used instead of air, respectively.
1.2. Circular Economy Strategy for Pineapple Processing in Togo
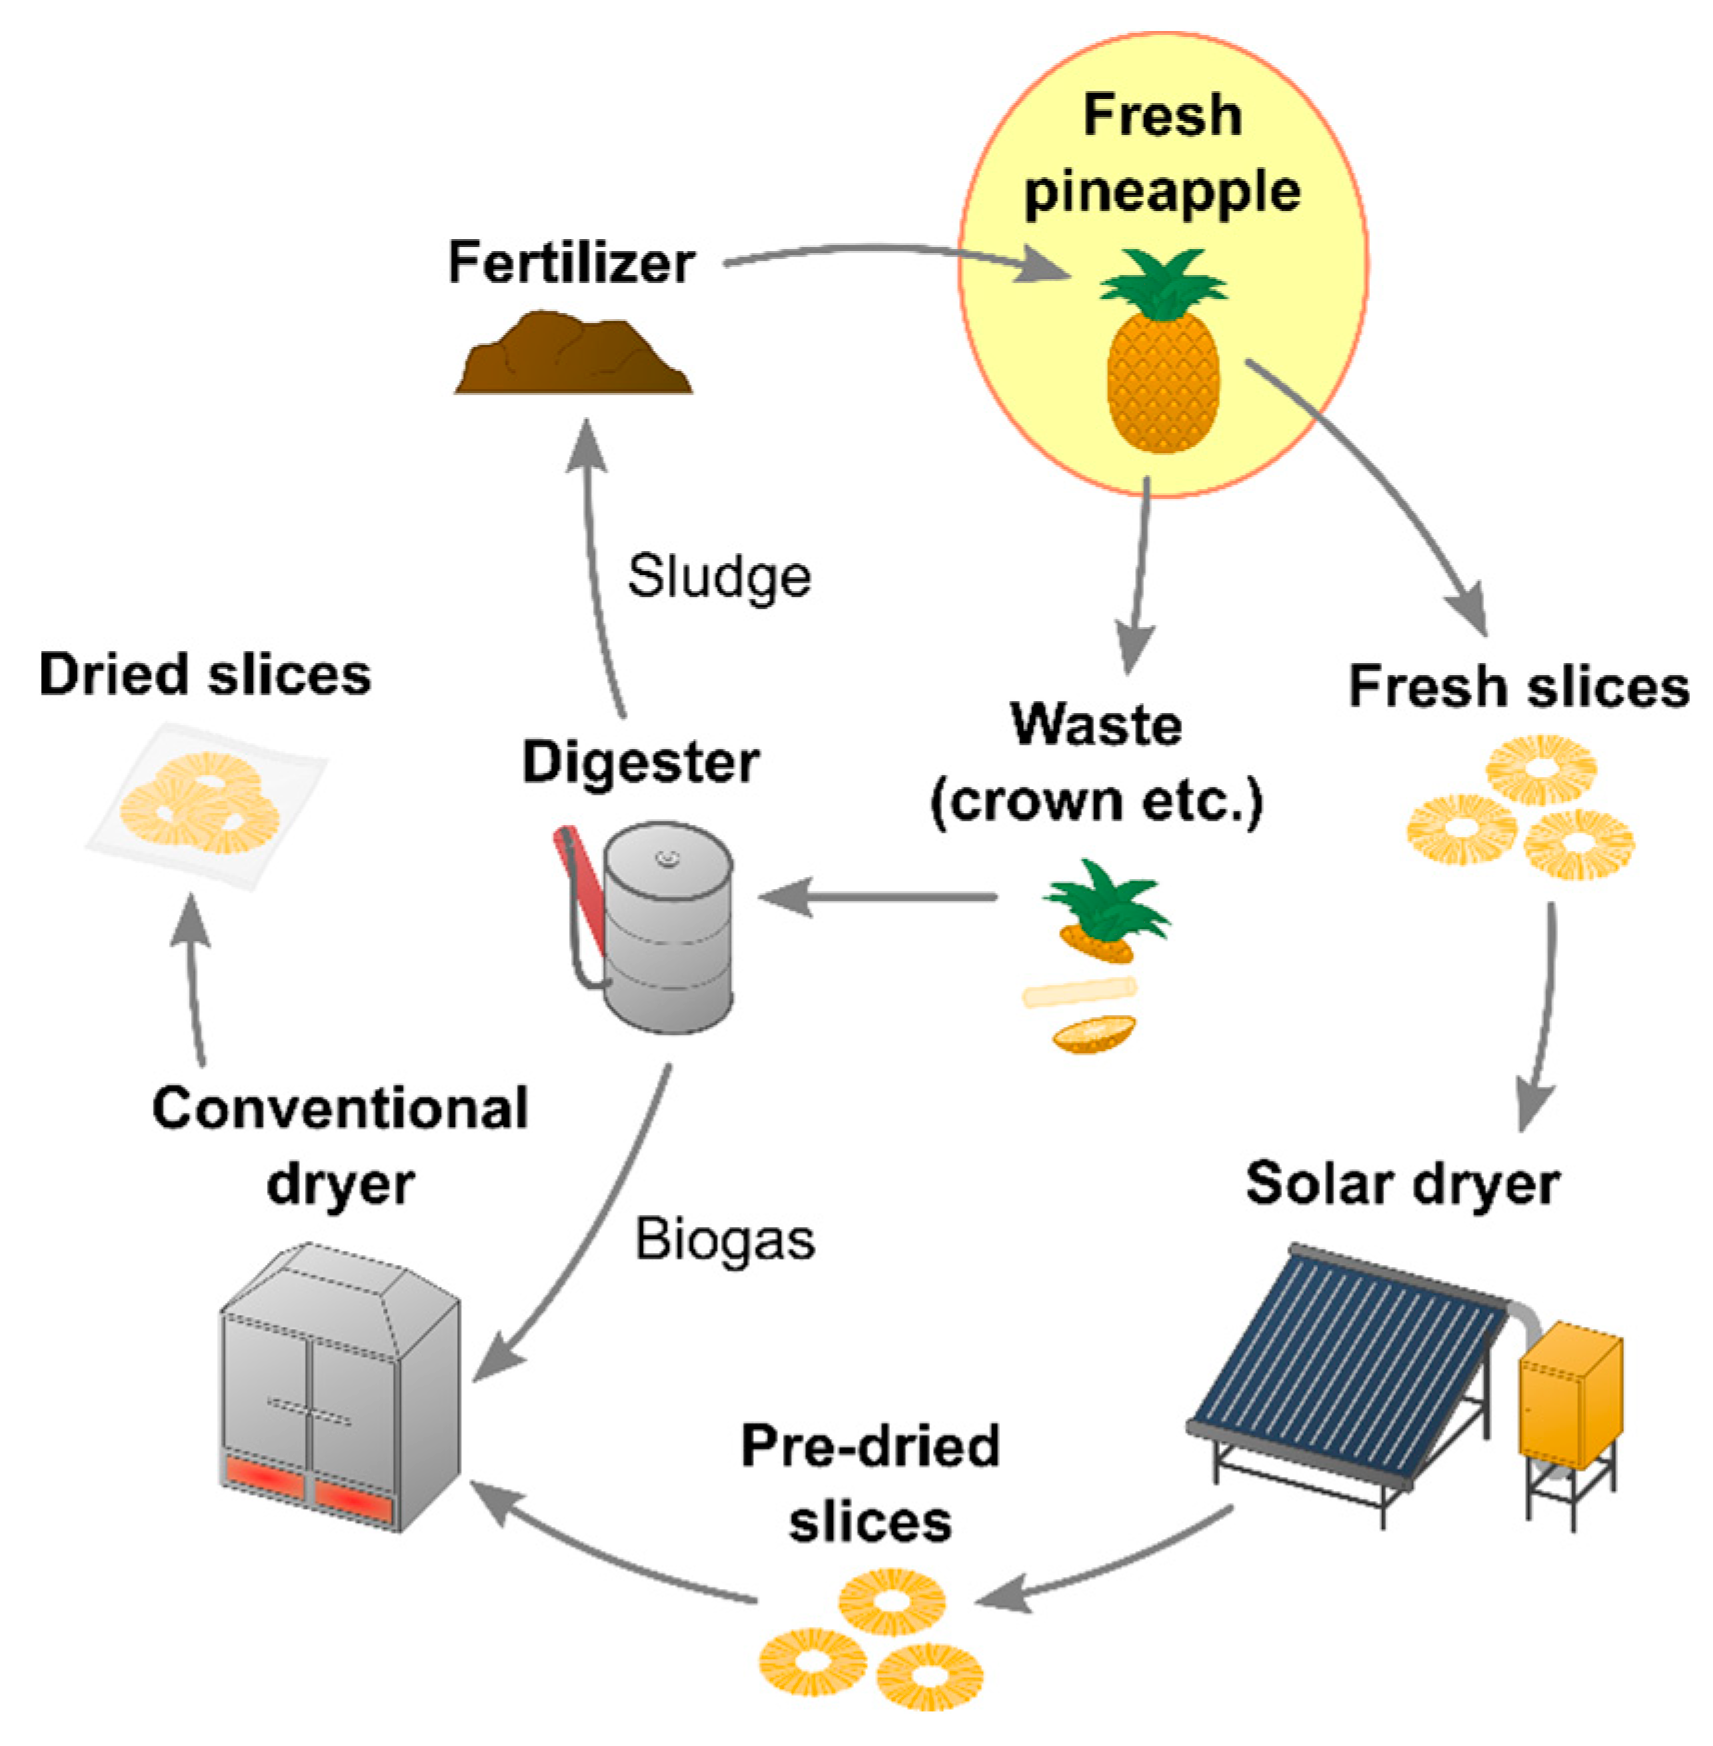
Togolese pineapple processing companies currently use conventional dryers, where the heat required for drying is generated by the combustion of liquefied gases (e.g., propane or butane) [55]. The fuel is bought in gas cylinders and thus the process is very demanding in terms of operating cost. Moreover, the liquefied gas supply is not sufficiently decentralized, and, therefore, at least a partial shift to renewable energy sources would be desirable. Following the findings presented in [3], the current paper proposes a circular economy strategy for pineapple processing in Togo, which is shown in Figure 1. This strategy, being somewhat similar to the one presented in [56] which involves cattle market wastes in Nigeria, lies in the efficient utilization of pineapple processing wastes. The starting point is fresh pineapple (as highlighted in Figure 1), from which two cycles are originating—the production cycle and the waste cycle. The production cycle involves the preparation of slices, which are then pre-dried in the solar dryer and, as an intermediate product, continue to the conventional dryer. There, the final product (dried pineapple fruit) is obtained. The waste cycle begins with the wastes, which are inoculated with cow dung and enter the digester, where biogas is produced. This gas, being the primary product of the cycle, is then used as a fuel in the conventional dryer. The secondary waste cycle product (sludge) is utilized as fertilizer in pineapple cultivation, and thus the circular economy cycle is closed.
For the strategy in Figure 1 to fully work, the biogas production (as discussed in [3]) must cover the fuel consumption in the conventional dryer. Therefore, the amount of fuel needed is decreased by pre-drying the pineapple slices in the solar dryer and, consequently, operating parameters of the dryer are essential for the optimal setup of the entire system. This is why the remaining portion of the present paper discusses in detail the solar drying process and the results of the corresponding pineapple drying experiments. The study’s aim was to establish whether the industrial-scale application of an indirect convective solar dryer, implemented as indicated in Figure 1, would be feasible in the West African region. Further objectives were to determine the main parameters influencing the drying process and their optimal values, and to quantify the resulting decrease in the consumption of fossil fuels. The discussed energy-saving drying process, which preserves the nutritional quality of dried pineapple fruit, would then provide farmers with limited access to fossil fuels an option to process their agricultural products locally in a simple yet reliable manner.
2. Materials and Methods
For this initial feasibility study, a laboratory-scale solar dryer for pineapple processing was built and tested. The regional conditions (i.e., the temperature and solar radiation availability in Togo) were reproduced using an indoor test facility for solar thermal collectors and photovoltaic panels. A two-level factorial design was used to evaluate the main factors affecting the drying process and their interactions. The experimental work was conducted at Augsburg University of Applied Sciences, Laboratory of Energy and Process Engineering, Germany.
2.1. Experimental Device and Measuring Devices
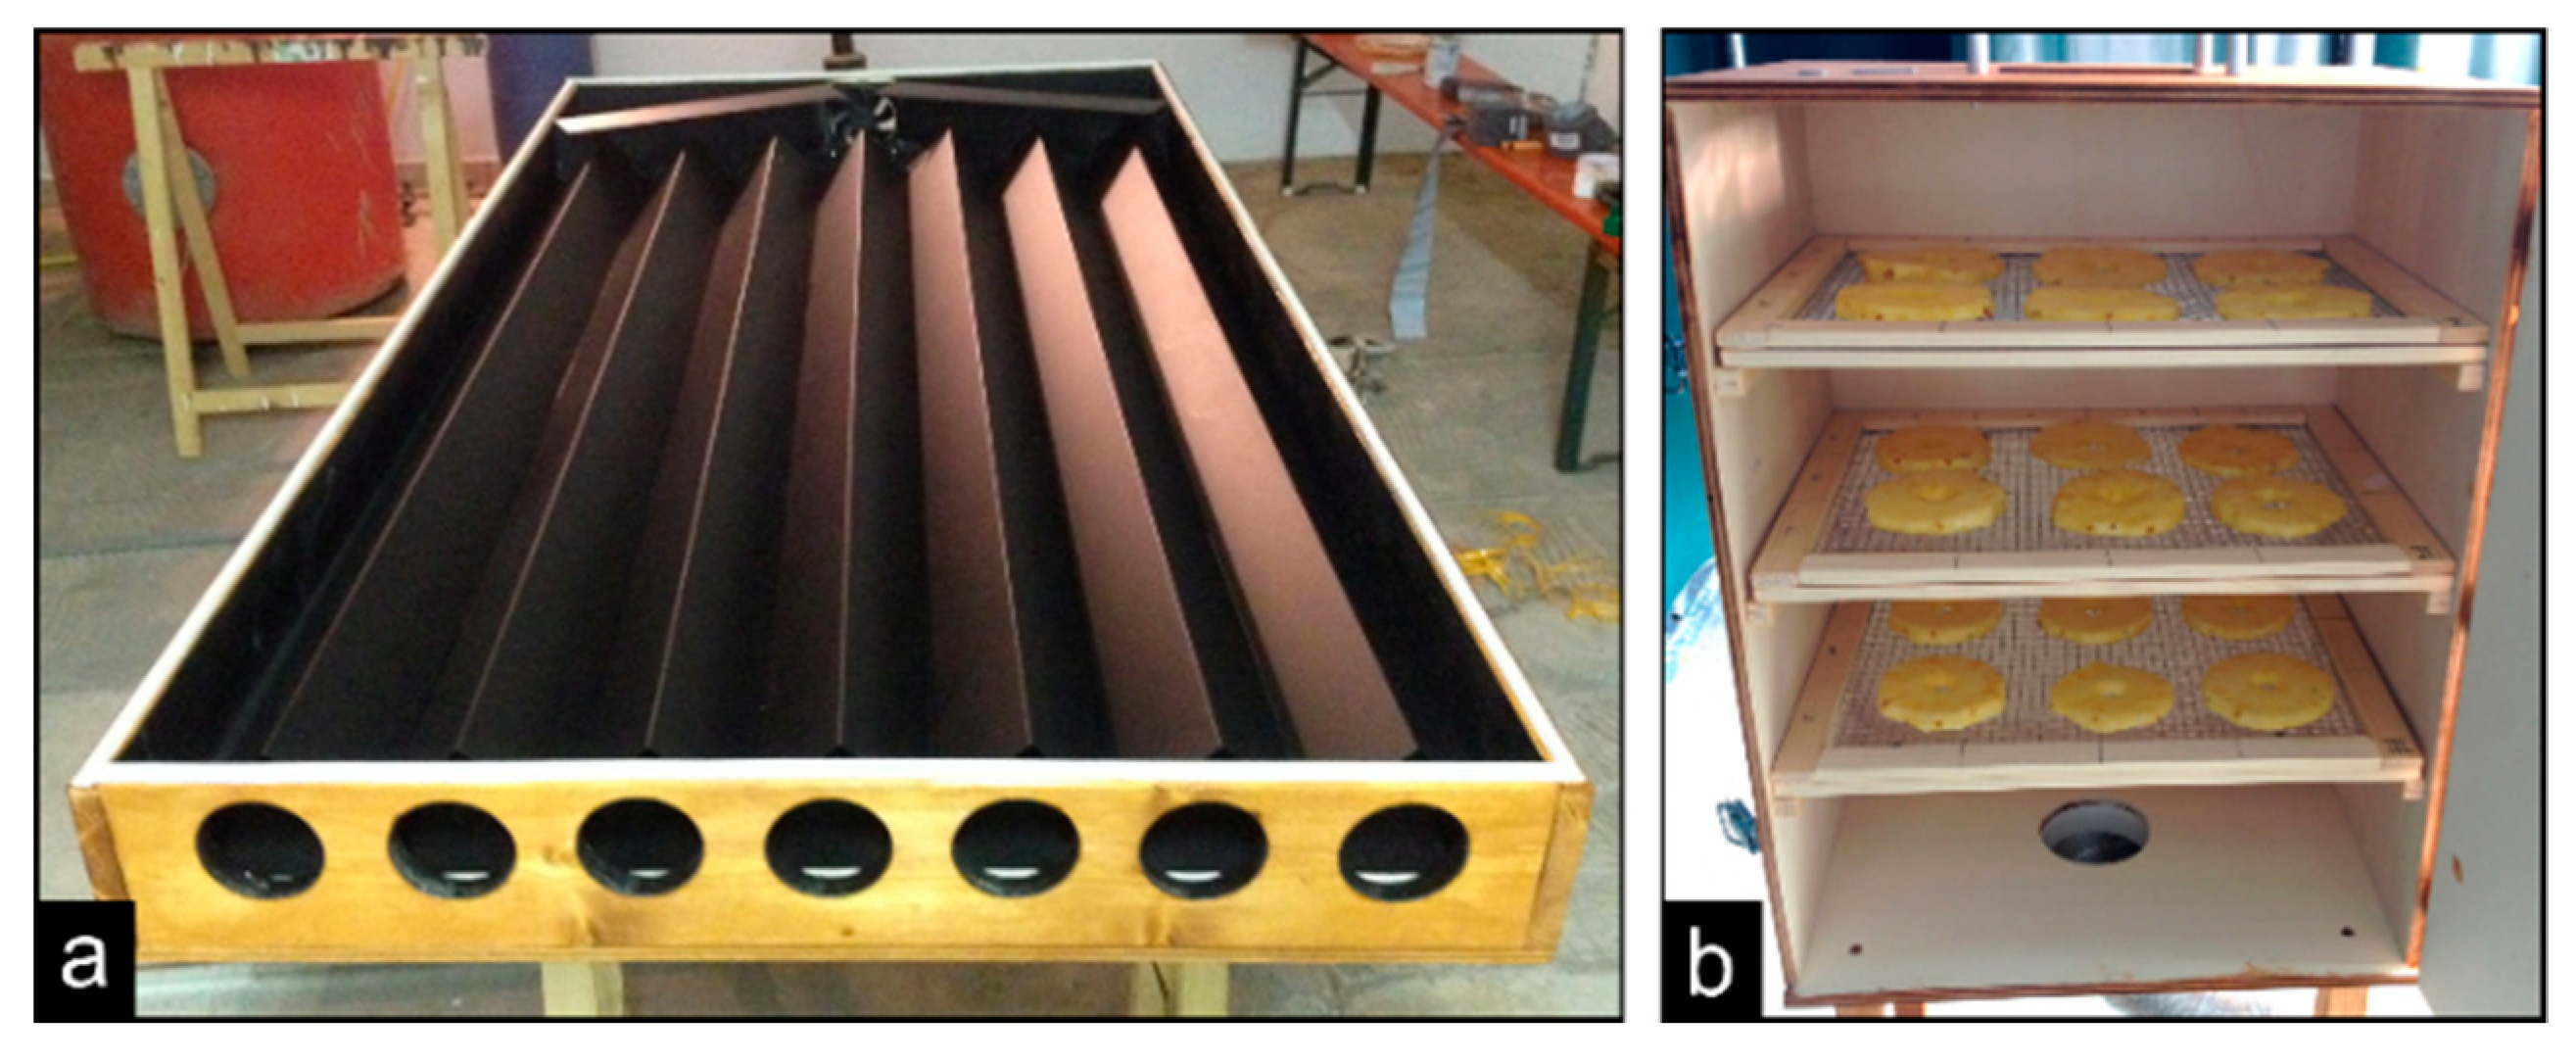
The newly built experimental device used was a convective solar dryer consisting of a 1.5 × 0.8 m solar thermal collector and a drying chamber with the dimensions of 0.47 × 0.37 × 0.6 m. The non-concentrating solar thermal collector for low-thermal applications adopted a modified flat plate format with a zig-zag geometry of the aluminum absorber, resulting in a surface area of 1.49 m2 (Figure 2a). The bottom of the collector was insulated using a 20 mm thick expanded polystyrene panel (EPS; thermal conductivity: 0.034 W/(m K)). The wooden drying chamber was equipped with three drying trays with wire meshing, each having a net surface area of 0.11 m2 (Figure 2b). The collector and the drying chamber were connected using a flexible aluminum tube insulated using a 25 mm thick, foil-faced polyethylene foam layer (thermal conductivity: 0.400 W/(m K), see Figure 3). The air flow around the material to be dried was ensured by the presence of a 2 W axial fan (type EE92251S1-000U-A99, Sunonwealth Electric Machine Industry Co. Ltd., Kaohsiung, Taiwan; flow rate up to 87.4 m3/h) at the solar collector outlet. Power was supplied to the fan by a small photovoltaic module with a capacity of 5 Wp. The experimental device was designed using inexpensive materials which are readily available in Togo. The total cost amounted to 377 EUR [57].
The working principle of the solar drying system is based on the conversion of solar radiation to thermal energy in the black-coated aluminum absorber shown in Figure 2a. The absorber itself features a high absorption factor of more than 90% and a high thermal conductivity of 215 W/(m K). A transparent acrylic glass cover with high transmittance of 90% and high mechanical resistance reduces thermal losses to the surroundings. Simultaneously, the acrylic glass cover lets through only very little long-wave radiation emitted by the absorber. The air that acts as the heat transfer medium flows through and is heated up in the space between the absorber and the cover. The heated air is then passed through the drying chamber, where it circulates around the dried material by means of forced convection. This results in a gentle drying process without direct contact of the product with solar radiation.
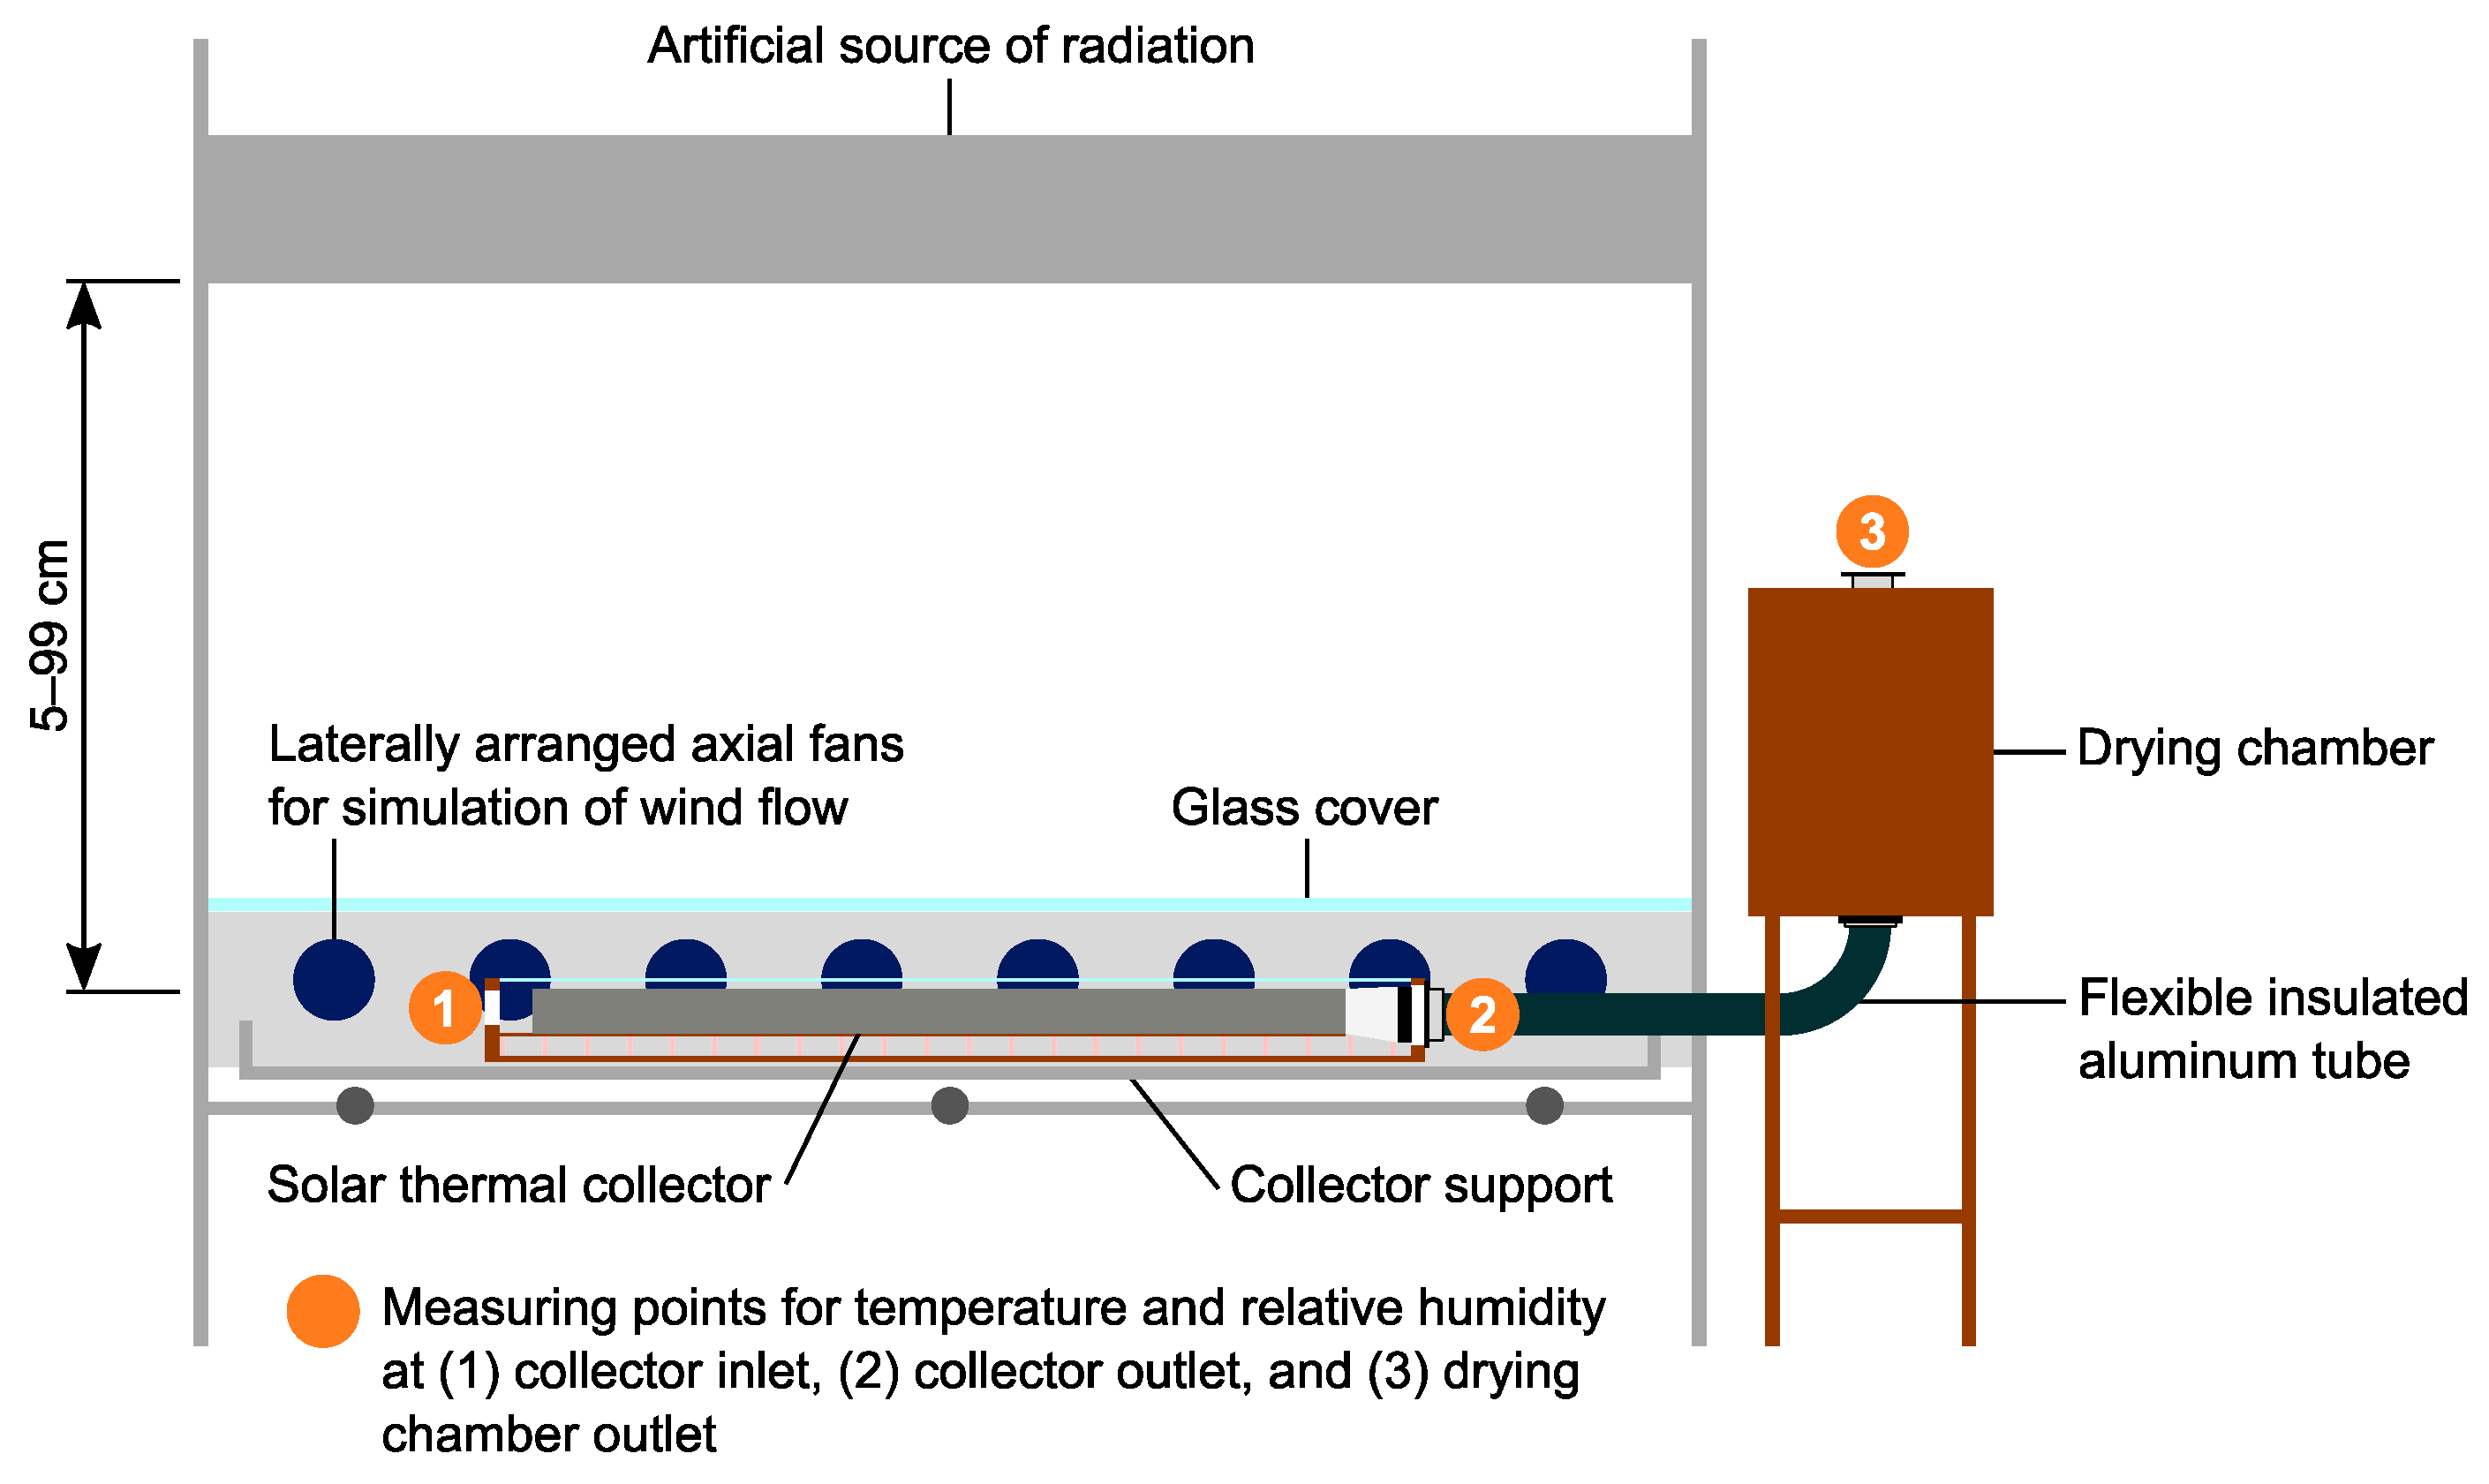
The solar thermal collector was placed in the indoor test facility (Figure 3) containing 28 mercury vapor lamps and 27 halogen lamps. The distance between the source of radiation and the collector was variable between 0.05 m and 0.99 m so that different radiation intensities could be simulated. The respective drying experiments were carried out with two different solar radiation intensities, 650 W/m2 and 1100 W/m2. Eight laterally arranged fans were used for wind simulation. The test unit was equipped with Testo 635 sensors (Testo SE & Co. KGaA, Titisee-Neustadt, Germany) to measure temperature (range: −20 °C to +70 °C, resolution: 0.1 °C, accuracy: ±0.3 K) and relative humidity (0–100%, 0.1%, ±2%) of the air at the inlet and outlet of the solar collector and at the drying chamber outlet as shown in Figure 3. It was assumed that the temperature and relative humidity at the solar collector outlet were approximately equivalent to the conditions at the drying chamber inlet. A pyranometer type 8101/8102 (Philipp Schenk GmbH, Vienna, Austria) was used to measure solar radiation (measuring range: 0–1500 W/m2, spectral range: 0.3–3 µm, resolution: 1 W/m2, accuracy: ±3%). To obtain the air volumetric flow rate, a hot wire anemometer type FV A915 S120 (Ahlborn Mess- und Regelungstechnik GmbH, Holzkirchen, Germany) was used (measuring range: 0.1–25 m/s, resolution: 0.01 m/s, accuracy: ±5%). Weight of the samples was measured using a Mettler PM 4600 electronic scale (N.V. Mettler-Toledo S.A., Zaventem, Belgium; accuracy: ±0.02 g).
2.2. Preparation of Samples
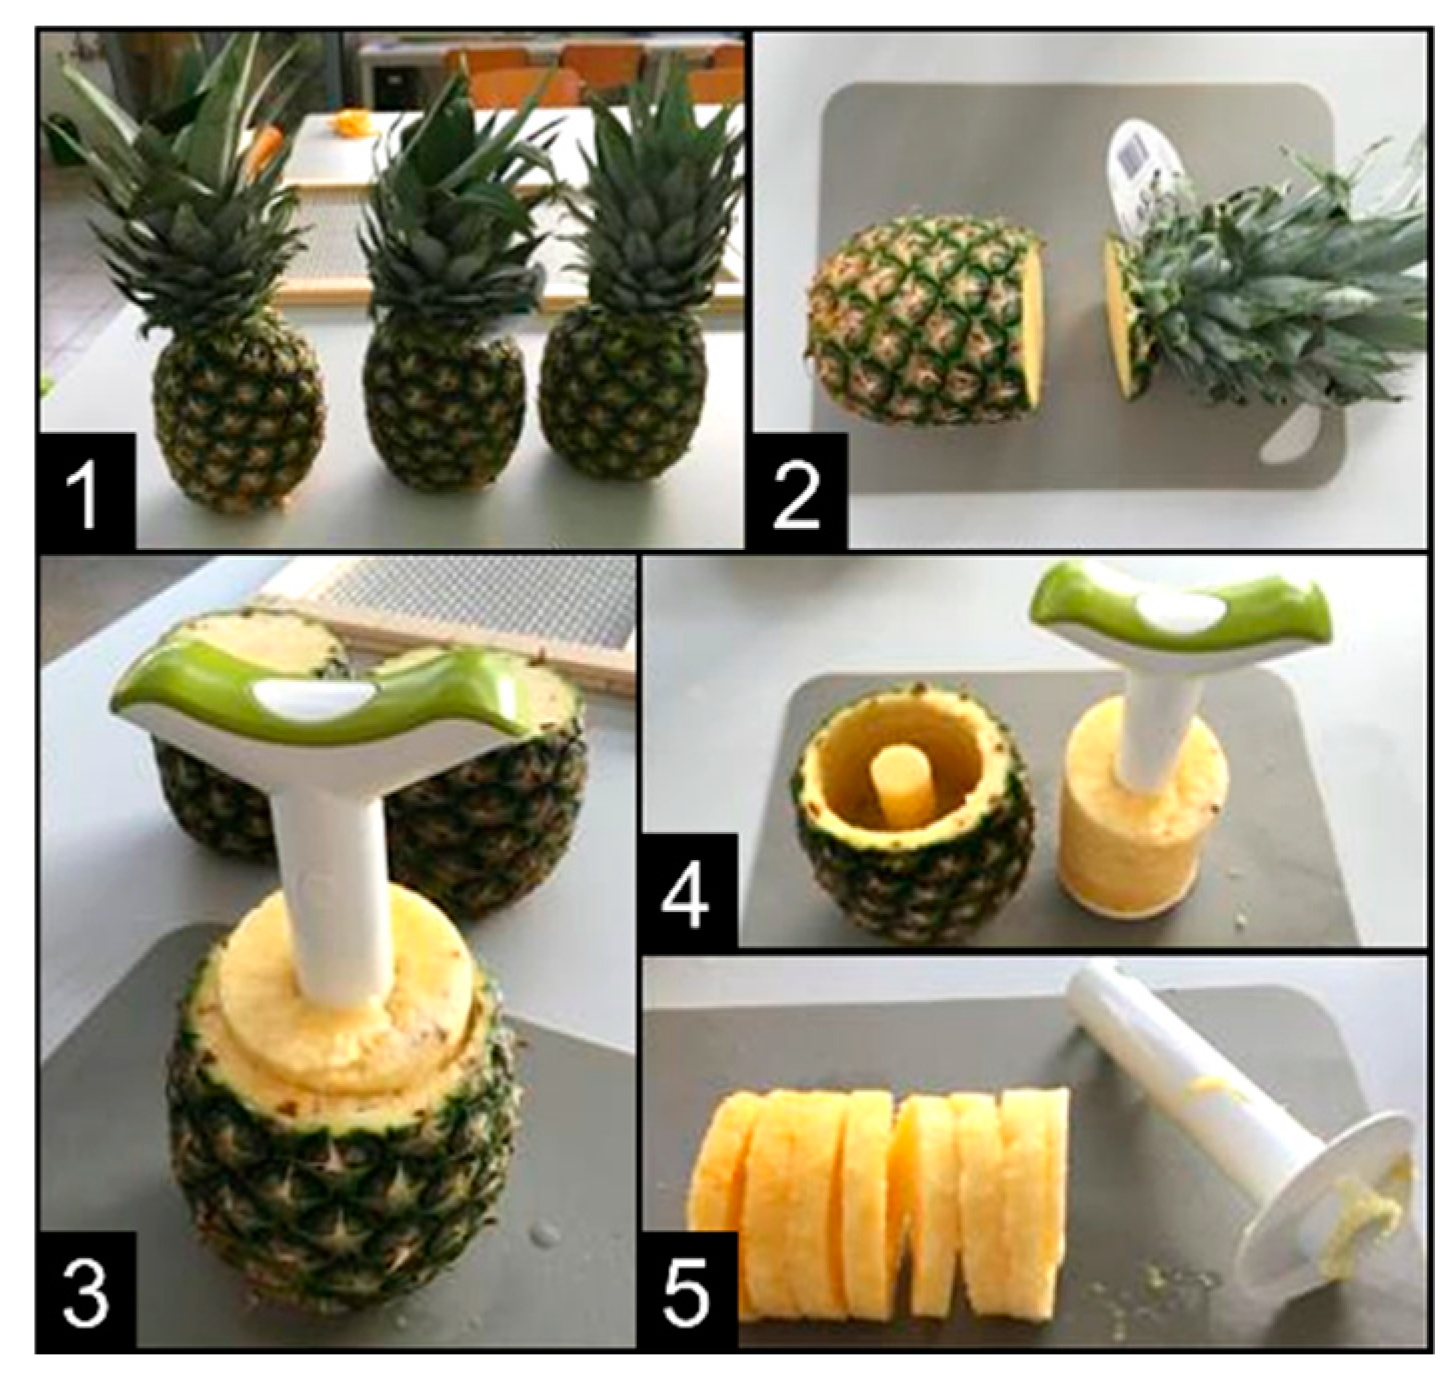
Pineapples were peeled, cored, trimmed, and cut into slices in a single step using a pineapple slicer (Figure 4). The diameter of the prepared slices was 90–100 mm. In order to identify the effects of slice thickness on drying, two varying thicknesses, 6–8 mm and 12–14 mm, were considered. In addition, the rings were cut into eighths in order to examine the drying kinetics. The initial moisture content (87.3 ± 1.2 wt %) was determined according to DIN EN 322 [58] and DIN EN 15414-3 [59], that is, the samples were weighed before being placed in an oven at 105 ± 2 °C for 24 h to be fully dried, and then they were weighed again.
Commercially produced dried pineapple fruit served as a reference product and its moisture content (13.7 ± 0.67 wt %) was obtained in the same manner. This was then used to evaluate the performance of the solar dryer.
2.3. Experimental Parameters
To reduce the number and the scope of experiments and to discover the relationships between the factors affecting the drying process, the statistical Design of Experiments (DOE) method was applied [60]. The most significant factors influencing the drying process identified as controllable input factors were the drying time, solar radiation intensity, and slice thickness. The effect of air flow rate was not investigated in this preliminary feasibility study, but was selected according to the available axial fan performance and cost, fan characteristic curve, and the total pressure drop in the solar drying system (42.1 m3/h, corresponds to roughly half the maximum fan throughput). Other controllable input factors such as mean wind velocity of 1.8 m/s, the angle of incidence of solar radiation of 90°, and the diameter of pineapple slices were always the same as well. Uncontrollable input factors were temperature and relative humidity of the ambient air and the moisture content in the fresh pineapple. The moisture content in the dried pineapple was the output used for validating the solar drying process. The controllable input factors were varied in this experimental design at two levels, low (−) and high (+), as shown in Table 1.
As for the drying time, this was varied with respect to the minimum and maximum usable daily sunshine duration in Togo in the months of June to October and November to May (the primary pineapple processing periods in this country). The selected solar radiation intensities corresponded to the respective prevailing minimum and maximum values. All the relevant climate data were taken from the software Meteonorm 7 (Meteotest AG, Bern, Switzerland) [61]. A full factorial design with k factors attaining two levels was chosen [62]. The number of experiments was therefore given by n = 2k, that is, for k = 3 the experimental design comprised eight tests as shown in Table 2. This experimental design was carried out in a random order twice to determine the influence of input factors on the output more accurately and to mitigate the effect of scattering.
The moisture content in the dried pineapple was not influenced by only the individual input factors, A, B, and C. Therefore, the effects of all possible interactions of two factors, and of all three factors mentioned above, also had to be investigated using analysis of variance. For an experiment design comprising 2k experiments, 2k − 1 effects could be identified with positive or negative signs as presented in Table 3. The signs of individual input factors were equal to their levels from Table 2. In each row, the signs of interactions, AB, AC, BC, and ABC, correspond to the products of signs of the respective input factors. The effects can then be estimated as follows:
where i denotes the test number and is the mean of the respective experimental results.
2.4. Drying Process
In a typical medium-sized Togolese company, around 1.5 t/d of fresh pineapples are processed, of which roughly 900 kg/d are dried at 50–60 °C for 20 h. The remaining 600 kg/d leave the production process as waste. For the conventional drying process, the daily butane consumption is around 49.5 kg which corresponds to a daily cost of 39.20 EUR [55]. Assuming a calorific value of butane of 12.72 kWh/kg at 25 °C, the daily energy consumption required for drying is 629.6 kWh or 0.7 kWh per kilogram of fresh fruit.
For the experiments, the indoor test facility was switched on and the drying chamber was preheated without the trays for 15 min. Then, six prepared pineapple slices were placed at different locations on each tray, and the trays were placed into the drying chamber. Subsequently, continuous drying tests were run with the parameters being set according to Table 2. The temperature and relative humidity of air were measured and recorded every two minutes during the entire experimental period. Afterwards, the pineapple slices were crushed, and their moisture content was determined. The moisture content in the product to be dried was expressed on total material basis as , where mW is the mass of water contained in the pineapples and mDM is the respective dry solid mass. The moisture content can also be expressed on the dry basis,
where the mass of the dry solid, mDM, remains constant during the entire drying process. Both values of product moisture can be converted between each other using .
The ambient air entering the solar collector was characterized by the temperature of 25 °C, relative humidity of 30 wt %, and pressure of 1.012 bar. The simplified equation,
assuming a continuous, steady-state dryer operation, can be used for the calculation of drying air consumption. Here, the moisture removed from a product to be dried is defined as and the absolute air humidity is defined as . In these equations, and denote the vapor inlet and outlet mass flow rates, respectively, mV is the mass of vapor, and mA is the mass of dry air. The enthalpy of moist air is then given by the following equation:
where hA denotes the enthalpy of dry air, hV is the enthalpy of vapor, cp,A and cp,V are the specific heat capacities of dry air and vapor, respectively, t is the temperature, and L is the specific heat of vaporization. The corresponding absolute humidity can be calculated using the following equation:
where φ denotes the relative air humidity, RA = 0.2871 kJ/(mol K) and RV = 0.4614 kJ/(mol K) are the specific gas constants of dry air and vapor, respectively, pS is the saturation pressure, and p is the actual pressure. The energy required by the drying process is then calculated as , where hin and hout denote the enthalpies of air at drying chamber inlet and outlet, respectively, and ∆hD is the change in air enthalpy in the drying chamber.
The source of heat in the solar thermal collector was the radiation generated by the lamps in the indoor test facility. The input power is usually the solar radiation received by the surface of the collector, absorbed and transferred to the drying air. This must be heated from ambient conditions at around 25 °C to conditions required at the inlet of the drying chamber (at least 55 °C). The heat flux to the drying air is therefore given by the following equation:
where hamb denotes the enthalpy of ambient air and is the change in air enthalpy in the solar thermal collector. The same heat flux can be written in terms of quantities representing the energy irradiated to the thermal collector and the losses, , as , where η0 denotes the optical efficiency of the solar thermal collector and AC is its area. The overall efficiency of the solar thermal collector, including optical and thermal losses, can then be obtained using the following equation:
where η0 and are constants to be evaluated either analytically or experimentally, while tC denotes the mean collector temperature and tamb is the ambient temperature. According to [63], the typical experimental coefficients in efficiency correlations for air collectors operating between 20 °C and 50 °C are η0 = (0.75–0.80) and a = (8–30) W/(m2 K). The required collector area then follows from the general definition of the overall efficiency of the solar thermal collector, that is,
3. Results and Discussion
The overall performance and efficiency of the solar collector used to provide hot air to the drying process were considered first. With respect to the proposed experimental design, the residual moisture of dried pineapple fruit was used as the metric. The drying kinetics were determined for both slice thicknesses. Finally, the impact of local climatic conditions on the drying process performance was estimated together with the expected fossil fuel savings, and the design of the solar thermal collector was improved.
3.1. Solar Thermal Collector Performance
Initially, the solar thermal collector was designed for the worst-case scenario, that is, the required drying time of 4 h and low radiation intensity of 650 W/m2, obtained via Equations (3) and (5) for a minimum air flow rate of 33.4 m3/h. Under these assumptions, the collector heat flux calculated using Equations (4)–(6) was 280.12 W. The necessary solar thermal collector area, AC, was then determined using Equations (7) and (8) to be 1.49 m2 for η0 = 0.75, a = 20 W/(m2 K), and (tC − tamb) = 15 K.
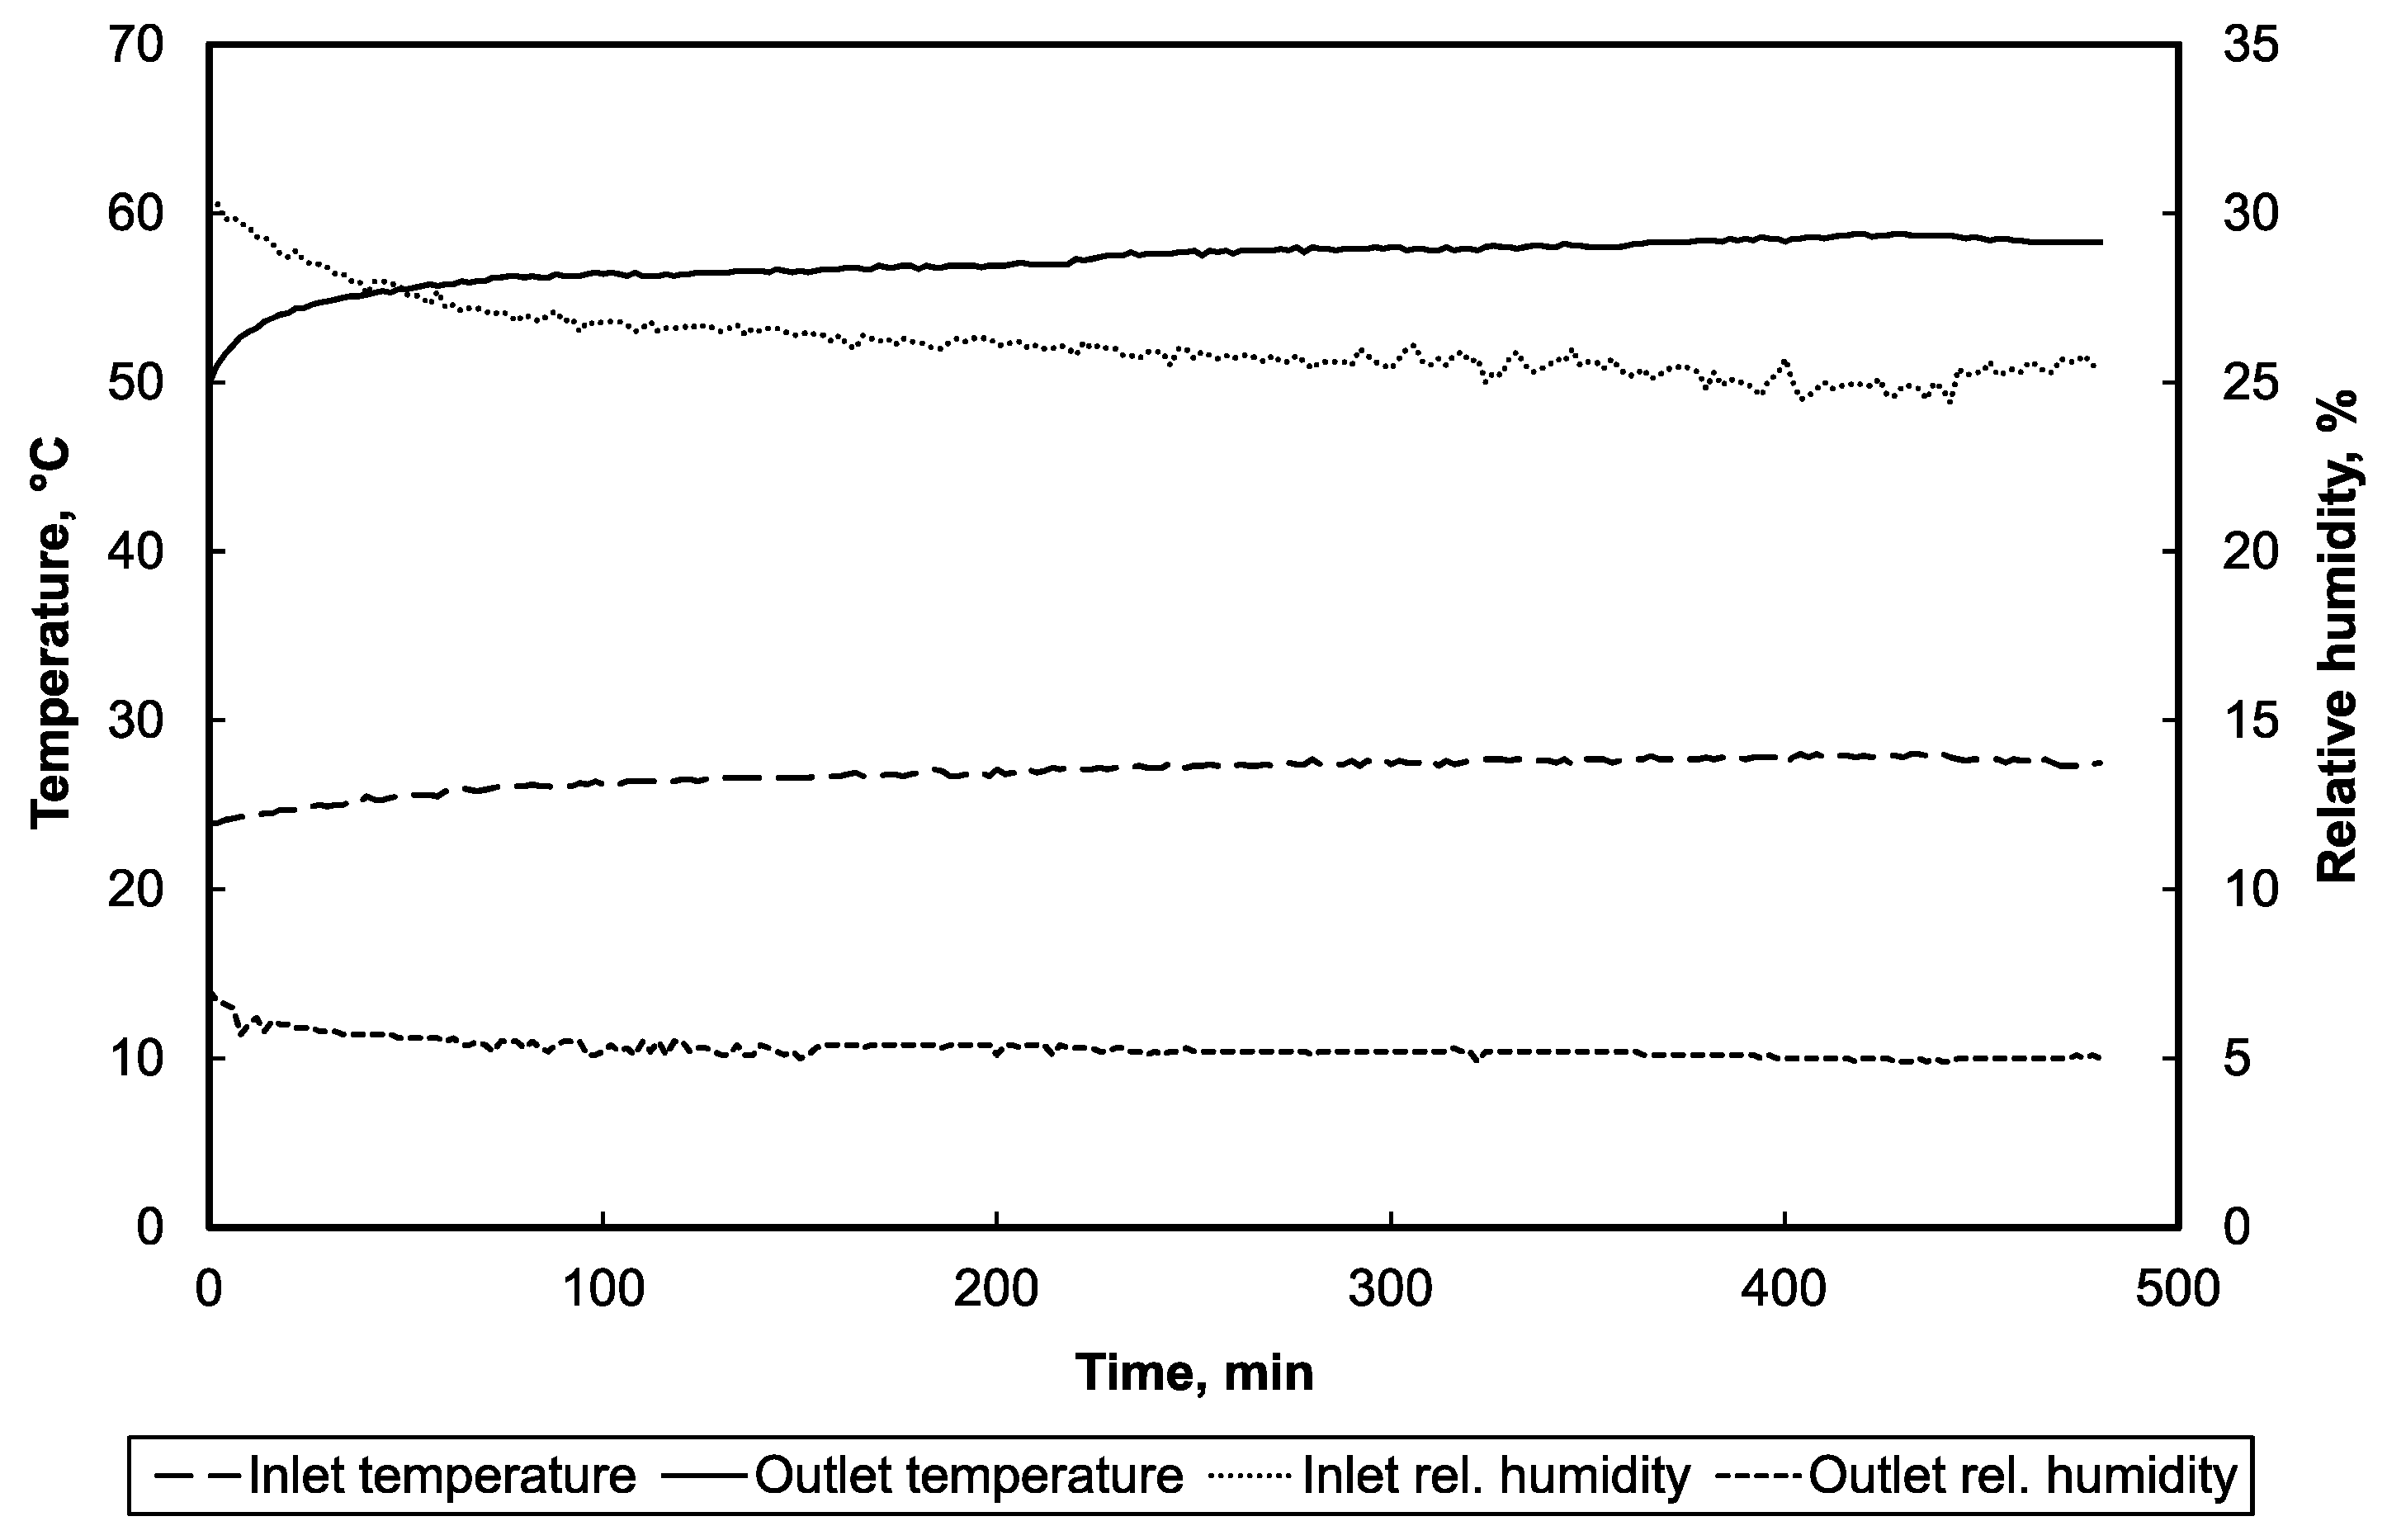
To determine the overall performance and efficiency of the solar thermal collector for each test, temperature and relative humidity of air at the collector inlet and outlet were recorded. In total, 16 tests at radiation intensities of 650 W/m2 and 1100 W/m2 were carried out. Figure 5 shows an example of typical measured values at the high solar radiation intensity of 1100 W/m2 over the period of 480 min. For further consideration, the respective average temperatures and relative humidities after the warm-up phase of 50 min were used.
Table 4 summarizes for each test the increases in drying air temperature, tin − tamb. Using the corresponding mean value, the air temperature at the solar collector outlet was 46.8 °C at 650 W/m2, whereas at 1100 W/m2 it was 56.8 °C. This means that the required temperature of about 55 °C at the drying chamber inlet can only be guaranteed at the high solar radiation intensity level.
Given the air flow rate of 42.1 m3/h and mean air density of 1.12 kg/m3, the overall efficiency of the solar thermal collector was calculated using Equations (4)–(6) and (8). The results are listed in Table 5.
3.2. Results of the Experiments
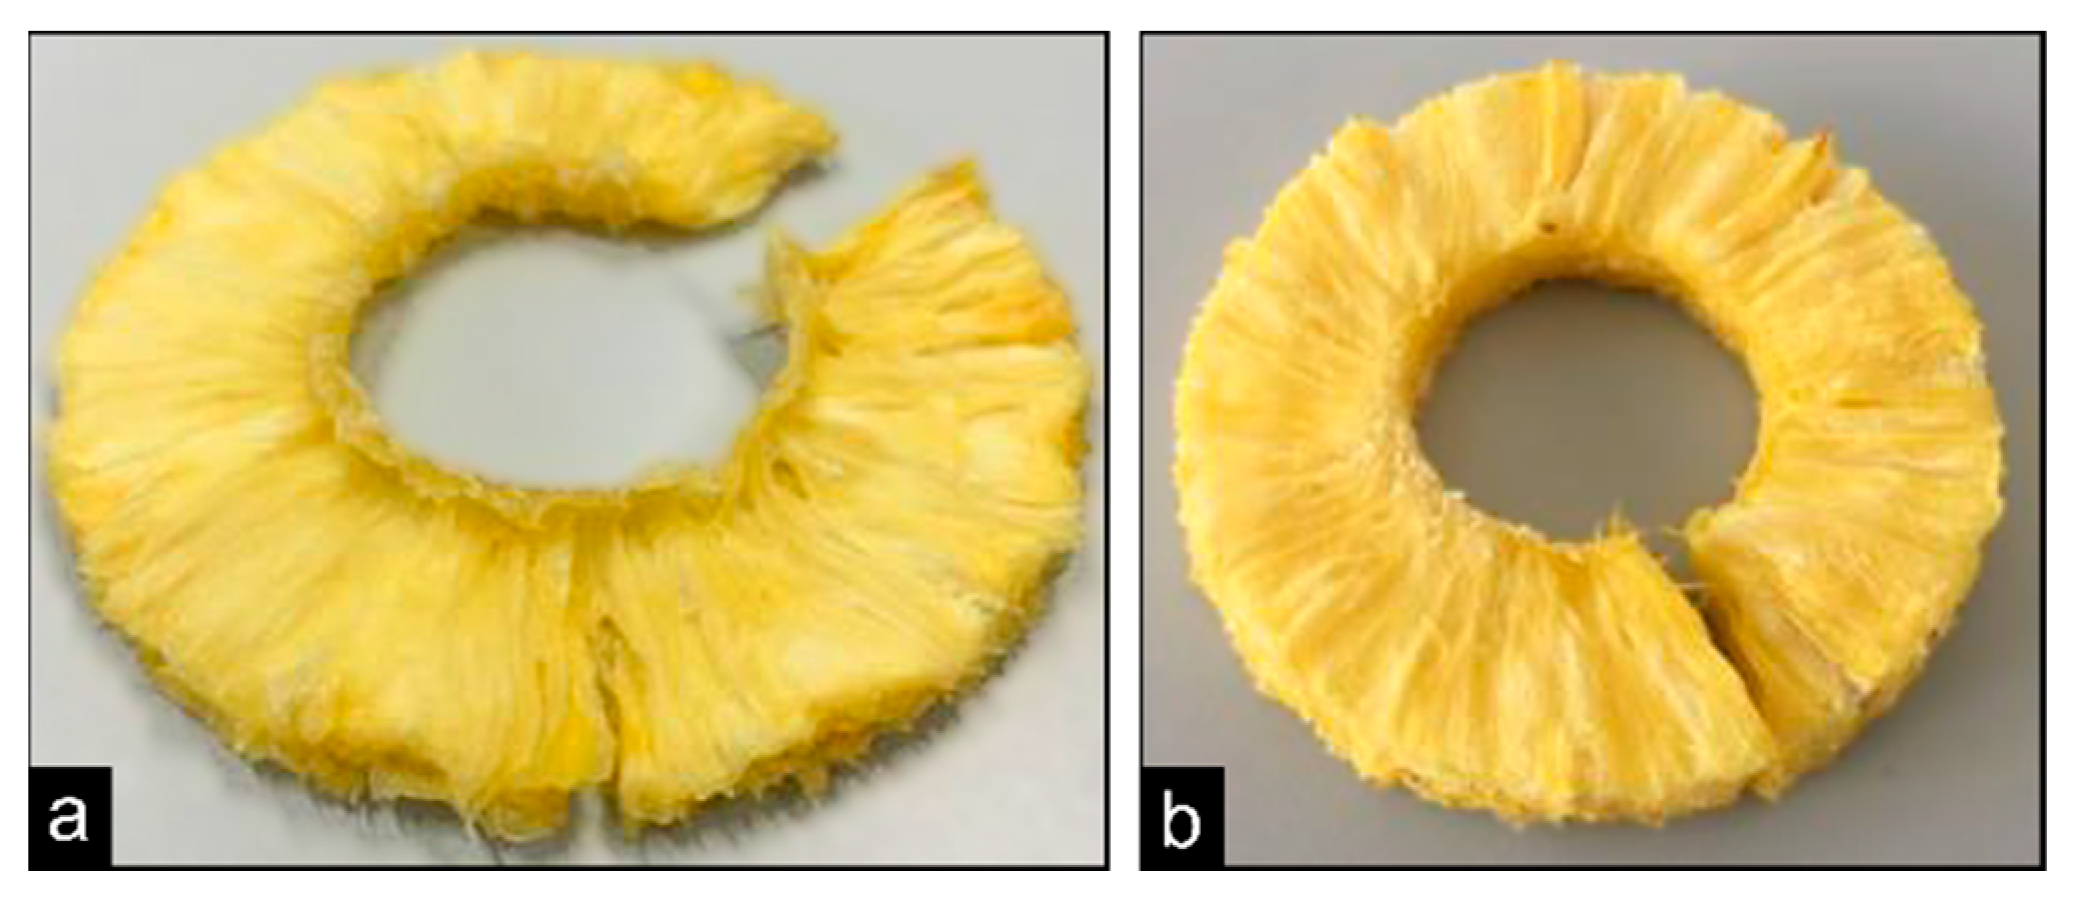
The experiments were compared on the basis of moisture content in the pineapple fruit before and after the drying process. The eight tests of full factorial design as given in Table 1 and Table 2 carried out twice yielded 16 moisture content values shown in Table 6. The data indicate that the best drying performance was reached in test number 4 with the drying time of 480 min, radiation intensity of 1100 W/m2, and slice thickness of 6–8 mm (Figure 6a). Significant shrinkage was apparent in the case of the corresponding dried pineapple slice. The second-best result was obtained in test number 2. In contrast, test number 5 with the drying time of 270 min, solar radiation intensity of 650 W/m2, and slice thickness of 12–14 mm showed the least satisfactory outcome with the highest residual moisture content (Figure 6b). Compared to a fresh pineapple slice, here there was only a slight change in appearance due to the removal of moisture just from the surface.
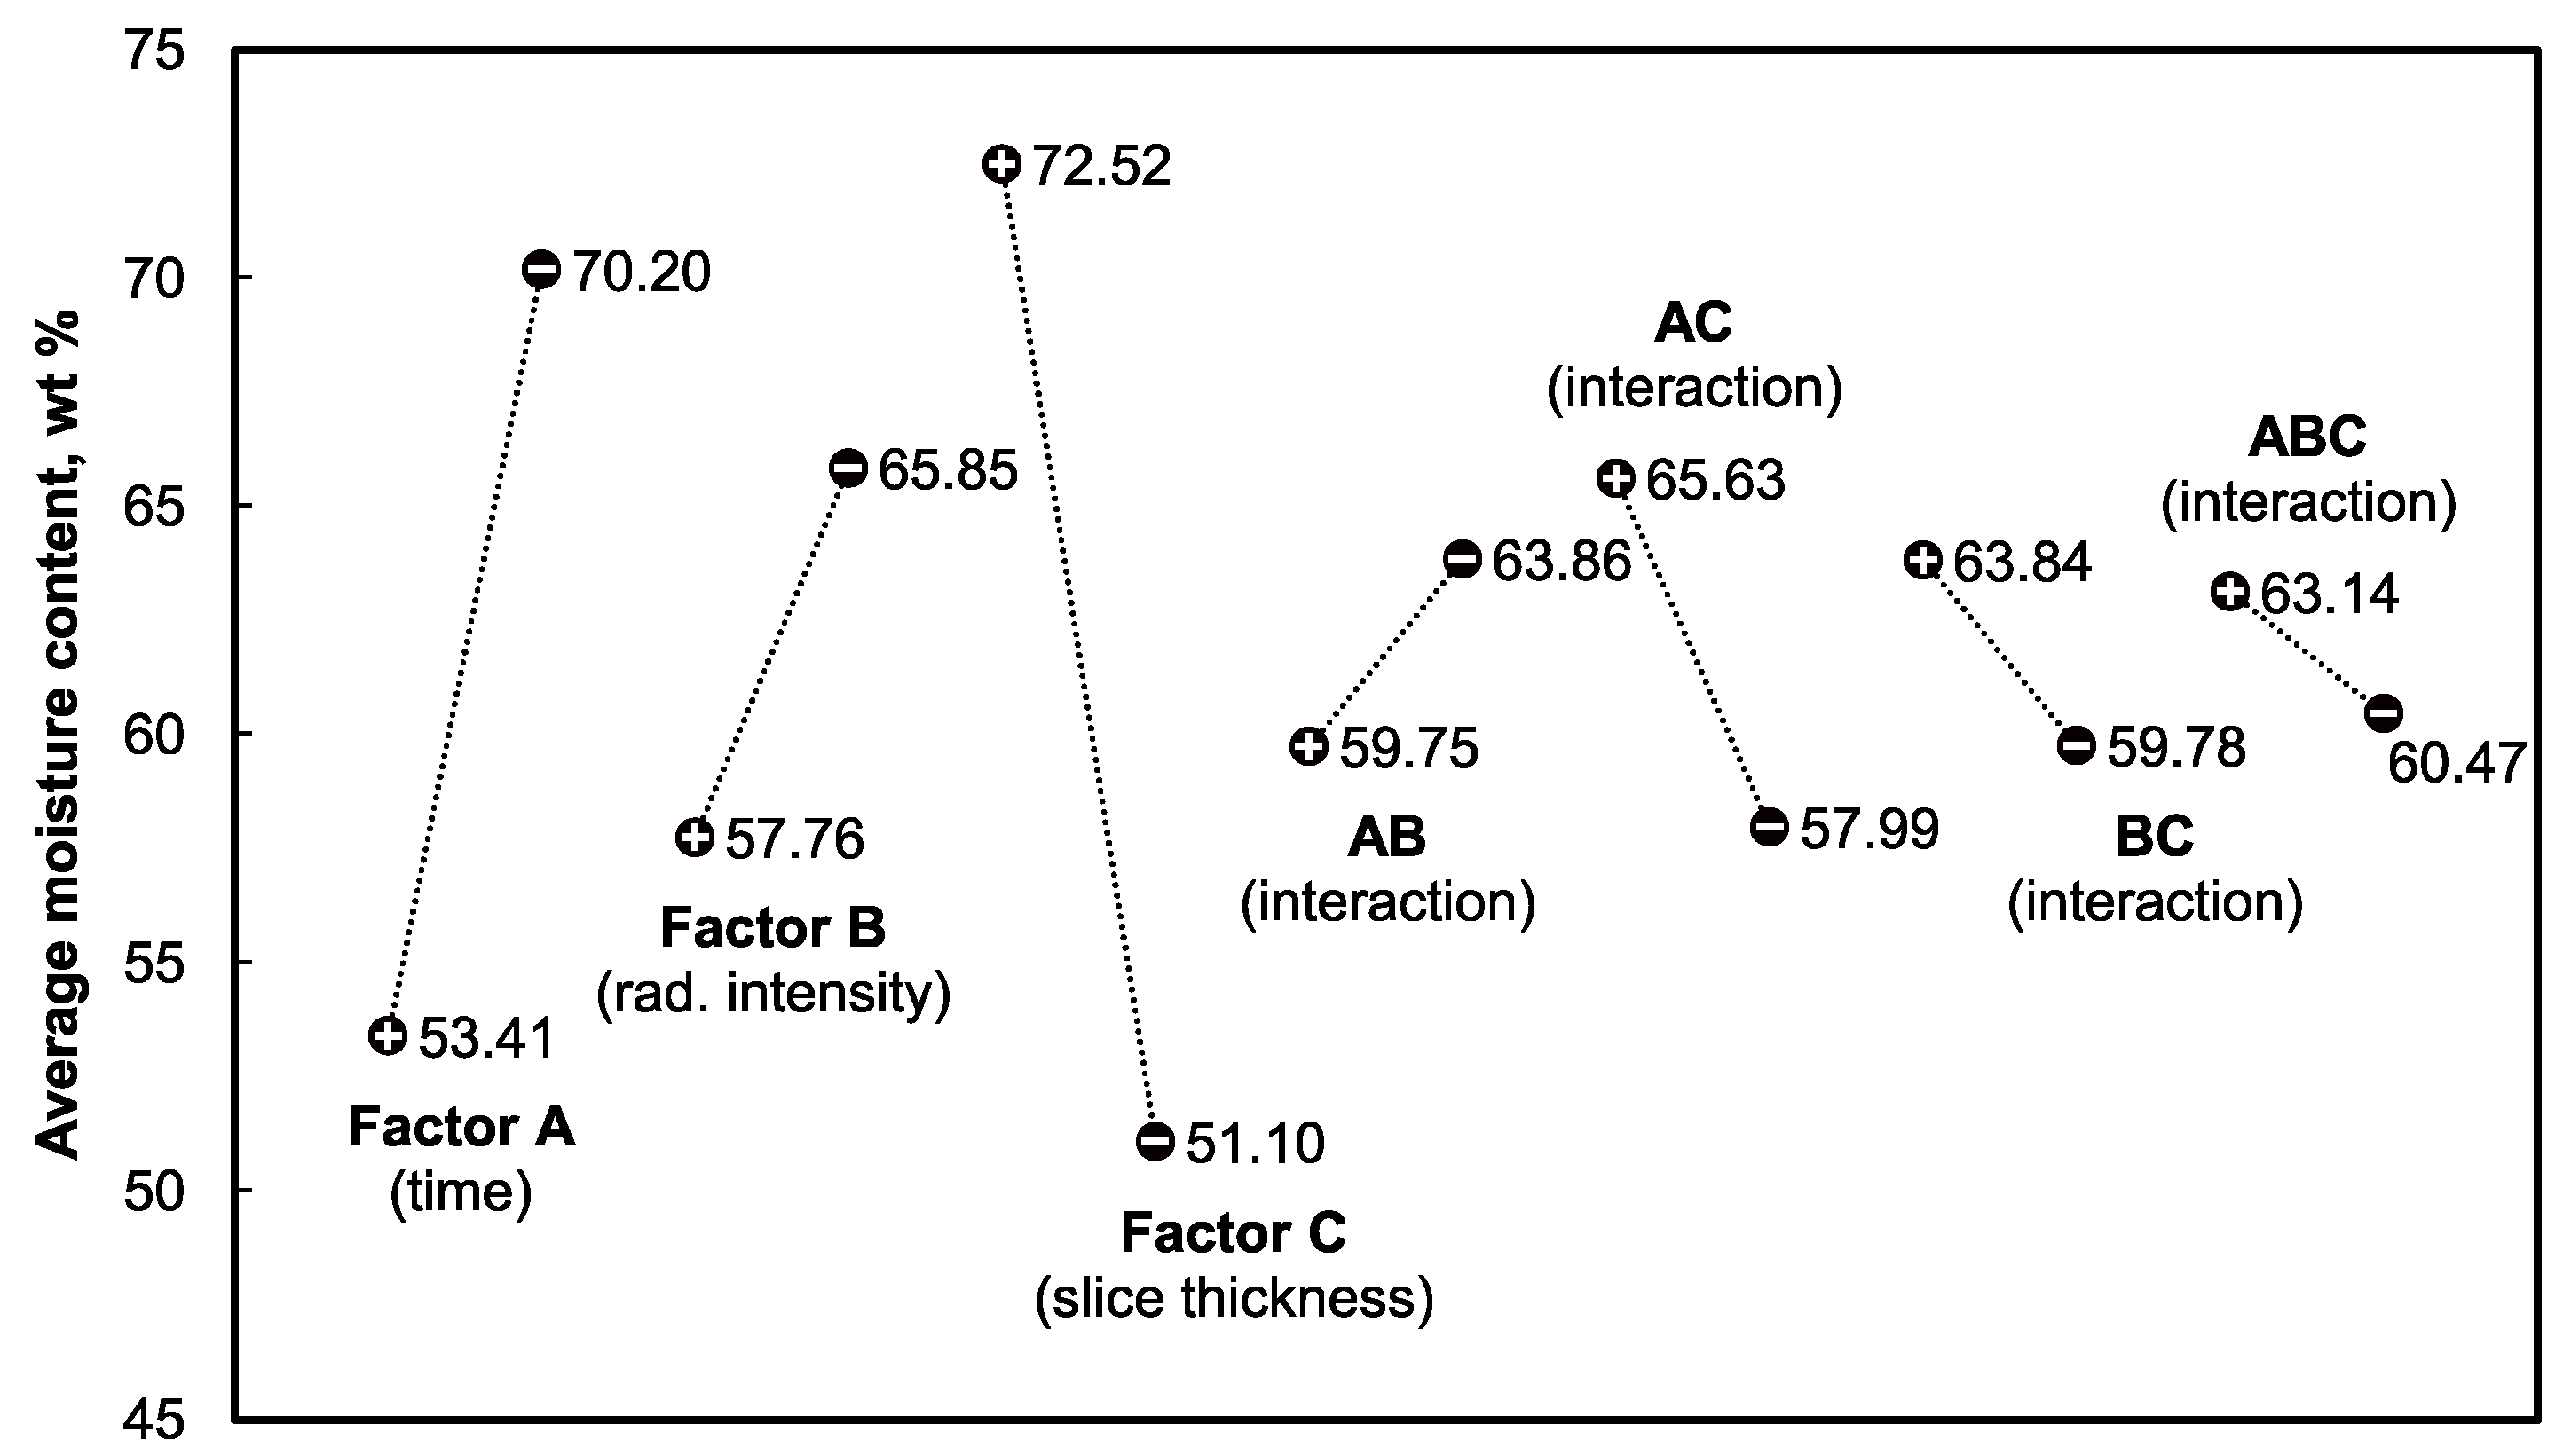
Using the factor signs from Table 3 and the means in Table 6, the means for the two levels, (−) and (+), can be calculated by column for each input factor and each combination of input factors. The results are shown in Figure 7. The greater the deviation between the two means, (−) and (+) (i.e., the steeper the line connecting both means), the greater the influence of a factor or a factor interaction on the drying process. It is obvious from Figure 7 that the moisture content in the dried pineapple fruit is most affected by slice thickness (factor C) and drying time (factor A). In comparison, solar radiation intensity (factor B), as well as all interactions of individual factors, influence the process output significantly less. Furthermore, the effects of the individual input factors as well as of the combinations of factors can be expressed quantitatively using Equation (1), as shown in Table 7.
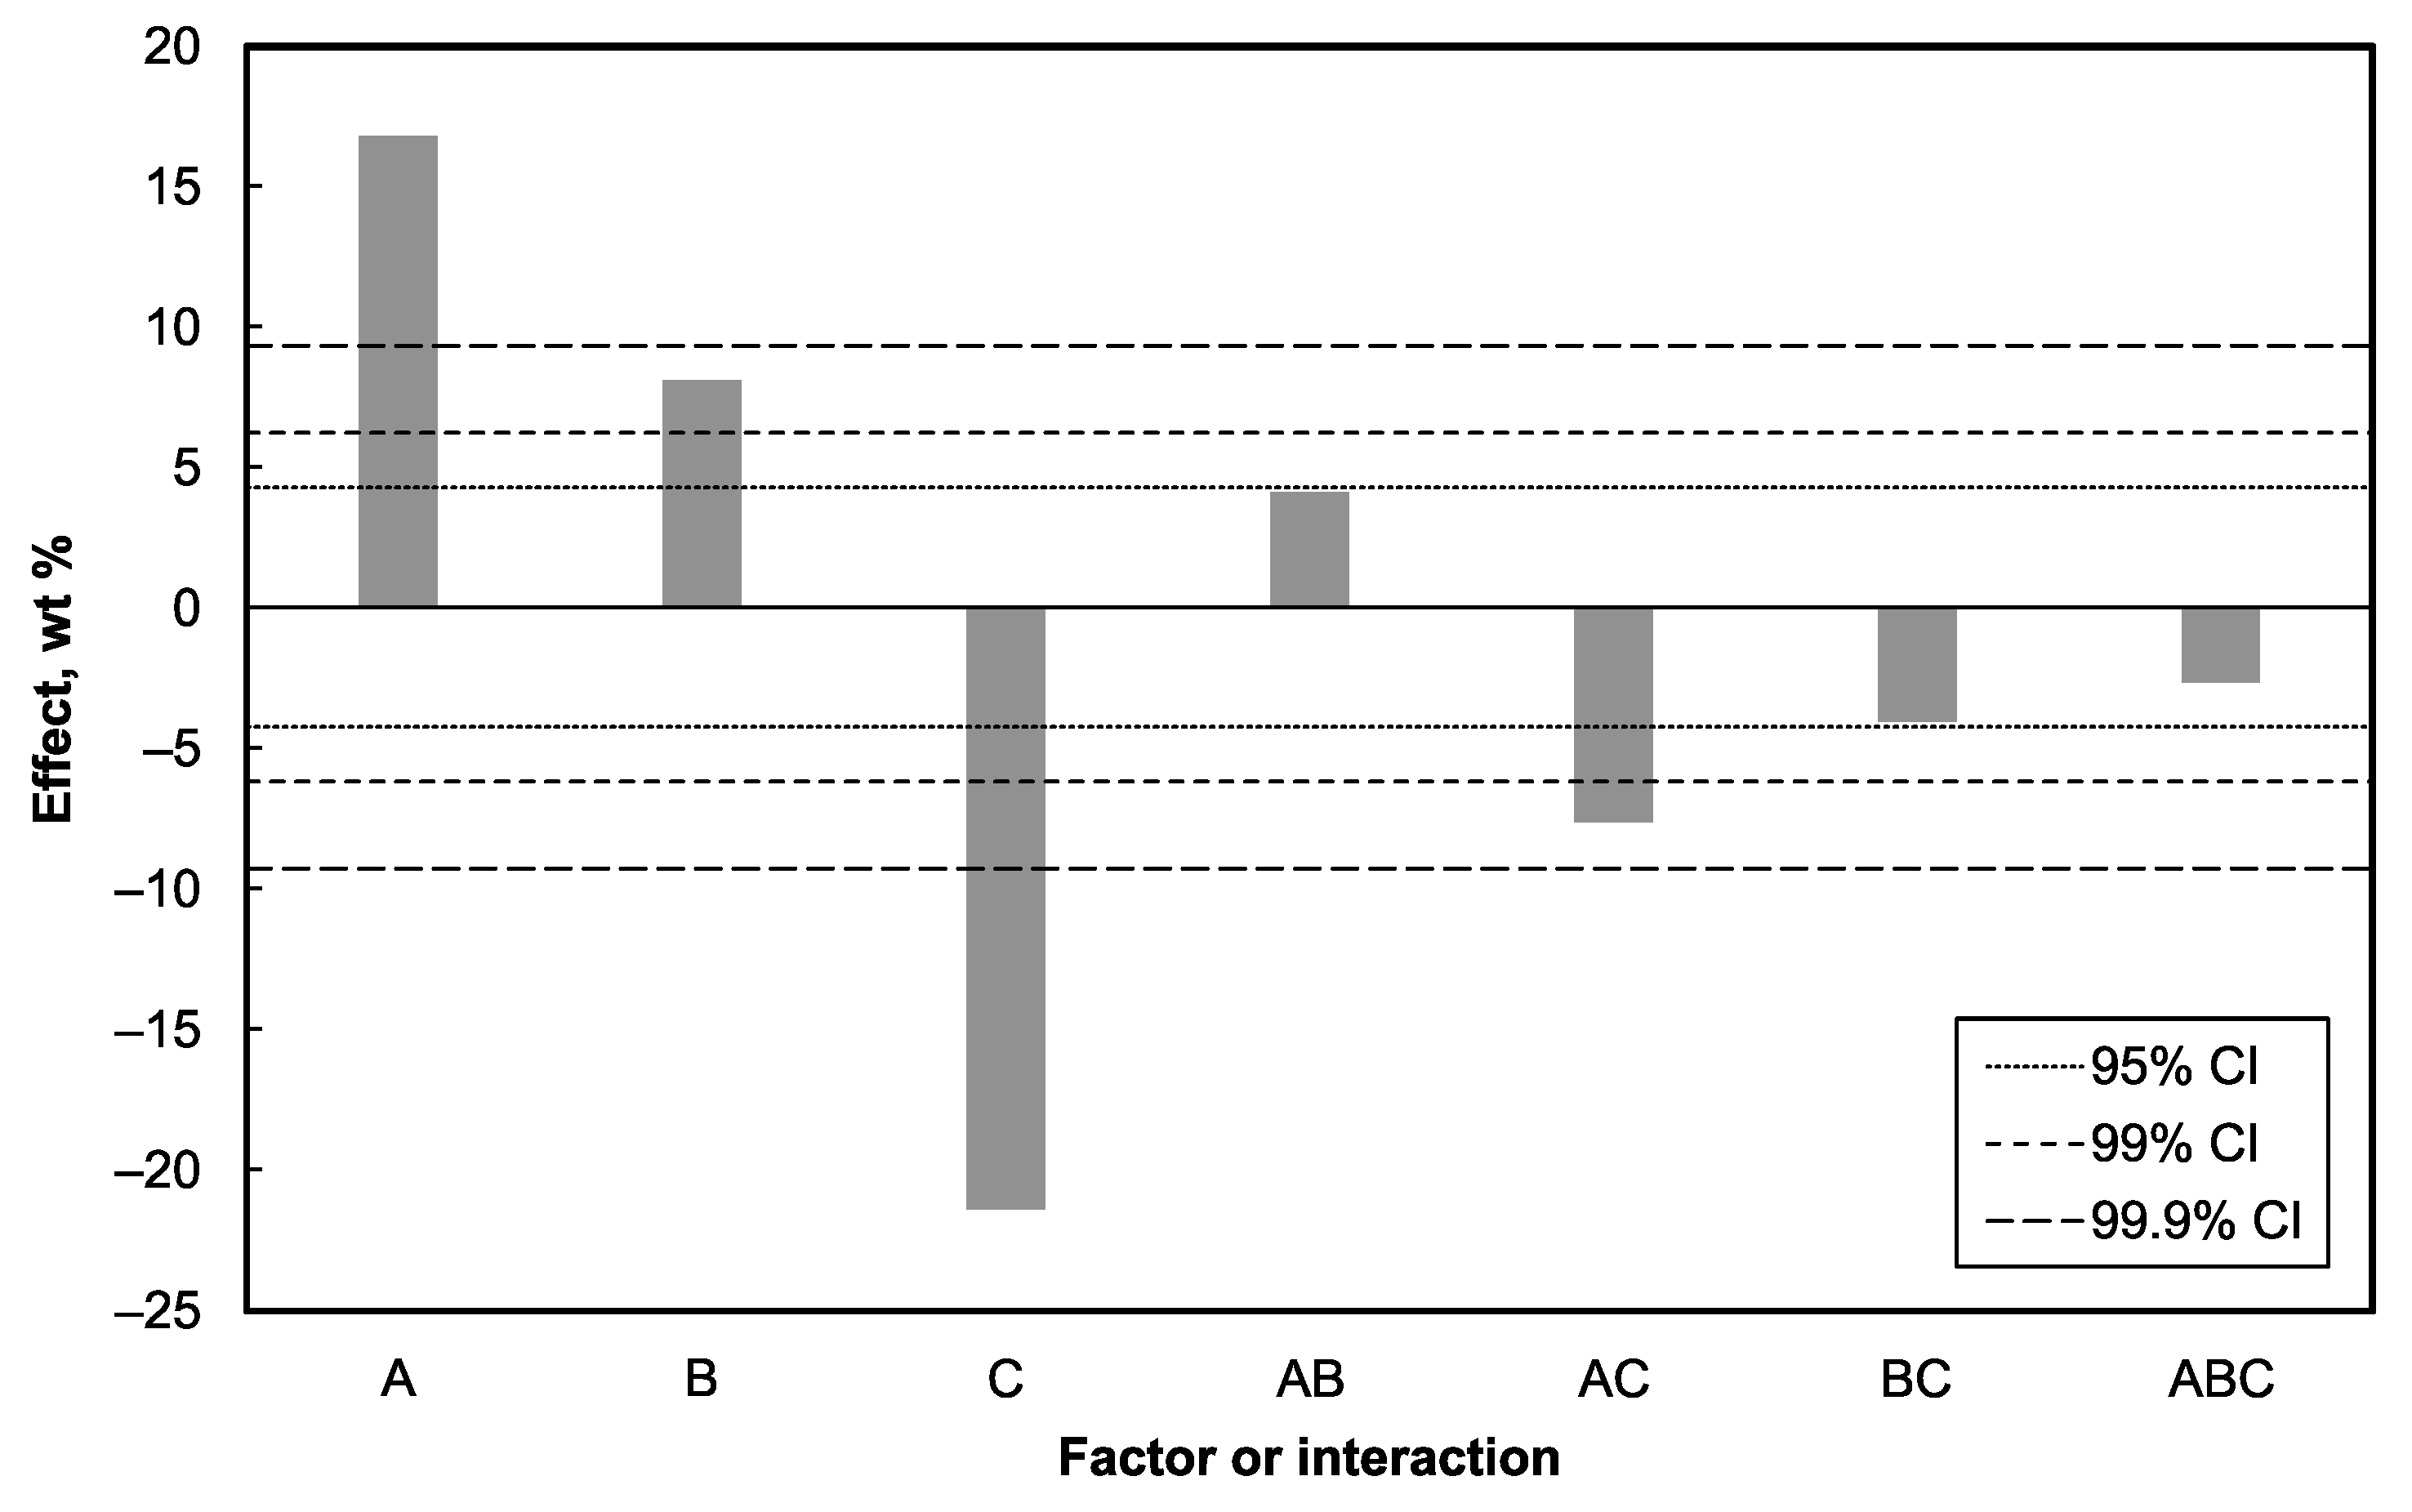
The widths of the overall 95%, 99%, and 99.9% confidence intervals obtained using the data in Table 6 and other relevant values were ±4.26 wt %, ±6.20 wt %, and ±9.31 wt %, respectively. These are plotted in Figure 8 against the corresponding factor effects from Table 7. It is obvious that factors A and C are statistically highly significant, factor B and interaction AC are statistically significant, and the remaining interactions are statistically insignificant.
The conclusions of the drying experiments are that the slice thickness of prepared fresh pineapples should not exceed 8 mm. The available daily sunshine duration limited by the climatic conditions should be utilized as much as possible. The solar drying process is affected by the variation of the annual solar radiation intensity to a lesser degree and, therefore, the solar thermal dryer can be used in the respective locality over the entire year. Performance of the drying process, however, also depends on the local climatic conditions, particularly on the temperature and humidity of the ambient air. In the case of Togo, the performance was verified as shown in Table 8. Table 9 then lists for Togo the air enthalpies, hin, from Equation (6), temperatures, tin, from Equation (4), and absolute humidities, xin, from Equation (5) at the solar collector outlet corresponding to the two solar radiation intensity levels (i.e., the constant collector outputs of 270 W and 391 W).
In any case, the best drying result, characterized by a product moisture content of 29.4 wt %, still does not meet the quality of the reference product having the residual moisture content of 13.7 wt %. The solar thermal drying process must, therefore, be extended for a further 10–12 h period or another suitable post-solar drying procedure must be implemented.
3.3. Drying Kinetics
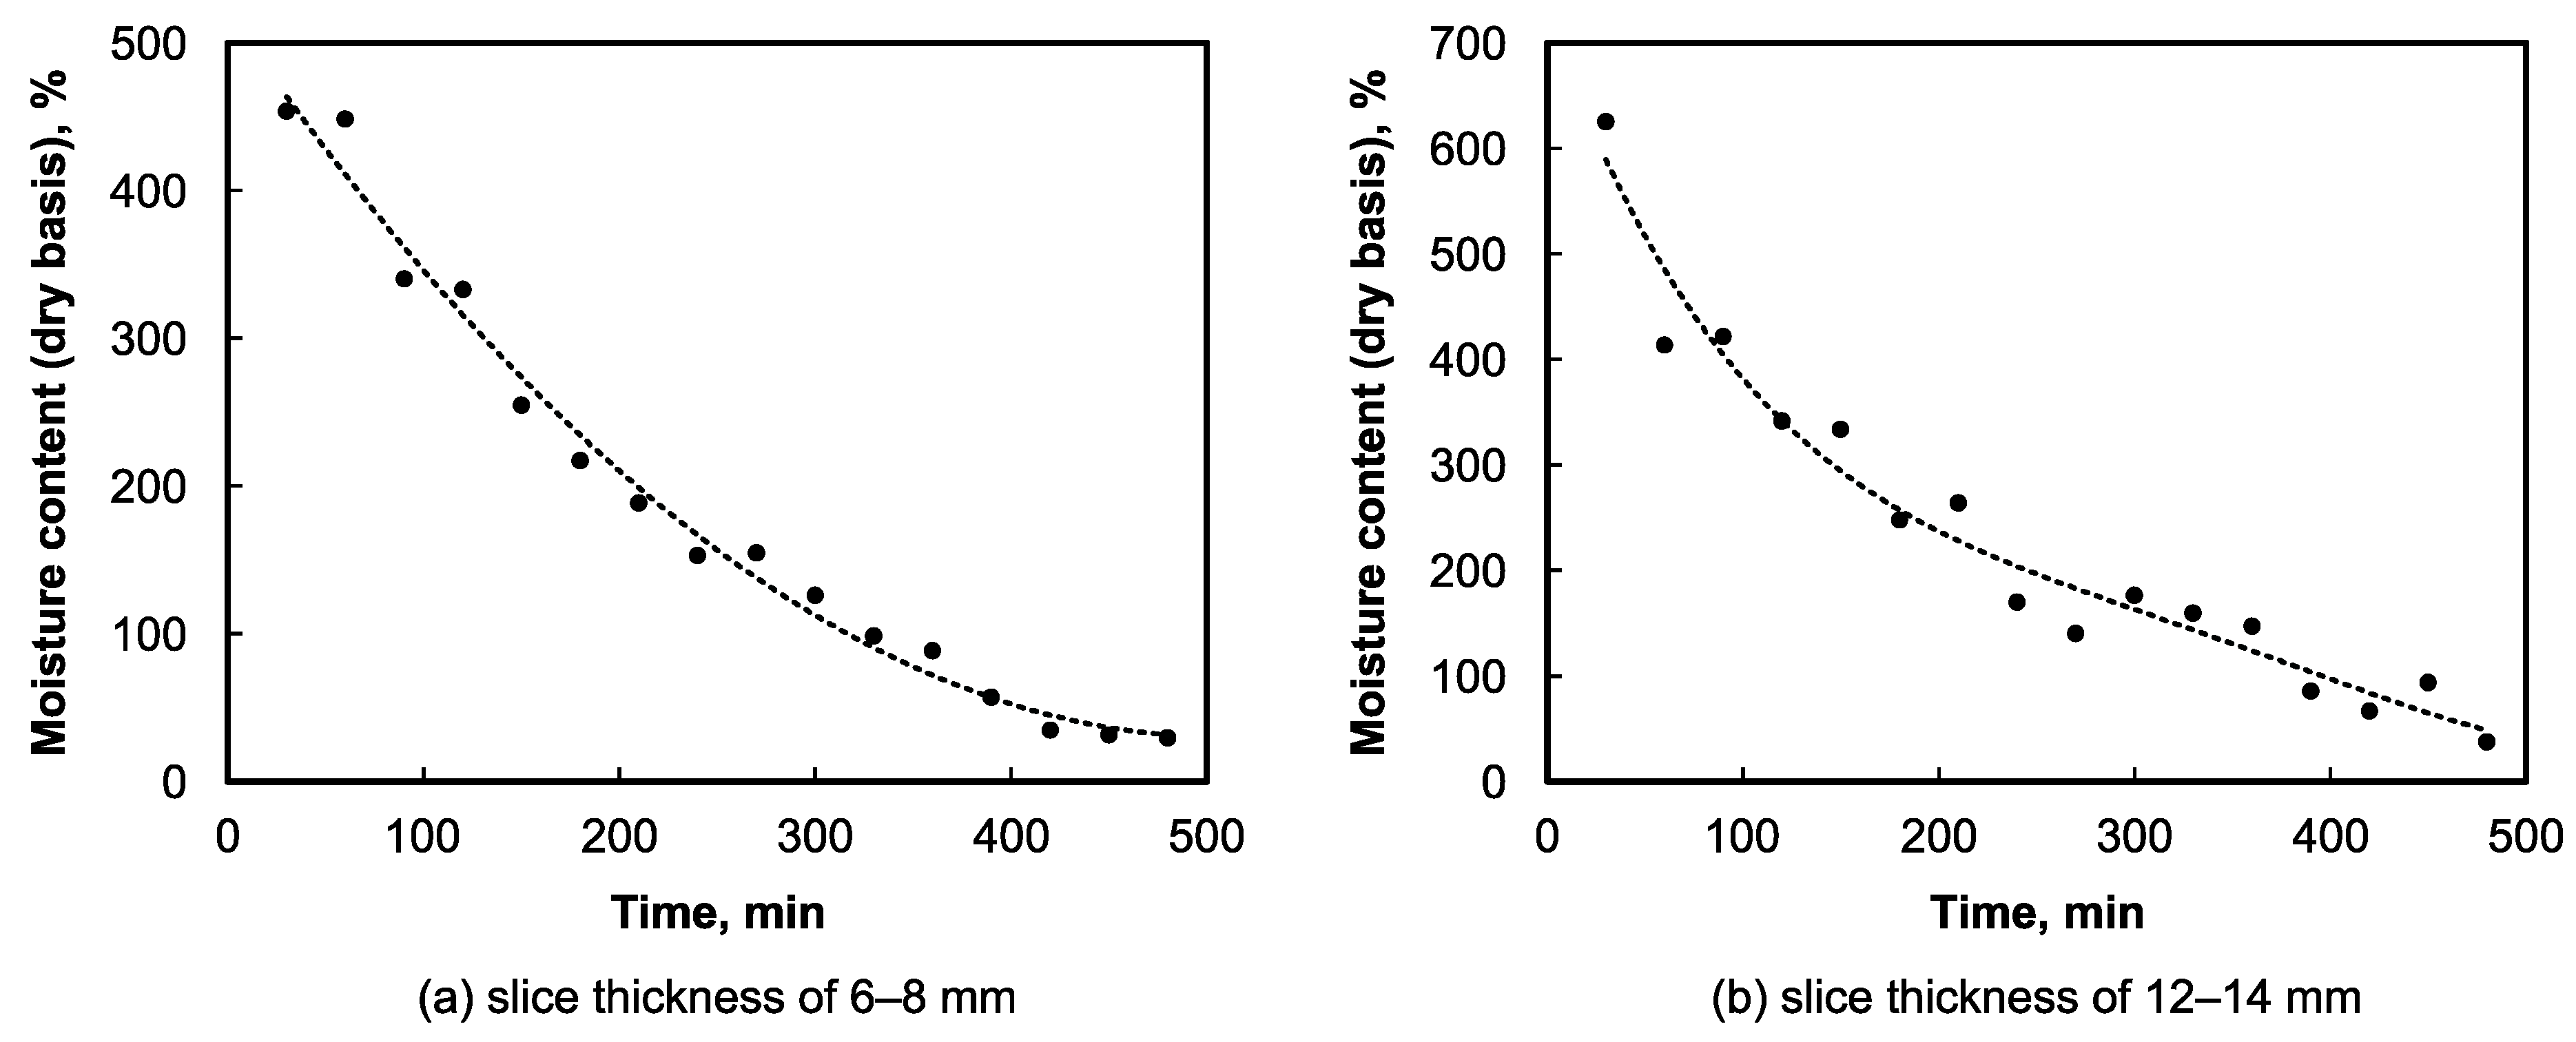
The drying kinetics were determined by measuring the dry basis moisture content, X, according to Equation (2) and varying with time, for both pineapple slice thicknesses of 6–8 mm and 12–14 mm. The total drying time of 480 min was chosen together with the solar radiation intensity of 1100 W/m2. Moisture content was measured every 30 min.
Figure 9 shows the drying kinetics for both slice thicknesses. The drying curve progressions can each be divided into two parts. In the case of the lower slice thickness of 6–8 mm (Figure 9a), the first part is characterized by a high constant drying rate, dX/dτ, and the moisture content decreasing nearly linearly until the critical time τc = 350 min is reached. Then, the drying process transitions from the external convective heat and mass transfer to the second part. where the drying rate is decreasing and is controlled by the internal diffusive mass transfer. For the slice thickness of 12–14 mm (Figure 9b), the drying curve is similar with the critical time being τc = 100 min. In both cases, however, the lowest possible residual moisture content in the dried pineapple is limited by the equilibrium water content in the material at a given temperature characterized by the moisture sorption isotherm [64].
3.4. Consumption of Fossil Fuels in the Post-Solar Drying Procedure
As stated in Section 2.4, for a typical pineapple processing rate of approximately 900 kg/d and conventional drying time of 20 h, the butane consumption is around 49.5 kg/d. Should the pineapple fruit be pre-dried using the solar dryer to the moisture content of 29.4 wt %, then the necessary post-solar drying time to reach the target moisture content of 13.7 wt % would be approximately 6.7 h. This translates to the butane consumption of 16.6 kg and, consequently, significant daily savings of 32.9 kg of butane, or 66%.
3.5. Modification of the Solar Collector Design
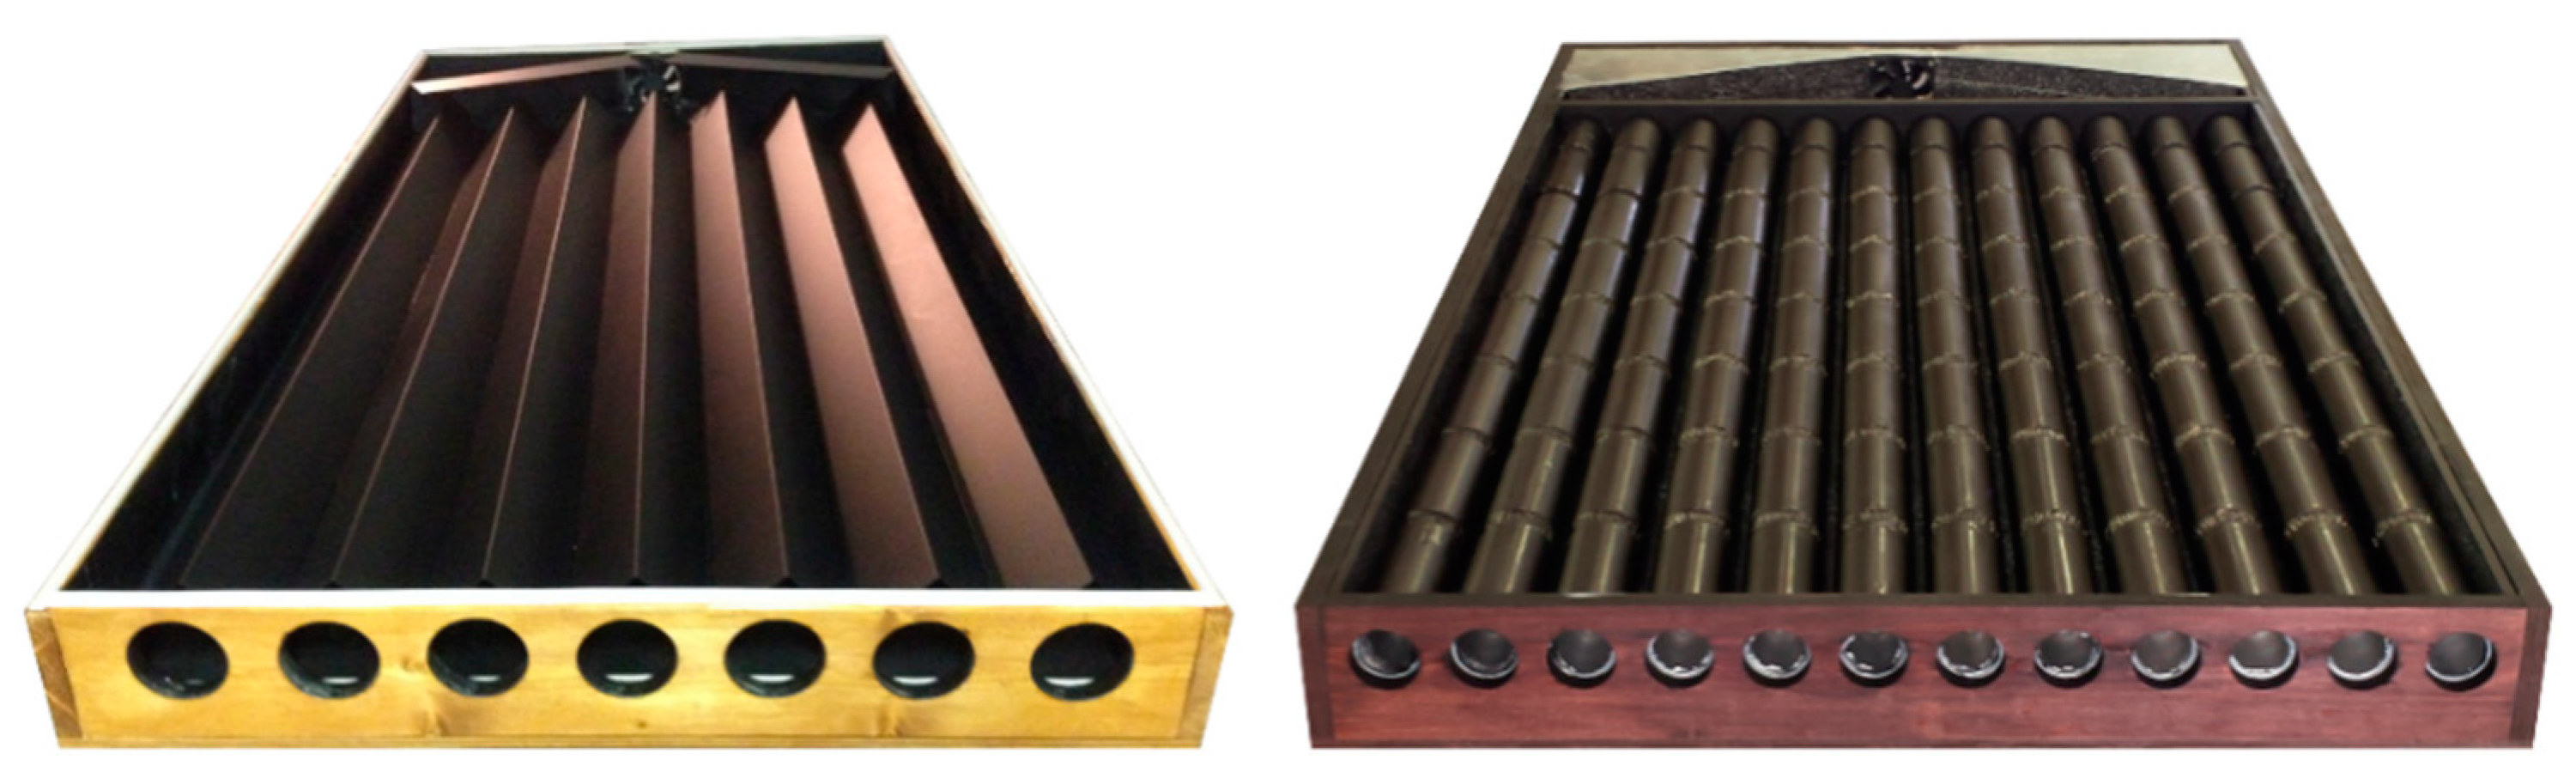
As can be seen from Table 9, nearly the same outlet temperatures of drying air are reached with both solar radiation intensities. However, higher absolute air humidity in Togo requires a higher air flow rate. The original solar thermal collector was therefore modified [65]. This entailed changes to the absorber and the thermal insulation to ensure a higher air temperature at the solar collector outlet as well as increased overall efficiency of the solar collector. The modified absorber was built from empty aluminum beverage cans with a commercial black acrylic varnish being applied (Figure 10). Mineral wool insulation (thermal conductivity: 0.040 W/(m K)) was used instead of expanded polystyrene due to higher air temperatures. The bottom insulation panel of the collector was twice as thick than before (40 mm) and the sides contained 10 mm thick insulation layers. In addition, the axial fan was equipped with a control system to regulate the outlet air temperature. The additional cost of all the modifications made amounted to 120 EUR.
The modified solar thermal collector was tested under the same conditions as mentioned in Section 3.1. With the solar radiation intensity of 1100 W/m2, the resulting air temperature at the collector outlet was markedly higher (83.4 °C instead of the original 56.8 °C). The overall performance and efficiency of the modified solar thermal collector were also improved. The corresponding main results are summarized in Table 10.
4. Conclusions
This study investigated the feasibility of an industrial-scale application of indirect solar thermal drying of pineapples as part of a Togo-specific pineapple processing circular economy strategy, and the main factors affecting the respective drying process. Drying time and pineapple slice thickness proved to be significant, whereas the solar radiation intensity was found to affect the drying process to a lesser extent. As part of the experiments, drying kinetics were also determined for both slice thicknesses of 6–8 mm and 12–14 mm. The corresponding drying curves were characterized by two parts with different drying rates, which were delimited by the critical times of 350 min and 100 min, respectively.
Considering the best obtained residual moisture content in the dried pineapple fruit of 29.4 wt % and that of the reference product (13.7 wt %), the performance of the solar dryer alone was deemed insufficient. In order to meet the required product quality, either the solar thermal drying process had to be extended for a further 10–12 h period (which may not be feasible with respect to the local climatic conditions) or another post-solar drying procedure had to be added. Nevertheless, solar pre-drying of the pineapple fruit followed by a conventional drying process resulted in significant fossil fuel savings of around 66%. This lays the groundwork for the successful implementation of the proposed circular economy strategy.
A modification of the solar thermal collector to increase its efficiency was also briefly discussed. The improved design of the absorber, changes to the thermal insulation, and the addition of a fan control system resulted in a considerable increase in the drying air temperature at the collector outlet (83.4 °C instead of the original 56.8 °C).
Ultimately, the combination of the solar thermal drying process with post-solar drying based on the combustion of biogas produced from agricultural wastes leads to improved environmental sustainability and also supports the circular economy in the agricultural sector. The proposed strategy, therefore, could help farmers in developing countries to meet the growing demand for the sustainable processing of tropical fruit or other agricultural products.
Author Contributions
Conceptualization, M.R., Y.O.A., and Z.J.; methodology, M.R.; investigation, L.D. and M.W.; resources, M.R.; writing—original draft preparation, L.D., M.R., and M.W.; writing—review and editing, V.T. and Z.J.; visualization, V.T.
Funding
This research was funded by the Czech Ministry of Education, Youth and Sports/EU Operational Programme Research, Development and Education, Grant No. CZ.02.1.01/0.0/0.0/16_026/0008413, “Strategic partnership for environmental technologies and energy production”, and by the Augsburg University of Applied Sciences.
Conflicts of Interest
The authors declare no conflict of interest.
Nomenclature
| Roman Symbols: | |
| A | surface area, m2 |
| a | constant in the collector efficiency correlation, – |
| cp | specific heat capacity, kJ/(kg K) |
| E | solar radiation intensity, W/m2 |
| h | specific enthalpy, kJ/kg |
| k | number of controllable input factors, – |
| L | specific heat of vaporization, kJ/kg |
| m | mass, kg |
| mass flow rate, kg/h | |
| n | number of experiments, – |
| p | air pressure, Pa |
| ps | saturation air pressure, Pa |
| heat flux, energy consumption, W | |
| energy losses from the solar thermal collector, W | |
| R | specific gas constant, kJ/(mol K) |
| t | temperature, K |
| W | moisture content on total material basis, kg water/kg total matter, % |
| X | moisture content on dry matter basis, kg water/kg dry matter, % |
| x | absolute air humidity, kg water/kg dry air, – |
| mean of the experimental results | |
| Greek Symbols: | |
| moisture removed from pineapples, kg/h | |
| τ | time, min |
| τc | critical time, min |
| η0 | optical efficiency of the solar collector, – |
| ηC | overall efficiency of the solar collector, – |
| φ | relative air humidity, – |
| Subscripts: | |
| A | dry air |
| air | drying air |
| amb | ambient (at 25 °C, 30 wt % rel. humidity, 1.012 bar), kJ/kg |
| C | in/of the solar thermal collector |
| D | in the drying chamber, of the drying process |
| DM | dry matter |
| i | test number |
| in | at drying chamber inlet |
| out | at drying chamber outlet |
| V | water vapor |
| W | water |
References
- Lobo, M.G.; Paull, R.E. (Eds.) Handbook of Pineapple Technology: Production, Postharvest Science, Processing and Nutrition; John Wiley & Sons: Hoboken, NJ, USA, 2017. [Google Scholar]
- FAOSTAT: Crops. Available online: http://www.fao.org/faostat/en/#data/QC (accessed on 25 June 2019).
- Azouma, Y.O.; Jegla, Z.; Reppich, M.; Turek, V.; Weiß, M. Using agricultural waste for biogas production as a sustainable energy supply for developing countries. Chem. Eng. Trans. 2018, 70, 445–450. [Google Scholar] [CrossRef]
- Roda, A.; De Faveri, D.M.; Giacosa, S.; Dordoni, R.; Lambri, M. Effect of pre-treatments on the saccharification of pineapple waste as a potential source for vinegar production. J. Clean. Prod. 2016, 112, 4477–4484. [Google Scholar] [CrossRef]
- Kudra, T. Energy aspects in drying. Dry. Technol. 2004, 22, 917–932. [Google Scholar] [CrossRef]
- Staudt, P.B.; Kechinski, C.P.; Tessaro, I.C.; Marczak, L.D.F.; Soares, R.D.; Cardozo, N.S.M. A new method for predicting sorption isotherms at different temperatures using the BET model. J. Food Eng. 2013, 114, 139–145. [Google Scholar] [CrossRef]
- Kröll, K.; Kast, W. (Eds.) Drying Technology, Vol. 3: Drying and Dryers in Production; Springer: Berlin, Germany, 1989. (In German) [Google Scholar]
- Lamidi, R.O.; Jiang, L.; Pathare, P.B.; Wang, Y.D.; Roskilly, A.P. Recent advances in sustainable drying of agricultural produce: A review. Appl. Energy 2019, 233, 367–385. [Google Scholar] [CrossRef]
- Li, K.; Zhang, M.; Mujumdar, A.S.; Chitrakar, B. Recent developments in physical field-based drying techniques for fruits and vegetables. Dry. Technol. 2019. [Google Scholar] [CrossRef]
- Ndukwu, M.C.; Bennamoun, L.; Abam, F.I. Experience of solar drying in Africa: Presentation of designs, operations, and models. Food Eng. Rev. 2018, 10, 211–244. [Google Scholar] [CrossRef]
- Boroze, T.; Desmorieux, H.; Méot, J.-M.; Marouzé, C.; Azouma, Y.; Napo, K. Inventory and comparative characteristics of dryers used in the sub-Saharan zone: Criteria influencing dryer choice. Renew. Sustain. Energy Rev. 2014, 40, 1240–1259. [Google Scholar] [CrossRef]
- Mat Desa, W.N.; Mohammad, M.; Fudholi, A. Review of drying technology of Figure. Trends Food Sci. Technol. 2019, 88, 93–103. [Google Scholar] [CrossRef]
- Cheng, W.; Sørensen, K.M.; Mongi, R.J.; Ndabikunze, B.K.; Chove, B.E.; Sun, D.-W.; Engelsen, S.B. A comparative study of mango solar drying methods by visible and near-infrared spectroscopy coupled with ANOVA-simultaneous component analysis (ASCA). LWT 2019, 112, 108214. [Google Scholar] [CrossRef]
- Khattak, M.K.; Hanif, M.; Khan, M.; Ramzan, M.; Abdurab. Comparison of drying process and preservatives on drying kinetics, texture and antioxidants retention in mulberry fruits. J. Anim. Plant Sci. 2019, 29, 803–808. [Google Scholar]
- Ayua, E.; Mugalavai, V.; Simon, J.; Weller, S.; Obura, P.; Nyabinda, N. Comparison of a mixed modes solar dryer to a direct mode solar dryer for African indigenous vegetable and chili processing. J. Food Process. Preserv. 2017, 41, e13216. [Google Scholar] [CrossRef]
- Yang, X.-H.; Deng, L.-Z.; Mujumdar, A.S.; Xiao, H.-W.; Zhang, Q.; Kan, Z. Evolution and modeling of colour changes of red pepper (Capsicum annuum L.) during hot air drying. J. Food Eng. 2018, 231, 101–108. [Google Scholar] [CrossRef]
- Nguyen, T.K.; Mondor, M.; Ratti, C. Shrinkage of cellular food during air drying. J. Food Eng. 2018, 230, 8–17. [Google Scholar] [CrossRef]
- Süfer, Ö.; Palazoğlu, T.K. A study on hot-air drying of pomegranate. J. Therm. Anal. Calorim. 2019. [Google Scholar] [CrossRef]
- Talens, C.; Castro-Giraldez, M.; Fito, P.J. Effect of microwave power coupled with hot air drying on sorption isotherms and microstructure of orange peel. Food Bioprocess Technol. 2018, 11, 723–734. [Google Scholar] [CrossRef]
- Sarobol, M.; Sarobol, P.; Teeta, S.; Pharanat, W. Investigation effective moisture diffusivity and activation Eenergy on convective hot air drying assisted extraction of dragon fruit slices. J. Phys. Conf. Ser. 2018, 1144, 012062. [Google Scholar] [CrossRef]
- Li, X.; Wu, X.; Bi, J.; Liu, X.; Li, X.; Guo, C. Polyphenols accumulation effects on surface color variation in apple slices hot air drying process. LWT 2019, 108, 421–428. [Google Scholar] [CrossRef]
- Elmizadeh, A.; Shahedi, M.; Hamdami, N. Quality assessment of electrohydrodynamic and hot-air drying of quince slice. Ind. Crops Prod. 2018, 116, 35–40. [Google Scholar] [CrossRef]
- Zhu, A. The convective hot air drying of Lactuca sativa slices. Int. J. Green Energy 2018, 15, 201–207. [Google Scholar] [CrossRef]
- Moscetti, R.; Raponi, F.; Ferri, S.; Colantoni, A.; Monarca, D.; Massantini, R. Real-time monitoring of organic apple (var. Gala) during hot-air drying using near-infrared spectroscopy. J. Food Eng. 2018, 222, 139–150. [Google Scholar] [CrossRef]
- Önal, B.; Adiletta, G.; Crescitelli, A.; Di Matteo, M.; Russo, P. Optimization of hot air drying temperature combined with pre-treatment to improve physico-chemical and nutritional quality of ‘Annurca’ apple. Food Bioprod. Process. 2019, 115, 87–99. [Google Scholar] [CrossRef]
- Červenka, L.; Červenková, Z.; Velichová, H. Is air-drying of plant-based food at low temperature really favorable? A meta-analytical approach to ascorbic acid, total phenolic, and total flavonoid contents. Food Rev. Int. 2018, 34, 434–446. [Google Scholar] [CrossRef]
- Zielinska, M.; Ropelewska, E.; Zapotoczny, P. Effects of freezing and hot air drying on the physical, morphological and thermal properties of cranberries (Vaccinium macrocarpon). Food Bioprod. Process. 2018, 110, 40–49. [Google Scholar] [CrossRef]
- Tao, Y.; Han, M.; Gao, X.; Han, Y.; Show, P.-L.; Liu, C.; Ye, X.; Xie, G. Applications of water blanching, surface contacting ultrasound-assisted air drying, and their combination for dehydration of white cabbage: Drying mechanism, bioactive profile, color and rehydration property. Ultrason. Sonochem. 2019, 53, 192–201. [Google Scholar] [CrossRef] [PubMed]
- Zhou, L.; Wang, X.; Bi, J.; Liu, X.; Yi, J.; Wu, X. Effect of different moisture equilibration process on the quality of apple chips dried by instant controlled pressure drop (dic)-assisted hot air drying. J. Food Process. Preserv. 2018, 42, e13316. [Google Scholar] [CrossRef]
- Kessy, R.F.; Ochieng, J.; Afari-Sefa, V.; Chagomoka, T.; Nenguwo, N. Solar-dried traditional African vegetables in rural Tanzania: Awareness, perceptions, and factors affecting purchase decisions. Econ. Bot. 2018, 72, 367–379. [Google Scholar] [CrossRef]
- Fudholi, A.; Ridwan, A.; Yendra, R.; Desvina, A.P.; Hartono, H.; Majahar, M.K.; Suyono, T.; Sopian, K. Solar drying technology in Indonesia: An overview. Int. J. Power Electron. Drive Syst. 2018, 9, 1804–1813. [Google Scholar] [CrossRef]
- Hatami, S.; Sadeghi, M.; Mireei, S.A. Indirect forced solar drying of banana slices: Phenomenological explanation of non-isotropic shrinkage and color changes kinetics. Int. J. Green Energy 2017, 14, 1277–1283. [Google Scholar] [CrossRef]
- Seerangurayar, T.; Al-Ismaili, A.M.; Janitha Jeewantha, L.H.; Al-Nabhani, A. Experimental investigation of shrinkage and microstructural properties of date fruits at three solar drying methods. Sol. Energy 2019, 180, 445–455. [Google Scholar] [CrossRef]
- Veeramanipriya, E. Drying kinetics of forced convection solar dryer for fruit drying. Int. J. Recent Technol. Eng. 2019, 7, 323–327. [Google Scholar]
- Ayyappan, S. Performance and CO2 mitigation analysis of a solar greenhouse dryer for coconut drying. Energy Environ. 2018, 29, 1482–1494. [Google Scholar] [CrossRef]
- Ouaabou, R.; Nabil, B.; Hidar, N.; Lahnine, L.; Idlimam, A.; Lamharrar, A.; Hanine, H.; Mahrouz, M. Valorization of solar drying process in the production of dried Moroccan sweet cherries. Sol. Energy 2018, 172, 158–164. [Google Scholar] [CrossRef]
- Hamdi, I.; Kooli, S.; Elkhadraoui, A.; Azaizia, Z.; Abdelhamid, F.; Guizani, A. Experimental study and numerical modeling for drying grapes under solar greenhouse. Renew. Energy 2018, 127, 936–946. [Google Scholar] [CrossRef]
- López-Vidaña, E.C.; Figueroa, I.P.; Marcos, E.G.A.; Navarro-Ocaña, A.; Hernández-Vázquez, L.; Santiago-Urbina, J.A. Solar drying kinetics and bioactive compounds of blackberry (Rubus fruticosus). J. Food Process Eng. 2019, 42, e13018. [Google Scholar] [CrossRef]
- Koua, B.K.; Koffi, P.M.E.; Gbaha, P. Evolution of shrinkage, real density, porosity, heat and mass transfer coefficients during indirect solar drying of cocoa beans. J. Saudi Soc. Agric. Sci. 2019, 18, 72–82. [Google Scholar] [CrossRef]
- Fterich, M.; Chouikhi, H.; Bentaher, H.; Maalej, A. Experimental parametric study of a mixed-mode forced convection solar dryer equipped with a PV/T air collector. Sol. Energy 2018, 171, 751–760. [Google Scholar] [CrossRef]
- Sarmah, T.; Dhiman, S.K. Design and analysis of solar cabinet dryer for drying of potatoes. In Advances in Engineering Design: Select Proceedings of FLAME 2018; Prasad, A., Gupta, S.S., Tyagi, R.K., Eds.; Springer: Singapore, 2019; pp. 105–115. [Google Scholar] [CrossRef]
- Kondareddy, R.; Sivakumaran, N.; Nayak, P.K. Drying kinetics of black turmeric (Curcuma caesia) with optimal controller assisted low cost solar dryer. Food Res. 2019, 3, 373–379. [Google Scholar] [CrossRef]
- Shamekhi-Amiri, S.; Gorji, T.B.; Gorji-Bandpy, M.; Jahanshahi, M. Drying behaviour of lemon balm leaves in an indirect double-pass packed bed forced convection solar dryer system. Case Stud. Therm. Eng. 2018, 12, 677–686. [Google Scholar] [CrossRef]
- Bhardwaj, A.K.; Kumar, R.; Chauhan, R. Experimental investigation of the performance of a novel solar dryer for drying medicinal plants in Western Himalayan region. Sol. Energy 2019, 177, 395–407. [Google Scholar] [CrossRef]
- Poonia, S.; Singh, A.K.; Jain, D. Design development and performance evaluation of photovoltaic/thermal (PV/T) hybrid solar dryer for drying of ber (Zizyphus mauritiana) fruit. Cogent Eng. 2018, 5, 1507084. [Google Scholar] [CrossRef]
- Poblete, R.; Cortes, E.; Macchiavello, J.; Bakit, J. Factors influencing solar drying performance of the red algae Gracilaria chilensis. Renew. Energy 2018, 126, 978–986. [Google Scholar] [CrossRef]
- Sreekumar, A.; Rajarajeswari, K. Accelerated food processing through solar drying system. IOP Conf. Ser. Mater. Sci. Eng. 2018, 377, 012218. [Google Scholar] [CrossRef] [Green Version]
- Macías-Ganchozo, E.R.; Bello-Moreira, I.P.; Trueba-Macías, S.L.; Anchundia-Muentes, X.E.; Anchundia-Muentes, M.E.; Bravo-Moreira, C.D. Design, development and performance of solar dryer for pineapple (Ananas comosus (L.) Merr.), mamey (Mammea americana L.) and banana (Musa paradisiaca L.) fruit drying. Acta Agron. 2018, 67, 30–38. [Google Scholar] [CrossRef]
- Wanyama, J.; Galyaki, C.; Muyonga, J.; Kiggundu, N.; Banadda, N. Design and CFD simulation of a parabolic solar fruit dryer. In Proceedings of the 10th International Conference on Simulation and Modelling in the Food and Bio-Industry 2018, FOODSIM 2018, Ghent, Belgium, 8–12 April 2018; EUROSIS-ETI: Ostend, Belgium, 2018; pp. 301–303. [Google Scholar]
- Tanongkankit, Y.; Narkprasom, K.; Narkprasom, N. Empirical modeling on hot air drying of fresh and pre-treated pineapples. In Proceedings of the 3rd International Conference on Chemical and Food Engineering, Tokyo, Japan, 8–9 April 2016; EDP Sciences: Les Ulis, France, 2016; p. 02007. [Google Scholar] [CrossRef]
- Silva, K.S.; Garcia, C.C.; Amado, L.R.; Mauro, M.A. Effects of edible coatings on convective drying and characteristics of the dried pineapple. Food Bioprocess Technol. 2015, 8, 1465–1475. [Google Scholar] [CrossRef]
- Talbot, P.; Lhote, M.; Heilporn, C.; Schubert, A.; Willaert, F.-X.; Haut, B. Ventilated tunnel solar dryers for small-scale farmers communities: Theoretical and practical aspects. Dry. Technol. 2016, 34, 1162–1174. [Google Scholar] [CrossRef]
- Srisittipokakun, N.; Kirdsiri, K. Drying pineapple using a mix mode solar dryer. Adv. Mater. Res. 2014, 979, 11–15. [Google Scholar] [CrossRef]
- Gudiño-Ayala, D.; Calderón-Topete, Á. Pineapple drying using a new solar hybrid dryer. Energy Procedia 2014, 57, 1642–1650. [Google Scholar] [CrossRef]
- Moumegni-Kameni, C. Development of a Concept of Utilization of Renewable Energy Sources in Developing Countries. Bachelor’s Thesis, Augsburg University of Applied Sciences, Augsburg, Germany, 2015. (In German). [Google Scholar]
- Lamidi, R.O.; Jiang, L.; Wang, Y.D.; Pathare, P.B.; Roskilly, A.P. Techno-economic analysis of a biogas driven poly-generation system for postharvest loss reduction in a Sub-Saharan African rural community. Energy Convers. Manag. 2019, 196, 591–604. [Google Scholar] [CrossRef]
- Drigalski, L. Development and Practical Application of a Model of Pineapple Solar Dryer Taking into Account the Most Important Parameters and Economic Factors. Master’s Thesis, Augsburg University of Applied Sciences, Augsburg, Germany, 2016. (In German). [Google Scholar]
- DIN EN 322. Wood-Based Panels; Determination of Moisture Content; Beuth Verlag: Berlin, Germany, 1993. (In German) [Google Scholar]
- DIN EN 15414-3. Solid Recovered Fuels—Determination of Moisture Content Using the Oven Dry Method—Part 3: Moisture in General Analysis Sample; Beuth Verlag: Berlin, Germany, 2011. (In German) [Google Scholar]
- Durakovic, B. Design of experiments application, concepts, examples: State of the art. PEN Period. Eng. Nat. Sci. 2017, 5, 421–439. [Google Scholar] [CrossRef]
- Meteotest, A.G. Meteonorm 7 User Guide; Meteotest AG: Bern, Switzerland, 2016. [Google Scholar]
- Kleppmann, W. Design of Experiments. Optimization of Products and Processes; Hanser: München, Germany, 2013. (In German) [Google Scholar]
- Stieglitz, R.; Heinzel, V. Thermal Solar Energy. Basics, Technology, Applications; Springer: Berlin, Germany, 2012. (In German) [Google Scholar]
- Hossain, M.D.; Bala, B.K.; Hossain, M.A.; Mondol, M.R.A. Sorption isotherms and heat of sorption of pineapple. J. Food Eng. 2001, 48, 103–107. [Google Scholar] [CrossRef]
- Heimbrock, M. Optimization of an Air Collector for the Solar Drying of Tropical Fruits. Bachelor’s Thesis, Augsburg University of Applied Sciences, Augsburg, Germany, 2016. (In German). [Google Scholar]
Figure 1.
The circular economy principle presented for the example of pineapple processing in Togo.

Figure 2.
Main parts of the solar dryer: (a) the experimental solar collector (without collector cover) and (b) the drying chamber.
Figure 2.
Main parts of the solar dryer: (a) the experimental solar collector (without collector cover) and (b) the drying chamber.

Figure 3.
Indoor test facility with the solar collector, drying chamber, and relevant measuring points: (1) solar collector inlet, (2) solar collector outlet, and (3) drying chamber outlet.
Figure 3.
Indoor test facility with the solar collector, drying chamber, and relevant measuring points: (1) solar collector inlet, (2) solar collector outlet, and (3) drying chamber outlet.

Figure 4.
Preparation of samples: (1) fresh pineapples, (2) cutting of leaf crown, (3) cutting by means of rotational motion, (4) removing of the flesh, and (5) final spiral of flesh without core.
Figure 4.
Preparation of samples: (1) fresh pineapples, (2) cutting of leaf crown, (3) cutting by means of rotational motion, (4) removing of the flesh, and (5) final spiral of flesh without core.

Figure 5.
Typical dependence of air temperatures at the inlet and outlet of the solar thermal collector, and the corresponding air relative humidities, on drying time at the solar radiation intensity of 1100 W/m2.
Figure 5.
Typical dependence of air temperatures at the inlet and outlet of the solar thermal collector, and the corresponding air relative humidities, on drying time at the solar radiation intensity of 1100 W/m2.

Figure 6.
Visual comparison of the dried pineapple slices obtained using (a) the best combination of input factors and (b) the worst combination of input factors.
Figure 6.
Visual comparison of the dried pineapple slices obtained using (a) the best combination of input factors and (b) the worst combination of input factors.

Figure 7.
Effects of individual input factors, A, B, and C, and their interactions, AB, AC, BC, and ABC.
Figure 7.
Effects of individual input factors, A, B, and C, and their interactions, AB, AC, BC, and ABC.

Figure 8.
The overall 95%, 99%, and 99.9% confidence intervals (CI) plotted against the effects of the individual factors, A, B, and C, and their interactions, AB, AC, BC, and ABC.
Figure 8.
The overall 95%, 99%, and 99.9% confidence intervals (CI) plotted against the effects of the individual factors, A, B, and C, and their interactions, AB, AC, BC, and ABC.

Figure 9.
Drying kinetics of pineapple slices with the thickness of (a) 6–8 mm and (b) 12–14 mm.

Figure 10.
Comparison of the (left) original and (right) improved designs of the solar thermal collector.
Figure 10.
Comparison of the (left) original and (right) improved designs of the solar thermal collector.


Table 1.
Two-level factorial design of controllable input factors and their associated levels.
| Factor | Name | Low Level (−) | High Level (+) |
|---|---|---|---|
| A | Drying time | 270 min | 480 min |
| B | Solar radiation intensity | 650 W/m2 | 1100 W/m2 |
| C | Slice thickness | 6–8 mm | 12–14 mm |
Table 2.
Setting of input factors according to the full factorial design.
| Test Number | Factor A | Factor B | Factor C |
|---|---|---|---|
| 1 | − | − | − |
| 2 | + | − | − |
| 3 | − | + | − |
| 4 | + | + | − |
| 5 | − | − | + |
| 6 | + | − | + |
| 7 | − | + | + |
| 8 | + | + | + |
Table 3.
Design matrix and signs for seven effects in the 23 full factorial design.
| Test Number | Factors | Interactions | |||||
|---|---|---|---|---|---|---|---|
| A | B | C | AB | AC | BC | ABC | |
| 1 | − | − | − | + | + | + | − |
| 2 | + | − | − | − | − | + | + |
| 3 | − | + | − | − | + | − | + |
| 4 | + | + | − | + | − | − | − |
| 5 | − | − | + | + | − | − | + |
| 6 | + | − | + | − | + | − | − |
| 7 | − | + | + | − | − | + | − |
| 8 | + | + | + | + | + | + | + |
Table 4.
Air temperature changes, tin − tamb (K), between the solar collector inlet and outlet.
| E, W/m2 | Test Number | ||||||||
|---|---|---|---|---|---|---|---|---|---|
| 1 | 2 | 3 | 4 | 5 | 6 | 7 | 8 | Mean | |
| 650 | 20.81 | 20.66 | 20.49 | 20.48 | 19.90 | 21.38 | 20.50 | 20.04 | 20.53 |
| 1100 | 29.78 | 28.84 | 29.43 | 29.15 | 29.71 | 29.26 | 30.23 | 28.51 | 29.36 |
Table 5.
Overall performance and efficiency of the solar thermal collector.
| E, W/m2 | ΔhC, kJ/kg | ηC, − | |
|---|---|---|---|
| 650 | 20.90 | 269.58 | 0.298 |
| 1100 | 30.85 | 391.00 | 0.255 |
Table 6.
Residual relative moisture content (wt %) for the eight tests comprising the full factorial design.
Table 6.
Residual relative moisture content (wt %) for the eight tests comprising the full factorial design.
| Test Number | Test Run 1 | Test Run 2 | Mean | Variance | Standard Deviation |
|---|---|---|---|---|---|
| 1 | 63.48 | 68.52 | 66.00 | 12.70 | 3.56 |
| 2 | 49.18 | 47.51 | 48.35 | 1.40 | 1.18 |
| 3 | 66.11 | 55.15 | 60.63 | 60.06 | 7.75 |
| 4 | 26.33 | 32.52 | 29.42 | 19.15 | 4.38 |
| 5 | 78.69 | 78.08 | 78.38 | 0.19 | 0.43 |
| 6 | 69.56 | 71.79 | 70.68 | 2.49 | 1.58 |
| 7 | 74.49 | 77.10 | 75.80 | 3.41 | 1.85 |
| 8 | 67.43 | 62.99 | 65.21 | 9.82 | 3.13 |
Table 7.
Estimates of factor effects (wt %).
| A | B | C | AB | AC | BC | ABC |
|---|---|---|---|---|---|---|
| 16.79 | 8.09 | −21.42 | 4.11 | −7.64 | −4.06 | −2.67 |
Table 8.
Climatic conditions in the laboratory and in Togo (average).
| Parameter | Laboratory | Togo (Average) |
|---|---|---|
| Ambient air temperature | 27 °C | 28 °C |
| Relative humidity | 0.27 | 0.85 |
| Absolute humidity | 5.89 g/kg | 20.43 g/kg |
| Air pressure | 1012 mbar | 1008 mbar |
| Saturation vapor pressure | 35.57 mbar | 37.71 mbar |
| Ambient air enthalpy | 42.03 kJ/kg | 79.48 kJ/kg |
Table 9.
Calculated data for the average climatic conditions in Togo.
| Parameter | E = 650 W/m2 | E = 1100 W/m2 |
|---|---|---|
| Solar collector outlet enthalpy | 99.85 kJ/kg | 109.02 kJ/kg |
| Solar collector outlet temperature | 49.11 °C | 57.86 °C |
| Relative humidity | 0.27 | 0.18 |
| Absolute humidity | 20.43 g/kg | 20.43 g/kg |
| Saturation vapor pressure | 117.43 mbar | 182.02 mbar |
Table 10.
Main technical parameters of the modified solar thermal collector.
| E, W/m2 | tin − tamb, K | tin, °C | ηC, − | |
|---|---|---|---|---|
| 650 | 43.60 | 70.70 | 416.56 | 0.389 |
| 1100 | 54.10 | 83.40 | 884.94 | 0.489 |
© 2019 by the authors. Licensee MDPI, Basel, Switzerland. This article is an open access article distributed under the terms and conditions of the Creative Commons Attribution (CC BY) license (http://creativecommons.org/licenses/by/4.0/).
Share and Cite
MDPI and ACS Style
Azouma, Y.O.; Drigalski, L.; Jegla, Z.; Reppich, M.; Turek, V.; Weiß, M. Indirect Convective Solar Drying Process of Pineapples as Part of Circular Economy Strategy. Energies 2019, 12, 2841. https://doi.org/10.3390/en12152841
AMA Style
Azouma YO, Drigalski L, Jegla Z, Reppich M, Turek V, Weiß M. Indirect Convective Solar Drying Process of Pineapples as Part of Circular Economy Strategy. Energies. 2019; 12(15):2841. https://doi.org/10.3390/en12152841
Chicago/Turabian StyleAzouma, Yaovi Ouézou, Lynn Drigalski, Zdeněk Jegla, Marcus Reppich, Vojtěch Turek, and Maximilian Weiß. 2019. "Indirect Convective Solar Drying Process of Pineapples as Part of Circular Economy Strategy" Energies 12, no. 15: 2841. https://doi.org/10.3390/en12152841
Note that from the first issue of 2016, this journal uses article numbers instead of page numbers. See further details here.