1. Introduction
The European Commission has set the objective of becoming climate-neutral by 2050 in the European Green Deal [
1]. A severe reduction in greenhouse gas emissions is necessary to achieve this goal. Looking at the energy use of individual sectors, industry causes the most CO2eq emissions amounting to almost 30% of the total emissions [
2]. A CO
2-neutral manufacturing industry is, therefore, a key element in our path towards climate neutrality.
To achieve this goal, two parallel strategies are required. On the one hand, the energy supply side needs to become climate neutral. The share of renewable energy sources in global power generation has increased to almost 27% in 2019 [
3] and is growing. This poses new challenges to electricity grid stability since renewable energy generation is less predictable than conventional power plants. On the other hand, the energy demand side needs to be optimised by reducing the overall energy demand and adjusting the duration and quantity of energy usage to the volatile power supply from renewable energy sources, thereby stabilising the grid and optimising utilisation of CO
2-neutral electricity. Various terms are used synonymously in the context of measures that result in an adjustment of electric energy demand. In addition to the term Demand-Side Management (DSM), there are the terms Demand-Side Integration (DSI), Demand Response (DR), load management, and Energy Flexibility (EF). In particular, the industry as the largest consumer of electricity [
3] must be optimised with the implementation of such measures to achieve our climate goals.
Next to fundamental barriers for the implementation of energy efficiency and DR measures, such as economic, social, and technological barriers, the authors in [
4] identify the lack of understanding of the value of DR measures as an important barrier for their implementation. In this context, the variety of terms, as well as the lack of clarity in the different concepts and definitions above, may impose further hurdles for successful and widespread implementation in industry. Hence, clarity in the definitions of the concepts and their characteristics is of high importance. Furthermore, the above-mentioned concepts are mostly defined from the power supply side until now. To provide more clarity for industrial users, the authors argue for the definition of the term Industrial Demand-Side Integration (IDSI), which supersedes the terms DSM and DSI from an industrial perspective and also integrates the terms DR and EF.
The authors in [
5] state that the economic and technical evaluation of DR measures is difficult even for the power supply side, let alone for industrial consumers. To promote the implementation of DR measures in industry, the economic value of the measures must be clearly quantifiable and technical obstacles for the implementation must be made transparent. This poses a challenge, since without successful and broad implementation of measures, data for evaluation is missing, which in turn leads to few new implementations [
5]. The VDI guideline 5207 provides a classification scheme for industrial DR measures which are targeted at identifying feasible measures and their technical requirements [
6]. However, it is missing the important aspect of monetisation options. Other contributions propose solutions for the implementation of IDSI through information technology platforms [
7] or by detailing options for data-driven planning and scheduling [
8] but they do not provide insights about the IDSI measures themselves. In the literature there is also research about the behaviour of energy markets and price development such as [
9]. Others developed approaches for the economic classification of IDSI measures [
10,
11]. However, there is a gap regarding the understanding of the development of IDSI measures and their implementation or economic evaluation. This gap is in a structured understanding of technical requirements, different monetisation options and implementation paths.
To overcome the mentioned barriers and add further understanding for feasible measures, this paper proposes an extended methodology for the classification and characterisation of IDSI measures, which helps to identify technical and organisational requirements as well as possible exploitation paths for the implementation. This methodology is applied to eight relevant use cases in the ETA Research Factory to clarify the added value and provide examples for possible measures and exploitation paths in industry.
In particular, the presented work tries to answer the following research questions:
- 1.
How can the methods and measures aimed at adjusting the load profile of industrial consumers be clearly defined and structured from the demand side perspective?
- 2.
How can the economic value and technical and organisational requirements of these measures be identified by industrial consumers?
In the following, first the definition of the term IDSI is introduced in
Section 2. Secondly, a comprehensive classification scheme for IDSI measures is presented in
Section 3. In the
Section 4, the methodology is presented and finally, the methodology is applied to eight exemplary IDSI measures.
2. From Demand-Side Management to Industrial Demand-Side Integration
The term DSM originated in the US in the 1970s in response to the oil crisis. Prior to that, consumer electricity demand was traditionally assumed to be inelastic in the short term [
12]. Some of the first approaches to break this paradigm were explored by Freeman [
13]. In 1985, Gellings described the concept of DSM from the perspective of an energy supplier with different measures to influence demand level and structure. Gellings considered aspects like planning, implementation, and monitoring of these measures [
14]. Such measures allowed utilities to shape customer load demands to achieve multiple objectives such as reliability improvement, cost reduction, and reducing the need for future power plant construction [
15]. The broad class of load-shaping activities by utilities became known as DSM [
15]. In 1992 the Electric Power Research Institute has defined DSM as follows [
16]: “Demand-Side Management is the planning and implementation of activities by a utility to influence customer use of electricity to produce wanted changes in the utility’s load shape, including patterns and magnitude”. At the heart of a DSM program are activities to influence the timing and magnitude of customer electricity use, which are summarised under the term Load Management [
17]. The traditional objectives of Load Management include peak clipping, valley filling, and load shifting (see
Figure 1) [
17]. Further development in the term DSM was particularly caused by the Californian energy crisis in the early 2000s which was caused by capacity shortfalls [
18]. In this context, the term DR emerged, which focuses both on influencing the demand structure and on the reaction of electricity customers to an incentive signal. In 2006 the U.S. Department of Energy has defined DR as “changes in electric usage by end-use customers from their normal consumption patterns in response to changes in the price of electricity over time, or to incentive payments designed to induce lower electricity use at times of high wholesale market prices or when system reliability is jeopardised” [
19].
Since the concept of DSM originated during the monopolistic period and therefore refers to the conditions of that time, the term DSI emerged as a further development of DSM with explicit reference to the environment of newly structured, liberalised electricity markets in the course of the progressive liberalisation of the electricity market. Thus, the options for changing customer electricity consumption are no longer carried out by the utility company, but are now decision-making options of the individual customers [
20]. DSI refers to “the overall technical area focused on advancing the efficient and effective use of electricity in support of power systems and customer needs. That is, DSI covers all activities focused on advancing end-use efficiency and effective electricity utilisation, including demand response and energy efficiency” [
21].
With the introduction of the term DSI, several terminology shifts have occurred. For example, Load Management is increasingly being replaced by the term DR. However, despite these terminology shifts, the load shaping concepts mentioned above were originally devised within the framework of DSM and thus in vertically integrated utility environments, are still applied in the context of DSI.
To date, the terms DSI and DR have been shaped by the power supply side as a way to adjust the electricity demand of their customers. Recent research however increasingly looks into EF and DR measures from the demand side perspective [
22,
23,
24]. These measures include adjustments in the production plan, utilising inherent or non-inherent energy storage systems, adjusting production parameters, and flexibly controlling the energy supply and production systems [
6]. In the literature, DSM, DSI, DR, and EF are often used synonymously in the industrial context. However, the term DSI better reflects the new approaches to integrate flexibility and controllability into the power system. Especially in the industrial sector, there are many specific requirements and constraints. Therefore, the authors provide the following definition for IDSI:
Definition 1 (Industrial Demand-Side Integration). Industrial Demand-Side Integration refers to the overall technical area focused on advancing the efficient and effective use of electricity by industrial entities. It is defined as the planning and implementation of activities by an industrial entity to influence the use of electricity to achieve wanted changes in the load shape, including patterns and magnitude. It ranges from long-term decisions, like improving energy efficiency, on-site power generation, or electrification, to short-term Demand Response (DR) measures within the operational phase.
In addition, the authors argue that the three terms IDSI, DR, and EF should be further distinguished from one another. With regard to DR, the authors agree with the definition in [
19]:
Definition 2 (Demand Response).
Demand Response (DR) is defined as the “changes in electric usage by end-use customers from their normal consumption patterns in response to changes in the price of electricity over time, or to incentive payments designed to induce lower electricity use at times of high wholesale market prices or when system reliability is jeopardised.” [19]. Regarding the term EF, the authors agree with the definition in [
6]. According to the definition, EF is a capability and therefore represents the prerequisite for the implementation of DR measures.
Definition 3 (Energy Flexibility).
Energy flexibility is defined as the “ability of a production system to adapt quickly and in a process-efficient way to changes in the energy market.” [6]. The objective of all concepts is to advance the effective end efficient use of electricity. However, the main differences are that DSM, DSI, and IDSI are activities to achieve this objective, whereas EF represents the necessary ability to implement these activities. The term DR describes the change in electricity use of end-costumers in response to price signals or incentives provided by utilities. The planning and implementation of these wanted changes in electricity consumption is included as part of IDSI. The main difference between the terms DSM, DSI, and IDSI is that DSM and DSI are defined from utility perspective whereas IDSI is defined from electricity end-user perspective. Therefore, activities by the industry to use electricity more effectively and efficiently are summarised as IDSI.
Table 1 summarises the similarities and differences between the different concepts.
IDSI can be divided into two categories.
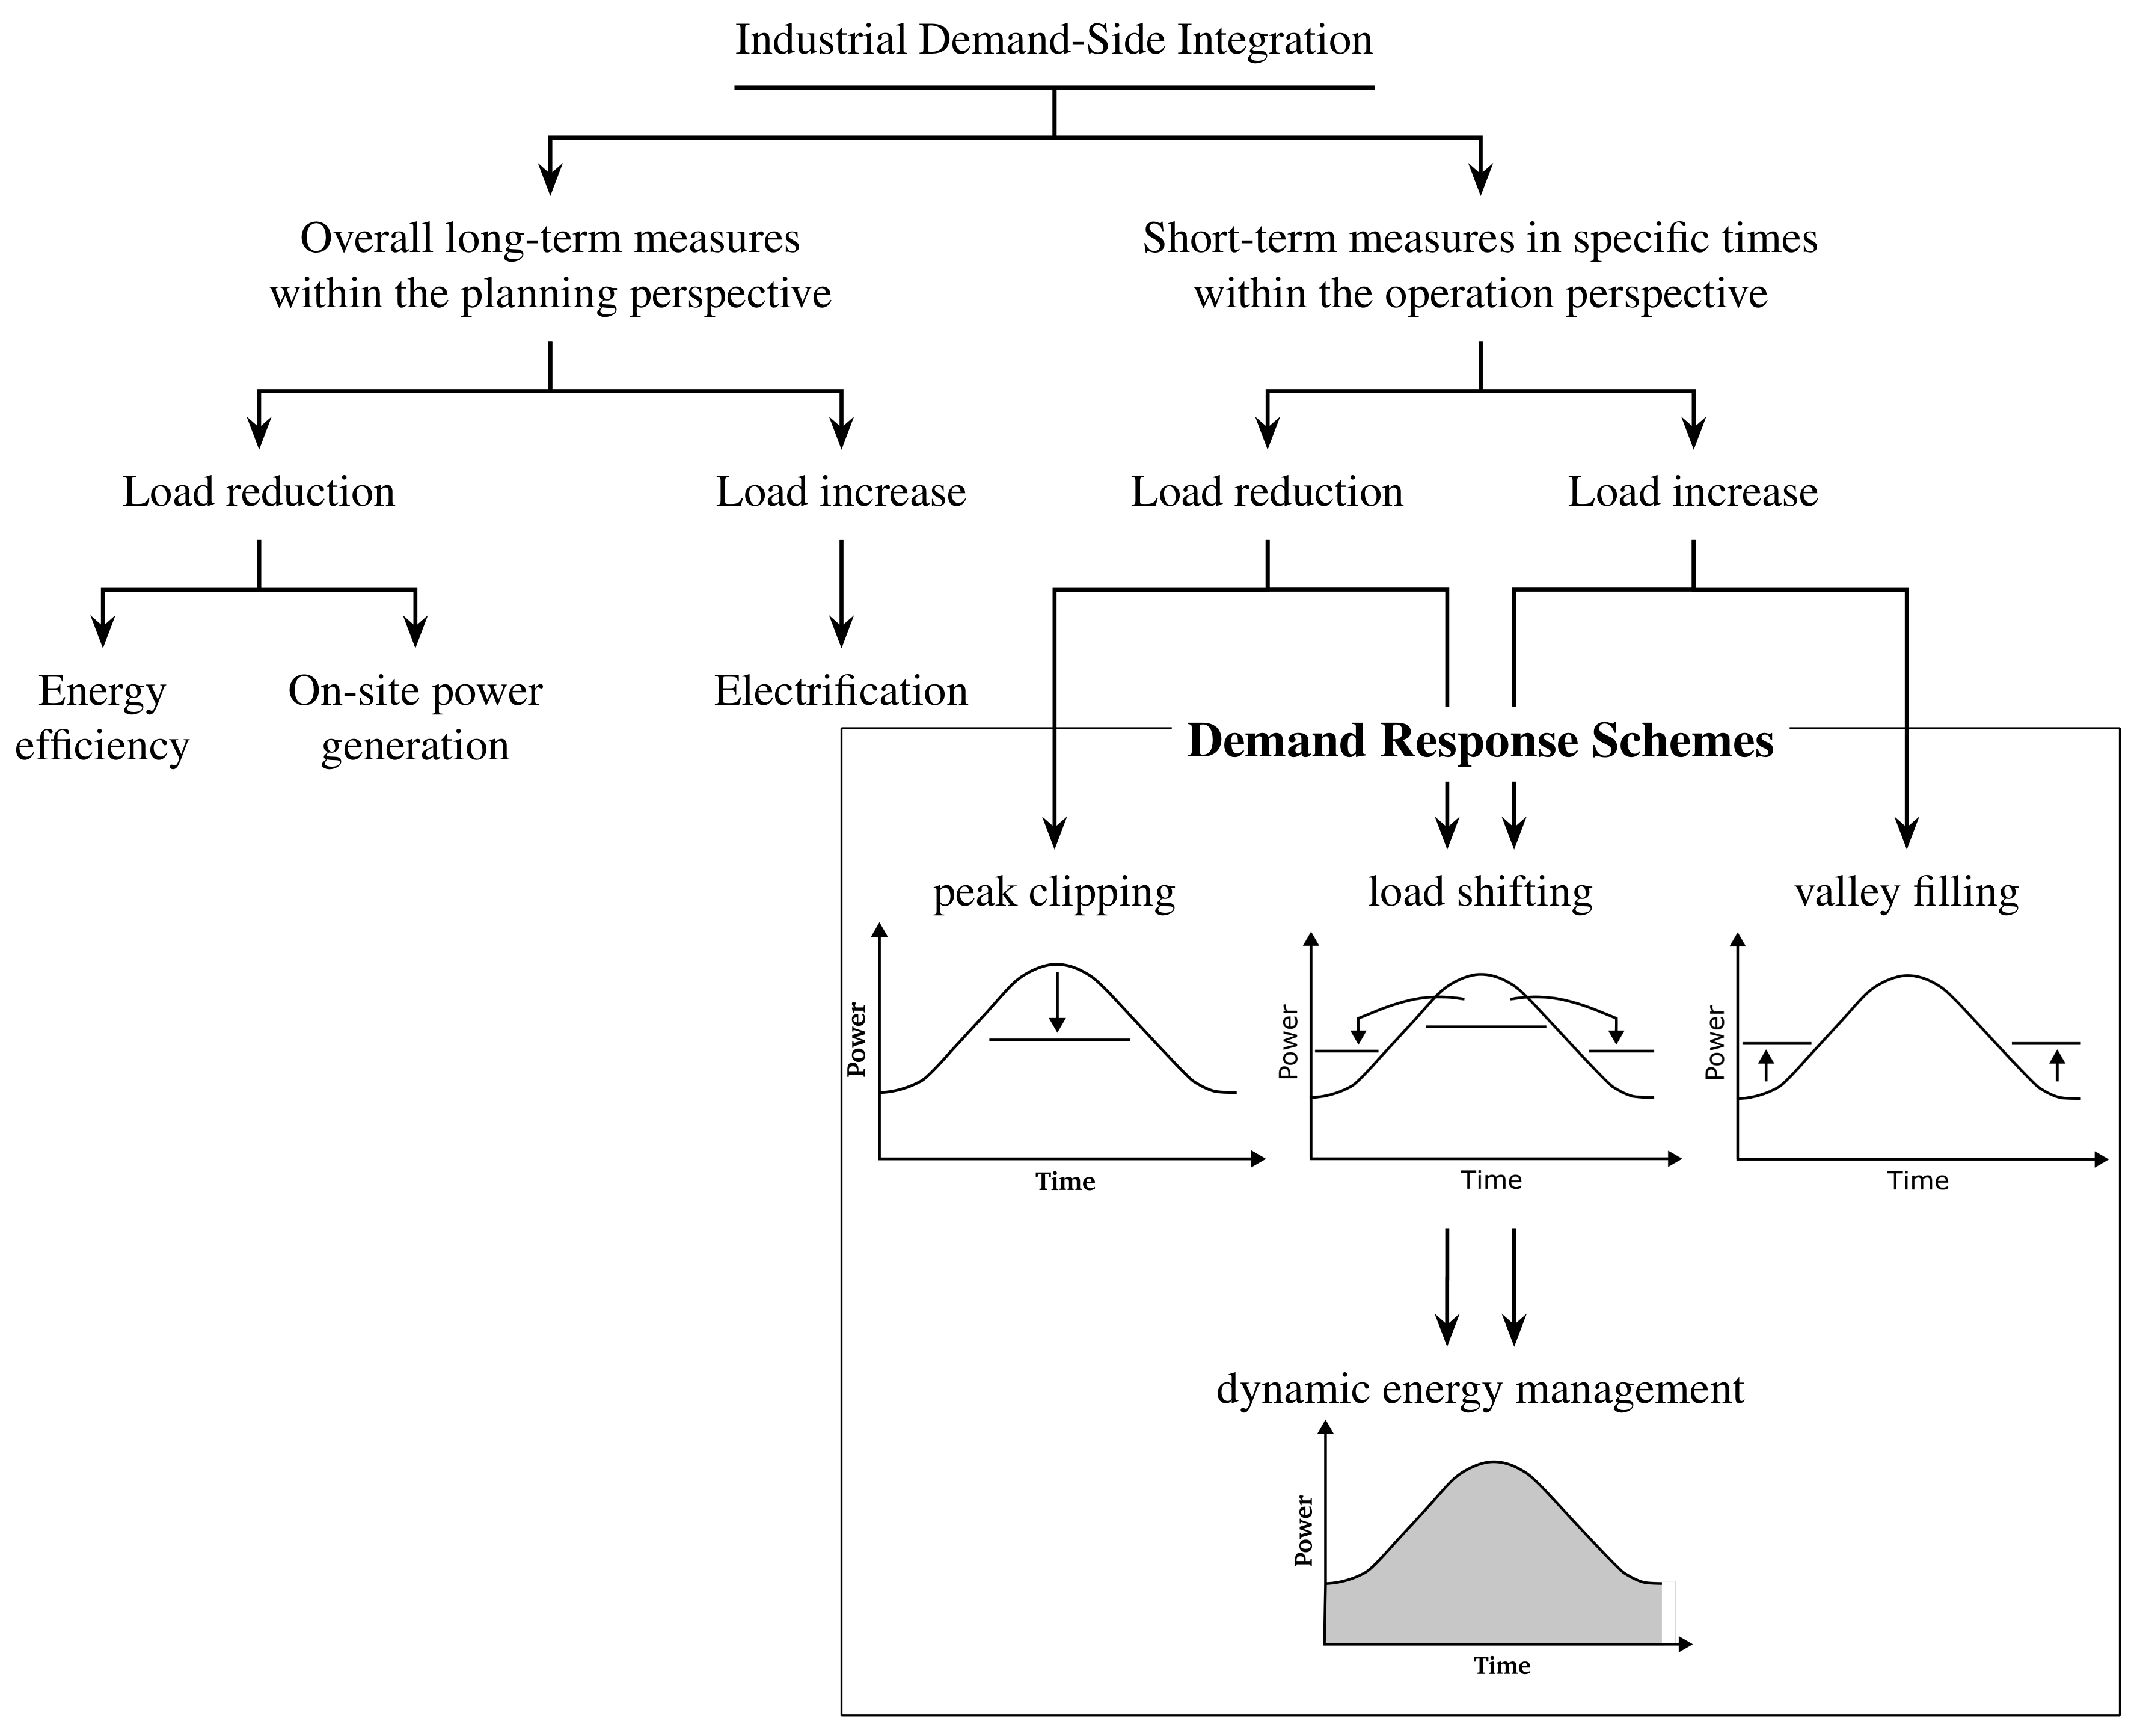
Figure 1 provides a detailed overview of the different load shaping objectives of IDSI. Long-term measures fall into the first category. This can also be referred to as the planning perspective with the objective to reduce the energy cost and/or environmental impact of energy consumption in the long term. This category can be distinguished into:
Energy efficiency, with the objective to reduce load levels while maintaining production goals like quantity, quality, cost, and time restrictions
On-site power generation, with the objective to integrate renewable power generation
Electrification, with the objective to substitute energy sources, which are more expensive in regards to money or CO2eq, with electricity
The second category, the short-term or operation perspective targets short-term modifications in the load level in specific times. Thus, this category includes all DR measures. Generally, these measures may be grouped by load reduction or increase. The terms load reduction or increase refer to a reduction or increase of power consumption compared to the planned load curve without the application of DR [
6]. Even though there is an infinite combination of load shaping possibilities, the following four DR schemes are commonly referred to [
6,
17,
21,
26]:
reducing peak demands by peak clipping
valley filling by building off-peak demand to improve the load factor
load shifting from on-peak to off-peak periods
triggering demand fluctuation and desired load shapes which are planned in operational time windows by dynamic energy management
To summarise, IDSI focuses on the efficient and effective utilisation of electricity and especially on the efficient incorporation of renewable energy resources.
Companies implement IDSI-related measures based on two overall objectives:
- 1.
Economic objective: Minimisation and optimisation of energy costs
- 2.
Ecological objective: Reducing the CO2eq footprint of the company’s energy usage
Given the presented background, the following specific objectives for IDSI can be differentiated [
6]:
reaction to volatile energy prices
external offer of EF
maximising of consumption of power generated on-site
maximising use of renewable energy
peak shaving and load balancing of electricity demand
improvement of the quality of electrical power
improvement of energy infrastructure resilience
As these objectives are interrelated, the implementation and management of specific IDSI measures can cover a group of objectives simultaneously.
Regarding the economic incentives, there are three possibilities for the commercialisation of energy flexibilities [
24]:
- 1.
Exploiting fluctuating electricity prices on the exchange-traded electricity markets (energy-only markets)
- 2.
Providing flexibility to grid operators, who can utilise it to stabilise the power grid (e.g., capacity markets)
- 3.
Internal use of flexibility (e.g., optimising the consumption of power generated on-site for reducing peak loads)
3.2. Monetisation Options for Industrial Demand-Side Integration
In addition to the aforementioned dimensions which promote an understanding of requirements for the implementation of IDSI measures and assist in assessing affected parts of the organisation and the production system, some additional categories are needed to determine and evaluate available monetisation options. The specification of these categories is a result of the conditions associated with participation in retail and wholesale electricity markets. In this section, we will provide an overview of some of these conditions. Subsequently, we are going to derive and introduce the dimensions which can be used to classify IDSI measures and to determine corresponding marketing options.
In general, two kinds of options for the wholesale trading of electric energy can be differentiated, integrated markets where the system operator optimises supply and demand, and exchange-based markets without central optimisation [
37]. Electricity generators and large electricity consumers can participate directly in such wholesale electricity markets. Smaller consumers do not have the option of direct market participation due to regulatory and financial entry barriers. Some of these barriers may include becoming a certified trader, membership cost, and transaction fees (see e.g., [
38]). They must rely on the retail electricity market to provide options for monetisation of IDSI measures.
On the retail market, DR programs and tariffs which take EF into account may be offered. These offers can be differentiated into price-based and incentive-based programs.
Incentive-based programs offer incentives such as overall lower prices for the ability to reduce loads on notification by the electric utility. In direct load control programs, the electric utility has the ability to remotely shut down equipment [
39]. In curtailable load programs, customers are notified to decrease overall load, however, the utility does not have direct control over equipment [
40]. Curtailable load programs are typically offered to large customers [
19].
Price-based programs influence power consumption by adjusting prices according to energy grid requirements. These programs require the customer’s willingness to keep track of current energy prices and adjust their load accordingly. There are many different implementations of price-based DR programmes, the most important of which are described in
Table 2. Other program types are usually variations or combinations of the described programs for specific applications.
These programs can be distinguished by planning horizon and holding duration (see
Section 3.2.2 and
Section 3.2.4 for definitions).
DR programs which are relevant for smaller consumers are typically offered by aggregators, which aggregate the energy consumption and generation of many smaller participants in the power grid [
41] to create a larger, virtual power plant. It is important to note that power prices are often constituted of multiple price components and pricing schemes offered by aggregators sometimes may only influence certain parts of the total price. For example, the average total electricity price in Germany in 2021 is EUR
of which EUR
are taxes and surcharges [
42]. Taxes and surcharges are fixed relative to the net price and usually cannot be altered directly by demand response programs. In the United States of America, as another example, industrial energy use is not taxed [
43] and energy prices in 2021 average USD
[
44].
The aggregation of consumers into larger entities through DR programs will be an important factor for the dissemination of IDSI going forward. More electric utilities must act as aggregators to enable small consumers to offer EF on retail markets [
46].
For utilities and larger consumers of electricity, there are many different trading options available on wholesale markets. Energy only markets are the most important of these, since this is where supply and demand are matched and cleared. Demand bidding, capacity markets, and ancillary service markets provide additional trading options, for example, enabling consumers to offer load reductions for various time frames [
39].
Wholesale electricity markets can differ somewhat depending on the region [
37]. It is not possible to give a comprehensive overview of all worldwide markets which is why this paper focuses on exchange-based markets consisting mainly of day-ahead trading and real-time trading during the day. The European market is used as an example of this model to enable the application of the proposed method to a specific use case. The specific information given here may need to be adjusted depending on the region, however, the method itself should remain valid.
On the European electricity market, day-ahead trading occurs on the day-ahead and the intraday auction markets while real-time trading occurs on the continuous intraday market [
47]. The European market also adds some additional complexity to the aforementioned exchange-based market model by including derivatives trading as well as capacity and ancillary services markets. The capacity market is made up of three individual parts: primary and secondary balancing power and the minute reserve which will be activated in succession when balancing power is required [
47]. This is further extended by the option to offer ancillary services for switchable loads. These are loads that can be switched on or of for specified amounts of time.
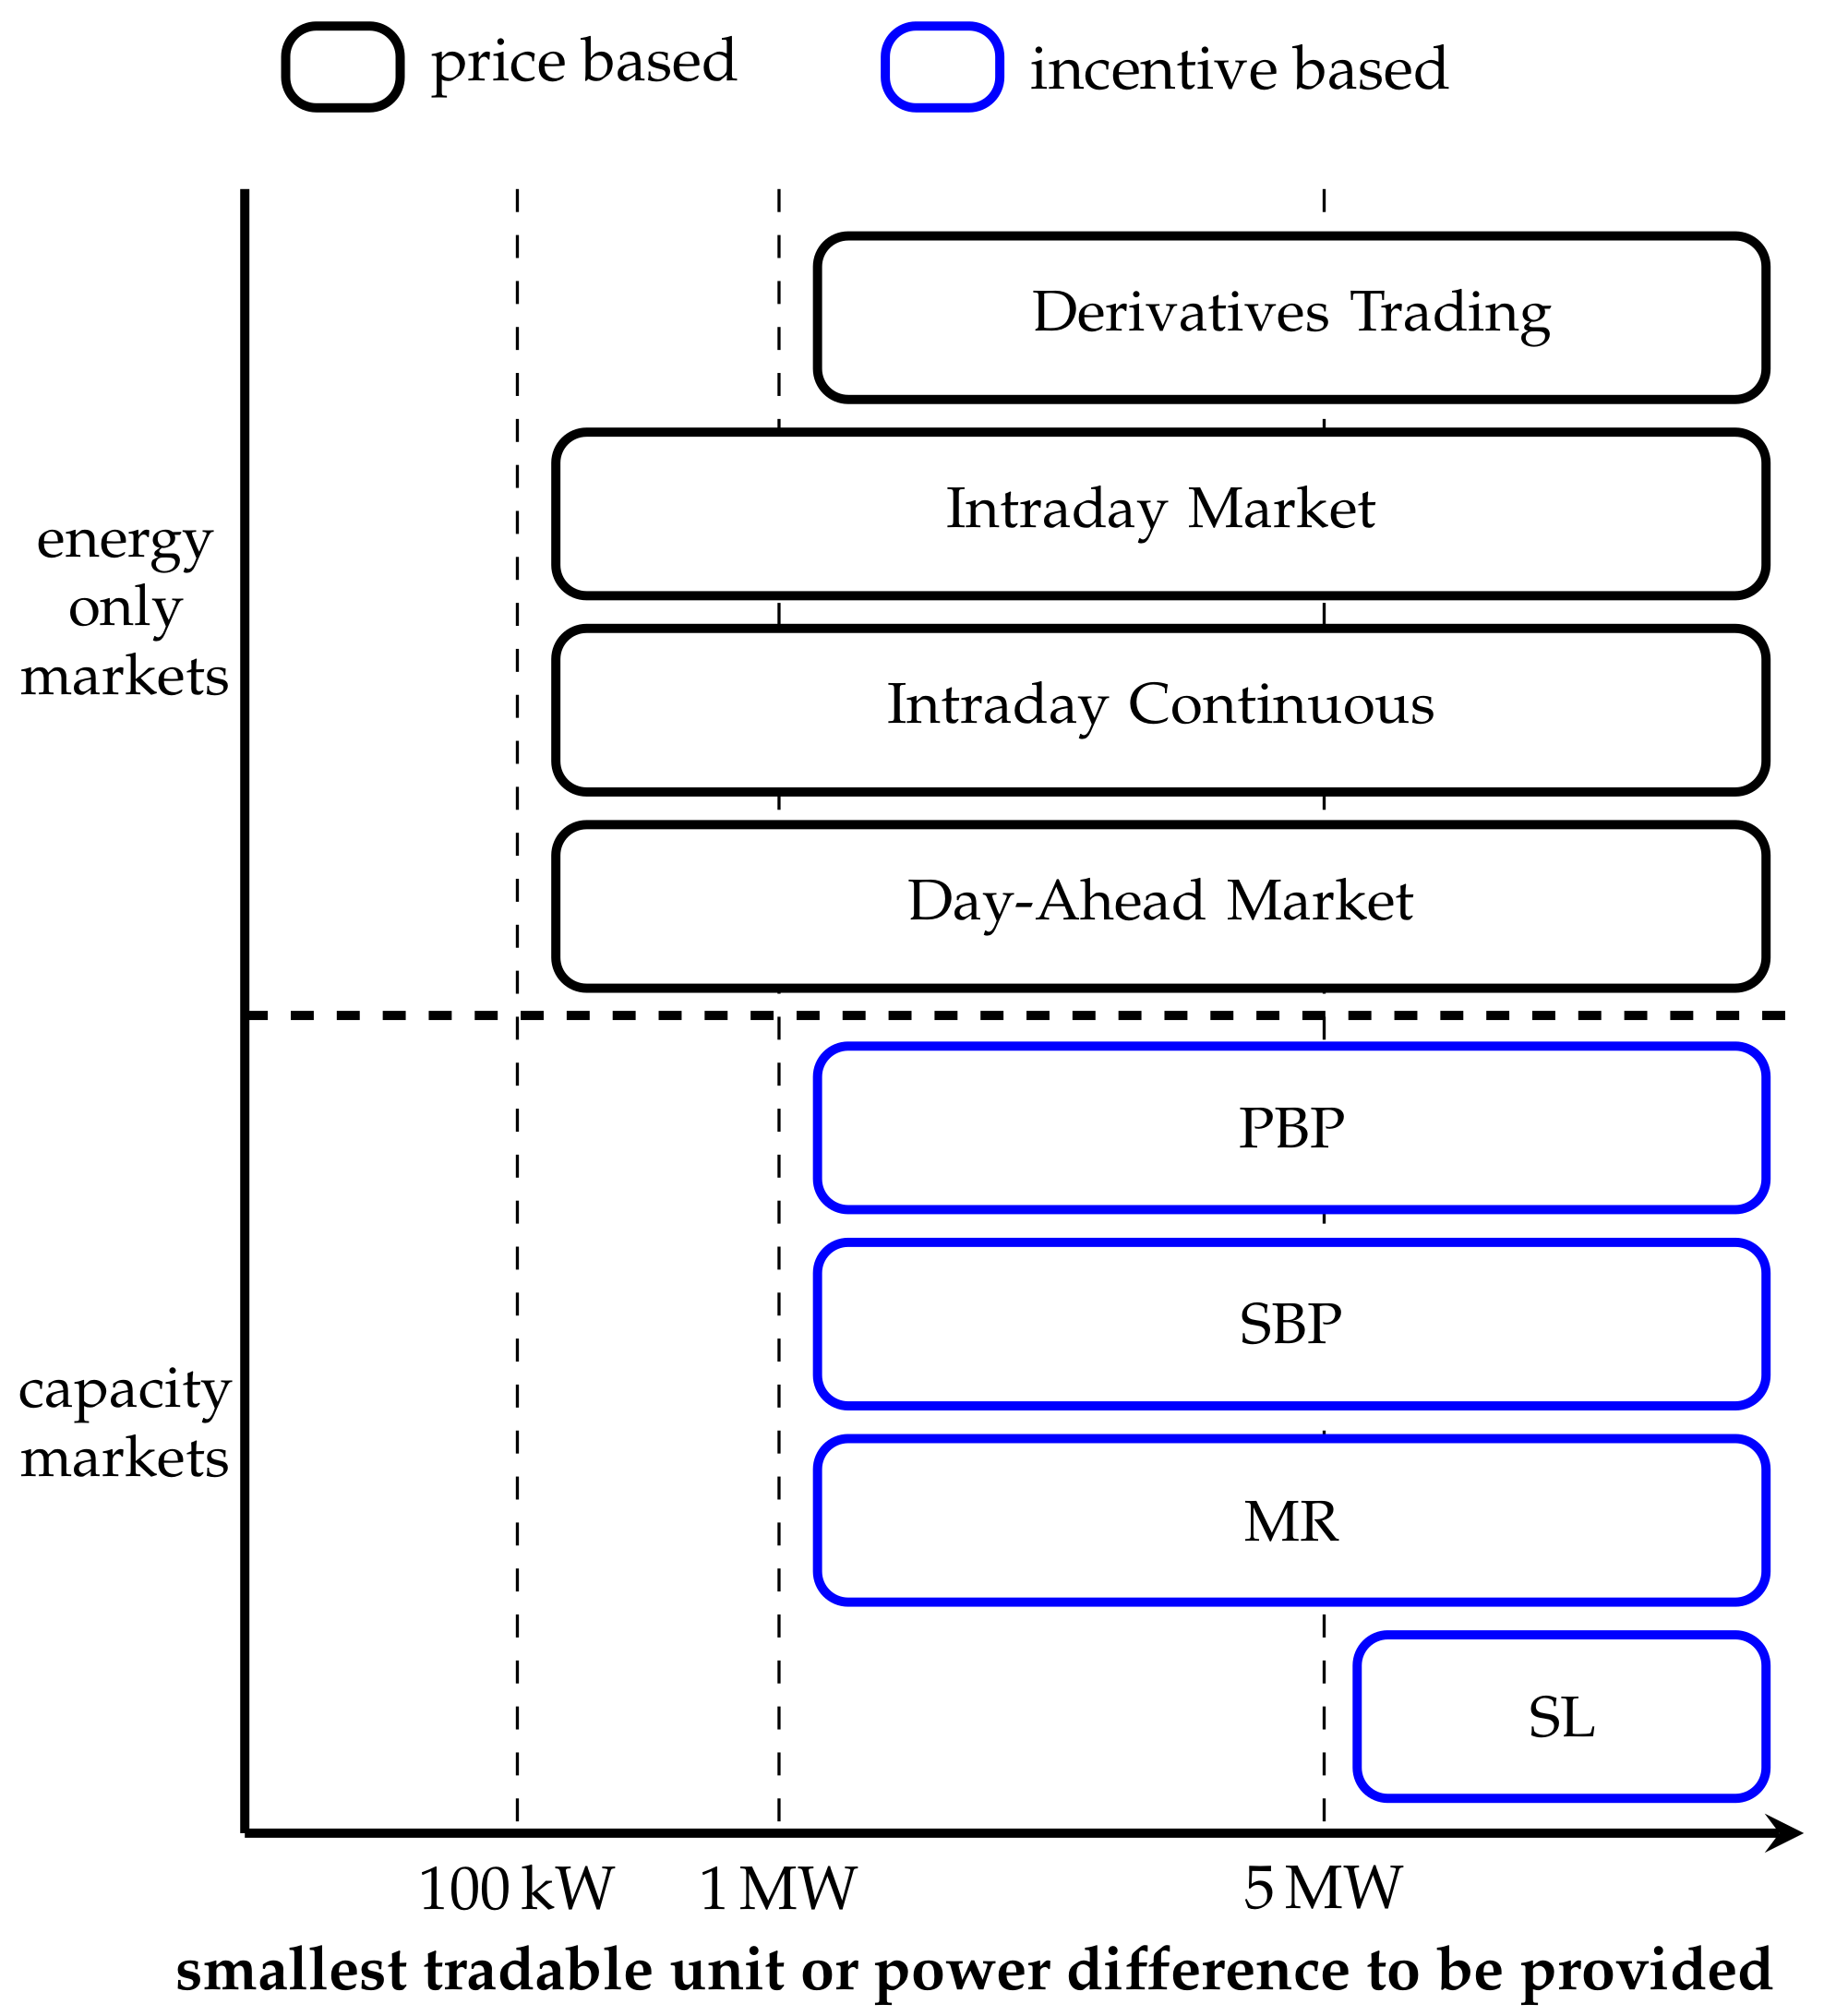
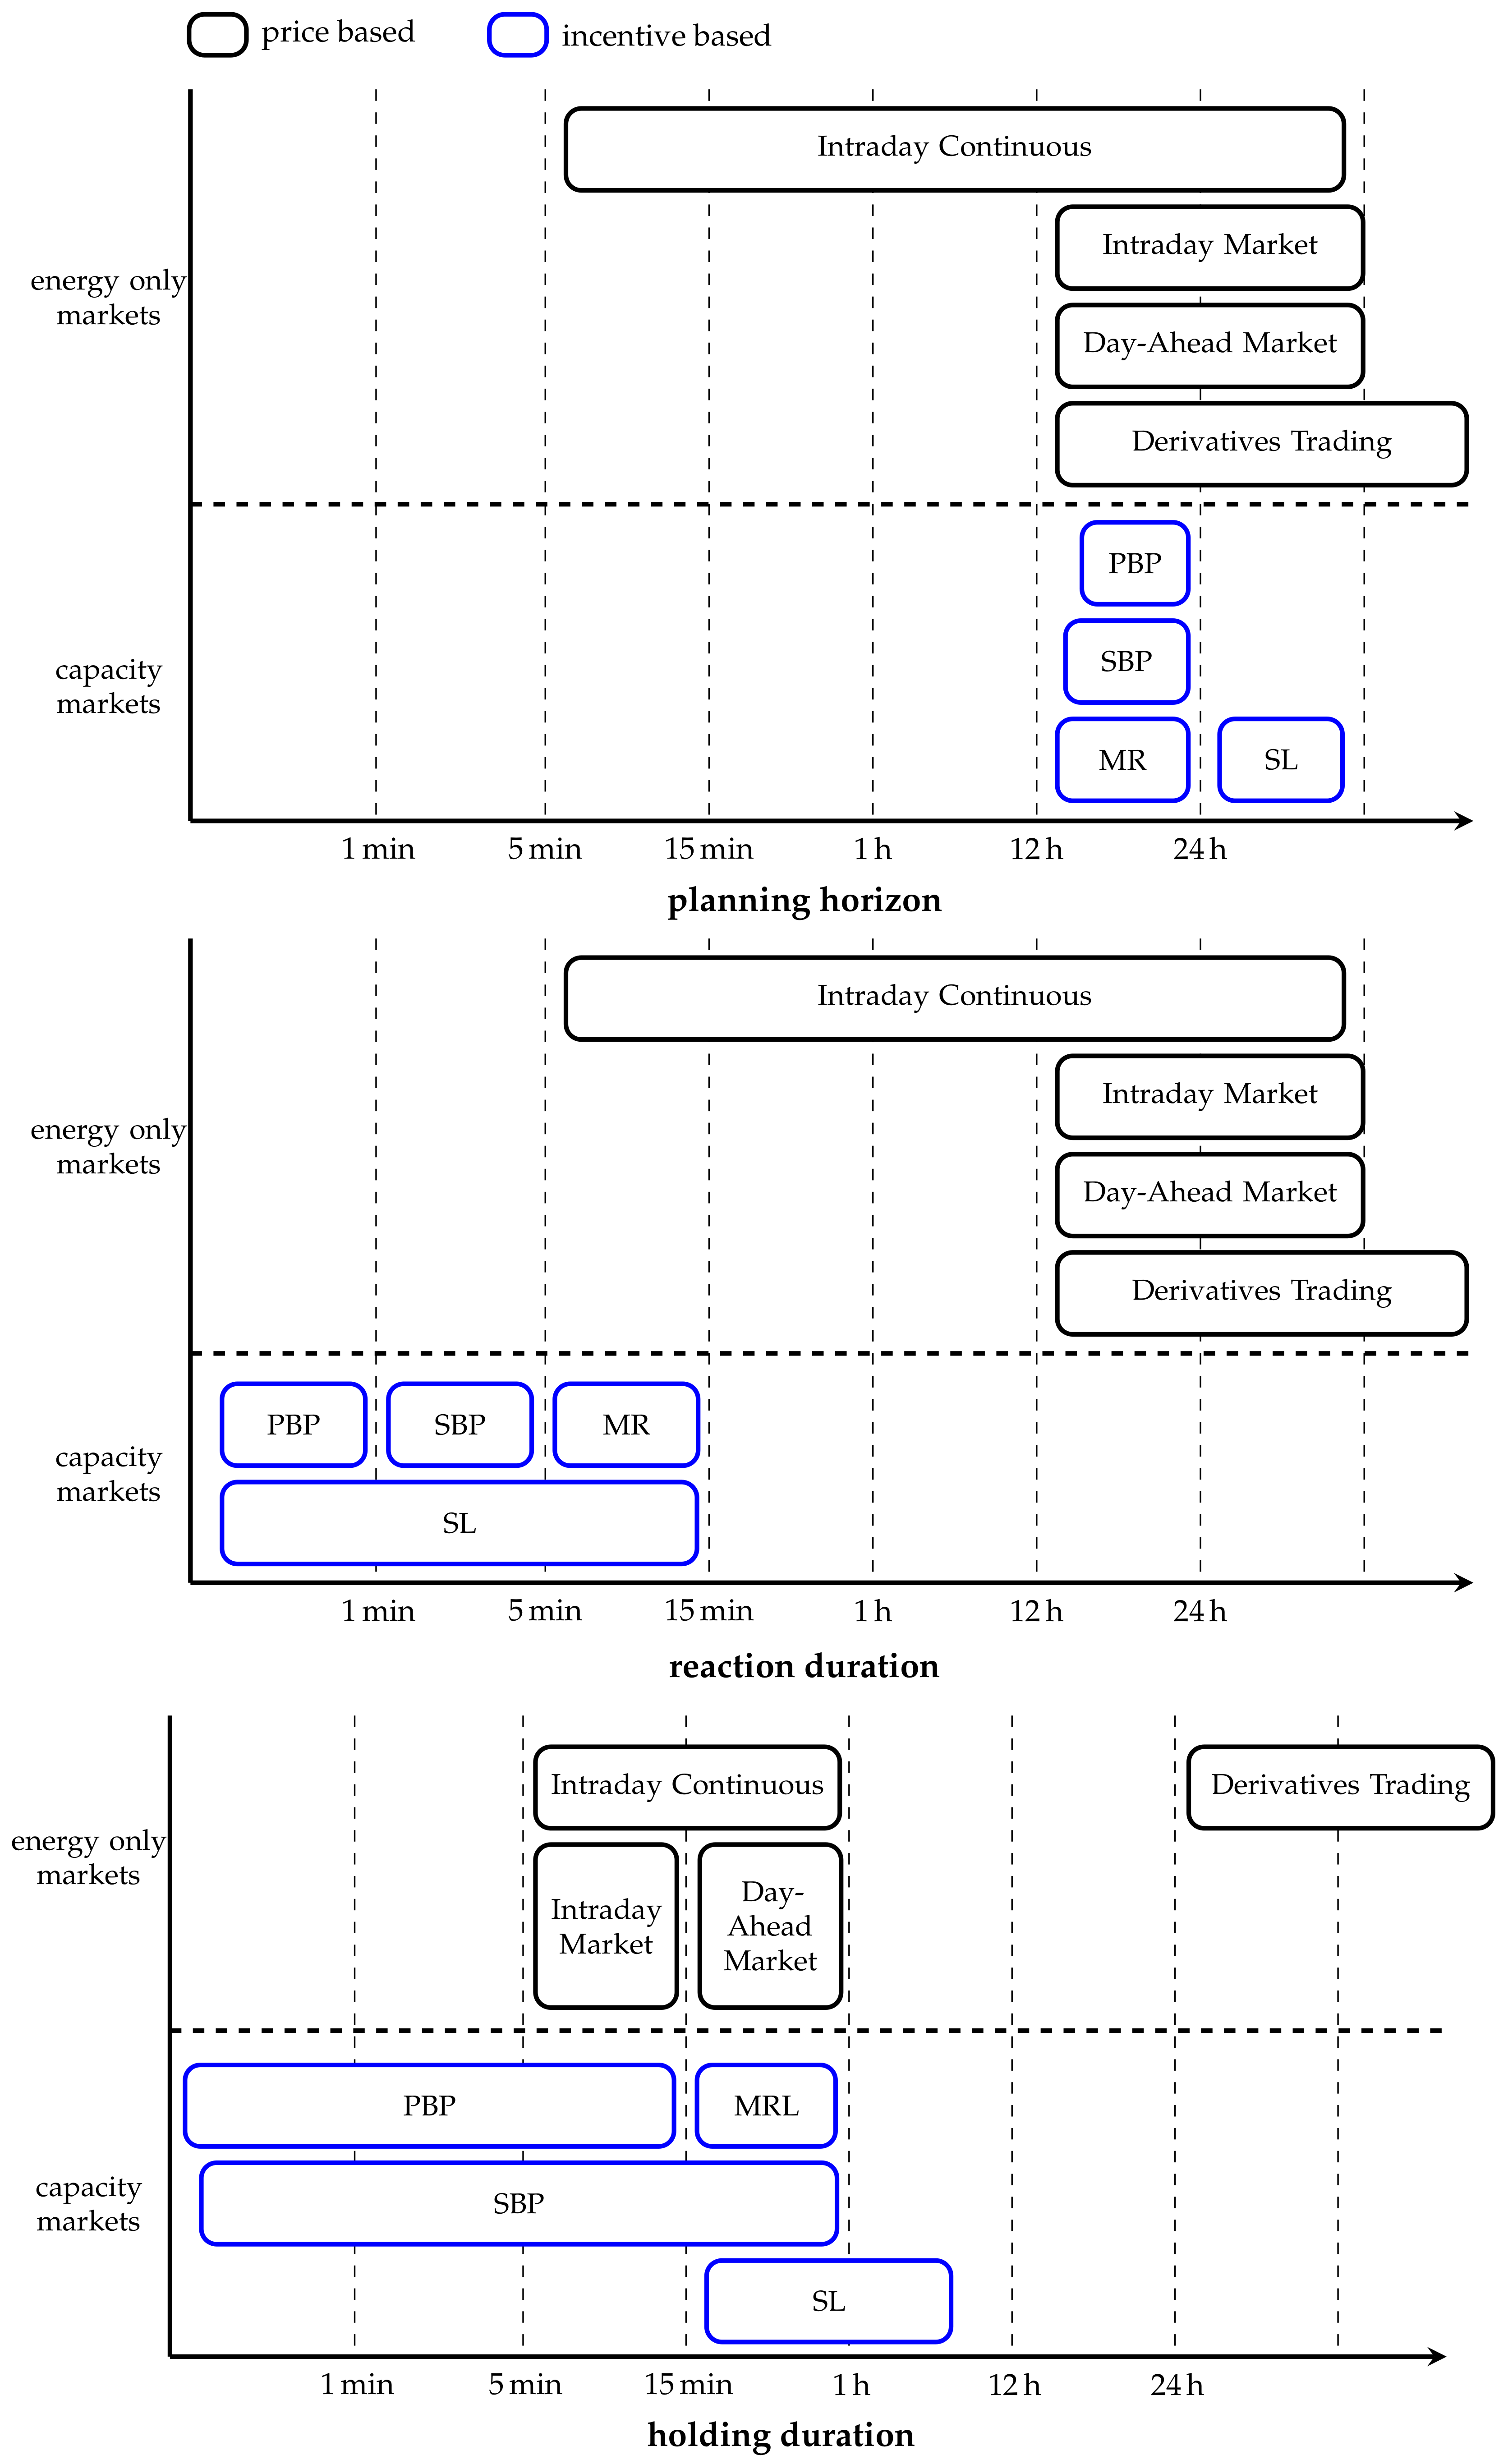
Market entry is determined by the smallest tradeable unit as shown in
Figure 4. Therefore, the dimension power difference is introduced into the classification scheme. Other, time-based factors for market selection are illustrated in
Figure 5. Since the markets differ in how far in advance trading is possible the planning horizon is an important factor [
48]. Furthermore, reaction duration describes how much time may pass between triggering a measure and the actual load change [
48]. Finally, the holding duration describes the minimum time for which a power difference must be held [
48].
All of these factors are important for choosing marketing options for IDSI. Therefore, they are described in more detail in the following sections.
Figure 4 and
Figure 5 can then be used for determining which marketing options could be viable.
3.2.1. Power Difference
The Power Difference or smallest tradable unit is an important quantity for the selection of the monetisation options of IDSI measures. As
Figure 4 shows, companies can participate in the energy-only markets with smaller power differences than are required for the capacity markets. If the flexibility potential is insufficient for participation in the energy-only market, the flexibility can be used internally such as for peak shaving or load balancing. Therefore, the following power difference categories are used to classify IDSI measures:
3.2.2. Planning Horizon
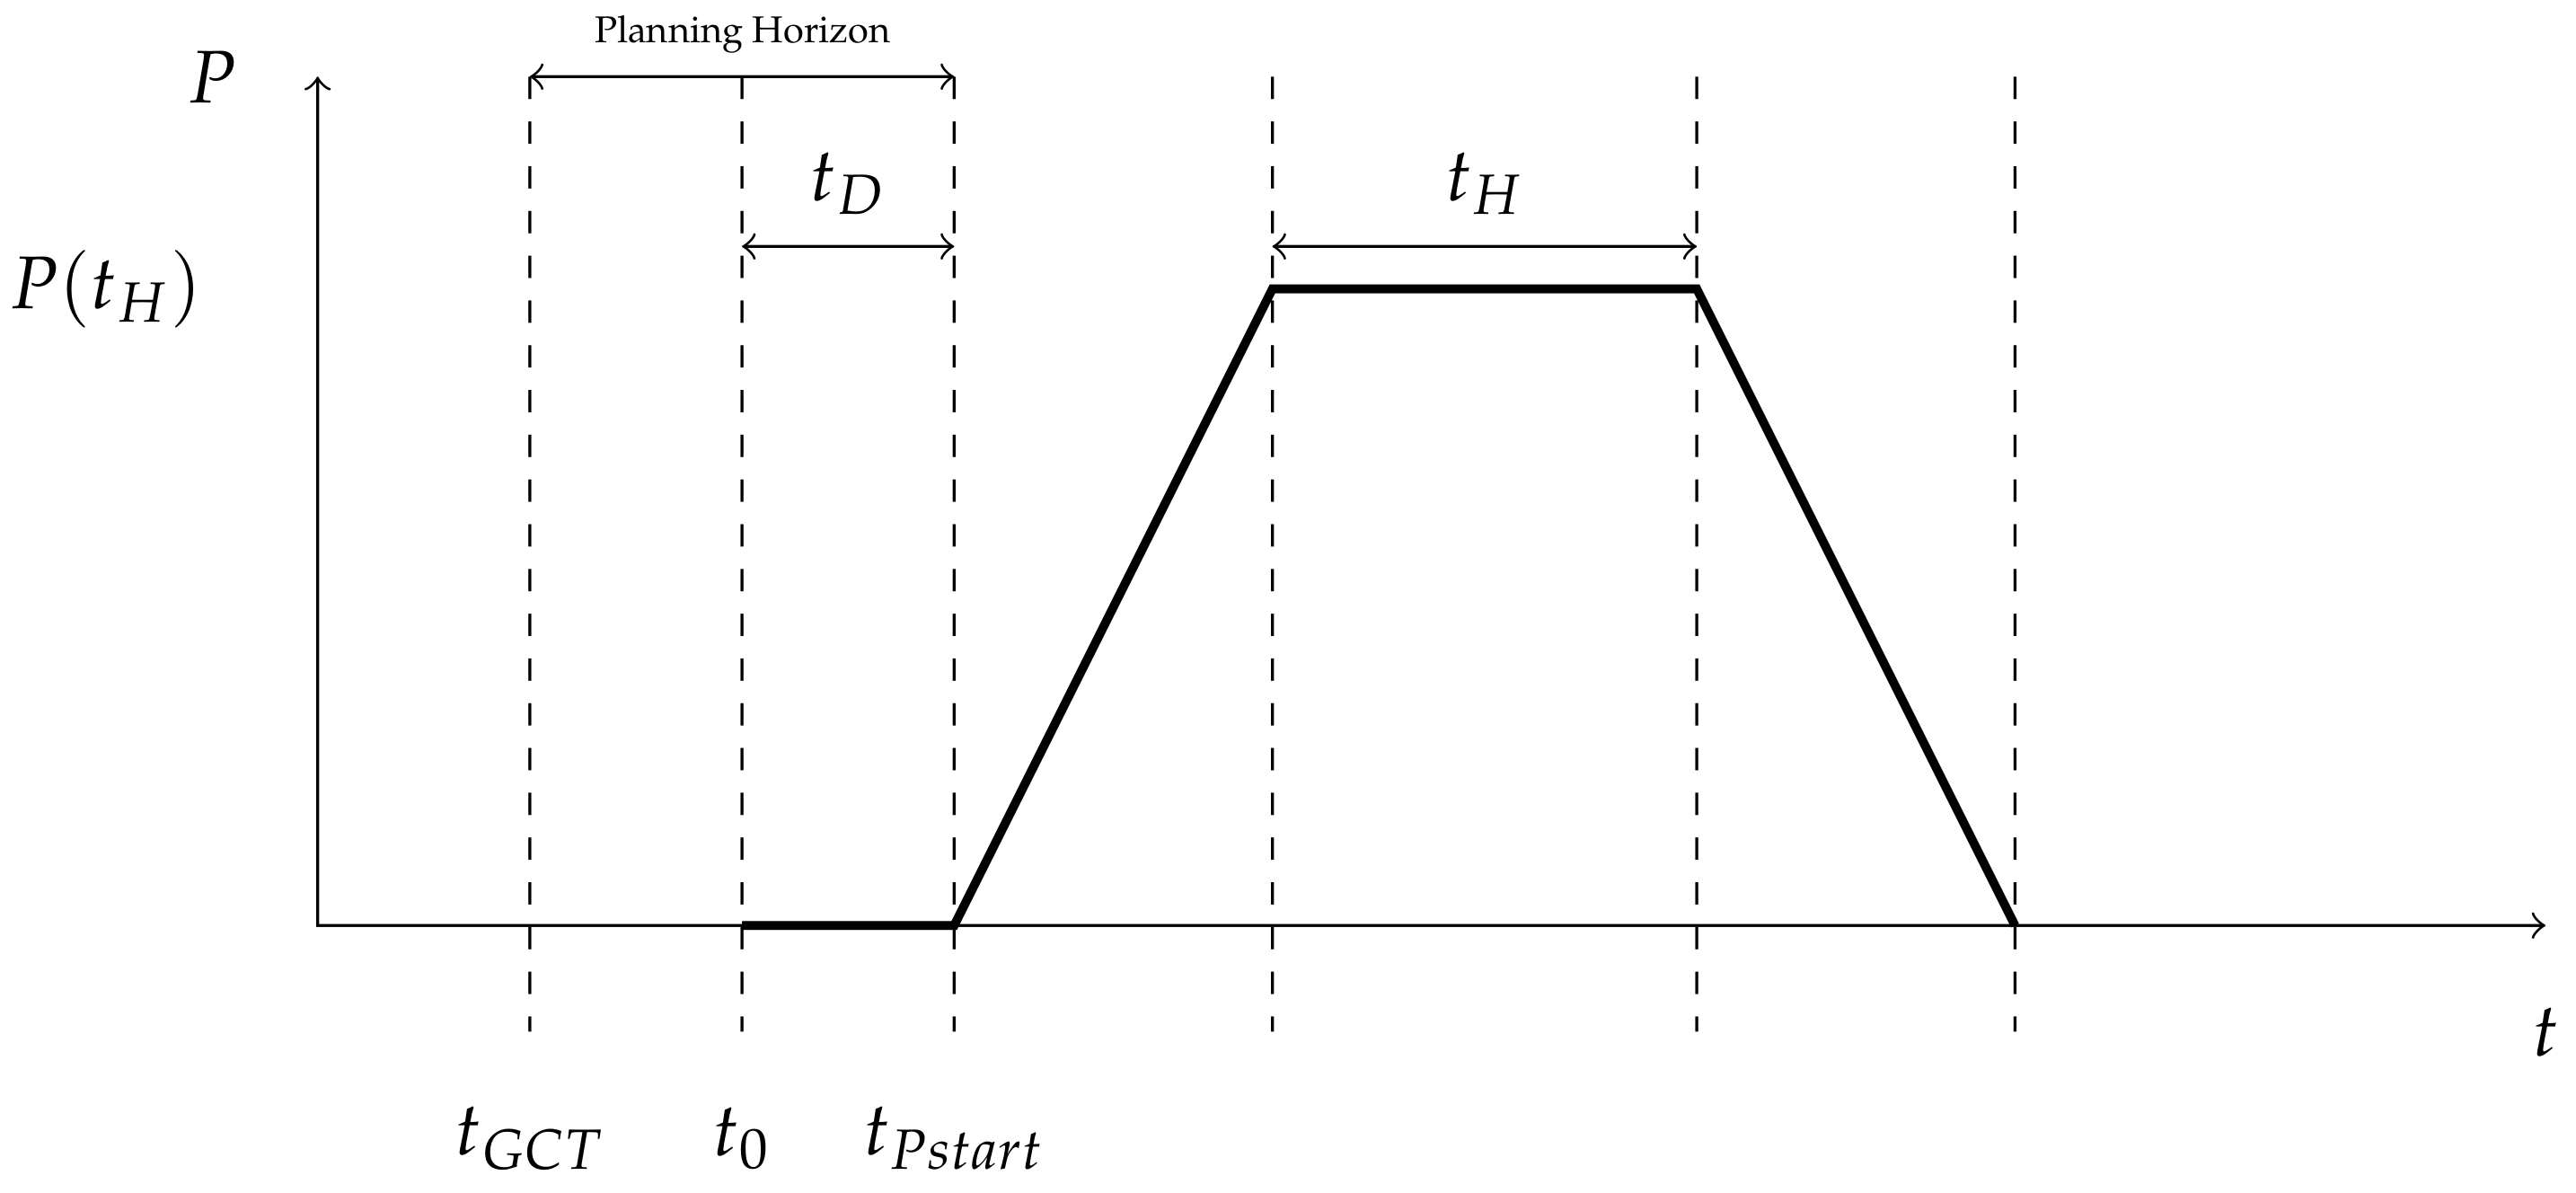
The planning horizon is specified as a dimension because it is important for companies to know how long they can plan for and when to expect possible demand level change requests. Following [
6,
48], we define the time interval
as the Planning Horizon of a DR measure, with the gate closure time
[
49] and the time stamp of the initialising power change
(see
Figure 6). Based on the request duration by [
7], the following planning horizon categories are used to classify IDSI measures:
smaller than five minutes
five minutes to smaller than one hour
one hour to smaller than twelve hours
greater than twelve hours
long-term measure
3.2.3. Reaction Duration
The reaction duration is an important dimension for the classification of DR measures since the remuneration options for DR measures often depend on how long it takes to initiate the power change, after the initial signal. For DR measures, the time between pulling the trigger at
and the start of a DR measure is defined as reaction duration
(see
Figure 6) [
48]. The same categories are used for the reaction duration as for the planning horizon.
3.2.4. Holding Duration
Similar to reaction duration, the holding duration is an important dimension since it influences the remuneration options for a specific DR measure. For DSI measures within the operational phase, the lengths of time periods for which the flexible load runs at its power states is defined as the holding duration
. Every holding period is the time with a constant power state between two consecutive modulations, including activation and deactivation (see
Figure 6) [
48]. The same categories are used for the holding duration as for the planning horizon.
4. Methodology for the Classification and Characterisation of Industrial Demand-Side Integration Measures
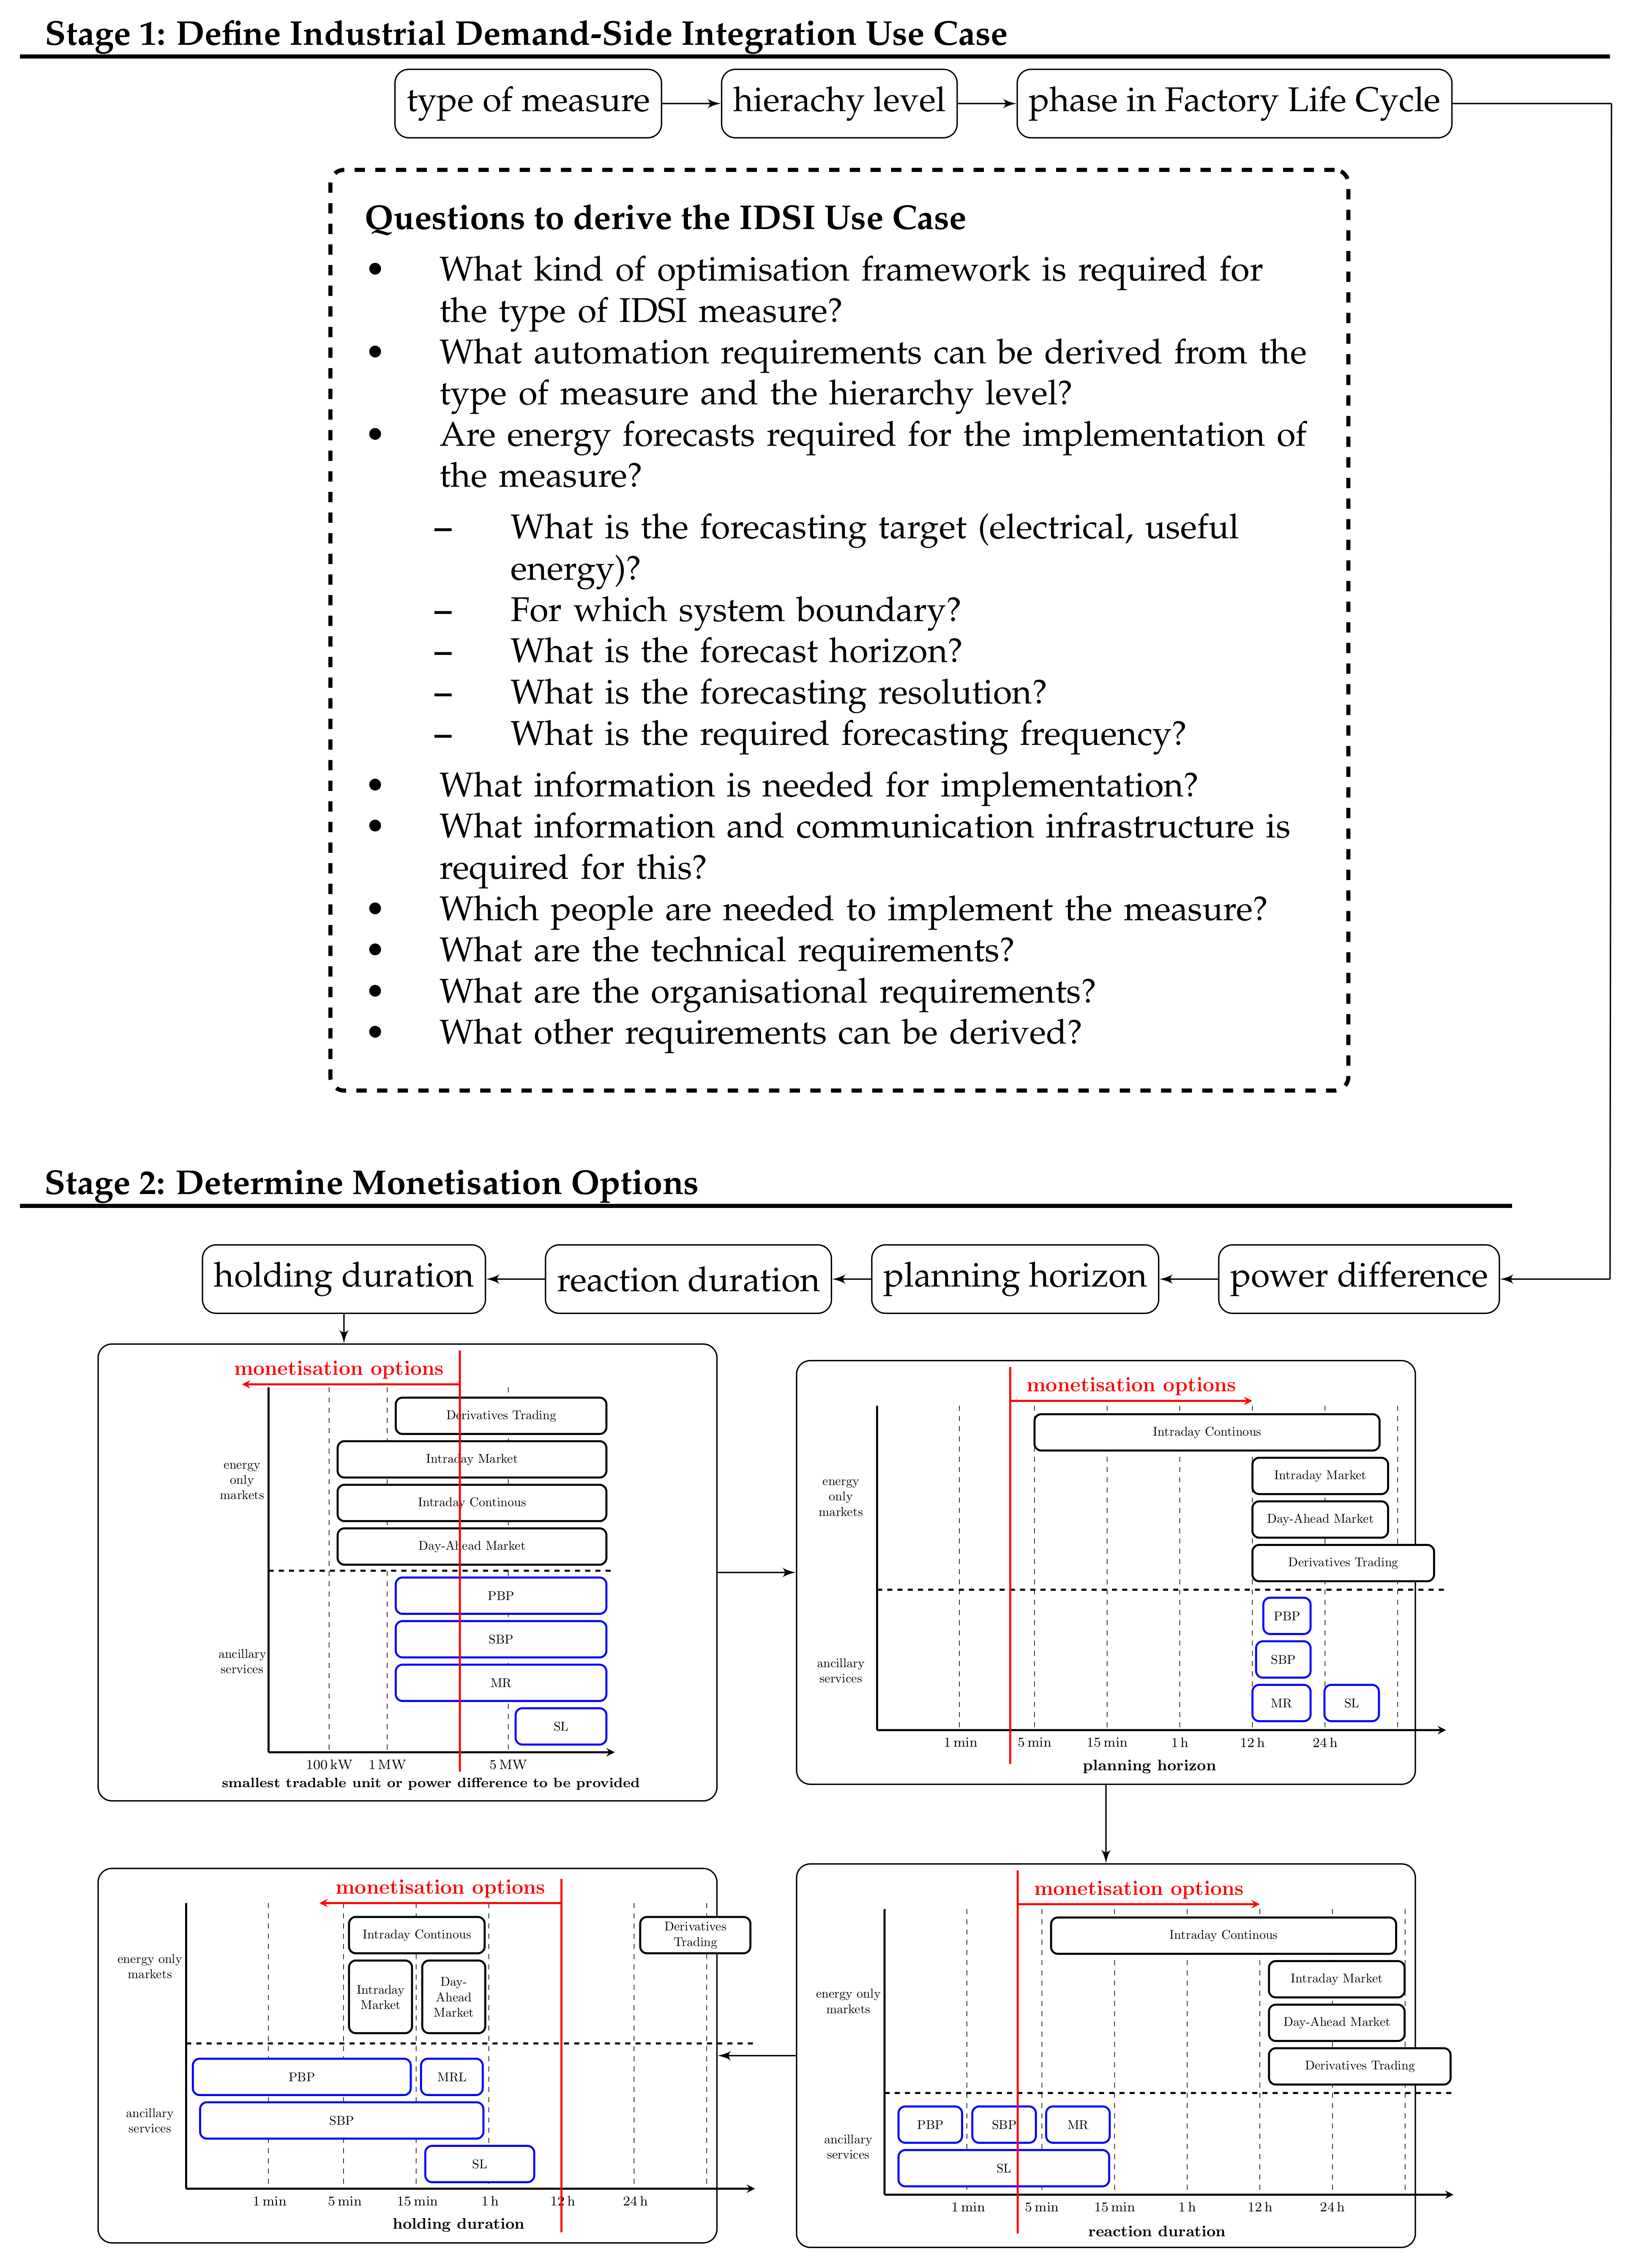
The previously presented dimensions and attributes provide the basis for the methodology. In two steps, the use case is first defined and then the monetisation options are determined.
Figure 7 presents an overview of the flow of the methodology.
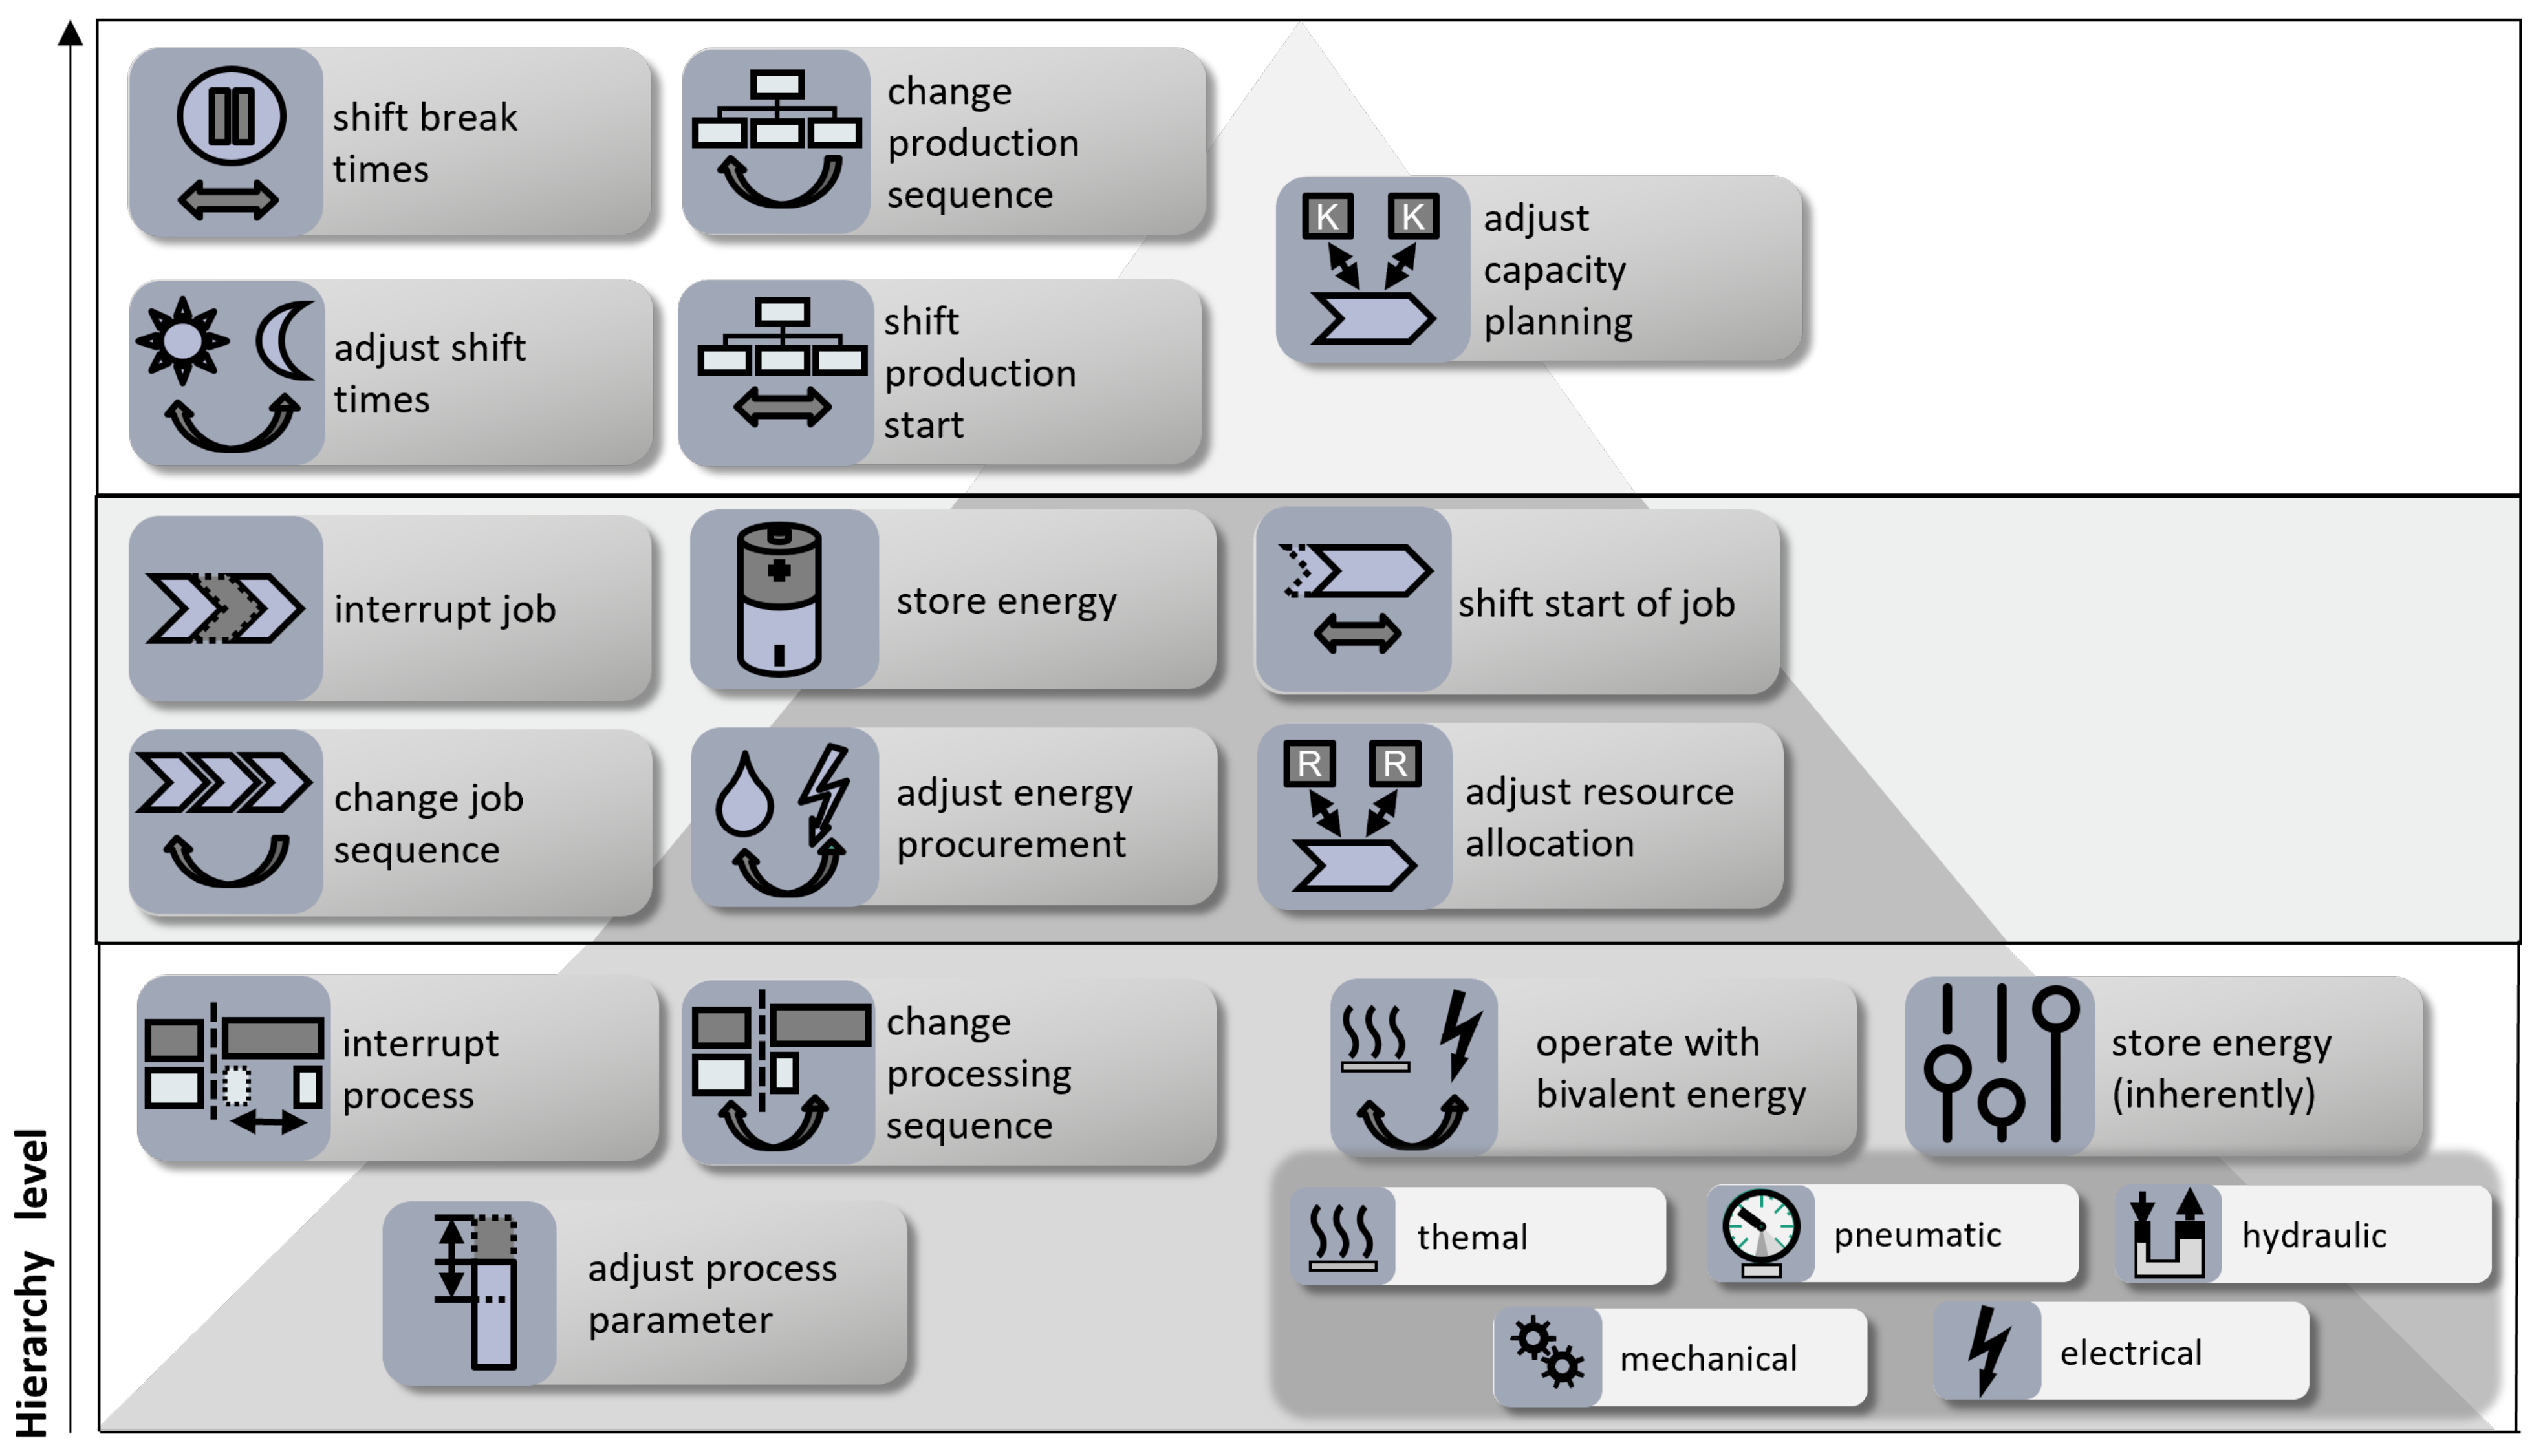
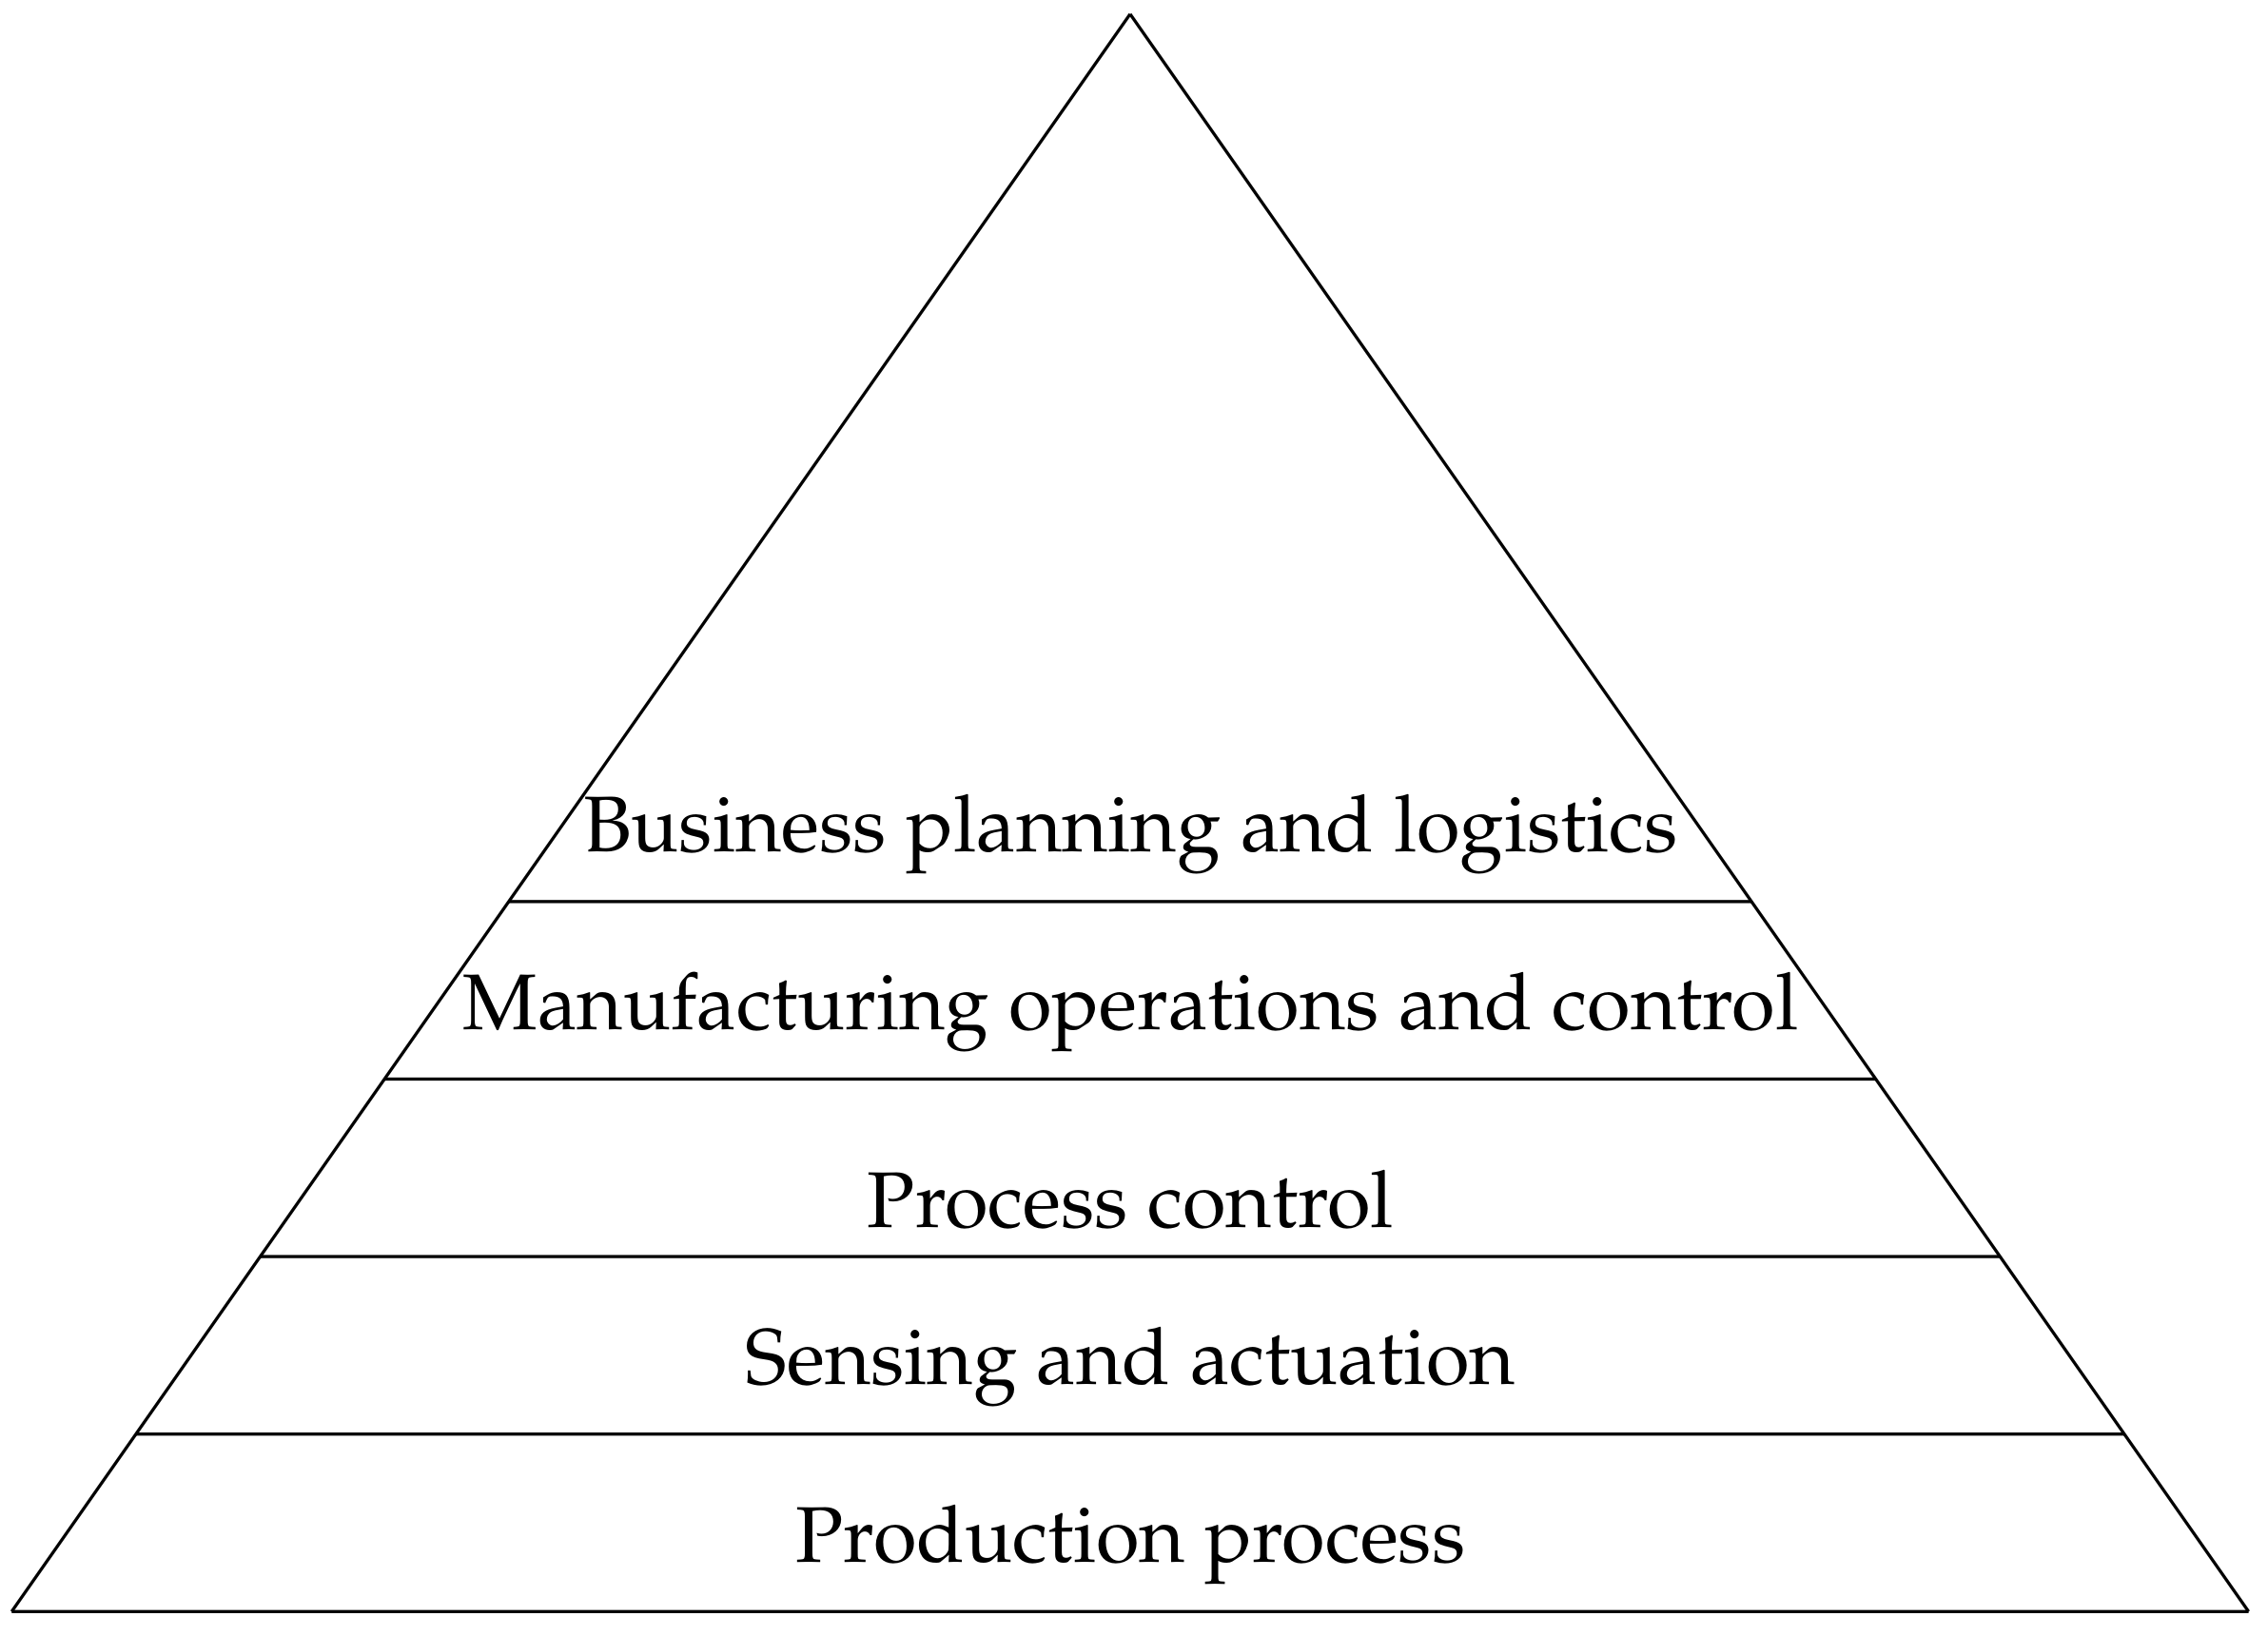
The first stage of the methodology is dedicated to defining appropriate use cases in industrial entities. Therefore, as a first step, the generally feasible IDSI measures are considered and the measure to be implemented is selected. Based on this, the hierarchy level is selected, which determines the system boundary on which the measure is to be implemented. The next step is to determine the phase of the FLC, which provides information on whether the measures are non-recurring long-term measures or short-term recurring measures. In the last step of the first stage of the methodology, the questions listed in
Figure 7 are answered in order to identify the requirements of the use case.
In the second stage, the monetisation options for the identified IDSI measure are determined. For this purpose, the power difference, the planning horizon, as well as the reaction and holding duration for the measure are first determined and categorised. Since the different markets have varying requirements for the individual categories, the possible monetisation options can be derived from the categorisation. The previously presented classification of the markets by means of the four categories (
Figure 4 and
Figure 5) is, unfortunately, not universally applicable to all possible trading centres worldwide. Therefore, in order to determine the monetisation options, it is necessary for industrial entities to update these charts for their respective trading centre first. Subsequently, a pre-selection of the monetisation options is made on the basis of the power difference. Participation in the energy-only as well as capacity markets is subject to a minimum power difference that has to be offered. Thus, based on the achievable power difference, monetisation options can be excluded. To determine possible monetisation options based on the power difference, the updated
Figure 4 is used. A vertical line is drawn at the identified power difference of the use case. All markets to the left of the line can be targeted.
Following, the remaining monetisation options for the categories planning horizon, reaction and holding duration of the use case are successively determined on the basis of the updated
Figure 5. The same procedure is used as for the power difference. For the planning horizon, all markets to the right of the line are eligible. For the reaction time, all markets to the right and for the holding period, all markets to the left of the line are suitable. All markets that fulfil all requirements of the four categories can be finally targeted.
As a result of this analysis, companies are presented with a selection of monetisation options for which the exact revenue opportunities at the respective trading centre have to be reviewed. Based on the achievable revenues, a monetisation option is selected in the last step. If neither the requirements for the energy-only nor the capacity markets are met, companies can exploit the EF potential internally for objectives such as peak shaving, load balancing, or optimising the consumption of power generated on-site.
5. Application of the Methodology
In this section, the developed methodology for the classification and characterisation of IDSI measures is applied to eight exemplary IDSI measures from the ETA Research Factory [
50]. These examples represent common IDSI measures from the industry. However, it should be noted that the ETA Research Factory is a scientific setup and therefore the achievable power difference for the individual measures is several times smaller than would typically be found in the industry. Nevertheless, the power difference for industry can easily be scaled up.
In the following, for each example, the specific use cases and their assignment to the dimensions of the proposed classification scheme are presented first. Second, the resulting requirements are described and subsequently a suitable monetisation option is derived.
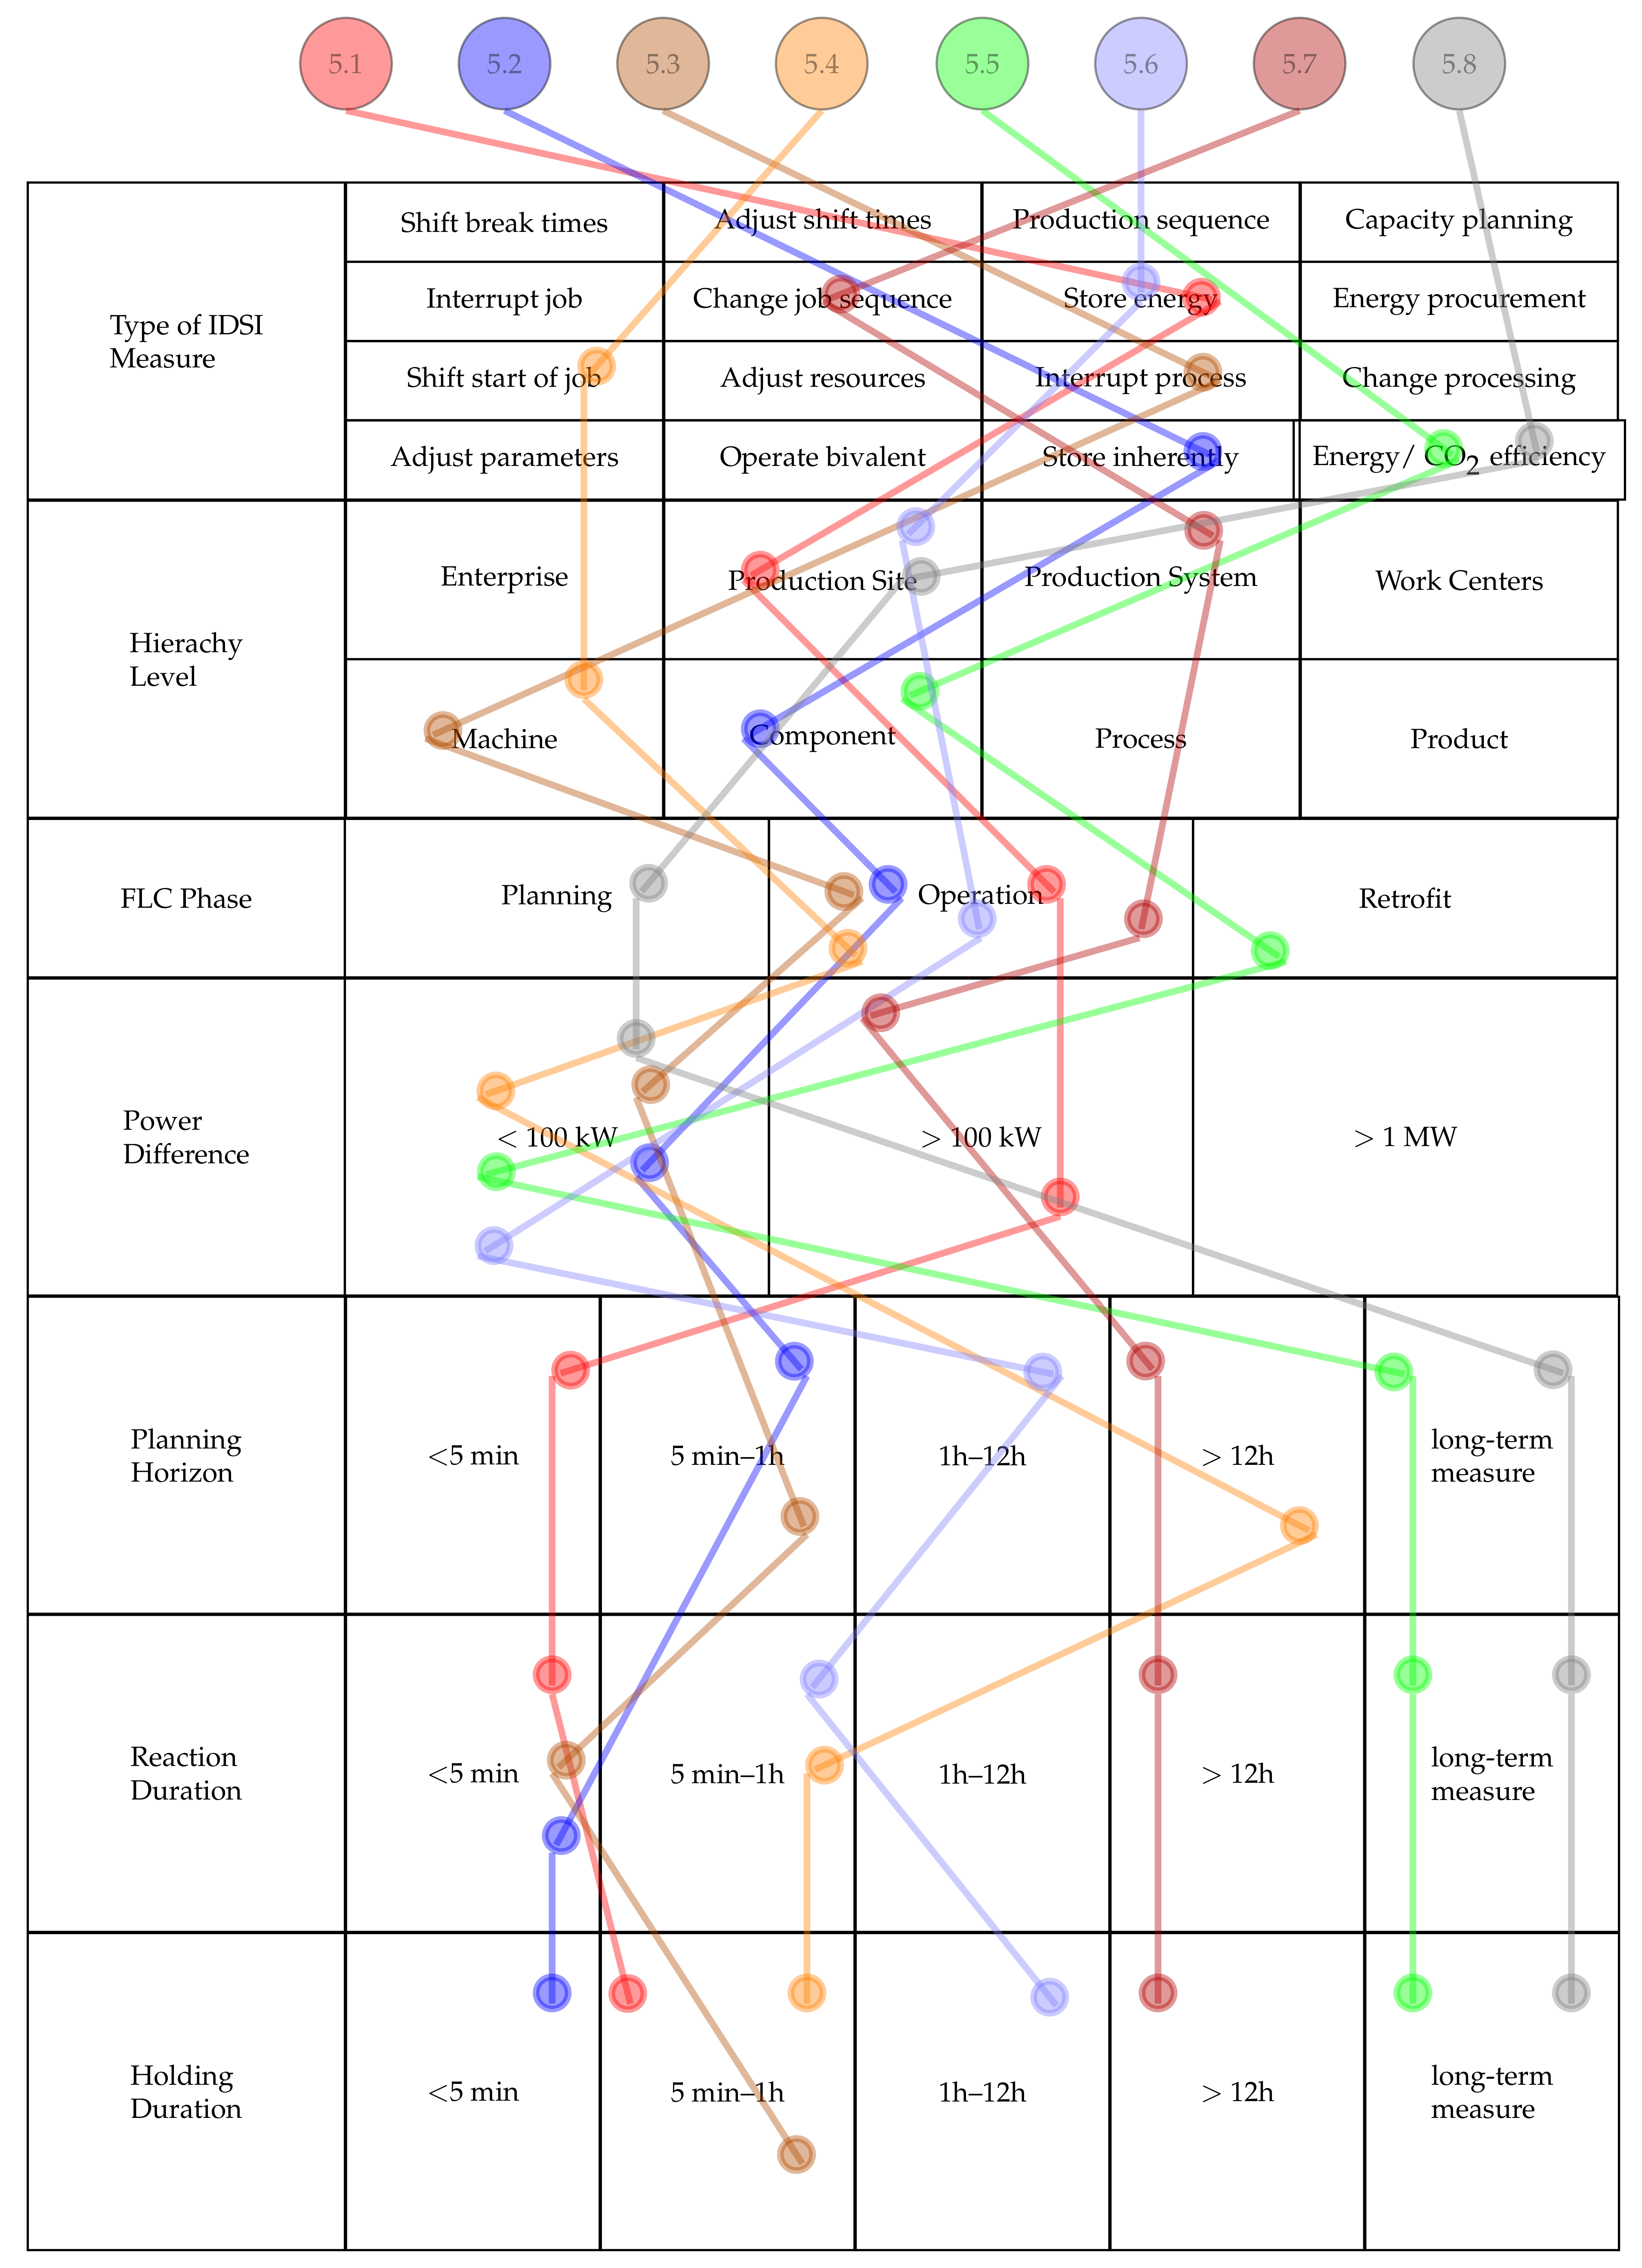
An overview of the different categories and respective dimensions as well as the assignment of the presented examples are given in
Figure 8.
5.1. Hybrid Energy Storage System
The system under consideration is an electrical energy storage system comprising a flywheel energy storage unit and a battery storage unit made of lithium-ion cells, where the flywheel is used for short-term and the battery for long-term energy storage. The advantage of combining a flywheel with battery energy storage arises from the reduced battery ageing compared to a stand-alone battery system [
51].
The utilisation of hybrid energy storage can be classified as the type of measure store energy at the production site hierarchy level within the operation phase. Technical requirements can be deduced from this classification. First, a hybrid storage system must be available. In addition, both the capacity of the battery and the flywheel must be designed for the desired specific application. Furthermore, the implementation requires a sophisticated control device as well as a communication interface for the control signal in order to optimise the charging and discharging process and, in particular, the interaction of both storage systems. Intelligent charging management is required for the battery storage system in particular due to battery ageing effects. To implement the intelligent charging management of the storage unit, a forecast of the electrical power at the production system level is required.
The power difference for the flywheel is 100 kW, which is delivered over approx. 2 min. The battery storage has an energy content of 120 kWh. The discharge management of the battery specifies that discharging is performed with a power difference of 120 kW over 30 min. The power difference is then reduced for the remaining energy content. The storage unit thus has a power difference of 220 kW and can be classified in the >100 kW category. However, the power difference of hybrid storage systems can be many times greater in industry. The holding time is 32 min and is categorised as up to one hour. When the control device is given the signal to activate the storage device, the loading or unloading of the system starts within seconds. Therefore, the planning horizon and reaction duration can be classified in shorter than 5 min.
Due to the power difference of greater than 100 kW but smaller than 1 MW the IDSI measure can only be offered on the energy-only markets. With regard to the reaction and planning duration, all markets are eligible. Due to the holding period, the intraday continuous, intraday market, and day-ahead market are possible. However, the intraday segment may be more suitable due to its 15 min units. In addition, the IDSI measure can be used internally, e.g., for peak shaving. Most industrial production systems tend to create high power peaks during operation which can be caused by machinery startup for example. As power peaks impair the power quality as well as the grid stability, energy operators demand critical peak prices. Therefore, an internal use of the IDSI measure consists of utilising the stored energy to reduce the peak power and therefore the peak costs.
5.2. Electrically Heated Oil Bath
The system under consideration is an electrically heated oil bath used for quenching components after heat treatment. The flexibility potential is created by exploiting the tolerance range for the temperature in the oil bath. The temperature must be kept between an upper and lower limit, which offers flexibility for the operation of the electric heater. As long as the temperature limits are not violated, the switching times of the electrical heating element can be varied over time.
The measure can be categorised as store energy (inherently), since the tolerance of the temperature of the oil bath is used. Since a single component (the electric heating element) is switched, the DR measure can be classified at hierarchy level component. It is a measure of the operation phase since the configuration of the system is not changed.
Resulting from this classification, we can deduce technical and organisational requirements for implementing the measure. The VDI guideline 5207 states for inherent energy storage that the system needs adequately wide tolerance limits, e.g., in a hysteresis control, with enough inherent storage capacity [
6]. The oil bath is hysteresis controlled and has an inherent storage capacity of 0.81 kWh. Compared to the nominal power of the heating element (2.8 kW), the storage capacity is relatively small which means that loading cycles will be fast. This information is important for the economical perspective of implementing the DR measure since it affects the holding duration. In addition to the recommendation of the VDI guidelines, the implementation requires an adjustment of the control programming on the device level as well as a communication interface for external control signals or the price/incentive signals for internal optimisation.
Only short-term and spontaneously retrievable options are available for monetising since the switching cycles of the heating element are short (a few minutes) and the availability of the measure depends on various external influences (e.g., size and timing of the components), which cannot be reliably predicted in the long term. Hence, the planning horizon is between five minutes and one hour and the reaction and holding duration is less than five minutes. The example system in the ETA Research Factory has an available power difference of 2.8 kW which means that it is categorised into less than 100 kW.
Following the methodology in
Section 4, the measure is not eligible for trading on energy-only or capacity markets due to the small available power difference. However, comparable systems in larger-scale industry can be about 1000 times larger (67,000 L [
52] as compared to 66 litres in the ETA Research Factory) which would make these monetisation options interesting. Due to the short cycles but longer planning horizon, the only eligible monetisation option for this specific measure would be internal use. For internal use, such as load balancing, a forecast of the electrical power at the production system level is required.
5.3. Cleaning Machine
Here we consider IDSI measures on an industrial aqueous cleaning machine with batch process. The cleaning machine consumes electrical energy to heat the cleaning liquid, to drive a motor that moves the components in the cleaning chamber, to drive the pump that pressurises the cleaning liquid, and to heat the compressed air that is used to dry the components after cleaning. Between the individual cleaning steps, the process can be paused and thus shifted to more favourable times in terms of energy. The duration of the entire cleaning process of the machine is 15 min and the cleaning process must be completed within one hour. If we look at the cleaning process, according to measurements, we can identify two main process steps that have a high energy consumption: the cleaning step in which the components are sprayed with cleaning liquid (3.43 kW; 0.57 kWh) and the drying step (9.35 kW; 0.11 kWh). Hence the power difference is less than 100 kW.
Since the process is interrupted, we categorise the measure as the category interrupt process, although if the cleaning process is the first process step, it could be shift start of job. Hence the hierarchy level will be on manufacturing control or on the manufacturing level. As mostly components of the cleaning machine are affected, we categorise this measure at machine hierarchy level. This measure changes the operation of the plant so that we classify it under the operating phase. Based on this categorisation, we can now assess modifications necessary to implement the IDSI measure: In order to pause the machine, the programme code for controlling the individual components must be adapted at the machine level so that the machine can react automatically to pause commands. The implementation in the code can already be done for works prior to the operating phase or it can also be changed as a retrofit on an existing operating machine.
The individual cleaning steps have a duration of more than 5 min, which is why we conservatively evaluate the planning horizon as 5 min to one hour. The reaction duration of the system is less than 5 min and the holding duration is up to one hour, since the cleaning process must be completed after one hour. Based on this classification and the small power demand of the cleaning machine we determine internal use as the matching market option. The optimisation of on-site power generation is a suitable use case for internal use of flexibility. In this case, a load forecast of the electrical power consumption on the production system level is necessary. However, the pooling of multiple machines can also be an option to participate on the energy-only markets [
46]. Since the smallest tradable unit on the energy-only markets is 100 kW, the cleaning machine must be controlled together with other machines if we want to trade the IDSI there. For the drying step, this is already possible with eleven cleaning machines. We assume that this number is reached at larger production sites. However, communication between machines is then also necessary for synchronisation, so that higher hierarchy levels may have to be included.
5.4. Machine Tool
The system under consideration is an automated CNC grinding machine with an internal buffer of produced parts. The production machine is part of a flow production line with an average takt time of 101 s per part. Since three grinding machines are available in the system, the machine takt is 302 s. Since the production cycle time is only 159 s per part, the machine can be operated flexibly by producing more parts than needed into the buffer storage while electricity prices are low and halting or slowing production while electricity prices are high.
The type of measure is either shift start of job or interrupt job depending on when the measure takes place. In this case, we assume that the production start of single parts is shifted and therefore the type of measure is shift start of job. The measure can be classified on machine level in the operation phase. For this type of measure, the VDI guideline 5207 states that the order should not be time critical and enough buffer storage should be available. In addition, for implementation, we required an optimisation framework for optimising the start times of jobs depending on the market signals as well as the specific energy consumption of the production machine in ramp-up, production, ramp-down, and standby times. A manufacturing execution system should be used for production fine planning.
The planning horizon is greater than twelve hours since the optimisation of the production plan is carried out using day-ahead electricity market prices. The reaction duration cannot be specified exactly in this case. It can be assumed to be between five minutes and one hour since this would typically be enough to build up storage for a DR measure. The achievable holding duration depends on the storage capacity. In this case, it is assumed to be between five minutes and one hour. The power difference available for this measure is the delta between power consumption in operational and standby mode (3.6 kW). Thus, it is categorised into smaller than 100 kW. The power difference is too small to directly participate in energy-only or capacity markets with a single machine. However, the pooling of multiple machines can be an option to participate in spot markets such as intraday or day-ahead market [
46]. Alternatively, internal optimisation for peak shaving or self-generation is an option.
5.5. Hydraulic Pressure System
Denkena et al. state that there is a high potential for energy savings in the design and operation of machine tools in the industrial sector [
53]. In particular, cooling systems, cutting fluid supplies, and hydraulic pressure systems have a great impact on the overall energy demand. Hydraulic pressure systems are typically accountable for up to 10% of the overall electrical energy demand [
54] with especially high energy requirements in idle times due to leakage losses [
55]. Therefore, the energy efficiency of machine tools can be increased by replacing the hydraulic components with more efficient alternatives.
With this measure, the overall energy requirements of the machine tool is reduced. Therefore, changing the hydraulic pressure system of a machine tool is an energy efficiency or CO2eq reduction measure. Since a single component in the machine tool is changed, the measure can be classified at component level. The configuration of the system machine tool is changed, therefore the measure can be grouped within the retrofit phase.
In order to determine the right hydraulic pressure system for the existing conditions, the production requirements, such as the ratio between operation, standby, and idle times of the machine tool, must first be specified. In addition, the technical requirements (e.g., too frequent charging cycles lead to wear in the motor) must be identified in order to optimise the hydraulic pressure system. Based on the requirements determined in this way, a hydraulic pressure system can be selected.
In regard to the achievable power difference, Abele et al. optimised the hydraulic pressure system of a machine tool from the ETA Research Factory and achieved a 91% reduction from an average of 877 W power consumption to 77 W [
56]. Thus, for a single machine tool, the power difference can be classified as smaller than 100 kW. However, this value can multiply considerably with a large number of machines, as is common in industry. As this measure is an energy efficiency or CO2eq reduction and not a flexibility measure, the planning horizon, the reaction duration, and the holding duration can be classified in long-term measure. Therefore, participation in electricity markets in the sense that was introduced in
Section 3.2 is not possible. However, this IDSI measure is remunerated by return on investment through lower overall energy costs.
5.6. Cooling Supply System
The system under consideration is a central cooling supply system of a factory including a chiller, cold storage, and a production system with time-varying cooling demand. The cooling supply system can be operated in a flexible way using the storage capacity of the cold storage. The cooling demand of the production system needs to be covered by the supply system at any time. Therefore, an accurate forecast of the cooling demand is needed. With this, the chiller can operate according to different operating strategies, for instance, optimal energy purchasing.
This measure uses the storage capacity of the cooling supply system, therefore the type of measure can be classified as store energy. Since the cooling supply system is a central supply system for the entire factory which is flexibly controlled during operation, the measure can be classified at the hierarchy level production site in the operation phase. From this classification and use case definition, we can derive requirements for the implementation. Following the VDI guideline 5207, adequate energy storage capacity must exist and the provision of the stored useful energy must involve consumption of electrical energy in order to classify as a DR measure. This is the case if the cold is provided by a compression chiller as in the ETA Research Factory. Further requirements we could identify are a 24 h forecast of cooling energy consumption of the production system, the possibility to control the compression chiller’s operation, as well as an optimisation system for the operation strategy depending on market prices and predicted energy demand.
The planning horizon for such a measure can be categorised as up to twelve hours, since the operation strategy may be adjusted according to the day-ahead as well as intraday electricity market. Reaction time is less than one hour according to the increments of the markets. The holding duration is flexible depending on the storage capacity [
48]. In this case, it is assumed to be less than twelve hours. The chiller in the ETA Research Factory has a power difference of 5.2 kW and therefore classifies as less than 100 kW.
Similar to the machine tool example (
Section 5.4), in most cases, the power consumption of a single utility system is too small to participate in spot markets. However, it is possible to combine supply systems with each other or in combination with machine tools to participate e.g., in the intraday or day-ahead market [
46]. Similarly, internal operation strategy optimisation for peak load reduction or self-generation can be an option.
5.7. Production System
Entire production systems can be seen as an extension of the machine tool use case. The production system consists of multiple machines and multiple storage locations for intermediate and produced parts.
Energy consumption of the production system depends on the type of job, the type of machine the job is produced on, and the time at which the job is produced. These factors can be influenced by changing the job sequence to create EF. For example, it might make sense to produce a job with high energy demand on a more efficient machine and during a time of low greenhouse gas emissions for energy generation.
The type of this measure can be classified as change job sequence. The hierarchy level is the production system and the measure is grouped in the operation phase of the FLC. Since the entire production system is considered the conditions vary widely but the power difference could exceed 100. The planning horizon, as well as the reaction and holding duration, are greater than twelve hours.
Since this measure is implemented on the production system level of the automation hierarchy, all production machines must be able to operate with a high degree of automation. Additionally, an overarching automation system, for example as provided by a Manufacturing Execution System, should be in place. This is required since the machines must be able to respond to changes in electricity prices during their operation (classified in the operation phase of the FLC).
Depending on the specific production system and constraints regarding the operation, this measure can be suitable for participation in energy-only markets such as the day-ahead market due to the large power differences that can be achieved. The measure is not suitable, however, for the participation in capacity markets or in the intraday market since power differences cannot be achieved quickly enough.
5.8. Photovoltaic System
Photovoltaic (PV) systems are installed to increase the share of renewable energies and reduce the factory load profile in the long term. Since the overall share of renewable energies increases with an installation of PV, it is considered to be a glsCO2eq reduction measure. The measure can be classified at the production site hierarchy level either within the planning phase of the FLC if a PV is installed on a new building or within the retrofit phase if the PV system is installed on an existing factory. In this case, we assume that a PV system is considered in the planning phase of the factory. As this measure is a CO2eq reduction measure, the planning horizon, reaction duration, and holding duration are classified as long-term measure. A PV system on the ETA Research Factory could have an installed power of about 46.5 kWp (source) on about 100 of suitable roof area. That means the power difference is classified as less than 100 kW. On larger roof areas, an equivalently larger power difference can be achieved.
Resulting from the classification, we can deduce some requirements for the installation of PV systems: The installation should be considered in the factory planning phase but can also be added as a retrofit. Planning and implementation should be overlooked on the production site hierarchy level. Therefore, boundary conditions of the factory such as the available roof area, the statics of the hall and the electrical connection must be considered in order to determine whether and which system can be installed and in which size. Considering monetisation options, PV is a special case since its load profile cannot be influenced actively. Therefore, the best option for monetisation is internal use (optimisation of self-generation). Participation in electricity markets in the sense that was introduced in
Section 3.2 is not possible.
6. Discussion and Conclusions
Industrial Demand-Side Integration is playing a greater role in the secure and reliable operation of future power systems. One significant problem is that the term Demand-Side Integration has so far only been described and defined from the power supply side. However, to achieve a
-neutral world, the industrial sector as the largest consumer of electricity must contribute as well. This can be achieved through the implementation of Industrial Demand-Side Integration measures. Hence, clarity in the definition of the concept of Industrial Demand-Side Integration and its characteristics is of high importance. This article contributes to this clarity by defining the term Industrial Demand-Side Integration and distinguishing it from the existing terms Demand-Side Management, Demand-Side Integration, Demand Response, and Energy Flexibility. More clarity in the definitions should help to further raise awareness and facilitate discussion about the topic of Industrial Demand-Side Integration. Overall, Industrial Demand-Side Integration is divided into long-term and short-term measures as shown in
Figure 1. Demand Response schemes are short-term operational measures and Energy Flexibility describes the ability of a factory or production system to implement Demand Response schemes.
Another contribution of this article is a methodology for the classification and characterisation of Industrial Demand-Side Integration measures. The methodology consists of two main steps which are aimed towards answering each of the research questions introduced in
Section 1, respectively. The first step is to define use cases and is aimed at answering the first research question by providing a clear structure for the classification of use cases. This stop also contributes to the second research question by improving awareness of organisational requirements. The second step is to determine monetisation options—it answers the second research question by giving guidance on the evaluation of the economic potential of Industrial Demand-Side Integration measures.
The first step of the methodology, the classification and characterisation of Industrial Demand-Side Integration use cases, helps to provide a better understanding of possible measures aimed at adjusting the load profile of industrial consumers and is partially based on [
6]. Existing classifications lack the ability to provide insight into organisational requirements, which is why they are extended by additional categories (hierarchy level and factory life cycle) in this article. Other categories introduced in this article (power difference, planning horizon, reaction duration, and holding duration) help in the evaluation of monetisation options. We chose these categories to be easy to evaluate while providing as much insight into the Industrial Demand-Side Integration use cases as possible. Other contributions such as [
7] focus on the information technology side of the implementation of Industrial Demand-Side Integration, which offers more flexibility but is also far more complex to apply. Chen et al. focus more on the data-driven planning and scheduling as well as market mechanisms [
8].
The second step of the methodology is the evaluation of monetisation options. This evaluation is achieved using information collected during the first step, such as power difference and planning horizon. The information is overlayed with the characteristics of the respective electricity market. In this article, we introduced visualisations that help to simplify this process. This is where a limitation of the developed methodology comes into play: wholesale electricity markets differ depending on the region. Therefore, it is not possible to provide a general solution for the second stage of the methodology. In order to determine the monetisation options of the measures, it is therefore always necessary to first adapt the requirements and visualisations in terms of the power difference, planning horizon, and reaction and holding duration to the respective markets. The methodology also does not provide absolute values regarding how much could be earned through the monetisation of a specific measure. This is where other research such as [
9], analysing the volatility and development of price levels in energy markets, is relevant. An approach towards economic classification is presented in [
10].
Finally, the developed methodology is applied to eight examples from the ETA Research Factory in order to demonstrate the procedure and discuss the derived requirements as well as monetisation options. The application proves that the research questions were answered satisfactorily. As shown in
Figure 8, all measures could be classified successfully. The acquisition of required information was relatively easy since most of the information is known to process experts or available from data sheets of affected equipment. The exemplary application of the methodology should provide some interesting examples of Industrial Demand-Side Integration measures and it should also facilitate its application by the industry.
Looking at the exemplary use cases presented, one main conclusion can be drawn. Many of the demand response measures at the machine, component, or process level have a relatively small power difference. Therefore, the aggregation of Demand Response measures of individual consumers into larger entities will play an even greater role in the dissemination of Industrial Demand-Side Integration in the future. As shown in [
11], wide dissemination of Demand-Side Integration can lead to a reduction in the need for backup energy of up to one third and increases the potential integration of Photovoltaic energy.
The improvements in the clarity of the term Industrial Demand-Side Integration, as well as the methodology to identify feasible measures in the industry, can facilitate the transfer of results from research activities on Energy Flexibility solutions into the industry. Furthermore, the developed classification scheme offers additional benefits, as it provides a uniform basis for evaluating and comparing Industrial Demand-Side Integration measures in companies. This in turn can lead to greater confidence in Industrial Demand-Side Integration solutions and therefore results in a stabilised power grid with increased integration of renewable energy generation.


 ,
, 


