
Optimization of Energy Efficiency, Operation Costs, Carbon Footprint and Ecological Footprint with Reverse Osmosis Membranes in Seawater Desalination Plants


Abstract
:1. Introduction
2. Materials and Methods
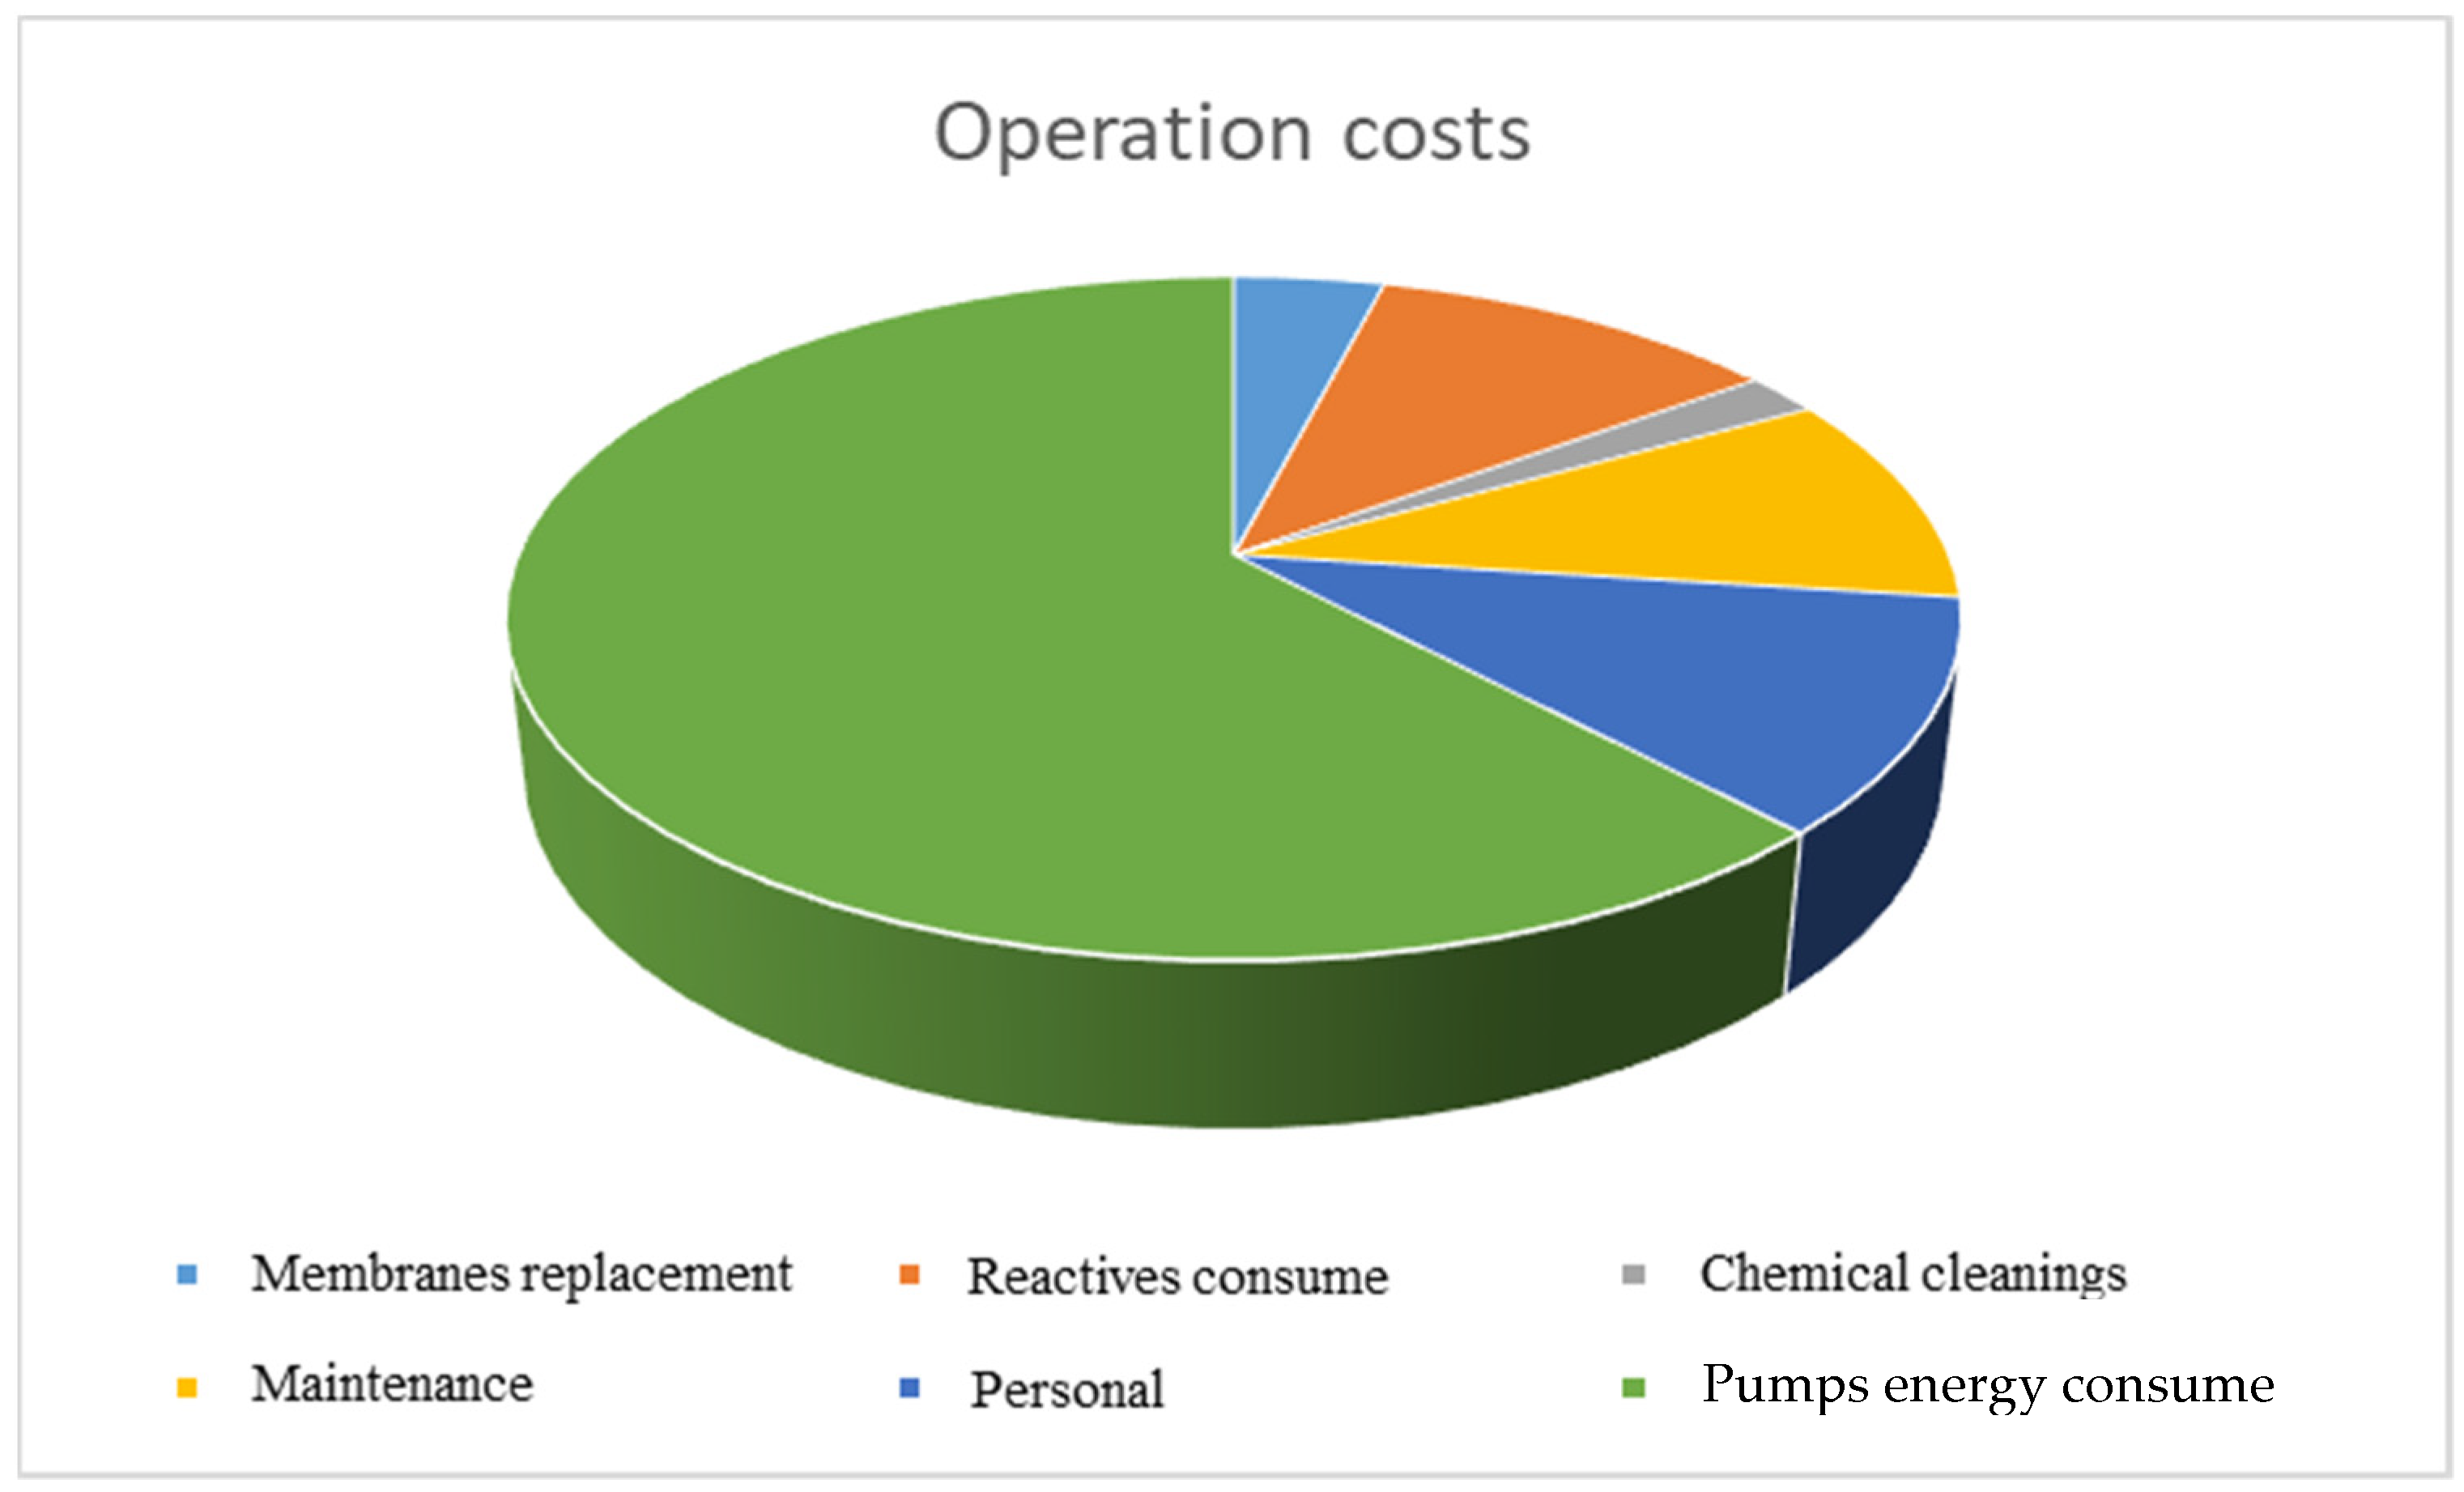
General Analysis of Element and Operation Costs
3. Results
4. Conclusions
- -
- By reducing the operation costs outlined in this article, it is possible to improve the energy efficiency of the system.
- -
- To reduce the carbon footprint and ecological footprint, the energy consumption needs to be decreased.
- -
- There are different results regarding the optimization of energy efficiency and environmental footprints.
- -
- These conclusions of the study may serve as a tool for the decision-making processes related to improving energy efficiency in seawater reverse osmosis plants.
- -
- The main objective was to study the improvements in seawater desalination based on the reduction of energy consumption in the production of fresh water.
- -
- Reverse osmosis is the most suitable process due to its lower energy consumption per cubic meter of water produced.
- -
- Reverse osmosis membranes with higher surface area have lower energy consumption, as well as energy recovery systems to recover the brine pressure and introduce it in the system, reducing the energy consumption of the desalination process.
- -
- Considering the operation, maintenance and handling of the membranes is also important in energy savings, in order to improve energy efficiency.
- -
- Energy consumption depends on the permeate water quality required and the model of the reverse osmosis membrane installed in the desalination plant.
Author Contributions
Funding
Institutional Review Board Statement
Informed Consent Statement
Data Availability Statement
Conflicts of Interest
References
- Kurihara, M. Seawater Reverse Osmosis Desalination. Membranes 2021, 11, 243. [Google Scholar] [CrossRef]
- Ruiz, A.; Melian-Martel, N.; Nuez, I. Short Review on Predicting Fouling in RO Desalination. Membranes 2017, 7, 62. [Google Scholar] [CrossRef] [Green Version]
- Leon, F.; Ramos, A.; Vaswani, J.; Mendieta, C.; Brito, S. Climate Change Mitigation Strategy through Membranes Replacement and Determination Methodology of Carbon Footprint in Reverse Osmosis RO Desalination Plants for Islands and Isolated Territories. Water 2021, 13, 293. [Google Scholar] [CrossRef]
- Sadhwani, J.J.; Veza, J.M. Desalination and energy consumption in Canary Islands. Desalination 2008, 221, 143–150. [Google Scholar] [CrossRef]
- Schallenberg-Rodriguez, J.; Veza, J.M.; Blanco-Marigorta, A. Energy efficiency and desalination in the Canary Islands. Renew. Sustain. Energy Rev. 2014, 40, 741–748. [Google Scholar] [CrossRef]
- Cohen, Y.; Semiat, R.; Rahardianto, A. A perspective on reverse osmosis water desalination: Quest for sustainability. AIchE J. 2017, 63, 1771–1784. [Google Scholar] [CrossRef]
- Frank, W.; de Fluidos, M. Hemos Tenido en Cuenta el Coste a Partir un Valor Medio de la Tarifa Industrial Actual 3.1A de OHMIA, 6th ed.; McGraw-Hill: NewYork, NY, USA, 2008; ISBN 978-84-481-6603-8. Available online: https://ohmia.es/industria/ (accessed on 20 July 2021).
- Burn, S.; Hoang, M.; Zarzo, D.; Olewniak, F.; Campos, E.; Bolto, B.; Barron, O. Desalination techniques—A review of the opportunities for desalination in agriculture. Desalination 2015, 364, 2–16. [Google Scholar] [CrossRef]
- León, F.A.; Ramos, A. Analysis of high efficiency membrane pilot testing for membrane design optimization. Desalination Water Treat. 2017, 73, 208–214. [Google Scholar] [CrossRef]
- Jiménez, C. Seawater temperature measured at the surface and at two depths (7 and 12 m) in one coral reef at Culebra Bay, Gulf of Papagayo. Costa Rica. Rev. Biol. Trop. 2001, 49 (Suppl. 2), 153–161. [Google Scholar]
- Du, Y.; Liang, X.; Liu, Y.; Xie, L.; Zhang, S. Economic, Energy, Exergo-Economic, and Environmental Analyses and Multiobjective Optimization of Seawater Reverse Osmosis Desalination Systems with Boron Removal. Ind. Eng. Chem. Res. 2019, 58, 14193–14208. Available online: http://pubs.acs.org/action/showCitFormats?doi=10.1021/acs.iecr.9b01933 (accessed on 10 July 2021). [CrossRef]
- Penela, A.C. Utilidad de la Huella Ecológica y del Carbono en el ámbito de la Responsablidad Social Corporativa (RSC) y el Ecoetiquetado de Bienes y Servicios. 2009. Available online: http://www.eumed.net/rev/delos/08 (accessed on 10 June 2021).
- Consejería de Medio Ambiente de la Junta de Andalucía. La Huella Ecológica de Andalucía, una Herramienta Para Medir la Sostenibilidad; Junta de Anadalucía: Seville, Spain, 2006. [Google Scholar]
- Ministerio de Medio Ambiente Medio Rural y Marino. Análisis de la Huella Ecológica de España; Ministerio de medio ambiente medio rural y marino: Madrid, Spain, 2008. [Google Scholar]
- Javier, L.P. Propuesta Metodológica Para la Determinación de la Huella Ecológica en el Sector Hotelero. Ph.D. Thesis, Universidad de Las Palmas de Gran Canaria, Las palmas de Gran Canaria, Spain, 2015. [Google Scholar]
- Dirección General de Industria y Energía. Anuario Energético de Canarias 2017; Gobierno de Canarias: Las Palmas de Gran Canaria, Spain, 2017. [Google Scholar]
- Jafari, M.; Vanoppen, M.; van Agtmaal, J.M.C.; Cornelissen, E.R.; Vrouwenvelder, J.S.; Verliefde, A.; van Loosdrecht, M.C.M.; Picioreanu, C. Cost of founling in full-scale reverse osmosis nanofiltration installations in the Netherlands. Desalination 2021, 500, 114865. [Google Scholar] [CrossRef]
- Latorre, F.J.G.; Báez, S.O.P.; Gotor, A.G. Energy performance of a reverse osmosis desalination plant operating with variable pressure and flow. Desalination 2015, 366, 146–153. [Google Scholar] [CrossRef]
- Koutsou, C.P.; Kritikos, E.; Karabelas, A.J.; Kostoglou, M. Analysis of Temperature effects on the specific energy consumption in reverse osmosis desalination processes. Desalination 2020, 476, 114123. [Google Scholar] [CrossRef]
- Avlonitis, S.A.; Kouroumbas, K.; Vlachakis, N. Energy consumption and membrane replacement cost for. Desalination 2003, 157, 151–158. [Google Scholar] [CrossRef]
- Elmaadawy, K.; Kotb, M.; Elkadeem, M.R.; Sharshif, S.W.; Dan, A.; Moawad, A.; Liu, B. Optimal sizing and techno-enviroeconomic feasibility assessment of large-scale reverse osmosis desalination powered with hybrid renewable energy sources. Energy Convers. Manag. 2020, 224, 113377. [Google Scholar] [CrossRef]
- Busch, M.; Meckols, W.E. Reducing energy consumption in seawater desalination. Desalination 2020, 165, 299–312. [Google Scholar] [CrossRef]
- Voutchkov, N. Energy use for membrane seawater desalination—Current status and trends. Desalination 2018, 431, 2–14. [Google Scholar] [CrossRef]
- Rana, M.W.; Chen, B.; Hayat, T.; Alsaedi, A. Energy consumption for water use cycles in different countries: A review. Appl. Energy 2016, 178, 868–885. [Google Scholar]
- Altmann, T.; Das, R. Process improvement of sea water reverse osmosis (SWRO) and subsequent decarbonization. Desalination 2021, 499, 114791. [Google Scholar] [CrossRef]
- Wittholz, M.K.; Neil, B.O.; Colby, C.B.; Lewis, D.M. Estimating the cost of desalination plants using a cost database. Desalination 2008, 229, 10–20. [Google Scholar] [CrossRef]
- Heihsel, M.; Lenzen, M.; Malik, A.; Geschke, A. The carbon footprint of desalination. An input-output analysis of seawater reverse osmosis desalination in Australia 2005–2015. Desalination 2019, 454, 71–81. [Google Scholar] [CrossRef]
- Giwa, A.; Akther, N.; Dufour, V.M.; Hasan, S.W. A critical review on recent polymeric and nano-enhanced membranes for reverse osmosis process. RSC Adv. 2015, 6, 8134–8163. [Google Scholar] [CrossRef]
- Kim, J.; Park, K.; Yang, D.R.; Hong, S. Talnsive review of energy consumption of sea water reverse osmosis desalination plants. Appl. Energy 2019, 254, 113652. [Google Scholar] [CrossRef]
- Alanezi, A.A.; Altaee, A.; Sharif, A.O. The effect of energy recovery device and feed flow rate on the energy efficiency of reverse osmosis process. Chem. Eng. Res. Des. 2020, 158, 12–23. [Google Scholar] [CrossRef]
- Gualous, H.; Bouquain, D.; Berthon, A.; Kauffmann, J.M. Experimental study of supercapacitor serial resistance and capacitance variations with temperature. J. Power Sources 2003, 123, 86–93. [Google Scholar] [CrossRef]
- Brouji, H.E.; Vinassa, J.-M.; Briat, O.; Bertrand, N.; Woirgard, E. Ultracapacitors self discharge modelling using a physical description of porous electrode impedance. In Proceedings of the 2008 IEEE Vehicle Power and Propulsion Conference, Harbin, China, 3–5 September 2018. [Google Scholar]
- Tal, A. Addressing Desalination’s Carbon Footprint: The Israeli Experience. Water 2018, 10, 197. [Google Scholar] [CrossRef] [Green Version]
- Ruiz-Garcia, A.; De la Nuez, I. Feed Spacer Geometries and Permeability Coefficients. Effect on the Performance in BWRO Spriral-Wound Membrane Modules. Water 2019, 11, 152. [Google Scholar] [CrossRef] [Green Version]


| Operation Cost | Nomenclature | Percentage (%) |
|---|---|---|
| Membranes replacement | Cm | 4 |
| Reagents consumption | Cr | 11 |
| Chemical cleanings | Cq | 2 |
| Maintenance | Cm | 10 |
| Staff | Cp | 11 |
| Pumps energy consumption | Ce | 62 |
| Category Surfice | ABS. Average (tCO2/ha/Year) | Surface (Millions ha) | % | ABS. Hectarea Equivalent (tCO2/ha/Year) | Equivalence Factor (fi) |
|---|---|---|---|---|---|
| Forests | 19.35 | 3858.10 | 7.56 | 1.46 | 9.66 |
| Crops | 8.09 | 1958.32 | 3.84 | 0.31 | 4.04 |
| Medows and pastures | 2.44 | 3363.72 | 6.59 | 0.16 | 1.22 |
| Oceans, seas, etc… | 0.10 | 36,010.00 | 70.60 | 0.07 | 0.05 |
| Deserts | 0.00 | 3600.00 | 7.06 | 0.00 | 0.00 |
| Others | 0.00 | 2217.06 | 4.35 | 0.00 | 0.00 |
| Total Surface | 51,007.20 | 2.00 | 1.00 |
| Year | Pressure (bar) | Power (kW) | Energy (kWh/d) | Cost (€/d) |
|---|---|---|---|---|
| 0 | 66.6 | 10,023.5 | 240,564.9 | 21,625.6 |
| 1 | 68.4 | 10,294.4 | 247,066.7 | 22,210.1 |
| 2 | 69.6 | 10,475.0 | 251,401.2 | 22,599.7 |
| 3 | 70.8 | 10,655.7 | 255,735.7 | 22,989.4 |
| 4 | 72.0 | 10,836.3 | 260,070.2 | 23,379.0 |
| 5 | 73.2 | 11,016.9 | 264,404.7 | 23,768.7 |
| Year | Pressure (bar) | Power (kW) | Energy (kWh/d) | Cost (€/d) |
|---|---|---|---|---|
| 0 | 69.5 | 10,460.0 | 251,039.9 | 22,567.2 |
| 1 | 72.6 | 10,926.5 | 262,237.5 | 23,573.8 |
| 2 | 74.4 | 11,197.4 | 268,739.2 | 24,158.3 |
| 3 | 76.0 | 11,438.3 | 274,518.5 | 24,677.8 |
| 4 | 77.5 | 11,664.1 | 279,936.7 | 25,164.9 |
| 5 | 78.9 | 11,874.8 | 284,993.6 | 25,619.5 |
| Year | Pressure (bar) | Power (kW) | Energy (kWh/d) | Cost (€/d) |
|---|---|---|---|---|
| 0 | 62.9 | 9466.6 | 227,200.2 | 20,424.1 |
| 1 | 65.1 | 9797.7 | 235,146.8 | 21,138.5 |
| 2 | 66.3 | 9978.3 | 239,481.3 | 21,528.2 |
| 3 | 67.3 | 10,128.9 | 243,093.4 | 21,852.9 |
| 4 | 68.3 | 10,279.4 | 246,705.5 | 22,177.6 |
| 5 | 69.2 | 10,414.9 | 249,956.4 | 22,469.8 |
| Name of the Plant | Production (m3/d) | Consume (kWh/m3) | Island | Habitants per Plant | Renewable Solution |
|---|---|---|---|---|---|
| Cercado de Don Andrés | 200 | 3.5 | Lanzarote | Irrigation | Photovoltaic |
| Lanzarote III 1 | 10,000 | 3.5 | Lanzarote | 10,541 | Wind |
| Lanzarote III 2 | 5000 | 3.5 | Lanzarote | 5271 | Wind |
| Lanzarote III 3 | 5000 | 3.5 | Lanzarote | 5271 | Wind |
| Lanzarote IV | 20,000 | 3.5 | Lanzarote | 21,083 | Wind |
| Lanzarote V | 18,000 | 2.4 | Lanzarote | 18,975 | Wind |
| Aeropuerto | 700 | 3.04 | Lanzarote | 18,327 | Photovoltaic |
| Agua Park | 30 | 3.04 | Lanzarote | 500 | Photovoltaic |
| Apartamentos Ficus | 60 | 3.5 | Lanzarote | 120 | Photovoltaic |
| Apartamentos Puerto Tahiche | 150 | 3.5 | Lanzarote | 300 | Photovoltaic |
| Apartamentos Trebol | 80 | 3.5 | Lanzarote | 160 | Photovoltaic |
| Ercros | 2500 | 3.5 | Lanzarote | 11,057 | Wind |
| Ercros | 2200 | 3.5 | Lanzarote | 9731 | Wind |
| Famara | 350 | 3.5 | Lanzarote | 700 | Photovoltaic |
| Hotel Golf y Mar | 90 | 3.5 | Lanzarote | 180 | Photovoltaic |
| Hotel Gran Meliá Salinas | 400 | 2.61 | Lanzarote | 800 | Photovoltaic |
| Hotel Playa Verde | 250 | 3.5 | Lanzarote | 500 | Photovoltaic |
| Hotel Teguise Playa | 250 | 3.5 | Lanzarote | 500 | Photovoltaic |
| La Galea | 150 | 3.04 | Lanzarote | 300 | Photovoltaic |
| Lanzarote Beach Club II | 70 | 3.04 | Lanzarote | 140 | Photovoltaic |
| Las Arenas. Costa Teguise | 80 | 3.04 | Lanzarote | 160 | Photovoltaic |
| Playa Roca | 250 | 3.04 | Lanzarote | 500 | Photovoltaic |
| Apartamentos Don Paco Castilla | 320 | 2.61 | Lanzarote | 640 | Photovoltaic |
| Apartamentos Sol Lanzarote | 350 | 2.61 | Lanzarote | 700 | Photovoltaic |
| Cdad Apartamentos CAMP | 2.61 | Lanzarote | Tourism | Photovoltaic | |
| Holiday Land S.A. | 3000 | 3.5 | Lanzarote | 6000 | Wind |
| Hotel Fariones Playa | 500 | 3.5 | Lanzarote | 1000 | Photovoltaic |
| Hotel Playa Azul | 300 | 3.5 | Lanzarote | 600 | Photovoltaic |
| Hoteles Canarios S.A. | 3.5 | Lanzarote | Tourism | Photovoltaic | |
| Iberhotel | 3.5 | Lanzarote | Tourism | Photovoltaic | |
| Zorilla | 40 | 3.04 | Lanzarote | 80 | Photovoltaic |
| Hotel Jameos Playa | 336 | 2.61 | Lanzarote | 672 | Photovoltaic |
| La Santa Sport I | 250 | 3.5 | Lanzarote | 500 | Photovoltaic |
| La Santa Sport II | 250 | 3.5 | Lanzarote | 500 | Photovoltaic |
| Ria La Santa | 400 | 3.5 | Lanzarote | 800 | Photovoltaic |
| Apartamentos Son Boy Family Suites | 500 | 3.04 | Lanzarote | 1000 | Photovoltaic |
| Bungalows Atlantic Gardens | 3.5 | Lanzarote | Tourism | Photovoltaic | |
| Costa los Limones S.A. | 350 | 3.5 | Lanzarote | 700 | Photovoltaic |
| Hotel Corbeta | 3.5 | Lanzarote | Tourism | Photovoltaic | |
| Hotel Costa Calero | 324 | 3.04 | Lanzarote | 642 | Photovoltaic |
| Marina Rubicón | 300 | 3.04 | Lanzarote | 600 | Photovoltaic |
| Hotel Paradise Island | 300 | 3.04 | Lanzarote | 600 | Photovoltaic |
| Hotel Princesa Yaiza | 500 | 3.04 | Lanzarote | 1000 | Photovoltaic |
| Hotel Rubicón Palace | 450 | 3.04 | Lanzarote | 900 | Photovoltaic |
| Inalsa Sur 1 | 600 | 3.5 | Lanzarote | 1859 | Photovoltaic |
| Inalsa Sur 2 | 1200 | 3.5 | Lanzarote | 3718 | Wind |
| Inalsa Sur 3 | 3000 | 3.5 | Lanzarote | 9294 | Wind |
| Janubio | 3.04 | Lanzarote | Tourism | Photovoltaic | |
| Lanzasur Club | 200 | 3.04 | Lanzarote | 400 | Photovoltaic |
| Playa Blanca S.A. | 3.5 | Lanzarote | Tourism | Photovoltaic | |
| Club Lanzarote | 4500 | 3.5 | Lanzarote | 9000 | Wind |
| Apartamentos Moromar | 250 | 3.5 | Lanzarote | 500 | Photovoltaic |
| Gea Fonds Numero Uno Lanzarote S.A. | 3.5 | Lanzarote | Tourism | Photovoltaic | |
| Grupo Rosa | 1000 | 3.5 | Lanzarote | 2000 | Wind |
| Hipotels | 300 | 3.5 | Lanzarote | 600 | Photovoltaic |
| Hotel Corona | 300 | 3.5 | Lanzarote | 600 | Photovoltaic |
| Hotel Costa Calero S.L. | 300 | 3.04 | Lanzarote | 600 | Photovoltaic |
| Hotel Sunbou | 500 | 3.04 | Lanzarote | 1000 | Photovoltaic |
| Isla Lobos | 100 | 3.04 | Lanzarote | 200 | Photovoltaic |
| Leas Hotel S.A. | 3.5 | Lanzarote | Tourism | Photovoltaic | |
| Niels Prahm | 3.5 | Lanzarote | Tourism | Photovoltaic | |
| Occidental Hotel Oasis | 250 | 3.04 | Lanzarote | 500 | Photovoltaic |
| Playa Flamingo | 200 | 3.04 | Lanzarote | 400 | Photovoltaic |
| Tjaereborg Timesharing, S.A. | 500 | 3.04 | Lanzarote | 1000 | Photovoltaic |
| Empresa Mixta de Aguas de Antigua, S.L. | 4800 | 3.04 | Fuerteventura | 11,948 | Wind |
| Grupo Turístico Barceló, S.L. | 240 | 3.5 | Fuerteventura | 480 | Photovoltaic |
| Aguas Cristóbal Franquis, S.L. | 1200 | 3.5 | Fuerteventura | 2400 | Wind |
| Anjoca Canarias, S.A. | 3000 | 3.5 | Fuerteventura | 6000 | Wind |
| Ramiterra, S.L. | 3000 | 3.04 | Fuerteventura | 6000 | Wind |
| Inver Canary Dos, S.L. | 300 | 3.04 | Fuerteventura | 600 | Photovoltaic |
| Suministros de Agua de La Oliva, S.A. | 9000 | 3.04 | Fuerteventura | 17,920 | Wind |
| Consorcio Abastecimiento de Aguas a Fuerteventura | 4000 | 3.04 | Fuerteventura | 7964 | Wind |
| Parque de Ocio y Cultura (BAKU) 1 | 300 | 3.04 | Fuerteventura | 600 | Photovoltaic |
| Parque de Ocio y Cultura (BAKU) 2 | 90 | 3.04 | Fuerteventura | 180 | Photovoltaic |
| RIU Palace Tres Islas | 100 | 3.5 | Fuerteventura | 200 | Photovoltaic |
| RIU Oliva Beach | 400 | 3.5 | Fuerteventura | 800 | Photovoltaic |
| Nombredo, S.L. | 500 | 3.5 | Fuerteventura | 1000 | Photovoltaic |
| Consorcio Abastecimiento de Aguas a Fuerteventura | 4400 | 3.5 | Fuerteventura | 20,539 | Wind |
| Puertito de la Cruz | 60 | 3.5 | Fuerteventura | 120 | Photovoltaic |
| Vinamar, S.A. | 3600 | 3.5 | Fuerteventura | 7200 | Wind |
| Fuercan, S.L. Cañada del Rio I | 2000 | 3.5 | Fuerteventura | 4000 | Wind |
| Fuercan, S.L. Cañada del Rio II | 1000 | 3.04 | Fuerteventura | 2000 | Wind |
| Fuercan, S.L. Cañada del Rio III | 2000 | 3.04 | Fuerteventura | 4000 | Wind |
| Club Aldiana | 200 | 3.5 | Fuerteventura | 400 | Photovoltaic |
| Erwin Sick | 30 | 3.5 | Fuerteventura | 60 | Photovoltaic |
| Esquinzo Urbanización II | 1200 | 3.5 | Fuerteventura | 2400 | Wind |
| Esquinzo Urbanización III | 1200 | 3.5 | Fuerteventura | 2400 | Wind |
| Hotel Sol Élite Los Gorriones 1 | 400 | 3.5 | Fuerteventura | 800 | Photovoltaic |
| Hotel Sol Élite Los Gorriones 2 | 400 | 3.5 | Fuerteventura | 800 | Photovoltaic |
| Stella Canaris I | 300 | 3.5 | Fuerteventura | 600 | Photovoltaic |
| Stella Canaris II | 300 | 3.5 | Fuerteventura | 600 | Photovoltaic |
| Stella Canaris III | 250 | 3.5 | Fuerteventura | 500 | Photovoltaic |
| Hotel H 10 Playa Esmeralda. | 250 | 3.5 | Fuerteventura | 500 | Photovoltaic |
| Hotel “Club Paraíso Playa” | 300 | 3.5 | Fuerteventura | 600 | Photovoltaic |
| Urbanización Costa Calma. | 110 | 3.5 | Fuerteventura | 220 | Photovoltaic |
| Urbanización Tierra Dorada. | 120 | 3.5 | Fuerteventura | 240 | Photovoltaic |
| Zoo-Parque La Lajita. | 1300 | 3.5 | Fuerteventura | 500 | Wind |
| Apartamentos Esmeralda Maris | 120 | 3.5 | Fuerteventura | 240 | Photovoltaic |
| Hotel H10 Tindaya | 280 | 3.5 | Fuerteventura | 560 | Photovoltaic |
| Aparthotels Morasol | 80 | 3.5 | Fuerteventura | 160 | Photovoltaic |
| Consorcio Abastecimiento de Aguas a Fuerteventura | 36,500 | 3.5 | Fuerteventura | 39,382 | Wind |
| Aeropuerto | 500 | 3.5 | Fuerteventura | 15,439 | Photovoltaic |
| GranTarajal | 4000 | 3.5 | Fuerteventura | 14,791 | Wind |
| Sotavento, S.A. | 2925 | 3.5 | Fuerteventura | 5850 | Wind |
| Arucas-Moya I | 10,000 | 3.5 | Gran Canaria | 45,419 | Wind |
| Granja experimental | 500 | 3.5 | Gran Canaria | Irrigation | Photovoltaic |
| Granja experimental | 500 | 3.5 | Gran Canaria | Irrigation | Photovoltaic |
| Comunidad Fuentes de Quintanilla | 800 | 3.04 | Gran Canaria | Irrigation | Photovoltaic |
| Granja experimental | 500 | 3.5 | Gran Canaria | Irrigation | Photovoltaic |
| Gáldar-Agaete I | 3000 | 3.5 | Gran Canaria | 16,199 | Wind |
| Gáldar II | 7000 | 3.04 | Gran Canaria | 37,799 | Wind |
| Agragua | 15,000 | 3.5 | Gran Canaria | Irrigation | Wind |
| Guía I | 5000 | 3.5 | Gran Canaria | 6962 | Wind |
| Guía II | 5000 | 2.61 | Gran Canaria | 6962 | Wind |
| Félix Santiago Melián | 5000 | 2.61 | Gran Canaria | Irrigation | Wind |
| Las Palmas III | 65,000 | 3.5 | Gran Canaria | 307,545 | Wind |
| Las Palmas IV | 15,000 | 2.61 | Gran Canaria | 70,972 | Wind |
| BAXTER S.A. | 100 | 3.5 | Gran Canaria | 200 | Photovoltaic |
| El Corte Inglés, S.A. | 300 | 3.5 | Gran Canaria | 3000 | Photovoltaic |
| Anfi del Mar I | 250 | 3.5 | Gran Canaria | 500 | Photovoltaic |
| Anfi del Mar II | 250 | 3.5 | Gran Canaria | 500 | Photovoltaic |
| AQUALING | 2000 | 3.04 | Gran Canaria | 4000 | Wind |
| Puerto Rico | 4000 | 3.04 | Gran Canaria | 8000 | Wind |
| Puerto Rico I | 4000 | 3.04 | Gran Canaria | 8000 | Wind |
| Hotel Taurito | 400 | 3.04 | Gran Canaria | 800 | Photovoltaic |
| Hotel Costa Meloneras | 300 | 3.04 | Gran Canaria | 600 | Photovoltaic |
| Hotel Villa del Conde | 500 | 3.04 | Gran Canaria | 1000 | Photovoltaic |
| Bahia Feliz | 600 | 3.5 | Gran Canaria | 1200 | Photovoltaic |
| Bonny | 8000 | 3.5 | Gran Canaria | Irrigation | Wind |
| Maspalomas I Mar | 14,500 | 3.5 | Gran Canaria | 19,572 | Wind |
| Maspalomas II | 25,200 | 3.04 | Gran Canaria | 34,016 | Wind |
| UNELCO II | 600 | 3.5 | Gran Canaria | Industrial | Photovoltaic |
| Ayto. San Nicolas | 5000 | 3.04 | Gran Canaria | 7608 | Wind |
| Asociación de agricultores de la Aldea | 5400 | 3.04 | Gran Canaria | Irrigation | Wind |
| Sureste III | 8000 | 3.5 | Gran Canaria | 133,846 | Wind |
| Aeropuerto I | 1000 | 3.5 | Gran Canaria | 24,791 | Wind |
| Salinetas | 16,000 | 3.5 | Gran Canaria | 102,424 | Wind |
| Aeropuerto II | 500 | 3.5 | Gran Canaria | 12,396 | Photovoltaic |
| Hoya León | 1500 | 3.5 | Gran Canaria | Irrigation | Wind |
| Bco. García Ruiz | 1000 | 3.5 | Gran Canaria | Irrigation | Wind |
| Mando Aéreo de Canarias | 1000 | 3.5 | Gran Canaria | 3000 | Wind |
| UNELCO I | 1000 | 3.5 | Gran Canaria | Industrial | Wind |
| Anfi del Mar | 1500 | 3.04 | Gran Canaria | 3000 | Wind |
| Norcrost. S.A. | 170 | 3.04 | Gran Canaria | 340 | Photovoltaic |
| Adeje Arona | 30,000 | 3.04 | Tenerife | 126,728 | Wind |
| Gran Hotel Anthelia Park | 3.04 | Tenerife | Tourism | Photovoltaic | |
| La Caleta (Ayto. Adeje) | 10,000 | 3.04 | Tenerife | 20,000 | Wind |
| UTE Tenerife Oeste | 14,000 | 2.16 | Tenerife | 40,000 | Wind |
| Hotel Sheraton La Caleta | 3.04 | Tenerife | Tourism | Photovoltaic | |
| Hotel Gran Tacande | 3.04 | Tenerife | Tourism | Photovoltaic | |
| Hotel Rocas de Nivaria. Playa Paraíso | 3.04 | Tenerife | Tourism | Photovoltaic | |
| Hotel Bahía del Duque. Costa Adeje | 3.04 | Tenerife | Tourism | Photovoltaic | |
| Siam Park | 3.04 | Tenerife | Tourism | Photovoltaic | |
| Tenerife-Sol S. A. | 3.04 | Tenerife | Tourism | Photovoltaic | |
| Hotel Conquistador, P. de Las Américas | 3.04 | Tenerife | Tourism | Photovoltaic | |
| Arona Gran Hotel, Los Cristianos | 3.04 | Tenerife | Tourism | Photovoltaic | |
| Bonny S.A., Finca El Fraile. | 3.04 | Tenerife | Tourism | Photovoltaic | |
| El Toscal, La Estrella (C. Regantes Las Galletas) | 3.04 | Tenerife | Tourism | Photovoltaic | |
| Complejo Mare Nostrum, P. Las Américas | 3.04 | Tenerife | Tourism | Photovoltaic | |
| Hotel Villa Cortés | 3.04 | Tenerife | Tourism | Photovoltaic | |
| Buenavista Golf, S.A. | 3.04 | Tenerife | Tourism | Photovoltaic | |
| Rural Teno | 3.04 | Tenerife | Agrícola | Photovoltaic | |
| Ropa Rent, S.A. (P.I. Güímar) | 3.04 | Tenerife | Industrial | Photovoltaic | |
| Unelco | 600 | 3.5 | Tenerife | Industrial | Photovoltaic |
| I.T.E.R. Cabildo de Tenerife | 14 | 3.5 | Tenerife | Industrial | Photovoltaic |
| C.T. en P.I. de Granadilla | 3.5 | Tenerife | Industrial | Photovoltaic | |
| Bonny S.A., Finca El Confital. | 3.5 | Tenerife | Irrigation | Photovoltaic | |
| Polígono Industrial de Granadilla (portátil) | 3.5 | Tenerife | Industrial | Photovoltaic | |
| UTE Desalinizadora de Granadilla | 14,000 | 3.04 | Tenerife | 50,146 | Wind |
| Guia de ISORA Hoya de la leña | 3.5 | Tenerife | Tourism | Photovoltaic | |
| Club Campo Guía de Isora, Abama | 3.5 | Tenerife | Tourism | Photovoltaic | |
| Hotel Meliá Palacio de Isora, Alcalá. | 3.5 | Tenerife | Tourism | Photovoltaic | |
| Loro Parque | 3.5 | Tenerife | Tourism | Photovoltaic | |
| Santa Cruz I | 20,000 | 3.04 | Tenerife | 204,856 | Wind |
| Recinto Portuario Santa Cruz (portátil) | 3.04 | Tenerife | Industrial | Photovoltaic | |
| CEPSA | 1000 | 3.04 | Tenerife | Industrial | Wind |
| Hotel Playa la Arena | 3.04 | Tenerife | Tourism | Photovoltaic | |
| Hotel Jardín Tecina | 2000 | 3.04 | La Gomera | 4000 | Wind |
| La Restinga | 500 | 3.5 | El Hierro | 297 | Photovoltaic |
| La Restinga | 1200 | 3.04 | El Hierro | 712 | Wind |
| El Cangrejo | 1200 | 3.04 | El Hierro | 2478 | Wind |
| El Cangrejo | 1200 | 3.04 | El Hierro | 2478 | Wind |
| El Golfo | 1350 | 3.04 | El Hierro | 4093 | Wind |
| Name of the Plant | Production (m3/d) | Consume (kWh/m3) | Economic Cost (€/m3) | Carbon Footprint (tCO2/m3) | Ecological Footprint (ha/Year/tCO2/m3) |
|---|---|---|---|---|---|
| Cercado de Don Andrés | 200 | 3.5 | 0.040448289 | 0.0021 | 0.00105 |
| Lanzarote III 1 | 10,000 | 3.5 | 0.040448289 | 0.0021 | 0.00105 |
| Lanzarote III 2 | 5000 | 3.5 | 0.040448289 | 0.0021 | 0.00105 |
| Lanzarote III 3 | 5000 | 3.5 | 0.040448289 | 0.0021 | 0.00105 |
| Lanzarote IV | 20,000 | 3.5 | 0.040448289 | 0.0021 | 0.00105 |
| Lanzarote V | 18,000 | 2.4 | 0.02773597 | 0.001566 | 0.00072 |
| Aeropuerto | 700 | 3.04 | 0.035132228 | 0.001824 | 0.000912 |
| Agua Park | 30 | 3.04 | 0.035132228 | 0.001824 | 0.000912 |
| Apartamentos Ficus | 60 | 3.5 | 0.040448289 | 0.0021 | 0.00105 |
| Apartamentos Puerto Tahiche | 150 | 3.5 | 0.040448289 | 0.0021 | 0.00105 |
| Apartamentos Trebol | 80 | 3.5 | 0.040448289 | 0.0021 | 0.00105 |
| Ercros | 2500 | 3.5 | 0.040448289 | 0.0021 | 0.00105 |
| Ercros | 2200 | 3.5 | 0.040448289 | 0.0021 | 0.00105 |
| Famara | 350 | 3.5 | 0.040448289 | 0.0021 | 0.00105 |
| Hotel Golf y Mar | 90 | 3.5 | 0.040448289 | 0.0021 | 0.00105 |
| Hotel Gran Meliá Salinas | 400 | 2.61 | 0.030162867 | 0.001566 | 0.000783 |
| Hotel Playa Verde | 250 | 3.5 | 0.040448289 | 0.0021 | 0.00105 |
| Hotel Teguise Playa | 250 | 3.5 | 0.040448289 | 0.0021 | 0.00105 |
| La Galea | 150 | 3.04 | 0.035132228 | 0.001824 | 0.000912 |
| Lanzarote Beach Club II | 70 | 3.04 | 0.035132228 | 0.001824 | 0.000912 |
| Las Arenas, Costa Teguise | 80 | 3.04 | 0.035132228 | 0.001824 | 0.000912 |
| Playa Roca | 250 | 3.04 | 0.035132228 | 0.001824 | 0.000912 |
| Apartamentos Don Paco Castilla | 320 | 2.61 | 0.030162867 | 0.001566 | 0.000783 |
| Apartamentos Sol Lanzarote | 350 | 2.61 | 0.030162867 | 0.001566 | 0.000783 |
| Cdad Apartamentos CAMP | 2.61 | 0.030162867 | 0.001566 | 0.000783 | |
| Holiday Land S.A. | 3000 | 3.5 | 0.040448289 | 0.0021 | 0.00105 |
| Hotel Fariones Playa | 500 | 3.5 | 0.040448289 | 0.0021 | 0.00105 |
| Hotel Playa Azul | 300 | 3.5 | 0.040448289 | 0.0021 | 0.00105 |
| Hoteles Canarios S.A. | 3.5 | 0.040448289 | 0.0021 | 0.00105 | |
| Iberhotel | 3.5 | 0.040448289 | 0.0021 | 0.00105 | |
| Zorilla | 40 | 3.04 | 0.035132228 | 0.001824 | 0.000912 |
| Hotel Jameos Playa | 336 | 2.61 | 0.030162867 | 0.001566 | 0.000783 |
| La Santa Sport I | 250 | 3.5 | 0.040448289 | 0.0021 | 0.00105 |
| La Santa Sport II | 250 | 3.5 | 0.040448289 | 0.0021 | 0.00105 |
| Ria La Santa | 400 | 3.5 | 0.040448289 | 0.0021 | 0.00105 |
| Apartamentos Son Boy Family Suites | 500 | 3.04 | 0.035132228 | 0.001824 | 0.000912 |
| Bungalows Atlantic Gardens | 3.5 | 0.040448289 | 0.0021 | 0.00105 | |
| Costa los Limones S.A. | 350 | 3.5 | 0.040448289 | 0.0021 | 0.00105 |
| Hotel Corbeta | 3.5 | 0.040448289 | 0.0021 | 0.00105 | |
| Hotel Costa Calero | 324 | 3.04 | 0.035132228 | 0.001824 | 0.000912 |
| Marina Rubicón | 300 | 3.04 | 0.035132228 | 0.001824 | 0.000912 |
| Hotel Paradise Island | 300 | 3.04 | 0.035132228 | 0.001824 | 0.000912 |
| Hotel Princesa Yaiza | 500 | 3.04 | 0.035132228 | 0.001824 | 0.000912 |
| Hotel Rubicón Palace | 450 | 3.04 | 0.035132228 | 0.001824 | 0.000912 |
| Inalsa Sur 1 | 600 | 3.5 | 0.040448289 | 0.0021 | 0.00105 |
| Inalsa Sur 2 | 1200 | 3.5 | 0.040448289 | 0.0021 | 0.00105 |
| Inalsa Sur 3 | 3000 | 3.5 | 0.040448289 | 0.0021 | 0.00105 |
| Janubio | 3.04 | 0.035132228 | 0.001824 | 0.000912 | |
| Lanzasur Club | 200 | 3.04 | 0.035132228 | 0.001824 | 0.000912 |
| Playa Blanca S.A. | 3.5 | 0.040448289 | 0.0021 | 0.00105 | |
| Club Lanzarote | 4500 | 3.5 | 0.040448289 | 0.0021 | 0.00105 |
| Apartamentos Moromar | 250 | 3.5 | 0.040448289 | 0.0021 | 0.00105 |
| Gea Fonds Numero Uno Lanzarote S.A. | 3.5 | 3.5 | 0.001623494 | 0.0021 | |
| Grupo Rosa | 1000 | 3.5 | 0.040448289 | 0.0021 | 0.00105 |
| Hipotels | 300 | 3.5 | 0.040448289 | 0.0021 | 0.00105 |
| Hotel Corona | 300 | 3.5 | 0.040448289 | 0.0021 | 0.00105 |
| Hotel Costa Calero S.L. | 300 | 3.04 | 0.035132228 | 0.001824 | 0.000912 |
| Hotel Sunbou | 500 | 3.04 | 0.035132228 | 0.001824 | 0.000912 |
| Isla Lobos | 100 | 3.04 | 0.035132228 | 0.001824 | 0.000912 |
| Leas Hotel S.A. | 3.5 | 0.040448289 | 0.0021 | 0.00105 | |
| Niels Prahm | 3.5 | 0.040448289 | 0.0021 | 0.00105 | |
| Occidental Hotel Oasis | 250 | 3.04 | 0.035132228 | 0.001824 | 0.000912 |
| Playa Flamingo | 200 | 3.04 | 0.035132228 | 0.001824 | 0.000912 |
| Tjaereborg Timesharing, S.A. | 500 | 3.04 | 0.035132228 | 0.001824 | 0.000912 |
| Empresa Mixta de Aguas de Antigua, S.L. | 4800 | 3.04 | 0.035132228 | 0.001824 | 0.000912 |
| Grupo Turístico Barceló, S.L. | 240 | 3.5 | 0.040448289 | 0.0021 | 0.00105 |
| Aguas Cristóbal Franquis, S.L. | 1200 | 3.5 | 0.040448289 | 0.0021 | 0.00105 |
| Anjoca Canarias, S.A. | 3000 | 3.5 | 0.040448289 | 0.0021 | 0.00105 |
| Ramiterra, S.L. | 3000 | 3.04 | 0.035132228 | 0.001824 | 0.000912 |
| Inver Canary Dos, S.L. | 300 | 3.04 | 0.035132228 | 0.001824 | 0.000912 |
| Suministros de Agua de La Oliva, S.A. | 9000 | 3.04 | 0.035132228 | 0.001824 | 0.000912 |
| Consorcio Abastecimiento de Aguas a Fuerteventura | 4000 | 3.04 | 0.035132228 | 0.001824 | 0.000912 |
| Parque de Ocio y Cultura BAKU 1 | 300 | 3.04 | 0.035132228 | 0.001824 | 0.000912 |
| Parque de Ocio y Cultura BAKU 2 | 90 | 3.04 | 0.035132228 | 0.001824 | 0.000912 |
| RIU Palace Tres Islas | 100 | 3.5 | 0.040448289 | 0.0021 | 0.00105 |
| RIU Oliva Beach | 400 | 3.5 | 0.040448289 | 0.0021 | 0.00105 |
| Nombredo, S.L. | 500 | 3.5 | 0.040448289 | 0.0021 | 0.00105 |
| Consorcio Abastecimiento de Aguas a Fuerteventura | 4400 | 3.5 | 0.040448289 | 0.0021 | 0.00105 |
| Puertito de la Cruz | 60 | 3.5 | 0.040448289 | 0.0021 | 0.00105 |
| Vinamar, S.A. | 3600 | 3.5 | 0.040448289 | 0.0021 | 0.00105 |
| Fuercan, S.L. Cañada del Rio I | 2000 | 3.5 | 0.040448289 | 0.0021 | 0.00105 |
| Fuercan, S.L. Cañada del Rio II | 1000 | 3.04 | 0.035132228 | 0.001824 | 0.000912 |
| Fuercan, S.L. Cañada del Rio III | 2000 | 3.04 | 0.035132228 | 0.001824 | 0.000912 |
| Club Aldiana | 200 | 3.5 | 0.040448289 | 0.0021 | 0.00105 |
| Erwin Sick | 30 | 3.5 | 0.040448289 | 0.0021 | 0.00105 |
| Esquinzo Urbanización II | 1200 | 3.5 | 0.040448289 | 0.0021 | 0.00105 |
| Esquinzo Urbanización III | 1200 | 3.5 | 0.040448289 | 0.0021 | 0.00105 |
| Hotel Sol Élite Los Gorriones 1 | 400 | 3.5 | 0.040448289 | 0.0021 | 0.00105 |
| Hotel Sol Élite Los Gorriones 2 | 400 | 3.5 | 0.040448289 | 0.0021 | 0.00105 |
| Stella Canaris I | 300 | 3.5 | 0.040448289 | 0.0021 | 0.00105 |
| Stella Canaris II | 300 | 3.5 | 0.040448289 | 0.0021 | 0.00105 |
| Stella Canaris III | 250 | 3.5 | 0.040448289 | 0.0021 | 0.00105 |
| Hotel H 10 Playa Esmeralda. | 250 | 3.5 | 0.040448289 | 0.0021 | 0.00105 |
| Hotel “Club Paraíso Playa” | 300 | 3.5 | 0.040448289 | 0.0021 | 0.00105 |
| Urbanización Costa Calma. | 110 | 3.5 | 0.040448289 | 0.0021 | 0.00105 |
| Urbanización Tierra Dorada. | 120 | 3.5 | 0.040448289 | 0.0021 | 0.00105 |
| Zoo-Parque La Lajita. | 1300 | 3.5 | 0.040448289 | 0.0021 | 0.00105 |
| Apartamentos Esmeralda Maris | 120 | 3.5 | 0.040448289 | 0.0021 | 0.00105 |
| Hotel H10 Tindaya | 280 | 3.5 | 0.040448289 | 0.0021 | 0.00105 |
| Aparthotels Morasol | 80 | 3.5 | 0.040448289 | 0.0021 | 0.00105 |
| Consorcio Abastecimiento de Aguas a Fuerteventura | 36,500 | 3.5 | 0.040448289 | 0.0021 | 0.00105 |
| Aeropuerto | 500 | 3.5 | 0.040448289 | 0.0021 | 0.00105 |
| GranTarajal | 4000 | 3.5 | 0.040448289 | 0.0021 | 0.00105 |
| Sotavento, S.A. | 2925 | 3.5 | 0.040448289 | 0.0021 | 0.00105 |
| Arucas-Moya I | 10,000 | 3.5 | 0.040448289 | 0.0021 | 0.00105 |
| Granja experimental | 500 | 3.5 | 0.040448289 | 0.0021 | 0.00105 |
| Granja experimental | 500 | 3.5 | 0.040448289 | 0.0021 | 0.00105 |
| Comunidad Fuentes de Quintanilla | 800 | 3.04 | 0.035132228 | 0.001824 | 0.000912 |
| Granja experimental | 500 | 3.5 | 0.040448289 | 0.0021 | 0.00105 |
| Gáldar-Agaete I | 3000 | 3.5 | 0.040448289 | 0.0021 | 0.00105 |
| Gáldar II | 7000 | 3.04 | 0.035132228 | 0.001824 | 0.000912 |
| Agragua | 15,000 | 3.5 | 0.040448289 | 0.0021 | 0.00105 |
| Guía I | 5000 | 3.5 | 0.040448289 | 0.0021 | 0.00105 |
| Guía II | 5000 | 2.61 | 0.030162867 | 0.001566 | 0.000783 |
| Félix Santiago Melián | 5000 | 2.61 | 0.030162867 | 0.001566 | 0.000783 |
| Las Palmas III | 65,000 | 3.5 | 0.040448289 | 0.0021 | 0.00105 |
| Las Palmas IV | 15,000 | 2.61 | 0.030162867 | 0.001566 | 0.000783 |
| BAXTER S.A. | 100 | 3.5 | 0.040448289 | 0.0021 | 0.00105 |
| El Corte Inglés, S.A. | 300 | 3.5 | 0.040448289 | 0.0021 | 0.00105 |
| Anfi del Mar I | 250 | 3.5 | 0.040448289 | 0.0021 | 0.00105 |
| Anfi del Mar II | 250 | 3.5 | 0.040448289 | 0.0021 | 0.00105 |
| AQUALING | 2000 | 3.04 | 0.035132228 | 0.001824 | 0.000912 |
| Puerto Rico I | 4000 | 3.04 | 0.035132228 | 0.001824 | 0.000912 |
| Puerto Rico II | 4000 | 3.04 | 0.035132228 | 0.001824 | 0.000912 |
| Hotel Taurito | 400 | 3.04 | 0.035132228 | 0.001824 | 0.000912 |
| Hotel Costa Meloneras | 300 | 3.04 | 0.035132228 | 0.001824 | 0.000912 |
| Hotel Villa del Conde | 500 | 3.04 | 0.035132228 | 0.001824 | 0.000912 |
| Bahia Feliz | 600 | 3.5 | 0.040448289 | 0.0021 | 0.00105 |
| Bonny | 8000 | 3.5 | 0.040448289 | 0.0021 | 0.00105 |
| Maspalomas I Mar | 14,500 | 3.5 | 0.040448289 | 0.0021 | 0.00105 |
| Maspalomas II | 25,200 | 3.04 | 0.035132228 | 0.001824 | 0.000912 |
| UNELCO II | 600 | 3.5 | 0.040448289 | 0.0021 | 0.00105 |
| Ayto. San Nicolas | 5000 | 3.04 | 0.035132228 | 0.001824 | 0.000912 |
| Asociación de agricultores de la Aldea | 5400 | 3.04 | 0.035132228 | 0.001824 | 0.000912 |
| Sureste III | 8000 | 3.5 | 0.040448289 | 0.0021 | 0.00105 |
| Aeropuerto I | 1000 | 3.5 | 0.040448289 | 0.0021 | 0.00105 |
| Salinetas | 16,000 | 3.5 | 0.040448289 | 0.0021 | 0.00105 |
| Aeropuerto II | 500 | 3.5 | 0.040448289 | 0.0021 | 0.00105 |
| Hoya León | 1500 | 3.5 | 0.040448289 | 0.0021 | 0.00105 |
| Bco. García Ruiz | 1000 | 3.5 | 0.040448289 | 0.0021 | 0.00105 |
| Mando Aéreo de Canarias | 1000 | 3.5 | 0.040448289 | 0.0021 | 0.00105 |
| UNELCO I | 1000 | 3.5 | 0.040448289 | 0.0021 | 0.00105 |
| Anfi del Mar | 1500 | 3.04 | 0.035132228 | 0.001824 | 0.000912 |
| Norcrost, S.A. | 170 | 3.04 | 0.035132228 | 0.001824 | 0.000912 |
| Adeje Arona | 30,000 | 3.04 | 0.035132228 | 0.001824 | 0.000912 |
| Gran Hotel Anthelia Park | 3.04 | 0.035132228 | 0.001824 | 0.000912 | |
| La Caleta (Ayto. Adeje) | 3.04 | 0.035132228 | 0.001824 | 0.000912 | |
| Hotel Sheraton La Caleta | 2.16 | 0.035132228 | 0.001824 | 0.000912 | |
| Hotel Gran Tacande | 3.04 | 0.035132228 | 0.001824 | 0.000912 | |
| Hotel Rocas de Nivaria, Playa Paraíso | 3.04 | 3.04 | 0.00141012 | 0.001824 | |
| Hotel Bahía del Duque, Costa Adeje | 3.04 | 3.04 | 0.00141012 | 0.001824 | |
| Siam Park | 3.04 | 0.035132228 | 0.001824 | 0.000912 | |
| Tenerife-Sol S. A. | 3.04 | 0.035132228 | 0.001824 | 0.000912 | |
| Hotel Conquistador, P. de Las Américas | 3.04 | 3.04 | 0.00141012 | 0.001824 | |
| Arona Gran Hotel, Los Cristianos | 3.04 | 0.035132228 | 0.001824 | 0.000912 | |
| Bonny S.A., Finca El Fraile. | 3.04 | 0.035132228 | 0.001824 | 0.000912 | |
| El Toscal, La Estrella (C. Regantes Las Galletas) | 3.04 | 3.04 | 0.00141012 | 0.001824 | |
| Complejo Mare Nostrum, P. Las Américas | 3.04 | 3.04 | 0.00141012 | 0.001824 | |
| Hotel Villa Cortés | 3.04 | 0.035132228 | 0.001824 | 0.000912 | |
| Buenavista Golf S.A, | 3.04 | 0.035132228 | 0.001824 | 0.000912 | |
| Rural Teno | 3.04 | 0.035132228 | 0.001824 | 0.000912 | |
| Ropa Rent, S.A. (P.I. Güímar) | 3.04 | 0.035132228 | 0.001824 | 0.000912 | |
| Unelco | 600 | 3.04 | 0.040448289 | 0.0021 | 0.00105 |
| I.T.E.R. Cabildo de Tenerife | 14 | 3.5 | 0.040448289 | 0.0021 | 0.00105 |
| C.T. en P.I. de Granadilla | 3.5 | 0.040448289 | 0.0021 | 0.00105 | |
| Bonny S.A., Finca El Confital. | 3.5 | 0.040448289 | 0.0021 | 0.00105 | |
| Polígono Industrial de Granadilla (portatil) | 3.5 | 3.5 | 0.001623494 | 0.0021 | |
| Guia de ISORA Hoya de la leña | 3.5 | 0.040448289 | 0.0021 | 0.00105 | |
| Club Campo Guía de Isora, Abama | 3.5 | 3.04 | 0.001623494 | 0.0021 | |
| Hotel Meliá Palacio de Isora, Alcalá | 3.5 | 3.5 | 0.001623494 | 0.0021 | |
| Loro Parque | 3.5 | 0.040448289 | 0.0021 | 0.00105 | |
| Santa Cruz I | 20,000 | 3.5 | 0.035132228 | 0.001824 | 0.000912 |
| Recinto Portuario Santa Cruz (portátil) | 3,04 | 3.5 | 0.00141012 | 0.001824 | |
| CEPSA | 1000 | 3.04 | 0.035132228 | 0.001824 | 0.000912 |
| Hotel Playa la Arena | 3.04 | 0.035132228 | 0.001824 | 0.000912 | |
| Hotel Jardín Tecina | 2000 | 3.04 | 0.035132228 | 0.001824 | 0.000912 |
| La Restinga | 500 | 3.04 | 0.040448289 | 0.0021 | 0.00105 |
| La Restinga | 1200 | 3.04 | 0.035132228 | 0.001824 | 0.000912 |
| El Cangrejo | 1200 | 3.5 | 0.035132228 | 0.001824 | 0.000912 |
| El Cangrejo | 1200 | 3.04 | 0.035132228 | 0.001824 | 0.000912 |
| El Golfo | 1350 | 3.04 | 0.035132228 | 0.001824 | 0.000912 |
| CO2 Footprint per Non-Renewable Technology in Canaries (tCO2) | |||||||
|---|---|---|---|---|---|---|---|
| Technology | Gran Canaria | Tenerife | Lanzarote | Fuerteventura | La Palma | La Gomera | El Hierro |
| Vapor Turbine | 274,429 | 279,289 | 550,154 | 34,9597 | 268,273 | 68,688.22 | 48,276 |
| Diesel Motor | 110,730 | 193,188 | 39,888 | 50,483 | 14,360 | - | - |
| Gas Turbine | 1,270,058 | 1,110,153 | - | - | - | - | - |
| Combined Cycle | 1,175,213 | 1,162,741 | - | - | - | - | - |
| CO2 Carbon Footprint per Power Installed of Non-Renewable Technology in Canaries (tCO2/MW) | |
|---|---|
| Technology | tCO2/MW |
| Vapor Turbine | 3240 |
| Diesel Motor | 638 |
| Gas Turbine | 4175 |
| Combined Cycle | 2545 |
| CO2 Footprint of Each Non-Renewable Technology per MWh in Canarias (tCO2/MWh) | |||||||
|---|---|---|---|---|---|---|---|
| Technology | Gran Canaria | Tenerife | Lanzarote | Fuerteventura | La Palma | La Gomera | El Hierro |
| Diesel Motor | 0.224621 | 0.204929 | 0.151737 | 0.12329 | 0.215532 | 0.168356 | 0.364811 |
| Gas Turbine | 0.178854 | 0.170368 | 0.278681 | 0.045057 | 2.494326 | 0 | 0 |
| Vapor Turbine | 0.145261 | 0.134765 | 0 | 0 | 0 | 0 | 0 |
| Combined Cycle | 0.175115 | 0.162457 | 0 | 0 | 0 | 0 | 0 |
| Water Consumes in Canarias per Sectors (%) | |||||||
|---|---|---|---|---|---|---|---|
| Consume | Lanzarote | Fuerteventura | Gran Canaria | Tenerife | La Gomera | El Hierro | La Palma |
| Urban | 26% | 29% | 32% | 27% | 9% | 23% | 8% |
| Touristic | 40% | 48% | 11% | 10% | 9% | 3% | 2% |
| Industrial | 3% | 4% | 4% | 5% | 0% | 1% | 0% |
| Irrigation | 23% | 11% | 43% | 49% | 69% | 63% | 77% |
| Losses | 7% | 9% | 9% | 9% | 13% | 9% | 13% |
| Total | 100% | 100% | 100% | 100% | 100% | 100% | 100% |
Publisher’s Note: MDPI stays neutral with regard to jurisdictional claims in published maps and institutional affiliations. |
© 2021 by the authors. Licensee MDPI, Basel, Switzerland. This article is an open access article distributed under the terms and conditions of the Creative Commons Attribution (CC BY) license (https://creativecommons.org/licenses/by/4.0/).
Share and Cite
Leon, F.; Ramos, A.; Perez-Baez, S.O. Optimization of Energy Efficiency, Operation Costs, Carbon Footprint and Ecological Footprint with Reverse Osmosis Membranes in Seawater Desalination Plants. Membranes 2021, 11, 781. https://doi.org/10.3390/membranes11100781
Leon F, Ramos A, Perez-Baez SO. Optimization of Energy Efficiency, Operation Costs, Carbon Footprint and Ecological Footprint with Reverse Osmosis Membranes in Seawater Desalination Plants. Membranes. 2021; 11(10):781. https://doi.org/10.3390/membranes11100781
Chicago/Turabian StyleLeon, Federico, Alejandro Ramos, and Sebastian O. Perez-Baez. 2021. "Optimization of Energy Efficiency, Operation Costs, Carbon Footprint and Ecological Footprint with Reverse Osmosis Membranes in Seawater Desalination Plants" Membranes 11, no. 10: 781. https://doi.org/10.3390/membranes11100781