Article

Segmenting Purple Rapeseed Leaves in the Field from UAV RGB Imagery Using Deep Learning as an Auxiliary Means for Nitrogen Stress Detection

1
Macro Agriculture Research Institute, College of Resource and Environment, Huazhong Agricultural University, 1 Shizishan Street, Wuhan 430070, China
2
Key Laboratory of Arable Land Conservation (Middle and Lower Reaches of Yangtze River), Ministry of Agriculture, Wuhan 430070, China
3
Aerial Application Technology Research Unit, USDA-Agricultural Research Service, College Station, TX 77845, USA
4
College of Mechanical and Electronic Engineering, Northwest A&F University, 22 Xinong Road, Yangling 712100, China
5
College of Plant Science and Technology, Huazhong Agricultural University, Wuhan 430070, China
6
Anhui Engineering Laboratory of Agro-Ecological Big Data, Anhui University, 111 Jiulong Road, Hefei 230601, China
7
College of Informatics, Huazhong Agricultural University, Wuhan 430070, China
8
College of Science, Huazhong Agricultural University, Wuhan 430070, China
*
Author to whom correspondence should be addressed.
These authors contributed equally to this work.
Remote Sens. 2020, 12(9), 1403; https://doi.org/10.3390/rs12091403
Submission received: 6 March 2020 / Revised: 27 April 2020 / Accepted: 27 April 2020 / Published: 29 April 2020
(This article belongs to the Special Issue UAVs for Vegetation Monitoring)

Abstract

:
Crop leaf purpling is a common phenotypic change when plants are subject to some biotic and abiotic stresses during their growth. The extraction of purple leaves can monitor crop stresses as an apparent trait and meanwhile contributes to crop phenotype analysis, monitoring, and yield estimation. Due to the complexity of the field environment as well as differences in size, shape, texture, and color gradation among the leaves, purple leaf segmentation is difficult. In this study, we used a U-Net model for segmenting purple rapeseed leaves during the seedling stage based on unmanned aerial vehicle (UAV) RGB imagery at the pixel level. With the limited spatial resolution of rapeseed images acquired by UAV and small object size, the input patch size was carefully selected. Experiments showed that the U-Net model with the patch size of 256 × 256 pixels obtained better and more stable results with a F-measure of 90.29% and an Intersection of Union (IoU) of 82.41%. To further explore the influence of image spatial resolution, we evaluated the performance of the U-Net model with different image resolutions and patch sizes. The U-Net model performed better compared with four other commonly used image segmentation approaches comprising support vector machine, random forest, HSeg, and SegNet. Moreover, regression analysis was performed between the purple rapeseed leaf ratios and the measured N content. The negative exponential model had a coefficient of determination (R²) of 0.858, thereby explaining much of the rapeseed leaf purpling in this study. This purple leaf phenotype could be an auxiliary means for monitoring crop growth status so that crops could be managed in a timely and effective manner when nitrogen stress occurs. Results demonstrate that the U-Net model is a robust method for purple rapeseed leaf segmentation and that the accurate segmentation of purple leaves provides a new method for crop nitrogen stress monitoring.

Graphical Abstract

1. Introduction

Biotic and abiotic stresses such as plant diseases, low temperature, and deficiencies of mineral elements can greatly affect the crop production and yield [1,2]. Crops can usually exhibit phenotypic and physiological changes to respond to adverse conditions. Leaf purpling is a common phenotypic change caused by environmental stresses in many crops such as rapeseed, wheat, corn, and rice [3]. Leaf purpling is mainly due to lack of nitrogen (N), phosphorus (P), potassium (K), or other nutrients causing the stagnation and accumulation of anthocyanin, which is usually red or purple in the leaf tissues [4]. Anthocyanins as water-soluble pigments found in all plant tissues can be used as a protective layer to improve the resistance to cold, drought, and disease, thereby minimizing the permanent damage to the leaves [5], but stresses can cause a temporary inhibition of growth [6]. Previous studies of purple leaves mostly focused on their ecological and physiological significance [1,7] and genomics research [3,4]. However, compared with green leaves, purple leaves have attracted little attention in phenotype monitoring, crop management, and yield estimation in agriculture, due to shorter appearance periods and smaller areas. As a phenotypic trait, purple leaves can intuitively respond to stresses, and crops could be treated by timely site-specific application of remedies. The ability to accurately and efficiently segment purple leaves in crops may greatly facilitate crop phenotype analysis, monitoring, and management.
Purple leaf segmentation is difficult due to the complexity of the field environment and differences in leaf size, shape, texture, and color gradation. Plant segmentation using images based on the color space is a traditional target segmentation method [8]. For example, Tang et al. used the HSeg method based on the H-component of the hue-saturation-intensity (HSI) color space to separate tassels from corn plants [9]. However, the segmentation accuracy was affected greatly by the illumination. Bai et al. proposed a morphology modeling method to establish a crop color model based on lightness in the Lab color space for crop image segmentation [10]. The experimental results showed that the method was robust to the lighting conditions, but its dependence on color information alone could lead to incomplete extraction.
In the past few decades, machine learning methods such as support vector machine (SVM) [11,12], random forest (RF) [13], and artificial neural network (ANN) [14] have been used widely in plant segmentation. Deep learning is a relatively new area of machine learning where multiple processing layers are employed to learn representations of complex data, and it has dramatically achieved state-of-the-art results in agriculture [15,16,17]. The fully convolutional neural network (FCNN) for semantic segmentation work has demonstrated its great capacity in plant segmentation due to rich feature representations and end-to-end structure [18,19]. Nevertheless, the FCNN-based models are limited by low-resolution prediction because of the sequential max-pooling and down-sampling structure. Subsequently, some sophisticated network architecture emerged, such as SegNet [20], U-Net [21], and DeepLab [22], which can carefully address the issue through the encoder and decoder operation and have shown huge potential in plant segmentation [23,24,25]. For example, Sa et al. used a complete pipeline for semantic sugar beet and weed segmentation using multispectral images obtained by UAV. The model with nine channels significantly outperformed a baseline SegNet architecture with RGB input [19]. Milioto et al. proposed an end-to-end encoder-decoder network, which can accurately perform the pixel-wise prediction task for real-time semantic segmentation of crop and weed [26].
Low-altitude remote sensing using unmanned aerial vehicles (UAVs) has developed rapidly for applications in precision agriculture in recent years [27,28,29], due to their ability to capture high-resolution imagery with low-cost portable sensors and their flexibility for quick image acquisition. However, UAVs have been mostly used for object detection [30,31] and image classification [32,33] in deep learning. Pixel-wise plant segmentation based on UAV images is a big challenge due to limited spatial resolution, small object size, and complex background features, compared with images obtained from the ground platform.
In this study, we used a U-Net convolutional neural network architecture as a binary semantic segmentation task of purple rapeseed leaves during the seedling stage based on UAV imagery. The U-Net model has shown significant outperformance over other deep architectures in some segmentation tasks, which is more suitable for target segmentation with uncertain size, small resolution, and complicated background [21,34,35]. The specific objectives of this study were to (1) develop a novel method for efficiently assessing and quantifying the crop stress based on UAV imagery and compare the performance with commonly used deep learning algorithms (SegNet), traditional machine learning architecture (RF and SVM), and color space method (HSeg), (2) explore the regulation of image spatial resolution on the selection of sample size, and (3) verify the ability of using purple leaves to monitor crop nitrogen status.

2. Materials and Methods

2.1. Study Area

The study area was located at the experimental base of Huazhong Agricultural University (30°28′10′′N, 114°21′21′′E) in Wuhan, Hubei, China, which lies approximately in the center of the Yangtze River basin. The study site has a humid sub-tropical monsoon climate and the main physicochemical properties of the soil are presented in Table 1. In the Yangtze River region, winter oilseed rape (Brassica napus L.) is widely planted, making up 89% of total rapeseed yields in China [36]. In this experiment, the conventional winter rapeseed hybrid variety “Huayouza No. 9” was used and the leaves are green in the natural state. The rapeseeds were first sown in the prepared seedbeds in September using high fertility soils, then the seedlings were transplanted into the tilled field at a density of 100,000 plants/ha in October. The experimental site with a total area of 0.29 ha was divided into three areas shown in Figure 1b. Area 1 contained 36 plots with a plot size of 11 × 2.7 m and was used for a substitution experiment where crop residues provided nutrients in a rice–rapeseed rotation system. Rice–rapeseed and corn–rapeseed rotation experiments were conducted in Area 2 and Area 3, respectively, where each area was divided into 30 plots with a plot of 4 × 5 m. In the rapeseed season, four different N fertilizer treatments (0, 75, 150, and 225 kg/ha) were randomly assigned with three replicates in Area 2 and Area 3. The samples used for the U-Net model comprised data from all three areas. In order to ensure the consistency of the experiment, the fitting model regarding the correlation between N content and area of purple rapeseed leaves only used the 60 sample plots from Area 2 and Area 3. The study area and plot arrangement are shown in Figure 1d. The table in Figure 1c shows the N fertilizer rates for each plot number.

2.2. Field Data Acquisition

In this study, nitrogen content was measured in the field by a GreenSeeker handheld crop sensor (Trimble Navigation Limited, Sunnyvale, CA, USA). Many studies have verified that the values obtained by GreenSeeker have a strong correlation with nitrogen content [37,38,39]. The GreenSeeker sensor used two LEDs as a light source to detect the reflection in the visible and NIR spectral regions. This study placed the instrument 1.2 m above the canopy and the measurement area was a circular area with a radius of 0.25 m. A total of 66 samples were collected in Area 2 and Area 3.

2.3. UAV Image Acquisition

The UAV flight task was carried out under clear and sunny weather conditions between 12:00 and 14:00 local time on December 25, 2016, when rapeseed was at the seedling stage. We employed a Matrice 600 UAV (DJI, Shenzhen, China) with a maximum payload of 6 kg, 16 min of continuous flight, and a maximum horizontal flight speed of 18 m/s in a windless environment. The platform carried a full frame digital single lens reflex camera Nikon D800 (Nikon, Inc., Tokyo, Japan) with a sensor size of 35.9 × 24 mm. The camera was equipped with a Nikon AF 50 mm f/1.4D fixed focal length lens which was vertical to the ground. The aperture, shutter speed, and ISO of the camera were set at f/5.6, 1/1000 s, and 100, respectively. A Global Position System (GPS) module and a wireless trigger were also integrated with the camera. The flight time was 10 min and flight height was set to 20 m with a forward overlap of 80% and a side overlap of 70%. During the flight, 369 images were captured every 1.0 s automatically with 36 million pixels (7360 × 4912 pixels). All the images were stored in the 24-bit TIFF format of true color.

2.4. Image Pre-Processing

Pre-processing of the 369 RGB images mainly involved image corrections and mosaicking. Image corrections included a geometric correction to reduce the effect of lens distortion and a vignetting correction to reduce the progressive radial decrease in radiance strength towards the image periphery [40,41,42]. All 369 images were used to create the orthomosaic to cover the whole study and meanwhile to reduce geometric distortion with large image overlapping [42]. The above steps were carried out using PIE-UAV software (Beijing Piesat Information Technology Co., Ltd., Beijing, China) software. In order to improve the accuracy of the mosaicking results, eight ground control points (GCPs) collected by a global navigation satellite system real-time kinematic (GNSS RTK) receiver (UniStrong Science and Technology Co., Ltd, Beijing, China) were imported into the software. The spatial resolution of the mosaicked orthoimage was 1.86 mm/pixel and the image was stored in TIFF format.

2.5. Dataset Preparation

The mosaicked orthoimage was clipped using a window with a fixed size in order to prepare the dataset for the model. The window size greatly influenced the final detection results for the purple rapeseed leaves [28] and an appropriate size provided a good trade-off in terms of the overall information regarding the purple rapeseed leaves. For exploring the optimal patch size for purple rapeseed leaf segmentation with the U-Net model, the datasets were finally resized to four different sizes of 64 × 64, 128 × 128, 256 × 256, and 512 × 512 pixels, and the information about sample capacities and clip stride is reported in Table 2. The clipped dataset was randomly divided into a training set, a validation set, and a test set according to the ratio of 3:1:1. To ensure the fairness of the assessment results, the test set was only used for the final model evaluation. Two categories, with and without purple rapeseed leaves, had the same area in images for different patch sizes and the ratio of purple leaf pixels to the total pixels was 14.25%. In this study, since there is no accepted standard to identify purple leaves, three experts created the mask of purple leaves by visual interpretation through prior experience using ArcMap 10.3 (Esri Inc., Redlands, CA, USA), and then the ground truth was obtained by taking the intersection of three mask results. Additionally, the corresponding labels were cut to the same size as image patches. The labels contained two classes, corresponding to the categories with and without purple rapeseed leaves.
In this study, the flight height of the UAV was set at 20 m, which was the lowest altitude possible in practice and the resolution of the rapeseed images was 1.86 mm/pixel. However, in agricultural production, it is more practical to obtain coarser resolution images at higher altitudes, considering the cost and efficiency. Therefore, to explore the influence of image resolution on sample size selection with the specific network architecture (U-Net), the original orthoimage was re-sampled to resolutions of 3.72, 5.58, and 7.44 mm/pixel, to mimic the image acquisition at different flight heights of a UAV based platform. The resampled images were obtained through the cubic interpolation algorithm in ArcMap. Degraded images can effectively simulate the images acquired at different heights [43,44]. The three degraded images and the original orthoimage were respectively cropped into four data sets for training and test of the model.

2.6. Network Architecture

The U-Net model has shown good performance of semantic segmentation, especially in biomedical image segmentation [34,45,46]. In this study, we extracted purple leaves from UAV imagery by a U-Net model. Figure 2 shows the overall structure of the U-Net used in this study, which was a typical encoder-decoder architecture. The part of the encoder consists of repeated convolutional layer with a kernel size of 3 × 3 and each follows by a 2 × 2 max pooling with stride 2, which gradually reduces the patch sizes. The part of the decoder contains the up-sampling operations by a 2 × 2 convolution, which halves the number of feature channels. As the main difference of the U-Net model compared with other encoder-decoder architectures, the skip connections could concatenate feature maps in up-sampling with feature maps of the same level in the encoder, which could contribute the decoder to better recovering and optimizing the details of the object. Moreover, it could output images of the same sizes as the input due to the usage of the same padding for filters. In this study, Adam optimizer [47] and an initial learning rate of 10-4 were used. The training batch size was set to 16 and the epoch was set to 100. For the model, an adjustment was carried out in the layer weight initialization procedure using He normal initializer proposed by [48]. For binary classification in this study, the U-Net was trained with a pixel-wise binary cross-entropy loss [26], which can handle the imbalanced number of pixels for each class, and a Sigmoid function as the activation layer.
The implementation of the model employed the Keras library with TensorFlow as its backend. All the experiments were carried on a Linux platform with a 4.00-GHz Intel(R) Core i7-8086k CPU, 64 GB of memory, and an NVIDIA Quadro GV100 graphics processing unit (32 GB).

2.7. Evaluation Metrics

In order to quantitatively evaluate the performance of the proposed method for segmenting purple rapeseed leaves, we calculated the precision, recall, F-measure, and Intersection of Union (IoU) [23] based on comparisons with the ground truth. The precision and recall were defined using the true positives (TP), false positives (FP), and false negatives (FN). The F-measure score was calculated using precision and recall as a powerful evaluation metric for the harmonic mean of precision and recall. IoU calculated the ratio of the intersection and union of the area in prediction and the ground truth. These measures were calculated as follows:
Precision = T P   T P + F P
Recall = T P T P + F N
F - measure = 2   × Precision   ×   Recall ( Precision + Recall )
IoU = T P T P + F P + F N
where the precision is the percentage of matched pixels in the extraction results and the recall measures the proportion of matched pixels in the ground truth. The F-measure and IoU indicate the final exponent for evaluating the accuracy of purple rapeseed leaf segmentation with the U-Net model.

2.8. Segmentation of Purple Rapeseed Leaves with Four Other Methods

To further evaluate our proposed purple rapeseed leaf segmentation method, we implemented four other commonly used image segmentation methods comprising HSeg, RF, SVM, and SegNet. In this work, all methods used the same training set and test set. In particular, the accuracy of the models using only two categories of labels for RF and SVM was low. Therefore, the original class “without purple leaves” was subdivided into five new categories: green leaves, light soil, dark soil, cement, and withered leaves as the training set for RF and SVM. The HSeg method is a traditional target segmentation method of unsupervised classification. In this study, the original image was converted to the H-component of the HSI color space, which can make a big difference between the purple leaf and the background, and then the Otsu approach [49] was used to find an optimal threshold for purple rapeseed leaf segmentation. RF and SVM are both machine learning methods that have been widely used in agriculture for yield prediction and crop classification [15]. RF is a nonparametric and nonlinear classification method with a low computational burden [50,51] and the SVM classifier divides the classes with a decision surface by using a kernel function that maximizes the margin between the classes [52]. In this study, we found the optimal parameters in terms of accuracy obtained by five-fold cross-validation through continuous adjustment. Finally, we used RF containing 80 trees which were all grown fully and unpruned, and the number of features at each node was set to the square root of the total number of features. For the SVM classifier, this study employed the Radial Basis Function as the kernel, and the penalty factor and gamma parameter value were 2 and 0.33, respectively. The structure of the SegNet model is also divided into the encoder and the decoder [20]. This model records the feature locations by pooling indices computed in the max-pooling of the encoder to optimize the production of dense feature maps in the decoder. The process of parameter tuning and samples with four sizes for the SegNet were the same as those for the U-Net. After adjusting the parameters, the optimal input size of SegNet in this study was 256 × 256 pixels.

3. Results

3.1. Segmentation Results Obtained with the U-Net Model

Figure 3 shows the loss curves for training and validating datasets in four different patch sizes, which drop sharply at the beginning and then all reach the convergence states. Figure 4 summarizes the test results of the U-Net model for the patch sizes. Comparisons of the F-measure and IoU showed that as the patch sizes increased, the values tended to increase initially and then decrease. The peak value was obtained with a sample size of 256 × 256 pixels, which provided the best F-measure of 90.29% and IoU of 82.41%. In theory, larger patches should provide more information and yield more accurate predictions. However, the finer resolution also requires a longer training time, and the added information may be redundant and then influence the model training process [34]. The clipped patches with an excessively small window size would lack sufficient features for the model and then increase the risk of over-fitting. Moreover, the patches with a small size could not complete all down-sampling processes of the U-Net model. Thus, excessively small or large sizes made it difficult to distinguish between the purple leaf and the other categories with the U-Net model. Therefore, a patch size of 256 × 256 pixels was selected as an appropriate window size for the U-Net model in this study.

3.2. Accuracy Evaluation for the U-Net Model and Four Other Image Segmentation Methods

To compare the differences between the U-Net method and the other four methods (RF, HSeg, SVM, and SegNet), the four methods employed the same training set and test set as the U-Net model. The results are shown in Figure 5. The U-Net model outperformed each of the other four methods in terms of F-measure and IoU, which were about 6% and 9%, respectively, higher than those for SegNet, the second-best method. RF and SVM had a relatively low recall, and the precision with HSeg was clearly low. However, U-Net had a good balance between the two metrics.

4. Discussion

4.1. Comparison of the Proposed Method and Four Commonly Used Methods

To facilitate more intuitive comparisons of the proposed method and the four commonly used image segmentation methods, we selected four representative test images to analyze the segmentation results obtained with the different approaches. In Figure 6, the first row represents the original RGB rapeseed images, the second row represents the corresponding ground truth, and the remaining five rows show the segmentation results obtained by the five methods. The field environment was very complex with some uncontrollable factors such as illumination and many non-target objects.
Region a contained a withered leaf that resembled a purple leaf. HSeg, SegNet, and U-Net could distinguish between them. However, there were a few incorrectly identified pixels with RF and SVM. For region b, the color gradation of the purple leaves was very different from that of general purple leaves, which led to many misclassified pixels except for SegNet and U-Net. Additionally, the appearance of some ground objects in region c interfered with the segmentation processes by SVM and RF. In region d, when the purple leaves were close to the green leaves, RF and SVM tended to misclassify the mixed pixels at the boundary of the purple leaf.
In the complex background conditions, the U-Net model had a higher capacity for purple rapeseed leaf segmentation and it obviously performed better than the other four methods. HSeg is only based on color information [8]. The color of the purple leaves could vary with changes in illumination and plant growth stage, which severely affected the segmentation results obtained using HSeg. In addition to these problems, the excessive dependence on color information could also lead to incomplete extraction and low recall values [8]. Both traditional machine learning methods (i.e., RF and SVM) create a serious salt-and-pepper phenomenon in the segmentation images. RF is time-consuming, but it is insensitive to the parameters and outliers [50,51]. RF had a difficulty distinguishing similar targets such as various leaves, shadows, and dark soil. Moreover, due to the influence of mixed pixels containing soil and leaves, RF often incorrectly identified the edges of the green leaves as purple leaves. SVM required a long time for model training and it had a problem with incomplete extraction. In general, the main problem with supervised methods is that their accuracy relies mainly on the quality of the training data set and the dimensionality of the input sample, which makes sample labeling a time-consuming process [52]. In this study, the field environment contained many non-target objects and it was difficult to obtain samples from all classes. Therefore, the number of classes in the image was much larger than the sample number, which led to low segmentation accuracy with SVM and RF. By contrast, the U-Net method exhibited higher generalizability and greater robustness during purple leaf segmentation because of its capacity to build a hierarchy of local and sparse features, whereas the traditional image segmentation methods are based on the global transformation of features [53]. Moreover, U-Net could maintain the edges and structural integrity, and it was independent of the color and shape information, thereby obtaining higher accuracy. Similarity, SegNet also had these traits, but the segmented purple leaves had non-sharp boundaries. For SegNet, the coarse outputs were produced after five consecutive down-samplings, which would have had an effect on the process of feature recovery in the up-sampling.

4.2. Influence of Image Resolution on Sample Size Selection

The images used in this study were acquired by the UAV platform. In practice, if the distance between the UAV and rapeseed plants is too close, the strong downdraft produced by the UAV makes the leaves sway and thus affects the image registration process. Thus, the restriction on the flight height made it difficult to obtain ultrahigh-resolution images. The flight height of the UAV was 20 m, which was almost the limit. In order to mimic other higher flight heights, the original orthoimage was re-sampled to resolutions of 3.72, 5.58, and 7.44 mm/pixel. Figure 7 presents the IoU results obtained for each image resolution and patch size. As the image resolution becomes coarser, the optimal accuracy tends to move towards a small patch size. On the one hand, for the same patch size, the number of background pixels was much more than the target (purple rapeseed leaf), which tended to make the trained network divide the pixels into backgrounds. To prevent this from happening, patch size could be reduced appropriately. Nevertheless, the patches with too small a size could easily lead to over-fitting of the model. On the other hand, if the target sizes were too small, the down-sampling process of the U-Net model could not complete, causing the loss of target feature extraction. Especially, the coarser the image spatial resolution, the smaller the area of the target in the image. Figure 8 shows the sizes of all purple rapeseed leaves in the original image used in this experiment, and most purple leaf sizes were between 11 × 11 pixels and 20 × 20 pixels. When the original image was re-sampled to the resolution of 7.44 mm/pixel, the mean and median of all purple leaf sizes were smaller than 8 × 8 pixels, which was not sufficient to obtain more features in Conv 4 (Figure 2). Usually, to obtain new and more complex features, a deep convolutional neural network is added with convolution layers to increase the receptive field. However, the deeper network requires a relatively larger image patch and target size. For pixel-level plant segmentation based on UAV imagery, it is difficult to meet such sample requirements. Excessive pursuit of network depth could lead to counterproductive results. For future plant segmentation work based on UAV images, this discussion can help to make an appropriate decision on sample size selection.

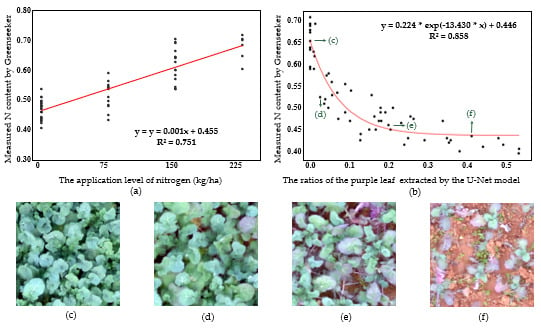
4.3. Relationship Between Nitrogen Content and Area Ratios of Purple Rapeseed Leaf

Nitrogen nutrition has a great effect on the growth and yield of rapeseed [37,54,55]. In this study, four N fertilizer rates were randomly applied to plots as shown in Figure 1 (Area 2 and Area 3). In order to accurately obtain the real-time N content, GreenSeeker (GS) values were measured as the ground truths of N content in 66 field samples. Table 3 presents the descriptive statistics for analyzing the differences in the GS values and purple leaf ratios under the four N application levels. As the ground truths of N content in this experiment, GS values increased steadily with the increase of N application level and maintained the similar range and coefficient of variation (CV). Purple leaf ratios have an increasing increment with the decrease of N application level, which led to a greater range and CV. At the same N application level, the nutrient uptake of rapeseed also varied. To further analyze the differences in GS values and purple leaf ratios among the four N treatments, the analysis of variance (ANOVA) was carried out, the p values of GS and purple leaf ratios were less than 0.05, indicting the decrease of N application induced different level of the N stress in rapeseed on the whole. Multiple comparison results using the least significant difference (LSD) method results (Table 3) showed that the GS means were significantly different among the four N levels, while the purple leaf ratio means were significantly different among all four N levels except for the two high N levels. These results indicate that the extraction method of purple leaves in this experiment was sensitive to detect N stress from 0 to 150 kg/ha. However, this method had a low sensitivity to nitrogen application at relatively high levels (over 150 kg/ha).
Results in Table 3 clearly indicate that leaf purpling was associated with N deficiency. However, there are few studies on the relationship between crop leaf area and nitrogen stress. Therefore, we performed a regression analysis to explore the specific relationship between the area of rapeseed purple leaves and N content. For rapeseed planting, the input of N is fitted to the law of diminishing returns, for which the increments of the rapeseed output will decrease while the increments of the N application input remain constant [56]. Additionally, some studies have indicated that an exponential function can measure the relationship between nitrogen content and green leaf canopy cover well [57,58]. As shown in Table 3, the area of purple leaves and the N fertilizer level had opposite trends, and thus it was reasonable to use a negative exponential model to fit the relationship between the area ratios of the purple rapeseed leaf and the N application rate. Figure 9a illustrates a linear relationship between nitrogen application level and GS values in the range of 0.3–0.8, which are effective for N content detection according to [59]. A negative exponential regression model between N content and purple leaf ratios based on the U-Net model was established in Figure 9b with the R2 value 0.858. When more N was applied, the purple leaf ratio was reduced. Additionally, when the N application rate reached a certain level, no purple rapeseed leaves were observed, as shown in Figure 9c. However, monitoring crop growth by calculating the leaf area index or canopy coverage using only the green leaves is not always accurate. In particular, when the area of green leaves reached the maximum, as shown in Figure 9c–e corresponding to three different N fertilizer treatments (0, 75, and 150 kg/ha), it was difficult to assess the crop state by observing the green leaves. However, purple leaf extraction as a visible trait can be an effective auxiliary means for nitrogen stress detection.
As for the relationship between N rate and yield, low N application could lead to low photosynthetic assimilation and thus reduce grain yield, and excessive N application could cause environmental pollution and even yield decrease [60,61]. Additionally, this experiment illustrated that the exponential function could explain the relationship between N content and purple leaf ratios. For the commonly used nitrogen detection instruments in the field such as GS, it is time-consuming and laborious compared to the UAV-based method in this study. In addition, these sensors can only collect data at discrete points. Moreover, compared with the scientific-grade sensors including near-infrared and red-edge bands, which are sensitive for crops, the consumer-grade camera used in this experiment can only obtain RGB images, however, it is low-cost, easy to operate, and can obtain images with high spatial resolution [62]. In view of the above differences, the purple leaf extraction method based on UAV provided an efficient alternative method for nitrogen stress monitoring. In future experiments, we will increase the number and range of nitrogen levels for exploring the relationship between N stress and the purple leaves ratios comprehensively to find the best threshold for balancing the yield and environmental impact.

5. Conclusions

In this study, we developed a novel method, which can efficiently monitor the crop nitrogen stress as an auxiliary means based on UAV RGB imagery. We designed and implemented a U-Net method for purple rapeseed leaf segmentation at the pixel level, and identified the optimum parameters by adjusting the sample size. The experimental results demonstrated the effectiveness of our proposed method for extracting purple rapeseed leaves, with a F-measure of 91.56% and IoU of 83.19%. Compared with four other commonly used image segmentation approaches (i.e., HSeg, RF, SVM, and SegNet), the U-Net model performed better.
The resolution of the rapeseed images obtained using the low-altitude remote sensing platform was much lower than that acquired with a high-resolution camera from close range. Therefore, in this study, we discussed the importance of patch size selection and evaluated the influence of image resolution on sample size selection, and the result showed that as the spatial resolution became coarser, a relatively smaller patch size had a higher accuracy.
We found that there was a negative exponential relationship (R² = 0.858) between the area of purple rapeseed leaf ratios and the corresponding N content in this experiment. Additionally, using the low-cost consumer-grade camera based on UAV platform is more suitable for agricultural practical application. Therefore, purple leaf extraction was a feasible and effective auxiliary means for monitoring nitrogen stress. Nitrogen is a significant parameter determining the photosynthetic functioning and productivity in crops. In further research, additional nitrogen levels will be added, and purple leaf area will be assessed as a visual trait to find the optimal nitrogen threshold for balancing crop yield and environmental impact. Moreover, other crops and stress types (e.g., water stress) will be studied based on purple leaves.

Author Contributions

J.Z. and T.X. designed the method, conducted the experiment, analyzed the data, discussed the results, and wrote the majority of the manuscript. C.Y. guided the study design, advised on data analysis, and revised the manuscript. H.S., H.F., and J.X. contributed to the method design and discussed the results. Z.J., D.Z., and G.Z. were involved in the process of the experiment, ground data collection, or manuscript revision. All authors reviewed and approved the final manuscript.

Funding

This work was financially supported by the National Key Research and Development Program of China (2018YFD1000900) and the Fundamental Research Funds for the Central Universities (Grant No. 2662018PY101 and 2662018JC012).

Acknowledgments

Special thanks go to the field staff of Huazhong Agricultural University for their daily management of the field experiments. We are grateful to the editor and reviewers for their valuable comments and recommendations.

Conflicts of Interest

The authors declare no conflict of interest.

Data Availability

The rapeseed datasets of this experience are available at https://figshare.com/s/e7471d81a1e35d5ab0d1.

Disclaimer

Mention of trade names or commercial products in this publication is solely for the purpose of providing specific information and does not imply recommendation or endorsement by the authors and their employer.

References

  1. Gitelson, A.A.; Merzlyak, M.N.; Chivkunova, O.B. Optical properties and nondestructive estimation of anthocyanin content in plant leaves. Photochem. Photobiol. 2007, 74, 38–45. [Google Scholar] [CrossRef]
  2. Van den Ende, W.; El-Esawe, S.K. Sucrose signaling pathways leading to fructan and anthocyanin accumulation: A dual function in abiotic and biotic stress responses? Environ. Exp. Bot. 2014, 108, 4–13. [Google Scholar] [CrossRef]
  3. Sakamoto, W.; Ohmori, T.; Kageyama, K.; Miyazaki, C.; Saito, A.; Murata, M.; Noda, K.; Maekawa, M. The purple leaf (Pl) locus of rice: The plw allele has a complex organization and includes two genes encoding basic helix-loop-helix proteins involved in anthocyanin biosynthesis. Plant Cell Physiol. 2001, 42, 982–991. [Google Scholar] [CrossRef] [Green Version]
  4. Chin, H.S.; Wu, Y.P.; Hour, A.L.; Hong, C.Y.; Lin, Y.R. Genetic and evolutionary analysis of purple leaf sheath in rice. Rice 2016, 9, 8. [Google Scholar] [CrossRef] [PubMed] [Green Version]
  5. Ithal, N.; Reddy, A.R. Rice flavonoid pathway genes, OsDfr and OsAns, are induced by dehydration, high salt and ABA, and contain stress responsive promoter elements that interact with the transcription activator, OsC1-MYB. Plant Sci. 2004, 166, 1505–1513. [Google Scholar] [CrossRef]
  6. Oren-Shamir, M.; Levi-Nissim, A. Temperature effects on the leaf pigmentation of cotinus coggygria ‘Royal Purple’. J. Hortic. Sci. 1997, 72, 425–432. [Google Scholar] [CrossRef]
  7. Hughes, N.M.; Lev-Yadun, S. Red/purple leaf margin coloration: Potential ecological and physiological functions. Environ. Exp. Bot. 2015, 119, 27–39. [Google Scholar] [CrossRef]
  8. Xiong, X.; Duan, L.; Liu, L.; Tu, H.; Yang, P.; Wu, D.; Chen, G.; Xiong, L.; Yang, W.; Liu, Q. Panicle-SEG: A robust image segmentation method for rice panicles in the field based on deep learning and superpixel optimization. Plant Methods 2017, 13, 104. [Google Scholar] [CrossRef] [Green Version]
  9. Tang, W.; Zhang, Y.; Zhang, D.; Yang, W.; Li, M. Corn tassel detection based on image processing. In Proceedings of the 2012 International Workshop on Image Processing and Optical Engineering, Harbin, China, 15 November 2012. [Google Scholar]
  10. Bai, X.D.; Cao, Z.G.; Wang, Y.; Yu, Z.H.; Zhang, X.F.; Li, C.N. Crop segmentation from images by morphology modeling in the CIE L*a*b* color space. Comput. Electron. Agric. 2013, 99, 21–34. [Google Scholar] [CrossRef]
  11. Tian, Y.; Li, T.; Li, C.; Piao, Z.; Sun, G.; Wang, B. Method for recognition of grape disease based on support vector machine. Trans. Chin. Soc. Agric. Eng. 2007, 23, 175–180. [Google Scholar]
  12. Guerrero, J.M.; Pajares, G.; Montalvo, M.; Romeo, J.; Guijarro, M. Support Vector Machines for crop/weeds identification in maize fields. Expert Syst. Appl. 2012, 39, 11149–11155. [Google Scholar] [CrossRef]
  13. Tatsumi, K.; Yamashiki, Y.; Torres, M.A.C.; Taipe, C.L.R. Crop classification of upland fields using Random forest of time-series Landsat 7 ETM+ data. Comput Electron. Agric. 2015, 115, 171–179. [Google Scholar] [CrossRef]
  14. Jeon, H.Y.; Tian, L.F.; Zhu, H. Robust crop and weed segmentation under uncontrolled outdoor illumination. Sensors 2011, 11, 6270–6283. [Google Scholar] [CrossRef]
  15. Liakos, K.; Busato, P.; Moshou, D.; Pearson, S.; Bochtis, D. Machine learning in agriculture: A review. Sensors 2018, 18, 2674. [Google Scholar] [CrossRef] [Green Version]
  16. Romera-Paredes, B.; Torr, P.H.S. Recurrent instance segmentation. In Proceedings of the 14th European Conference, Amsterdam, The Netherlands, 11–14 October 2016; pp. 312–329. [Google Scholar]
  17. Pound, M.P.; Atkinson, J.A.; Townsend, A.J.; Wilson, M.H.; Griffiths, M.; Jackson, A.S.; Bulat, A.; Tzimiropoulos, G.; Wells, D.M.; Murchie, E.H.; et al. Deep Machine Learning provides state-of-the-art performance in image-based plant phenotyping. Gigascience 2017, 6, 1–10. [Google Scholar] [CrossRef]
  18. Long, J.; Shelhamer, E.; Darrell, T. Fully convolutional networks for semantic segmentation. IEEE Trans. Pattern Anal. Mach. Intell. 2015, 79, 1337–1342. [Google Scholar]
  19. Sa, I.; Chen, Z.; Popović, M.; Khanna, R.; Liebisch, F.; Nieto, J.; Siegwart, R. weednet: Dense semantic weed classification using multispectral images and mav for smart farming. IEEE Robot. Autom. Lett. 2017, 3, 588–595. [Google Scholar] [CrossRef] [Green Version]
  20. Badrinarayanan, V.; Kendall, A.; Cipolla, R. Segnet: A deep convolutional encoder-decoder architecture for image segmentation. IEEE Trans. Pattern Anal. Mach. Intell. 2017, 39, 2481–2495. [Google Scholar] [CrossRef]
  21. Ronneberger, O.; Fischer, P.; Brox, T. U-net: Convolutional networks for biomedical image segmentation. In Proceedings of the 18th Medical Image Computing and Computer-Assisted Intervention, Munich, Germany, 5–9 October 2015. [Google Scholar]
  22. Chen, L.C.; Papandreou, G.; Kokkinos, I.; Murphy, K.; Yuille, A.L. Deeplab: Semantic image segmentation with deep convolutional nets, atrous convolution, and fully connected crfs. IEEE Trans. Pattern Anal. Mach. Intell. 2018, 40, 834–848. [Google Scholar] [CrossRef]
  23. Sa, I.; Popović, M.; Khanna, R.; Chen, Z.; Lottes, P.; Liebisch, F.; Nieto, J.; Stachniss, C.; Walter, A.; Siegwart, R. WeedMap: A large-scale semantic weed mapping framework using aerial multispectral imaging and deep neural network for precision farming. Remote Sens. 2018, 10, 1423. [Google Scholar] [CrossRef] [Green Version]
  24. Barth, R.; IJsselmuiden, J.; Hemming, J.; Van Henten, E.J. Synthetic bootstrapping of convolutional neural networks for semantic plant part segmentation. Comput. Electron. Agric. 2019, 161, 291–304. [Google Scholar] [CrossRef]
  25. De Brabandere, B.; Neven, D.; Van Gool, L. Semantic instance segmentation with a discriminative loss function. In Proceedings of the IEEE Conference on Computer Vision and Pattern Recognition, Honolulu, HI, USA, 21–26 July 2017; pp. 478–480. [Google Scholar]
  26. Milioto, A.; Lottes, P.; Stachniss, C. Real-time semantic segmentation of crop and weed for precision agriculture robots leveraging background knowledge in CNNs. In Proceedings of the IEEE International Conference on Robotics and Automation, Brisbane, Australia, 21–25 May 2018. [Google Scholar]
  27. Gómez-Candón, D.; De Castro, A.I.; López-Granados, F. Assessing the accuracy of mosaics from unmanned aerial vehicle (UAV) imagery for precision agriculture purposes in wheat. Precis. Agric. 2014, 15, 44–56. [Google Scholar] [CrossRef] [Green Version]
  28. Rango, A.; Laliberte, A.; Steele, C.; Herrick, J.E.; Bestelmeyer, B.; Schmugge, T.; Roanhorse, A.; Jenkins, V. Research article: Using unmanned aerial vehicles for rangelands: Current applications and future potentials. Environ. Pract. 2006, 8, 159–168. [Google Scholar] [CrossRef] [Green Version]
  29. Gong, Y.; Duan, B.; Fang, S.; Zhu, R.; Wu, X.; Ma, Y.; Peng, Y. Remote estimation of rapeseed yield with unmanned aerial vehicle (UAV) imaging and spectral mixture analysis. Plant Methods 2018, 14, 70. [Google Scholar] [CrossRef] [PubMed]
  30. Konoplich, G.V.; Putin, E.O.; Filchenkov, A.A. Application of deep learning to the problem of vehicle detection in UAV images. In Proceedings of the 2016 IEEE International Conference on Soft Computing and Measurements, Adygeya, Russia, 25–27 May 2016; pp. 4–6. [Google Scholar]
  31. Benjamin, K.; Diego, M.; Devis, T. Detecting mammals in UAV images: Best practices to address a substantially imbalanced dataset with deep learning. Remote Sens. Environ. 2018, 216, 139–153. [Google Scholar]
  32. Zhang, X.; Chen, G.; Wang, W.; Wang, Q.; Dai, F. Object-based land-cover supervised classification for very-high-resolution UAV images using stacked denoising autoencoders. IEEE J. Sel. Top. Appl. Earth Obs. Remote Sens. 2017, 10, 3373–3385. [Google Scholar] [CrossRef]
  33. Yang, M.D.; Huang, K.S.; Kuo, Y.H.; Tsai, H.P.; Lin, L.M. Spatial and spectral hybrid image classification for rice lodging assessment through UAV imagery. Remote Sens. 2017, 9, 583. [Google Scholar] [CrossRef] [Green Version]
  34. Milletari, F.; Navab, N.; Ahmadi, S.A. V-Net: Fully convolutional neural networks for volumetric medical image segmentation. In Proceedings of the 14th 3D Vision, Stanford, CA, USA, 25–28 October 2016; pp. 565–571. [Google Scholar]
  35. Yuan, M.; Liu, Z.; Wang, F. Using the wide-range attention U-Net for road segmentation. Remote Sens. Lett. 2019, 10, 506–515. [Google Scholar] [CrossRef]
  36. Yao, Y.; Miao, Y.; Huang, S.; Gao, L.; Ma, X.; Zhao, G.; Jiang, R.; Chen, X.; Zhang, F.; Yu, K.; et al. Active canopy sensor-based precision N management strategy for rice. Agron. Sustain. Dev. 2012, 32, 925–933. [Google Scholar] [CrossRef] [Green Version]
  37. Ozer, H. Sowing date and nitrogen rate effects on growth, yield and yield components of two summer rapeseed cultivars. Eur. J. Agron. 2003, 19, 453–463. [Google Scholar] [CrossRef]
  38. Singh, I.; Srivastava, A.K.; Chandna, P.; Gupta, R.K. Crop sensors for efficient nitrogen management in sugarcane: Potential and constraints. Sugar Tech. 2006, 8, 299–302. [Google Scholar] [CrossRef]
  39. Teal, R.K.; Tubana, B.; Girma, K.; Freeman, K.W.; Arnall, D.B.; Walsh, O.; Raun, W.R. In-season prediction of corn grain yield potential using normalized difference vegetation index. Agron. J. 2006, 98, 1488–1494. [Google Scholar] [CrossRef] [Green Version]
  40. Ma, N.; Yuan, J.; Li, M.; Li, J.; Zhang, L.; Liu, L.; Naeem, M.S.; Zhang, C. Ideotype population exploration: Growth, photosynthesis, and yield components at different planting densities in winter oilseed rape (Brassica napus L.). PLoS ONE 2014, 9, e114232. [Google Scholar] [CrossRef]
  41. Wang, M.; Li, Q.; Hu, Q.; Yuan, H. A parallel interior orientation method based on lookup table for UAV images. In Proceedings of the IEEE International Conference on Spatial Data Mining and Geographical Knowledge Services, Fuzhou, China, 29 June–1 July 2011; pp. 397–400. [Google Scholar]
  42. Kelcey, J.; Lucieer, A. Sensor correction of a 6-band multispectral imaging sensor for UAV remote sensing. Remote Sens. 2012, 4, 1462–1493. [Google Scholar] [CrossRef] [Green Version]
  43. Hu, P.; Guo, W.; Chapman, S.C.; Guo, Y.; Zheng, B. Pixel size of aerial imagery constrains the applications of unmanned aerial vehicle in crop breeding. ISPRS J. Photogramm. Remote Sens. 2019, 154, 1–9. [Google Scholar] [CrossRef]
  44. Zhou, K.; Cheng, T.; Zhu, Y.; Cao, W.; Ustin, S.L.; Zheng, H.; Yao, X.; Tian, Y. Assessing the impact of spatial resolution on the estimation of leaf nitrogen concentration over the full season of paddy rice using near-surface imaging spectroscopy data. Front. Plant Sci. 2018, 9, 964. [Google Scholar] [CrossRef] [Green Version]
  45. Feng, W.; Sui, H.; Huang, W.; Xu, C.; An, K. Water body extraction from very high-resolution remote sensing imagery using deep U-Net and a superpixel-based conditional random field model. IEEE Geosci. Remote Sens. Lett. 2018, 16, 618–622. [Google Scholar] [CrossRef]
  46. Langner, T.; Hedström, A.; Mörwald, K.; Weghuber, D.; Forslund, A.; Bergsten, P.; Ahlström, H.; Kullberg, J. Fully convolutional networks for automated segmentation of abdominal adipose tissue depots in multicenter water–fat MRI. Magn. Reson. Med. 2019, 81, 2736–2745. [Google Scholar] [CrossRef] [Green Version]
  47. Kingma, D.P.; Ba, J. Adam: A method for stochastic optimization. In Proceedings of the 2014 International Conference on Learning Representations, Banff, AB, Canada, 14–16 April 2014. [Google Scholar]
  48. He, K.; Zhang, X.; Ren, S.; Sun, J. Delving deep into rectifiers: Surpassing human-level performance on imageNet classification. In Proceedings of the IEEE International Conference on Computer Vision (ICCV), Santiago, Chile, 13–16 December 2015; pp. 1026–1034. [Google Scholar]
  49. Otsu, N. A threshold selection method from gray-level histograms. IEEE Trans. Syst. Man Cybern. 1979, 9, 62–66. [Google Scholar] [CrossRef] [Green Version]
  50. Puissant, A.; Rougier, S.; Stumpf, A. Object-oriented mapping of urban trees using Random Forest classifiers. Int. J. Appl. Earth Obs. Geoinf. 2014, 26, 235–245. [Google Scholar] [CrossRef]
  51. Kang, L.; Ye, P.; Li, Y.; Doermann, D. Convolutional neural networks for no-reference image quality assessment. In Proceedings of the 2014 IEEE Computer Vision and Pattern Recognition, Columbus, OH, USA, 23–28 June 2014. [Google Scholar]
  52. Camps-Valls, G.; Gómez-Chova, L.; Calpe-Maravilla, J.; Soria-Olivas, E.; Martín-Guerrero, J.D.; Moreno, J. Support vector machines for crop classification using hyperspectral data. In Proceedings of the 1st Pattern Recognition and Image Analysis, Puerto de Andratx, Mallorca, Spain, 4–6 June 2003; pp. 134–141. [Google Scholar]
  53. Kussul, N.; Lavreniuk, M.; Skakun, S.; Shelestov, A. Deep learning classification of land cover and crop types using remote sensing data. IEEE Geosci. Remote Sens. Lett. 2017, 14, 778–782. [Google Scholar] [CrossRef]
  54. Inoue, Y.; Sakaiya, E.; Zhu, Y.; Takahashi, W. Diagnostic mapping of canopy nitrogen content in rice based on hyperspectral measurements. Remote Sens. Environ. 2012, 126, 210–221. [Google Scholar] [CrossRef]
  55. Zhang, F.; Cui, Z.; Fan, M.; Zhang, W.; Chen, X.; Jiang, R. Integrated soil–crop system management: Reducing environmental risk while increasing crop productivity and improving nutrient use efficiency in China. J. Environ. Qual. 2011, 40, 1051–1057. [Google Scholar] [CrossRef] [PubMed]
  56. Wright, G.C.; Smith, C.J.; Woodroofe, M.R. The effect of irrigation and nitrogen fertilizer on rapeseed (Brassica napes) production in South-Eastern Australia: I. Growth and seed yield. Irrig. Sci. 1988, 9, 1–13. [Google Scholar] [CrossRef]
  57. Jia, B.; He, H.; Ma, F.; Diao, M.; Jiang, G.; Zheng, Z.; Cui, J.; Fan, H. Use of a digital camera to monitor the growth and nitrogen status of cotton. Sci. World J. 2014, 1, 1–2. [Google Scholar] [CrossRef]
  58. Lee, K.J.; Lee, B.W. Estimation of rice growth and nitrogen nutrition status using color digital camera image analysis. Eur. J. Agron. 2013, 48, 57–65. [Google Scholar] [CrossRef]
  59. Walsh, O.S.; Klatt, A.R.; Solie, J.B.; Godsey, C.B.; Raun, W.R. Use of soil moisture data for refined green seeker sensor based nitrogen recommendations in winter wheat. Precis. Agric. 2013, 14, 343–356. [Google Scholar] [CrossRef] [Green Version]
  60. Jay, S.; Rabatel, G.; Hadoux, X.; Moura, D.; Gorretta, N. In-field crop row phenotyping from 3D modeling performed using Structure from Motion. Comput. Electron. Agric. 2015, 110, 70–77. [Google Scholar] [CrossRef] [Green Version]
  61. Kaushal, S.S.; Groffman, P.M.; Band, L.E.; Elliott, E.M.; Shields, C.A.; Kendall, C. Tracking nonpoint source nitrogen pollution in human-impacted watersheds. Environ. Sci. Technol. 2011, 45, 8225–8232. [Google Scholar] [CrossRef]
  62. Zhang, J.; Yang, C.; Song, H.; Hoffmann, W.C.; Zhang, D.; Zhang, G. Evaluation of an airborne remote sensing platform consisting of two consumer-grade cameras for crop identification. Remote Sens. 2016, 8, 257. [Google Scholar] [CrossRef] [Green Version]
Figure 1. Study area and arrangement of the experimental sites: (a) geographic map showing the study area, (b) test fields for rapeseed, (c) nitrogen fertilizer application levels, and (d) application levels of nitrogen fertilizer in each plot in Area 2 and Area 3 according to the table.
Remotesensing 12 01403 g001
Figure 2. The architecture of the U-Net model used in this study with an input sample size of 256 × 256 pixels as an example. Each box represents the feature maps with the dimension of width × height on the left. For Conv 1, it performs two convolution operations with a 3 × 3 convolutional kernel, the number of feature maps is 64 with the size of 256 × 256 pixels, and then the max-pooling with a kernel size of 2 × 2 is performed.
Remotesensing 12 01403 g002
Figure 3. Loss curves of the proposed model for training and validating the datasets in four input patch sizes.
Remotesensing 12 01403 g003
Figure 4. Four evaluation metrics results obtained for four patch sizes.
Remotesensing 12 01403 g004
Figure 5. Summary of the precision, recall, F-measure (F1), and Intersection of Union (IoU) results obtained with all five segmentation methods.
Remotesensing 12 01403 g005
Figure 6. Purple rapeseed leaf extraction results obtained using five methods. Four representative rapeseed field images were selected to illustrate the segmentation effects. The first row shows the original rapeseed images in the field. The second row shows the manual segmentation results obtained using ArcMap software. The third to seventh rows show the purple rapeseed leaf segmentation results obtained using HSeg, random forest (RF), support vector machine (SVM), SegNet, and U-Net, respectively. Objects of interest (a withered leaf in region a, a darker purple leaf in region b, a ground object in region c, and a purple leaf overlapping with a green leaf in region d) were marked with orange boxes.
Remotesensing 12 01403 g006
Figure 7. IoU results obtained for four image spatial resolutions and four patch sizes.
Remotesensing 12 01403 g007
Figure 8. Frequency diagram and descriptive statistics of purple leaf size in unmanned aerial vehicle (UAV) imagery with resolution of 1.86 mm/pixel.
Remotesensing 12 01403 g008
Figure 9. The results evaluation of N stress detected by the ratios of purple rapeseed leaves (purple leaf area to total leaf area). (a) Scatter plot and fitted curve between four N application level and N content measured by GS, (b) scatter plot and fitted curve between the ratios of purple rapeseed leaves extracted by the U-Net model and GS values, and (c–f) the images corresponded to the points in the (b).
Remotesensing 12 01403 g009
Table 1. Main physicochemical properties of the soil in the study area.
TexturepHOrganic Matter (g/kg)Available N (mg/kg)Available P (mg/kg)Available K (mg/kg)
Silt clay loam6.7124.16133.1217.16145.89
Table 2. Statistics for sample capacities and clip strides with all four patch sizes.
Patch SizeTraining SetValidation SetTest SetStride
64 × 6462,75920,92020,92064
128 × 12825,31384388438128
256 × 256882529412941128
512 × 5122841947947128
Table 3. Descriptive statistics and the differences of GreenSeeker (GS) values and purple leaf ratios among four N application levels.
N Rate
(kg/ha)
Number of SamplesMaxMinRangeMeanCV (%)ANOVA Results
GS
values
0230.590.4050.1850.474d9.4p < 0.05
75130.6650.520.1450.568c6.1
150150.7050.540.1650.624b8.4
225140.720.6050.1150.678a5.8
Purple Leaf
Ratios
0230.5360.1670.3690.308a33.2p < 0.05
75130.1650.0480.1050.056b18.3
150150.0500.050.016c11.2
225140.00200.0020.001c1.0
Max = maximum, Min = minimum, and CV = coefficient of variation; mean values followed by the same letter within a column of GS values or purple leaf ratios are not significantly different from one another at 0.05 probability level.

