Conservation Value of World Natural Heritage Sites’ Outstanding Universal Value via Multiple Techniques—Bogda, Xinjiang Tianshan

Abstract
:1. Introduction
2. Materials and Methods
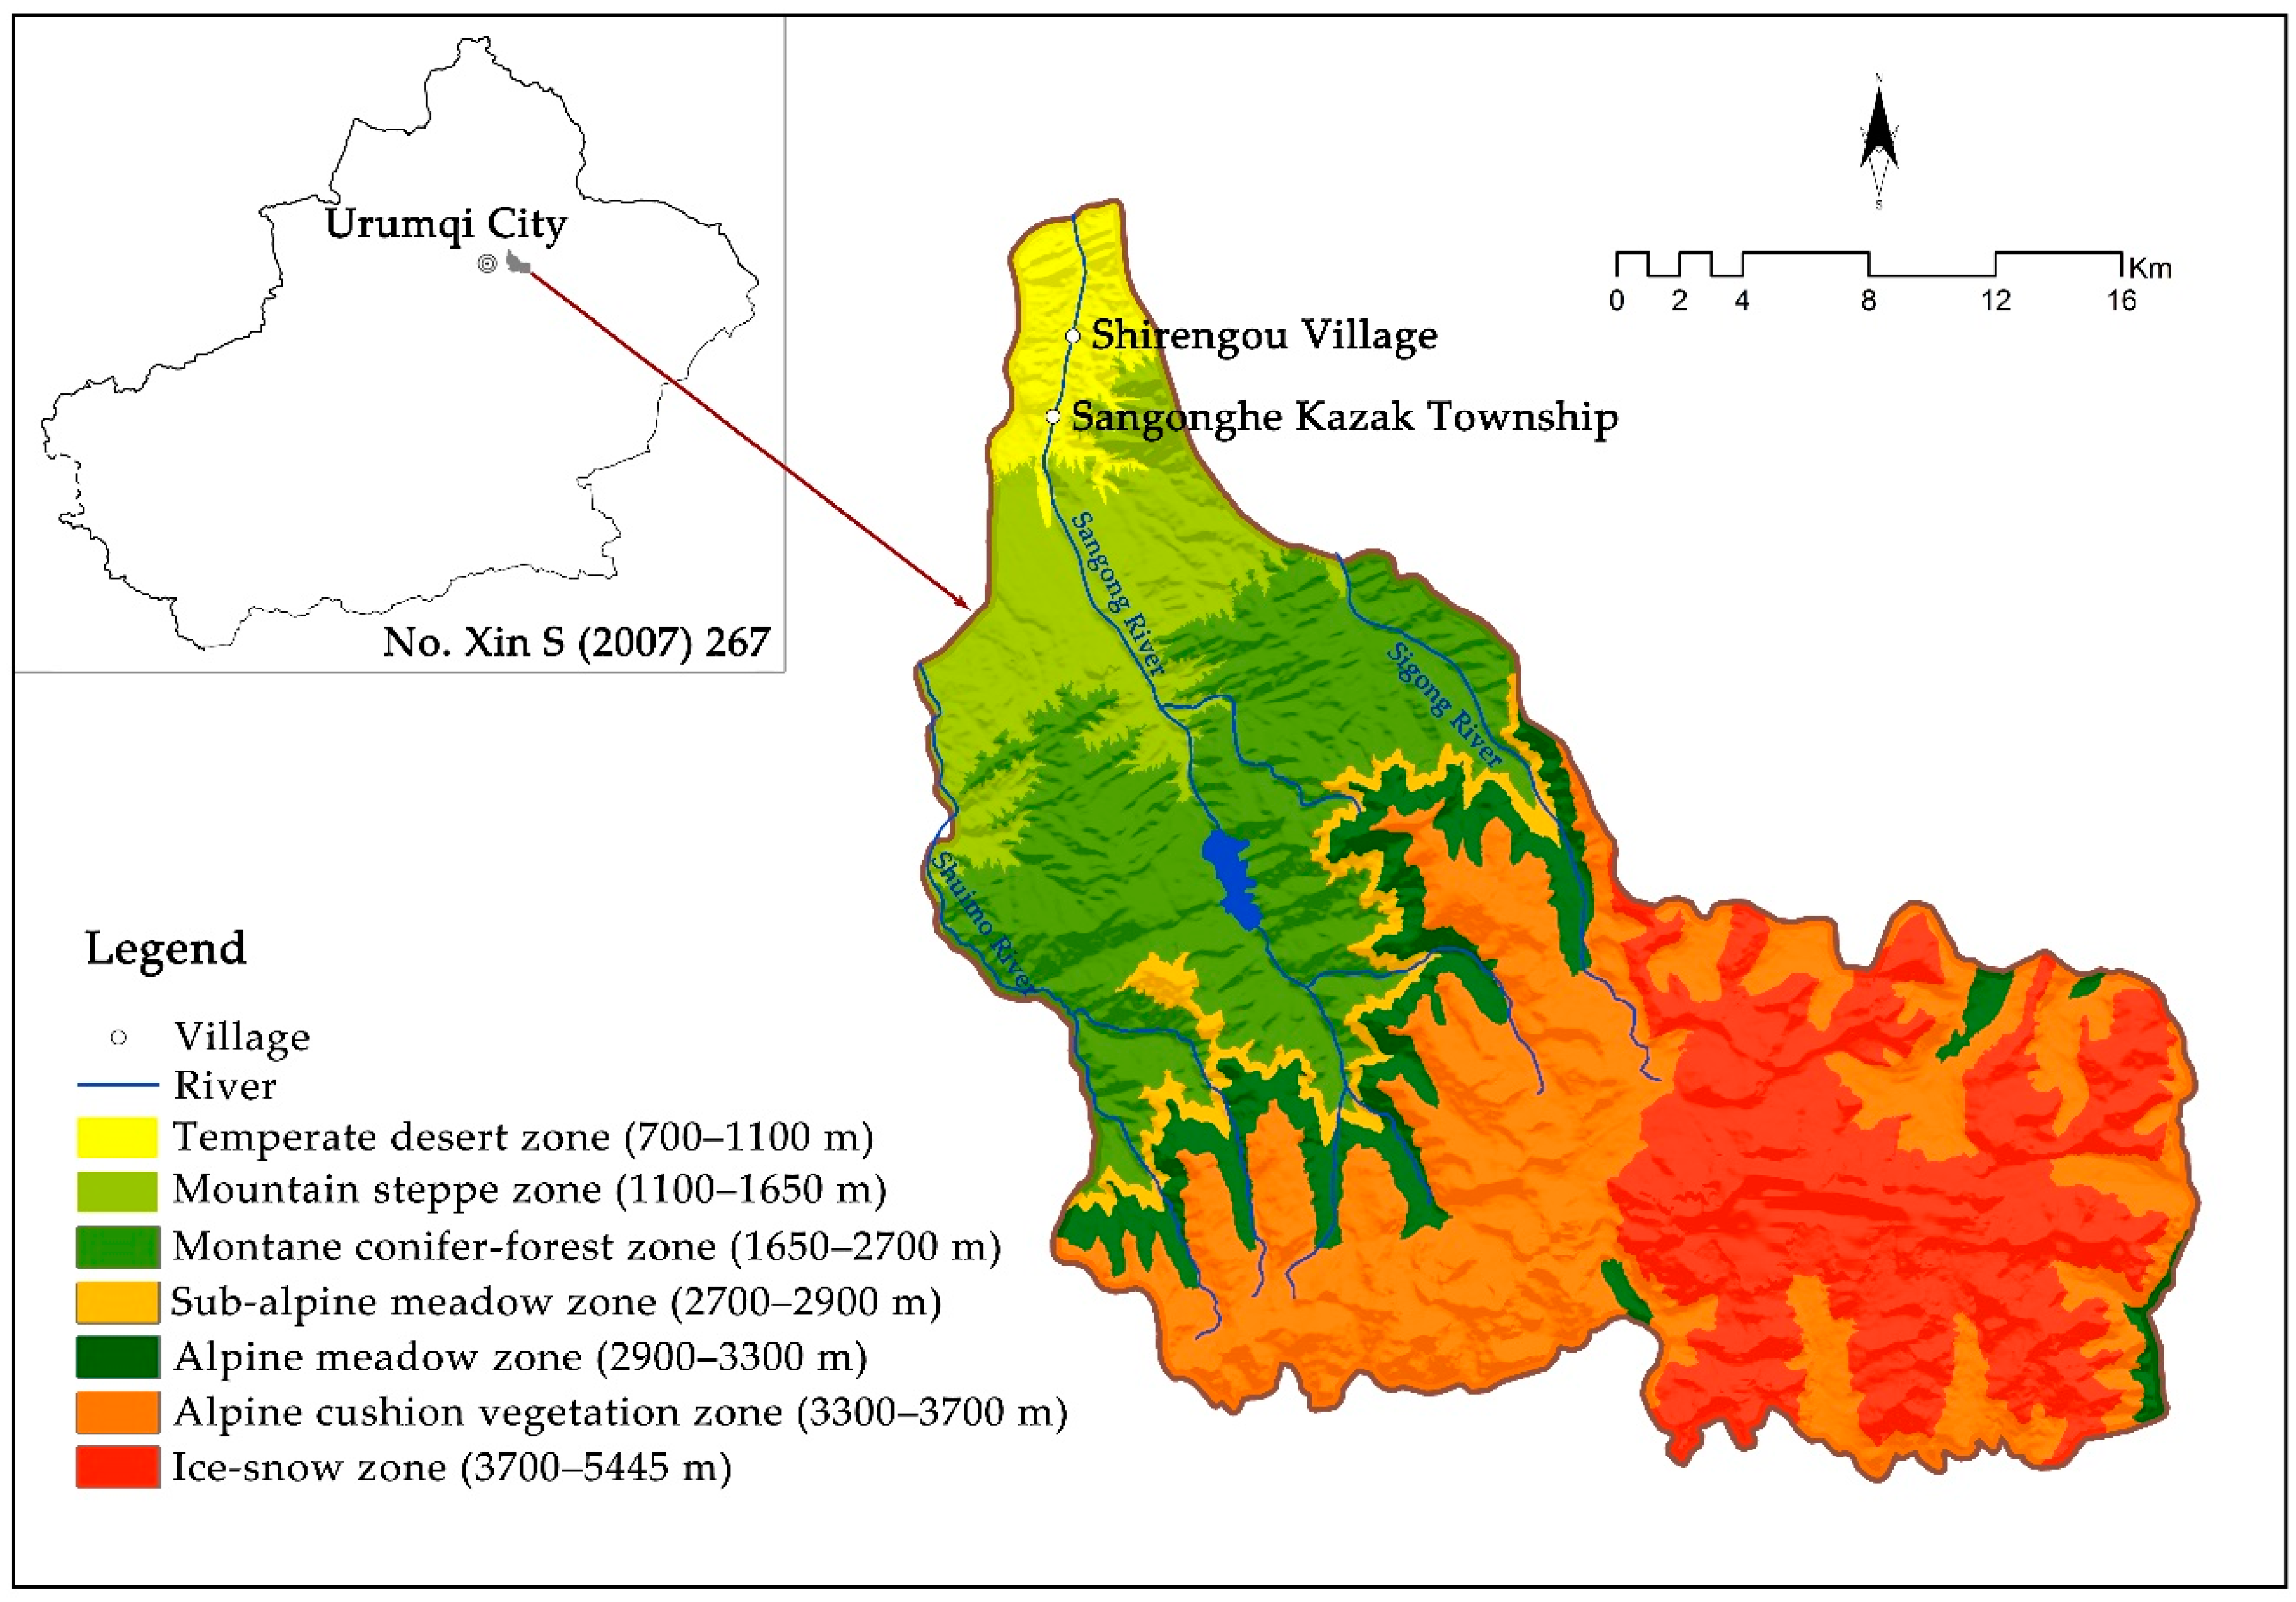
2.1. Study Area
2.2. Data Sources and Processing
2.3. Methods
2.3.1. Heritage Value Protection Significance Index (HVSPI) Construction
2.3.2. Spatial Statistical Model
- Spatial autocorrelation analysis: Exploratory Spatial Data Analysis (ESDA) is a measure of the degree of spatial agglomeration. The ESDA is obtained by calculating the spatial autocorrelation coefficient, describing the spatial agglomeration and anomaly of the spatial distribution pattern of visual objects or phenomena and discovering the spatial interaction between research objects. ESDA has two types of analysis methods, namely, global statistics and local statistics [21,46,48]:
- Global Spatial Autocorrelation (Moran’s I) is used to verify the spatial correlation of an element of the entire study area. The formula is:where, N is the total number of 1 km × 1 km raster data center points in the study area; and represent the observations of different feature attributes on x in the spatial unit; is the mean value, is the spatial weight matrix. The same below.
- Local Indicators of Spatial Autocorrelation (LISA) reflect the degree of correlation between a geographical phenomenon or attribute of a unit of a small local area of the whole study area and the same phenomenon or property of an adjacent local small area unit. The formula is [72]:where, a positive Ii value represents a spatial agglomeration of similar values (high or low) around the area unit; and a negative Ii value represents the spatial agglomeration between non-similar values.
- Spatial econometric model: after determining the spatial correlation of the regional unit attributes, the spatial interaction between different areas should be introduced into the model as a variable to construct a spatial econometric model, which mainly includes two types: spatial lag model (SLM) and a spatial error model (SEM) [73].
- The formula of SLM is:where, is the dependent variable matrix of region i at period t; is the argument matrix of region i in period t; the parameter β reflects the influence of the independent variable on the dependent variable; W is a spatial weights matrix; ρ is the spatial autoregressive coefficient, which reflects the influence of observation errors in neighboring areas; and ε represents the residual items.
- SEM mainly considered whether the dependent variable is spread by the same behavior in its neighboring area. The formula of the SEM is:where, and are error perturbation term vectors; and λ is the coefficient of autocorrelation for the SEM, which reflects the influence direction and degree of dependent variables in neighboring regions. The spatial dependence of the SEM is represented in the error term, which measures the influence of the error impact of the dependent variable on the observed values in the region.
- The choice of spatial econometric model requires Ordinary Least Squares (OLS) regression analysis first. If it is found in the spatial correlation test that the spatial lag model Lagrange multiplier test statistic LMLAG is statistically more significant than the spatial error LMERROR, then the SLM is selected. If LMERROR is statistically more significant than LMLAG, then the SEM is selected. If the both of LMLAG and LMERROR are not significant, then the results of the Ordinary Least Squares (OLS) regression were selected [74]. With ArcGIS 10.5 and the GeoDa software, we used above spatial regression analysis to analyze the relationship between the OUV conservation index and the plant community diversity characteristics of the study area.
2.3.3. Field Survey Method
3. Results
3.1. Analysis of the Spatial Pattern of OUV Conservation
3.1.1. Comprehensive Assessment of OUV Conservation Indices
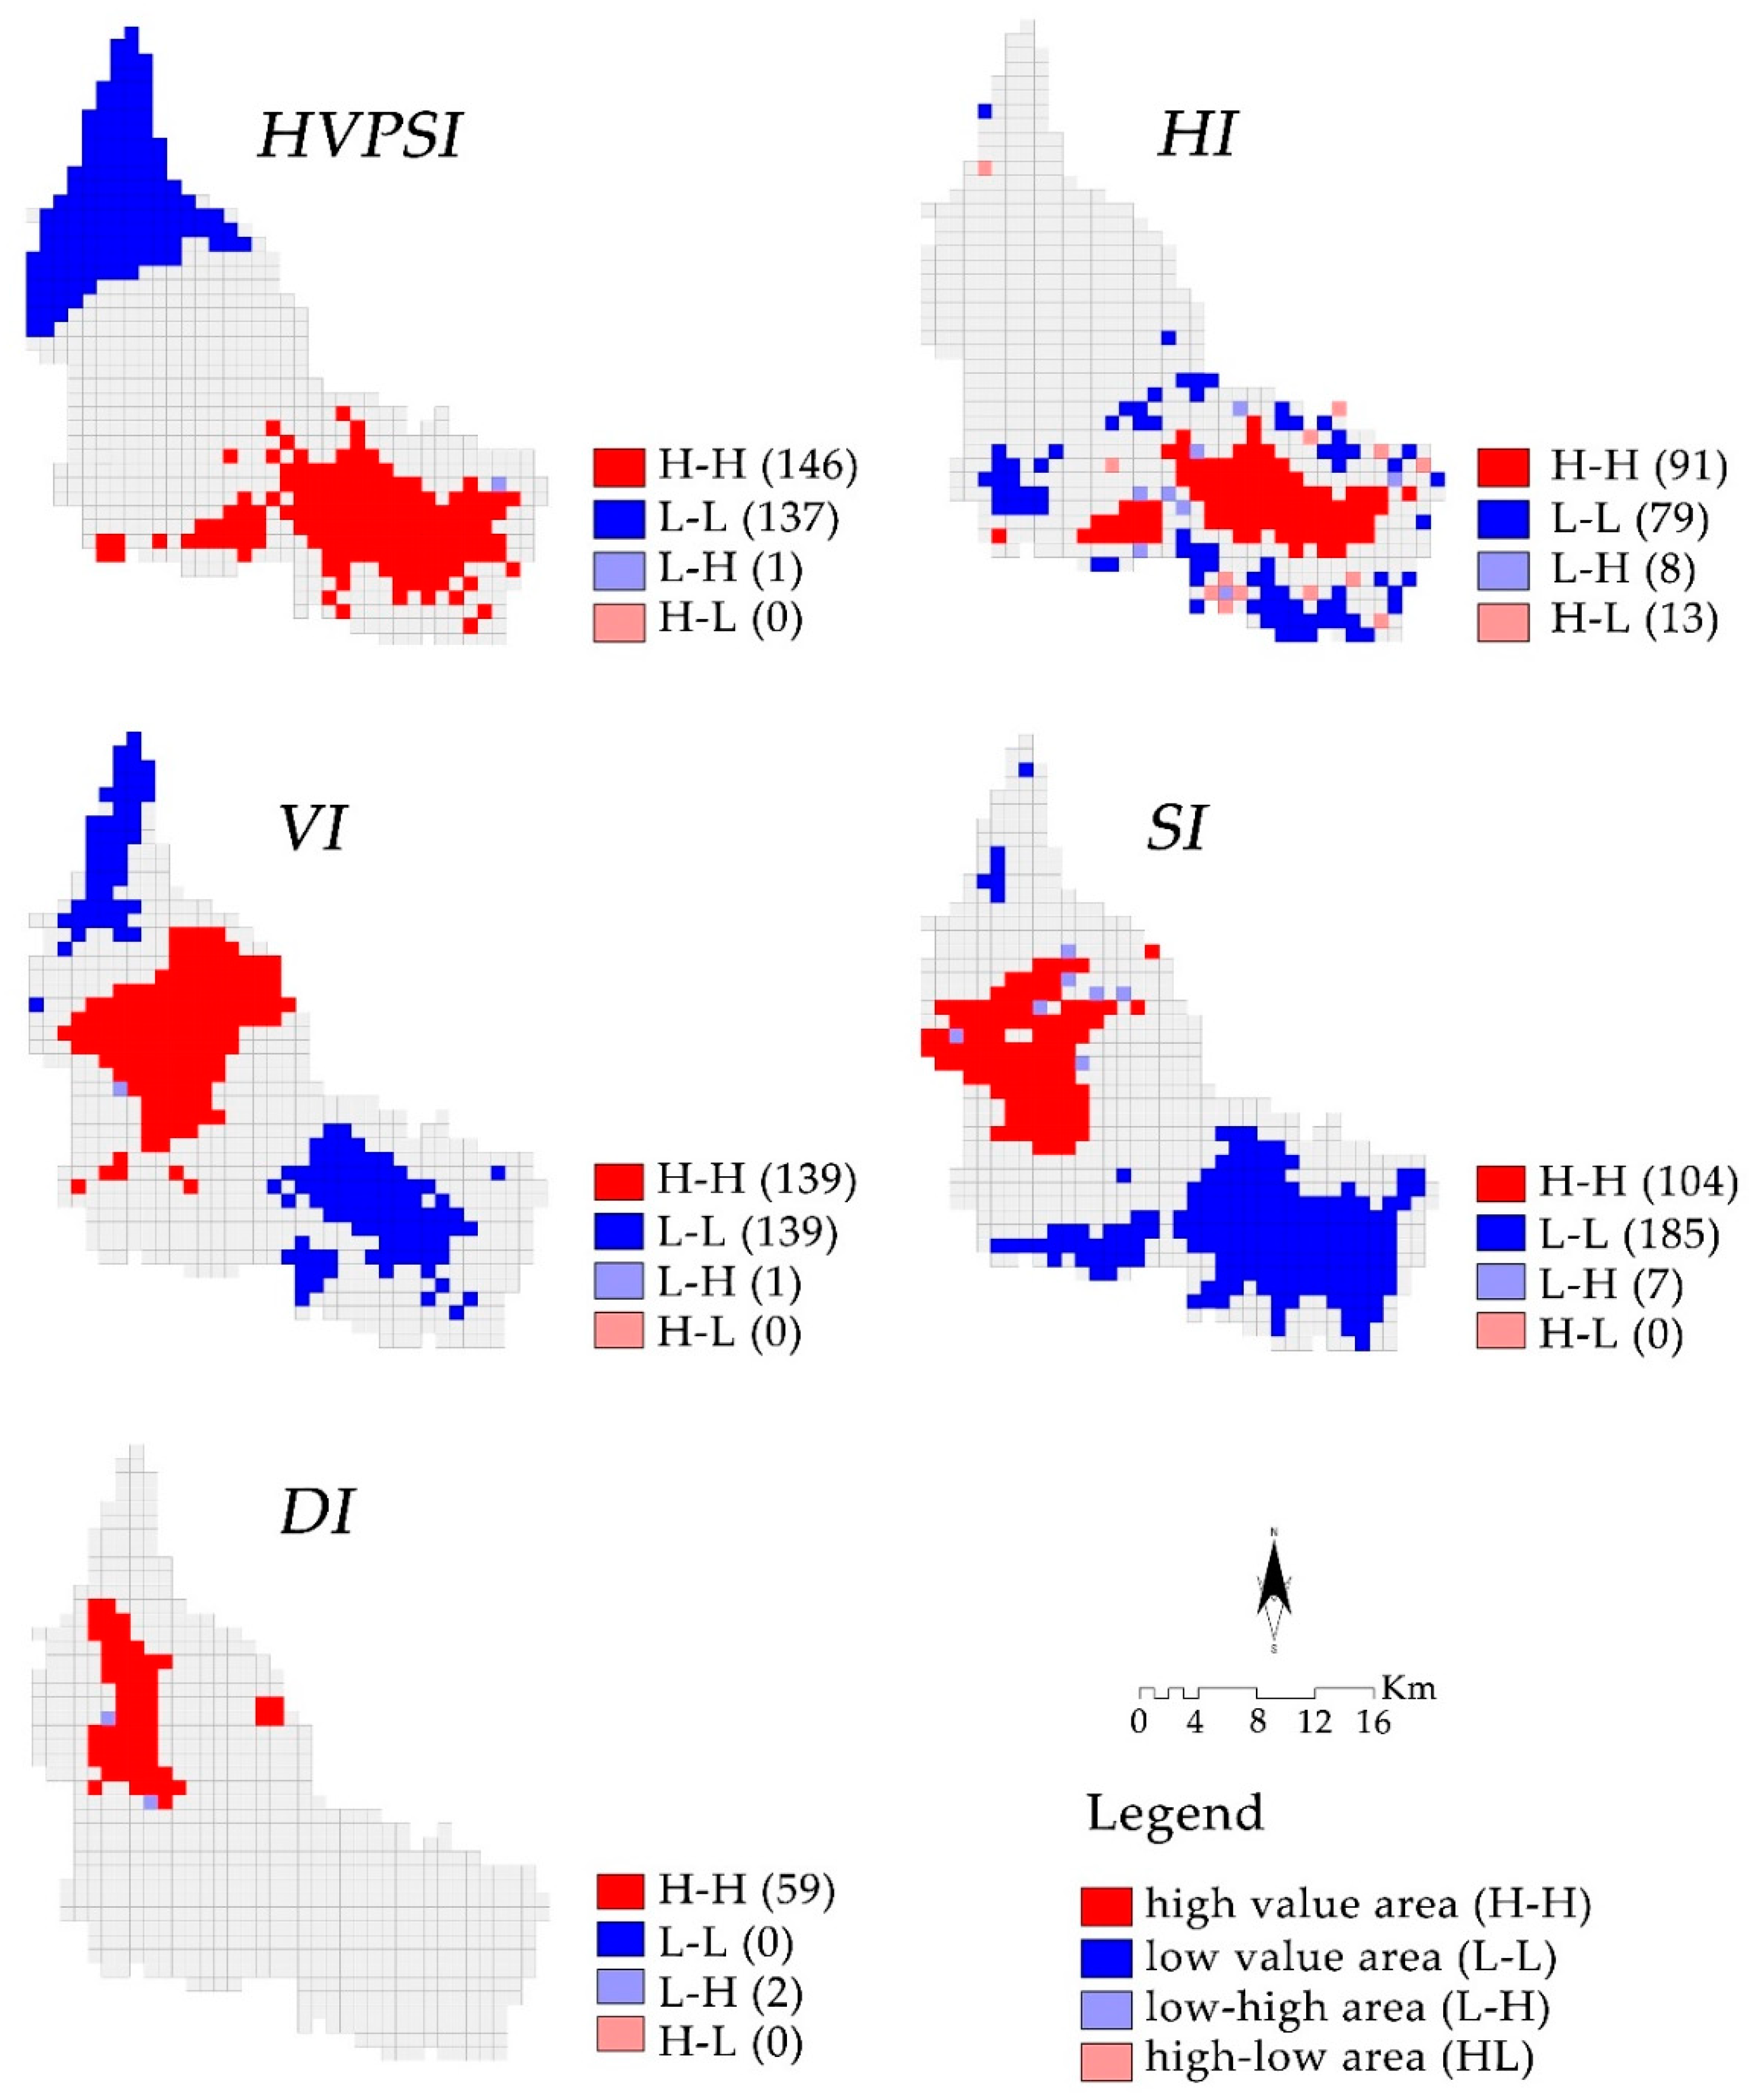
3.1.2. Spatial Correlation Analysis of OUV Conservation Indices
3.2. Community Characteristics Under HVPSI Zones
3.2.1. Plant Community Composition
3.2.2. Plant Community Diversity
3.3. Relationship Between OUV Conservation Index and Plant Community Diversity
4. Discussion
4.1. Indicators of the OUV Conservation Index
4.2. Space Zoning Verification of HVPSI and Screening of Characterisation Elements in the Zone
- The level 5 areas of HVPSI and HI are uniformly distributed in space. There is a positively correlated spatial agglomeration in the H-H, which is mainly distributed in the southern IZ. The area is dominated by glaciers, which completely preserves the Quaternary glacial and moraine landform type [14]. It has been thought that the mountain glaciers were the material basis and characteristic cultural foundation for the ecological environment and sustainable socio-economic development of the arid regions, which has unique and irreplaceable ecological service functions [78]. The assessment results of this sub-area are consistent with previous research on the importance of glacier values, as well as with the results of the IUCN experts’ assessment of the value of the region’s heritage. Therefore, in view of the above-mentioned zoning and determination of value elements, the glaciers in the study area should be strictly protected; for the subsequent heritage protection processes, glaciers should be maintained in their original natural state such that the original ecological environment is not disturbed by humans [79].
- The level 4 area of the HVPSI is dominated by alpine mat vegetation, which is distributed in the buffer zone around the H-H. The region includes a climbing base camp area, ice dammed lake and the area that the glacial snow has degraded into areas of alpine meadows, alpine grasslands, bare land and sparse grassland in the period between 1990 and 2015. In the field survey, many plant species were found in the area, contained in the families of Compositae, Ranunculaceae and Rosaceae. The region is rich in species diversity (the values of the Simpson Index and Margalef Index are high). Many rare, endangered and endemic species of animals and plants are distributed in this area, such as Myosotis alpestris (Near Threatened, NT), the snow leopard (Panthera uncia) (Endangered, EN) and the ibex (Capra ibex) (Least Concern, LC) on the IUCN Red List of Threatened Species, Saussurea involucrata on the Xinjiang Uygur Autonomous Region key protected wild plants list and Oxytropis bogdoschanica on the list of endemic plants in Bogda. The species diversity and distribution of rare, endangered and endemic species of animals and plants embody the ecological value of WNHSs. The field survey of plant species verified that the division of the area was more reasonable; from these results, key areas needing protection were identified. Therefore, it is necessary to demarcate the partition and screen the important key species within the partition. This study is the basis for research work on the number of important key species, habitats, migration routes and the impact of human activities in the vertical natural zone [24,27,79].
- The level 3 area is the area spanning the largest geographical space among the five partitions of the HVPSI. This area intersects with the level 5 area of the VI, SI and DI, spanning six natural vertical zones. The main natural vertical zone in the area is the MSZ, mainly comprised of Picea schrenkiana, Tianchi Lake and nearby resource points. In the field research, many plant species were found in the area, including 16 species and 10 families. The region is rich in species diversity (the values of the Simpson index and Margalef index are high). Additionally, rare and endangered endemic species are more distributed in this region than in the others, including Betula tianschanica (EN), Larix sibirica (LC), Juniperus pseudosabina (LC), Picea schrenkiana (LC) and so forth. Of the flora and fauna listed in the IUCN Protection List, CITES List and National Key Protected Areas list, 92.7% are located in this area. At the same time, the Tianchi Sigong River Basin in this region is an area prone to landslides and debris flow during natural disasters and the Tianchi Scenic Area is a concentrated area of tourism activities [55,80,81]. Thus, natural and human activities strongly impact on this area; therefore, protection is important for the conservation of Picea schrenkiana, Capreolus and Cervus elaphus tianshanicus. During the tourist and fire-prone seasons, high-frequency patrols of spruce forests should be conducted to control the scope of tourist visits and to thus minimize human and natural interference within the area. Additionally, to prevent forest fires, real-time monitoring and video surveillance of the tourist area and surrounding district should be undertaken [80]. Even when activities such as eco-tourism and popular science education are conducted in some of these areas, measures must be taken to ensure that the originality and integrity of the site must be maintained [48].
- The level 2 area of the HVPSI is distributed in the MSZ and the MCZ in the northern parts of the study area. In this area, the landscape type of temperate grassland has degraded into dry land in the period between 1990 and 2015. Also, this region contains temperate cluster grasses typical grassland, dwarf semi-shrub desert grasslands and areas with endangered and endemic species. In the field survey, the greatest number of plant species were found here, including 21 species from 14 families; these mainly involved Leguminosae, Gramineae and Rosaceae, which are rich in species diversity (the values of the Pielou Index and Margalef Index are high). In the process of protecting heritage, rare and endangered endemic species in the area should be targeted protection. The entry of invasive alien species should be prevented and the native ecological environment of the protected area should be conserved to maintain the originality of the OUV.
- The level 1 area of the HVPSI is concentrated in the areas where the herdsmen live in the north of the study area (including Shirengou Village and Sangonghe Kazak Township). The distribution of this area shows spatial agglomeration, where the temperate grassland has degraded into a mining area and a dry land and a sparse grassland has degraded into a dryland in the period between 1990 and 2015. The region is mainly distributed in the TDZ and the MSZ, with low vegetation coverage, low community structure and poor soil. In the field survey, the number of species in this area is less than other areas; the species are dominated by the TDZ’s Caragana soongorica, Seriphidium borotalense, Ceratoides latens and so forth [47]. The ecological environment is relatively fragile as there is some human disturbance in this area. Additionally, the original residents of the heritage site live here. Therefore, a reasonable protection of original residents should be allowed and the necessary tourist service facilities and protection facilities should be installed. However, in the process of conducting targeted heritage protection, such installations must not interfere with the ecological environment of the WNHS [82].
4.3. Limitations and Prospects of This Study
5. Conclusions
Author Contributions
Funding
Acknowledgments
Conflicts of Interest
Abbreviations
| OUV | Outstanding Universal Value |
| WNHS | World Natural Heritage Site |
| UNESCO | United Nations Educational, Scientific and Cultural Organization |
| HVPSI | Heritage Value Protection Significance Index |
| HVI | Heritage Value Protection Index |
| IUCN/SSC | International Union for the Conservation of Nature Species Survival Commission |
| TDZ | Temperate Desert Zone |
| MSZ | Mountain Steppe Zone |
| MCZ | Montane Conifer-forest Zone |
| SMZ | Sub-alpine Meadow Zone |
| AMZ | Alpine Meadow Zone |
| ACVZ | Alpine Cushion Vegetation Zone |
| IZ | Ice-snow Zone |
| DEM | Digital Evaluation Model |
| NDVI | Normalized Difference Vegetation Index |
| HI | Index of Integrity |
| VI | Index of Vulnerability |
| SI | Index of Sensitivity |
| DI | Index of Degree of interference |
| EI | Index of Environmental Factor |
| SBE | Scenic Beauty Estimation method |
| DLT | Degree of Degradation of Landscape Type |
| ESDA | Exploratory Spatial Data Analysis |
| Moran’s I | Global Spatial Autocorrelation Index |
| LISA | Local Indicators of Spatial Autocorrelation |
| SLM | Spatial Lag Model |
| SEM | Spatial Error Model |
| OLS | Ordinary Least Squares |
| IV | Importance Value |
References
- WHC. World Heritage and Sustainable Development. Decision 20 ga 13 of the 20th Session of the General Assembly of States Parties to the Convention Concerning the Protection of the World Cultural and Natural Heritage; UNESCO: Paris, France, 2015. [Google Scholar]
- UNESCO. Convention Concerning the Protection of the World Cultural and Natural Heritage. Adopted by the General Conference at Its Seventeenth Session in Paris, 16th November 1972; UNESCO: Paris, France, 1972. [Google Scholar]
- UNESCO. Operational Guidelines for the Implementation of the World Heritage Convention; UNESCO: Paris, France, 2015. [Google Scholar]
- Mitchell, N.; Leitão, L.; Migon, P.; Denyer, S. Study on the Application of Criterion VII: Considering Superlative Natural Phenomena and Exceptional Natural Beauty within the World Heritage Convention; IUCN: Gland, Switzerland, 2013; pp. 113–115. [Google Scholar]
- Su, Y.; Lin, H. Analysis of international tourist arrivals worldwide: The role of world heritage sites. Tour. Manag. 2014, 40, 46–58. [Google Scholar] [CrossRef]
- Zhang, Z.; Xiong, K.; Xiao, S.; Ying, B. Study on temporal-spatial distribution and inscription criteria of global World Heritage. World Reg. Stud. 2017, 26, 152–168. [Google Scholar]
- Huo, S.; Fan, W.; Sun, K. Study on the value and sustainable development of World Natural Heritage. J. Anhui Agric. Sci. 2011, 39, 17995–17998. [Google Scholar]
- Wu, L. Authenticity, integrity, and the protection of Taishan World Heritage resources. Soc. Sci. 2009, 144, 100–103. [Google Scholar]
- Yuan, Z. Discussion on the Countermeasures to maintain the authenticity and completeness of World Natural Heritage: A case study of wulingyuan. CPA Chin. Public Adm. 2006, 249, 73–75. [Google Scholar]
- Zhang, Y.; Min, Q.; Jian, W.; Liu, M. Values and conservation of honghe hani rice terraces system as a GIAHS site. J. Resour. Ecol. 2016, 7, 197–204. [Google Scholar]
- Chen, P.; Xiong, K.; Xiao, S. Global comparative analysis on the world natural heritage values of Libo cone karst in China. Geogr. Res. 2013, 32, 1517–1527. [Google Scholar]
- Hazen, H. Of outstanding universal value: The challenge of scale in applying the World Heritage Convention at national parks in the US. Geoforum 2008, 39, 252–264. [Google Scholar] [CrossRef]
- Nian, S.; Zhang, H.; Mao, L.; Zhao, W.; Zhang, H.; Lu, Y.; Zhang, Y.; Xu, Y. How outstanding universal value, service quality and place attachment influences tourist intention towards world heritage conservation: A case study of Mount Sanqingshan National Park, China. Sustainability 2019, 11, 3321. [Google Scholar] [CrossRef]
- Xu, X.; Yang, Z.; Saiken, A.; Shao, R.; Liu, X. Natural heritage value of Xinjiang Tianshan and global comparative analysis. J. Mt. Sci. 2012, 9, 262–273. [Google Scholar] [CrossRef]
- Ha, S.; Yang, Z. Evaluation for landscape aesthetic value of the Natural World Heritage Site. Environ. Monit. Assess. 2019, 191, 483–502. [Google Scholar] [CrossRef] [PubMed]
- Zhong, Y.; Xiong, K.; Du, F. Landscape aesthetic value of Nominaten Huanjiang Karst World Heritage and its comparative analysis based on World Heritage Criteria (vii). J. Kunming Univ. Sci. Technol. (Nat. Sci. Edution) 2014, 39, 25–32. [Google Scholar]
- Han, X.; Liu, C.; Hu, J.; Wang, X.; Luo, L.; Zhao, Y.; Li, L.; Ji, X.; Yan, H.; Wang, Y. Dynamic evolution of landscape pattern and ecological health assessment of Tianshan Natural Heritage Site in Xinjiang. Arid Land Geogr. 2019, 42, 195–205. [Google Scholar]
- Li, W.; Xiong, K.; Zhou, W. Aesthetic characters and world heritage value of Shibing karst landscape in Southeast Guizhou. J. Guizhou Norm. Univ. (Nat. Sci.) 2010, 28, 19–22. [Google Scholar]
- Zhou, Q.; Fang, H.; Su, W. Evaluation of ecotourism suitability for the Western Sichuan Plateau based on GIS and the artificial neural network. Resour. Sci. 2010, 32, 2384–2390. [Google Scholar]
- Bi, X.; Han, F. Overview of identification and evaluation of aesthetic values of World Natural Heritage. Landsc. Archit. 2018, 25, 115–119. [Google Scholar]
- Liu, Q.; Yang, Z.; Shi, H.; Wang, Z. Ecological risk assessment of geohazards in Natural World Heritage Sites: An empirical analysis of Bogda, Tianshan. Open Geosci. 2019, 11, 327–340. [Google Scholar] [CrossRef]
- Yao, X.; Du, Y.; Hao, G.; Ping, X.; Hu, J.; Hao, J. Outstanding universal value of plant diversity and conservation in Emeishan World Heritage Site. Guihaia 2018, 38, 1605–1613. [Google Scholar]
- Alves, R.J.V.; Weksler, M.; Oliveira, J.A.; Buckup, P.A.; Pombal, J.P., Jr.; Santana, H.R.G.; Peracchi, A.L.; Kellner, A.W.A.; Aleixo, A.; Bonino, A.R.L.; et al. Brazilian legislation on genetic heritage harms Biodiversity Convention goals and threatens basic biology research and education. An. Da Acad. Bras. De Cienc. 2018, 90, 1279–1284. [Google Scholar] [CrossRef] [Green Version]
- Xie, Z.; Shen, G.; Zhou, Y.; Fan, D.; Xu, W.; Gao, X.; Du, Y.; Xiong, G.; Zhao, C.; Zhu, Y.; et al. The outstanding universal value and conservation of the Shennongjia World Natural Heritage Site. Biodivers. Sci. 2017, 25, 490–497. [Google Scholar] [CrossRef] [Green Version]
- Ma, M.; Shen, G.; Xiong, G.; Zhao, C.; Xu, W.; Zhou, Y.; Xie, Z. Characteristic and representativeness of the vertical vegetation zonation along the altitudinal gradient in Shennongjia Natural Heritage. Chin. J. Plant Ecol. 2017, 41, 1127–1139. [Google Scholar]
- Ding, C. Comparative research on the proportion and combination sorts of adopted criterions of World Heritage between the globe and China. Acta Sci. Nat. Univ. Pekin. 2006, 42, 231–237. [Google Scholar]
- Wang, Y.; Yao, S.; Deng, Y. Spatio-temporal pattern evolution and influencing factors of governance efficiency of soil and water loss in theWeihe River Catchment. Sci. Geogr. Sin. 2019, 39, 836–846. [Google Scholar]
- Dong, S.; Wu, Y.; Liu, S.; Su, X.; Zhao, H.; Zhang, Y. Evaluation on grassland eco-security of the Altun Mountain National Nature Reserve. Acta Agrestia Sin. 2016, 24, 906–909. [Google Scholar]
- Shi, H.; Shi, T.; Yang, Z.; Wang, Z.; Han, F.; Wang, C. Effect of roads on ecological corridors used for Wildlife movement in a natural heritage Site. Sustainability 2018, 10, 2725. [Google Scholar] [CrossRef]
- Nicu, I.C.; Romanescu, G. Effect of natural risk factors upon the evolution of Chalcolithic human settlements in Northeastern Romania (Valea Oii watershed). From ancient times dynamics to present days degradation. Z. Fur Geomorphol. 2016, 60, 1–9. [Google Scholar] [CrossRef]
- Allan, J.R.; Venter, O.; Maxwell, S.; Bertzky, B.; Jones, K.; Shi, Y.; Watson, J.E.M. Recent increases in human pressure and forest loss threaten many Natural World Heritage Sites. Biol. Conserv. 2017, 206, 47–55. [Google Scholar] [CrossRef]
- Bailey, K.M.; McCleery, R.A.; Binford, M.W.; Zweig, C. Land-cover change within and around protected areas in a biodiversity hotspot. J. Land Use Sci. 2016, 11, 154–176. [Google Scholar] [CrossRef]
- Heino, M.; Kummu, M.; Makkonen, M.; Mulligan, M.; Verburg, P.H.; Jalava, M.; Rasanen, T.A. Forest loss in protected areas and intact forest landscapes: A Global Analysis. PLoS ONE 2015, 10, e0138918. [Google Scholar] [CrossRef]
- Hu, X.; Hu, K.; Zhang, X.; Wei, L.; Tang, J. Quantitative assessment of the impact of earthquake-induced geohazards on natural landscapes in Jiuzhaigou Valley. J. Mt. Sci. 2019, 16, 441–452. [Google Scholar] [CrossRef]
- Zhang, X. Research on outstanding universal value and the analysis method of heritage assessment: The Grand Canal as an example. Sci. Conserv. Archaeol. 2009, 21, 1–8. [Google Scholar]
- Li, Z.; Liu, L.; Sun, Y.; Cui, J. Assessment method of regional ecological security based on Pressure-State-Response model. Acta Ecol. Sin. 2010, 30, 6495–6503. [Google Scholar]
- Chen, Z.; Guo, L.; Xue, D. GIS-based ecological sensitivity analysis in Xin County. Ecol. Sci. 2015, 34, 97–102. [Google Scholar]
- Zhu, Q.; Zhou, W.M.; Jia, X.; Zhou, L.; Yu, D.P.; Dai, L.M. Ecological vulnerability assessment on Changbai Mountain National Nature Reserve and its surrounding areas, Northeast China. Ying Yong Sheng Tai Xue Bao 2019, 30, 1633–1641. [Google Scholar] [PubMed]
- Xu, W.; Yang, Y.; Zhang, L.; Xiao, Y.; Wang, X.; Ouyang, Z. Evaluation methods and case study of regional ecological carrying capacity for early-warning. Prog. Geogr. 2017, 36, 306–312. [Google Scholar]
- Pan, J.; Liu, X. Landscape ecological risk assessment and landscape security pattern optimization in Shule River Basin. Chin. J. Ecol. 2016, 35, 791–799. [Google Scholar]
- You, W.-B.; He, D.-J.; Qin, D.-H.; Ji, Z.-R.; Wu, L.-Y.; Yu, J.-A.; Chen, B.-R.; Tan, Y. System construction of early warning for ecological security at cultural and natural heritage mixed sites and its application: A case study of Wuyishan Scenery District. Ying Yong Sheng Tai Xue Bao 2014, 25, 1455–1467. [Google Scholar]
- Ma, X.; Lu, Z.; Lin, T. Ecological risk assessment of Yancheng Coastal Wetland. Mar. Environ. Sci. 2010, 29, 599–602. [Google Scholar]
- Wu, Y.; Deng, N. Resource-based urban ecological security early warning based on RBF Neural Network Model: A case study of Yulin city. Ecol. Econ. 2019, 35, 111–118. [Google Scholar]
- Wang, Z.; Du, X. Monitoring Natural World Heritage Sites: Optimization of the monitoring system in Bogda with GIS-based multi-criteria decision analysis. Environ. Monit. Assess. 2016, 188, 384–401. [Google Scholar] [CrossRef]
- Ai, Y.; Zhu, H.; Tan, X. Evaluation and prediction of urban ecological security of Changsha based on RS/GIS and GM (1, 1) Model. Acta Agric. Jiangxi 2019, 31, 131–137. [Google Scholar]
- Pang, Y.; Wang, L. A review of regional ecological security evaluation. China Popul. Resour. Environ. 2014, 24, 340–344. [Google Scholar]
- Lv, Y.; Xiong, K.; Rong, L.; Chen, H.; Gao, Y.; Ying, B. Comparative analysis of world heritage values on biological and ecological evolution in Fanjingshan Mountain. World Reg. Stud. 2016, 25, 131–141. [Google Scholar]
- Shi, H.; Yang, Z.; Han, F.; Shi, T.; Luan, F. Characteristics of temporal-spatial differences in landscape ecological security and the driving mechanism in Tianchi scenic zone of Xinjiang. Prog. Geogr. 2013, 32, 475–485. [Google Scholar]
- Gulijiang, H.; Liang, Y. Countermeasures for forest fire prevention and control in Bogda Peak Nature Reserve, Tianchi, Xinjiang. Available online: https://kns.cnki.net/KCMS/detail/detail.aspx?dbcode=CJFQ&dbname=CJFDLAST2019&filename=SLFH201902004&v=MTgwMTFNclk5RllJUjhlWDFMdXhZUzdEaDFUM3FUcldNMUZyQ1VSTE9lWitScUZ5N25VTHpKTmlITlpyRzRIOWo= (accessed on 25 October 2019).
- Tumur, A.; Mamut, R.; Abbas, A. Community structure characteristics of saxicolous lichens in the Bogda Mountains of Xinjiang, China. Acta Ecol. Sin. 2018, 38, 1053–1064. [Google Scholar] [Green Version]
- Ji, X.; Luo, L.; Wang, X.; Li, L.; Wan, H. Identification and change analysis of Mountain Altitudinal Zone in Tianshan Bogda Natural Heritage Site based on DEM-NDVI-land cover classification. J. Geo Inf. Sci. 2018, 20, 1350–1360. [Google Scholar]
- Wang, P.; Li, Z.; Li, H.; Wu, L.; Jin, S.; Zhou, P. Changes of ice-thickness and volume for representative glaciers in Tianshan Mountains in the past 50 years. Acta Geogr. Sin. 2012, 67, 929–940. [Google Scholar]
- Yu, Y.; He, B. Estimation of the non- tratable value of Xinjang Tianchi wetland ecosystem service function bassced on the CVM. J. Arid Land Resour. Environ. 2012, 26, 53–58. [Google Scholar]
- Zheng, Y.; Sun, W.; Guo, X.; Liang, T.; Gao, J.; Zhou, R. Structural characteristic and orogenic mechanism of Bogeda Tectonic Belt, Xinjiang. J. East. China Univ. Technol. (Nat. Sci.) 2014, 37, 199–206. [Google Scholar]
- Li, D.; You, Y.; Luan, F.; Chen, X. A research of tourism landscape resources evaluation and protection for Bogda World Natural Heritage Site. World Reg. Stud. 2015, 24, 159–167. [Google Scholar]
- Wang, X.; Yu, S.; Tang, D. The heritage value of mountain vertical zonation in Temperate Desert Region of China. Arid Zone Res. 2009, 26, 694–701. [Google Scholar] [CrossRef]
- Ji, X. Fine Extraction and Change Analysis of Mountain Altitudinal Zone on the Northern Slope of Tianshan Bogda. Master’s Thesis, Institute of Remote Sensing and Digital Earth, Chinese Academy of Sciences, Beijing, China, 2018. [Google Scholar]
- Geldmann, J.; Joppa, L.N.; Burgess, N.D. Mapping change in human pressure globally on land and within protected AREAS. Conserv. Biol. 2014, 28, 1604–1616. [Google Scholar] [CrossRef] [PubMed]
- Han, F.; Yang, Z.; Liu, X.; Di, F. Impact assessment and protection of outstanding landscape integrity in a Natural Heritage Site: Fairy Valley, Kanas Nature Reserve, Xinjiang, China. J. Mt. Sci. 2011, 8, 46–52. [Google Scholar] [CrossRef]
- Han, F.; Yang, Z.; Shi, H.; Liu, Q.; Wall, G. How to promote sustainable relationships between heritage conservation and community, based on a Survey. Sustainability 2016, 8, 886. [Google Scholar] [CrossRef]
- Zhang, L.; Wu, B.; Yin, K.; Li, X.; Kia, K.; Zhu, L. Impacts of human activities on the evolution of estuarine wetland in the Yangtze Delta from 2000 to 2010. Environ. Earth Sci. 2015, 73, 435–447. [Google Scholar] [CrossRef]
- Mohamed, S.A.; El-Raey, M.E. Land cover classification and change detection analysis of Qaroun and Wadi El-Rayyan lakes using multi-temporal remotely sensed imagery. Environ. Monit. Assess. 2019, 191, 229. [Google Scholar] [CrossRef]
- Xu, W.; Tian, Y.; Liu, Y.; Zhao, B.; Liu, Y.; Zhang, X. Understanding the spatial-temporal patterns and influential factors on air quality Index: The case of North China. Int. J. Environ. Res. Public Health 2019, 16, 2820. [Google Scholar] [CrossRef]
- DeFries, R.; Hansen, A.; Newton, A.C.; Hansen, M.C. Increasing isolation of protected areas in tropical forests over the past twenty years. Ecol. Appl. 2005, 15, 19–26. [Google Scholar] [CrossRef]
- Shi, H.; Yang, Z.; Han, F.; Luan, F.; Shi, T. Assessment and analysis of eco-environment vulnerability in Tomur region of natural heritage site. Arid Land Geogr. 2013, 36, 318–328. [Google Scholar]
- Xiao-Long, S.; Xiao-Wen, L.I.; Jun-Hong, B.A.I.; Cong, L.I.; Yu, Z.; Song-Song, J. The ecological sensitivity evaluation in Yellow River Delta National Natural Reserve. Acta Ecol. Sin. 2009, 29, 4836–4846. [Google Scholar]
- Shi, H.; Yang, Z.; Han, F.; Shi, T.; Wang, Z. Analysis of ecological risk temporal-spatial change in Arid Alpine Wetland—A case study of Bayanbulak World Natural Heritage Site. Arid Zone Res. 2015, 32, 614–621. [Google Scholar]
- Liao, S.; Qin, Y. A spatialization method for survey data of theoretical stock-carrying capacity of grassland in China and its application. Geogr. Res. 2014, 33, 179–190. [Google Scholar]
- Xu, M.; He, J. A review of grassland carrying capacity: Definition, theoretical consideration and model. Acta Prataculturae Sin. 2014, 23, 313–324. [Google Scholar]
- Mellino, S.; Buonocore, E.; Ulgiati, S. The worth of land use: A GIS-emergy evaluation of natural and human-made capital. Sci. Total Environ. 2015, 506, 137–148. [Google Scholar] [CrossRef] [PubMed]
- Li, H.; Wang, S.; Wang, W.; Duan, Q.; Li, G. Three parallel rivers world natural heritage hongshan district ecological security assessment. In Progress in Environmental Science and Engineering, Pts 1–4; Xu, Q.J., Ju, Y.H., Ge, H.H., Eds.; Trans Tech Publications: Shanghai, China, 2013; Volume 610–613, p. 673. [Google Scholar]
- Zhou, K.; Fan, J. Regional disparity of environmental pollution source and its socio-economic influencing factors: Based on the cross-section data of 339 cities at prefecture level or above in China. Acta Geogr. Sin. 2016, 71, 1911–1925. [Google Scholar]
- Li, L.G.; Zhang, P.Y.; Liu, W.X.; Li, J.; Wang, L.F. Spatial-temporal evolution characteristics and influencing factors of county-scale environmental pollution in Jilin Province, Northeast China. Ying Yong Sheng Tai Xue Bao J. Appl. Ecol. 2019, 30, 2361–2370. [Google Scholar]
- Anselin, L.; Bongiovanni; Lowenberg, D. A spatial econometric approach to the economics of site-specific nitrogen management in corn production. Am. J. Agric. Econ. 2005, 87, 261. [Google Scholar] [CrossRef]
- Yang, Y.; Jia, L.; Qiao, J.; Li, M.; Zhang, F.; Chen, D.; Zhang, H.; Zhao, M. Effect of mowing patterns on community characteristics and plant diversity in Stipa grandis Steppe. Chin. J. Grassl. 2019, 41, 38–44. [Google Scholar]
- Sun, L.; Shi, C.; Zhao, T.; Li, D.; Lai, W.; Ding, W. Vegetation recovery in the landslide-tackling area of Wenchuan earthquake. Sci. Soil Water Conserv. 2015, 13, 86–92. [Google Scholar]
- Guo, Y.; Yu, H. Application analysis of ecological sensitivity evaluation index system in urban plnning. Environ. Sci. Manag. 2016, 41, 23–27. [Google Scholar]
- Zhang, Z.; He, X.; Liu, L.; Li, Z.; Wang, P. Ecological service functions and value estimation of glaciers in the Tianshan Mountains, China. Acta Geogr. Sin. 2018, 73, 856–867. [Google Scholar]
- Conradin, K.; Hammer, T. Making the most of world natural heritage-linking conservation and sustainable regional development? Sustainability 2016, 8, 323. [Google Scholar] [CrossRef]
- Niu, S.; Liang, Y.; Zhang, S. Countermeasures for prevention and control of forest fires in Xinjiang Tianchi Nature Reserve after ban on grazing. Available online: https://kns.cnki.net/KCMS/detail/detail.aspx?dbcode=CJFQ&dbname=CJFDLAST2015&filename=SLFH201501010&v=MjIyODdTN0RoMVQzcVRyV00xRnJDVVJMT2VaK1JxRnk3Z1U3N01OaUhOWnJHNEg5VE1ybzlFWklSOGVYMUx1eFk= (accessed on 25 October 2019).
- Tang, X. Based on tourist satisfaction research in Xinjiang Tianchi Scenic Spot. Available online: http://www.wanfangdata.com.cn/details/detail.do?_type=perio&id=xjjyxyxb-skb200904028 (accessed on 25 October 2019).
- Cetin, M.; Zeren, I.; Sevik, H.; Cakir, C.; Akpinar, H. A study on the determination of the natural park’s sustainable tourism potential. Environ. Monit. Assess. 2018, 190, 167–190. [Google Scholar] [CrossRef] [PubMed]


| Type of Data | Year | Resolution | Data Source | Purpose | |
|---|---|---|---|---|---|
| Remote sensing data | Landsat TM remote sensing image | 2010–2015 | 15 m | Geospatial Data Cloud | Calculating the landscape type functional dominance, landscape type degradation degree, landscape fragmentation degree, NDVI |
| DEM data | DEM | 2015 | 30 m | Geospatial Data Cloud | Calculating altitude and slope |
| Pictures data | Landscape photos | 2010–2015 | - | Filed Survey and Document of Xinjiang Tianshan Heritage Declaration | Calculating degree of landscape beauty |
| Maps data | Map of vegetation types in China | 2010–2015 | 1:1,000,000 | Peking University Open Research Data | Calculating richness of community structure |
| Map of soil types in China | 2010–2015 | 1:1,000,000 | Peking University Open Research Data | Calculating soil types | |
| Table data | List of endangered, endemic species and scenic properties | 2010–2013 | - | Document of Xinjiang Tianshan Heritage Declaration | Calculating degree of protection of endangered species, degree of diversity of endemic species, degree of beauty |
| Space vector data | Road data | 2010–2015 | - | Filed Survey | Calculating road density |
| Location data of tourist gathering area | 2015 | - | Filed Survey | Calculating tourist recreation space | |
| Location of landslide and debris flow | 2010–2015 | - | Geological Survey Report of Tianchi Scenic Spot | Calculating natural disaster occurrence area | |
| Raster data | Temperature and precipitation data | 2015 | 1 km×1 km | Resource and Environment Data Cloud Platform | Calculating temperature and precipitation |
| Indices | Indicators | Weights | Formulas | Source |
|---|---|---|---|---|
| HI | Landscape Type Function Dominance | 0.0495 | Considering the ecological service value, aesthetic value and ecological value of different landscape types, each landscape type is assigned a functional advantage value, via f (landscape type) = functional advantage, that represents the respective level of a landscape type’s contribution to the OUV of the site. The higher the degree of the functional advantage, the higher its ecological and aesthetic value and the more it should be protected: f (glaciers/permanent snow) = 8, f (evergreen coniferous forest, deciduous broad-leaved forest) = 7, f (warm grassland) = 6, f (warm meadow) = 5, f (alpine meadows) = 4, f (alpine grassland) = 3, f (Sparse grassland) = 2, f (bare land, lake, construction land, transportation land, dry land, mining sites) = 1. | [17,24] |
| Degree of Landscape Beauty | 0.0761 | Tourists, managers, local residents, college teachers and undergraduates were selected to judge pictures of the study area. With these participants’ evaluations, Scenic beauty estimation method (SBE) was then used to evaluate landscape beauty and to quantify the aesthetic value component that contributes to various landscape’s OUV. The evaluation process is as follows: 1) The 10 most representative images of the important landscapes in Bogda were selected to form a PowerPoint. Participants were asked to score each image on a scale of 1 to 10.2) For resource points which received a beauty value greater than 70, spatial location information for landscape was extracted. A buffer zone with a 1 km radius as the spatial distribution of the landscape’s degree of beauty was then analyzed. | [15,59] | |
| Degradation of Landscape Type | 0.0750 | This index is the ratio of the difference between the area of each landscape type and the time after the interpretation of the two remote sensing data in the study area in 1990 and 2015. The formula is Formula (2). | [48,62] | |
| Landscape Fragmentation | 0.0610 | This index considers the complexity of the spatial structure of the landscape and reflects the degree of human disturbance to the landscape. The formula is Formula (3). The higher the degree of landscape fragmentation is, the more the area should be protected. | [17,63] | |
| VI | Normalized Difference Vegetation Index (NDVI) | 0.0456 | NDVI is used to reflect vegetation growth status and vegetation coverage. The formula is Formula (4). The higher the NDVI is, the better the vegetative state is and the more it should be protected. | [25,29] |
| Richness of Community Structure | 0.0483 | This index is a comprehensive assessment of the habitat as a whole community structure. According to the type of vegetation, the richness of the community structure is defined as the proportion of the amount (area or quantity) of the niche vegetation type to the total amount in the vertical space with arbor layers, shrub layers, herb layers and quilt layers (moss lichen). The higher the value is, the more it should be protected. The vegetation types of the study area and their given heritage value scores (8) are: cold temperate zone and temperate mountain coniferous forest(8), subalpine deciduous broad-leaved shrubs (7), temperate grass and weedy meadow steppe (6), temperate cluster grass typical steppe (6), temperate semi-shrub and dwarf semi-shrub desert (6), temperate cluster dwarf grass and dwarf and semi-shrub desert steppe (5), temperate deciduous leafless sparse forest (4), Artemisia scoparia and weedy meadow (3), alpine sparse vegetation (2) and a glacier snow ecosystem (1). | [25,64] | |
| Soil Type | 0.0468 | Soil is an important part of the ecosystem; it reflects the fertility level and utilization value of the soil. Soil fertility directly affects the production status of the vegetation. The higher the soil fertility is, the better the vegetation grows under the same conditions; thus, the higher its ecological value is and the more it should be protected. Therefore, according to the fertility level of the soil in the study area, different types of soil are assigned a value (6) that reflects their relative ecological value: grey cinnamon soil (6), chernozem (6), brown soil (5), light chestnut soil (5), chestnut soil (5), cultivated chestnut soil (5), chestnut alpine meadow soil (4), alpine meadow soil (3), alpine cold desert soil (2) and fluvo-aquic soil (1). | [27,65,66] | |
| SI | Degree of Protection for Endangered Species | 0.0493 | This index refers to the proportion of different conservation grades of endangered animal species in a habitat to the total animal protection species. The greater the proportion is, the more the habitat should be protected. The formula is Formula (5). The ecological weight value is a product of the ratio of j-class protected animal species to the total number of protected animal species in the whole region and the importance value of the j-class protected animal species. The higher the Cs is, the more the habitat type should be protected. In the study area, animal and plant species were selected and defined as endangered species according to the IUCN Species Red List (2010), the CITES Appendix (2010), the Chinese Species Red List (2004), the National Key Protected Wild Animals (1988) and the Xinjiang Uygur Autonomous Region Key Protected Wild Plants List (2007). According to the degree of endangerment of species, the degree of relative protection corresponding to the above listed sources is defined as 9, 7, 5, 3, 1. | [66,67] |
| Endemic Diversity | 0.0505 | This index refers to the proportion of endemic species to total species within a habitat type, which reflects the complex relationship between organisms and environments. The higher the index is, the more the habitat type should be protected. The formula is Formula (6). | [66,67] | |
| Theoretical Carrying Capacity | 0.0588 | This index is chosen as an indicator of grassland protection, to reflect the productivity of grassland and the theoretical grazing level of grasslands. Through calculation of the amount of livestock carried on the grassland in the heritage site, the degree of pasture grazing in the area is obtained and verified and a corresponding protection mode is adopted to facilitate different degrees and types of protection. In calculating this indicator, the research of the carrying capacity of Chinese counties and cities by existing scholars was referenced. According to different vegetation types of grassland, the grassland vegetation types were classified into 6 secondary grassland types (meadow grassland, typical grassland, desert grassland, alpine meadow, alpine grassland and shrub grassland). Mountain meadows, warm grasslands and warm meadows are all classified as meadow grasslands; warm grassland deserts and warm desert grasslands are classified as desert grasslands. According to the livestock carrying amount related research, the carrying amount is calculated. | [68,69] | |
| DI | Tourist Recreation Space | 0.0926 | This index reflects the degree of tourists’ gathering in a certain period time. Considering the distance that visitors can reach, a buffer analysis is conducted with a radius of 1 km as the tourists’ recreation space. The higher the index is, the more it should be protected. | [5,13] |
| Road Density | 0.0763 | This index is the ratio of the total mileage of the road network to the area within a certain scope. Therefore, the road density of the center point of each grid is calculated as the total mileage of the road in grid sections with an area of 1 km × 1 km. The higher the index is, the more serious the impact on the value of the heritage is and the more area of the considered scope should be protected. | [29] | |
| Natural Disaster Occurrence Area | 0.0827 | According to the ‘Specifications for Debris Flow Hazard Prevention and Control Engineering Survey’ (DZ/T0220-2006), the vulnerability of debris flow should be evaluated. As per the situation of natural disasters in ‘Tianshan Tianchi Scenic Area master plan (2004–2020),’ a buffer analysis was conducted on the area in the study area where natural disasters are prone to occur, with a radius of 1 km. | [21,30] | |
| EI | Altitude | 0.0471 | According to Digital Evaluation Model (DEM) data, the data was obtained by GIS10.5. | [37,70] |
| Slope | 0.0469 | According to DEM data, the data was obtained by GIS10.5. | [71] | |
| Temperature | 0.0471 | According to the resource temperature data cloud platform, Xinjiang temperature raster data processing is obtained. | [21] | |
| Precipitation | 0.0463 | According to the resource data cloud platform, Xinjiang precipitation raster data processing is obtained. | [21] |
| Level 1 | Level 2 | Level 3 | Level 4 | Level 5 | |
|---|---|---|---|---|---|
| HVPSI | 69.81 | 88.76 | 166.55 | 235.37 | 182.51 |
| HI | 103.32 | 77.96 | 154.99 | 223.56 | 183.17 |
| VI | 114.68 | 144.55 | 107.93 | 135.88 | 239.96 |
| SI | 374.78 | 137.73 | 149.91 | 46.85 | 33.73 |
| DI | 593.74 | 71.74 | 31.34 | 35.46 | 10.72 |
| HVPSI | HI | VI | SI | DI | |
|---|---|---|---|---|---|
| Moran’s I | 0.8940 | 0.4255 | 0.7967 | 0.6928 | 0.6521 |
| Mean | 0.0006 | −0.0045 | −0.0024 | −0.0005 | 0.0012 |
| sd | 0.0286 | 0.0275 | 0.0217 | 0.0195 | 0.0188 |
| z-value | 31 | 15 | 36 | 35 | 34 |
| p-value | 0.01 | 0.01 | 0.01 | 0.01 | 0.01 |
| Families | Species | Importance Value | ||||
|---|---|---|---|---|---|---|
| Level 1 | Level 2 | Level 3 | Level 4 | Level 5 | ||
| Labiatae | Phlomis pratensis | 0.05 ± 0.01 | 0.19 ± 0.03 | |||
| Leguminosae | Caragana soongorica | 0.49 ± 0.08 | ||||
| Trifolium repens | 0.03 ± 0.01 | |||||
| Astragalus tibetanus | 0.13 ± 0.02 | 0.85 ± 0.63 | ||||
| Oxytropis bogdoschanica | 0.14 ± 0.01 | 0.09 ± 0.01 | ||||
| Medicago lupulina | 0.11 ± 0.01 | |||||
| Gramineae | Festuca pratensis | 0.27 ± 0.04 | 0.12 ± 0.01 | 0.18 ± 0.06 | ||
| Elymus nutans | 0.09 ± 0.03 | 0.24 ± 0.03 | ||||
| Phleum alpinum | 0.12 ± 0.01 | |||||
| Poa annua | 0.18 ± 0.04 | 0.18 ± 0.02 | 0.3 ± 0.11 | 0.3 ± 0.09 | ||
| Alopecurus aequalis | 0.31 ± 0.03 | |||||
| Bromus inermis | 0.41 ± 0.24 | |||||
| Saxifragaceae | Saxifraga montana | 0.09 ± 0.02 | ||||
| Violaceae | Viola tianschanica Maxim. | 0.03 ± 0.01 | ||||
| Crassulaceae | Rhodiola rosea | 0.07 ± 0.01 | ||||
| Compositae | Taraxacum mongolicum | 0.05 ± 0.01 | 0.1 ± 0.04 | |||
| Erigeron auranitiacus | 0.19 ± 0.01 | |||||
| Saussurea involucrata | 0.06 ± 0.01 | |||||
| Aster alpinus | 0.08 ± 0 | |||||
| Seriphidium borotalense | 0.42 ± 0.06 | |||||
| Achillea millefolium | 0.35 ± 0.01 | 0.19 ± 0.04 | ||||
| Chenopodiaceae | Ceratoides latens | 0.45 ± 0.19 | ||||
| Polygonaceae | Polygonum viviparum | 0.46 ± 0.01 | 0.2 ± 0.04 | |||
| Geraniaceae | Geranium rectum | 0.13 ± 0.08 | 0.27 ± 0.05 | |||
| Ranunculaceae | Thalictrum alpinum | 0.13 ± 0.07 | 0.16 ± 0.02 | |||
| Trollius lilacinus | 0.11 ± 0.01 | 0.1 ± 0.02 | ||||
| Delphinium grandiflorum | 0.16 ± 0.09 | |||||
| Rubiaceae | Galium aparine | 0.05 ± 0.01 | 0.25 ± 0.06 | |||
| Galium verum | 0.16 ± 0.01 | |||||
| Spiraea hypericifolia | 0.18 ± 0.03 | 0.06 ± 0.01 | 0.19 ± 0.08 | 0.12 ± 0.06 | ||
| Fragaria vesca | 0.1 ± 0.09 | |||||
| Rosa platyacantha Schrenk | 0.15 ± 0.1 | |||||
| Potentilla chrysantha | 0.13 ± 0.02 | 0.09 ± 0.04 | 0.16 ± 0.03 | 0.17 ± 0.04 | ||
| Alchemilla tianschanica | 0.36 ± 0.04 | 0.28 ± 0.01 | ||||
| Caprifoliaceae | Lonicera hispida | 0.11 ± 0.01 | ||||
| Umbelliferae | Aegopodium alpestre | 0.37 ± 0.19 | 0.23 ± 0.04 | |||
| Aegopodium podagraria | 0.14 ± 0.01 | |||||
| Cyperaceae | Carex caespitosa | 0.41 ± 0.04 | 0.33 ± 0.06 | 0.34 ± 0.01 | 0.28 ± 0.05 | |
| Caryophyllaceae | Arenaria serpyllifolia | 0.08 ± 0.01 | 0.16 ± 0.01 | |||
| Stellaria media | 0.2 ± 0.1 | |||||
| Iridaceae | Iris scariosa | 0.11 ± 0.01 | ||||
| Boraginaceae | Myosotis alpestris | 0.17 ± 0.01 | ||||
| Species Diversity | Level 1 | Level 2 | Level 3 | Level 4 | Level 5 |
|---|---|---|---|---|---|
| Simpon index | 0.31 ± 0.02 | 0.39 ± 0.12 | 0.68 ± 0.09 | 0.63 ± 0.15 | 0.58 ± 0.29 |
| Shannon-Wiener index | 0.2 ± 0.01 | 0.28 ± 0.07 | 0.54 ± 0.09 | 0.5 ± 0.12 | 0.5 ± 0.26 |
| Pielou index | 0.32 ± 0.07 | 0.48 ± 0.06 | 0.41 ± 0.09 | 0.34 ± 0.05 | 0.53 ± 0.26 |
| Margalef index | 0.48 ± 0.08 | 0.51 ± 0.2 | 0.75 ± 0.07 | 0.68 ± 0.11 | 0.56 ± 0.25 |
| NDS | 0.07 ± 0.05 | 0.27 ± 0.15 | 0.24 ± 0.06 | 0.24 ± 0.04 | 0.23 ± 0.15 |
| NPDS | 0.06 ± 0.05 | 0.08 ± 0.04 | 0.09 ± 0.03 | 0.25 ± 0.1 | 0.06 ± 0.01 |
| AHDS | 0.62 ± 0.19 | 0.27 ± 0.08 | 0.26 ± 0.04 | 0.05 ± 0.01 | 0.01 ± 0.01 |
| TCDS | 0.65 ± 0.02 | 0.75 ± 0.11 | 0.96 ± 0.02 | 0.65 ± 0.06 | 0.41 ± 0.3 |
| HVPSI | HI | VI | SI | DI | |||||||||||
|---|---|---|---|---|---|---|---|---|---|---|---|---|---|---|---|
| CLM | SLM | SEM | CLM | SLM | SEM | CLM | SLM | SEM | CLM | SLM | SEM | CLM | SLM | SEM | |
| Constant | 0.495 *** | 0.137 ** | 0.548 *** | 0.993 *** | 0.778 *** | 0.929 *** | 0.304 | −0.032 | 0.566 | 0.140 | 0.067 | 0.255 * | 0.138 | -0.118 | −0.098 |
| Simpon index | −1.584 | −1.428 *** | −1.276 *** | −6.635 ** | −6.697 *** | −5.813 *** | 3.652 | 1.534 | 0.502 | 0.178 | −0.080 | −0.786 | 0.979 | 0.500 | −0.273 |
| Shannon-Wiener index | 1.773 | 1.499 *** | −5.102 *** | 6.186 ** | 6.353 *** | 5.505 *** | −2.927 | −0.974 | −0.120 | −0.686 | −0.458 | 0.185 | −1.549 | −1.346 | −0.772 |
| Pielou index | 0.513 | 0.346 ** | 0.317 ** | 1.526 | 1.473 ** | 1.164 ** | −1.597 | −0.769 * | −0.336 | 0.036 | 0.173 | 0.372 | −0.063 | 0.519 | 1.150 ** |
| Margalef index | −0.347 | −0.027 | 0.039 | −0.075 | −0.080 | 0.124 | 0.569 | 0.248 | 0.036 | 0.704 ** | 0.636 *** | 0.609 *** | 0.986 | 0.627 * | 0.249 |
| NDS | 0.345 | −0.173 | −0.216 * | −0.731 | −0.779 | −0.893 * | −0.345 | −0.384 | −0.144 | −0.288 | −0.249 | −0.333 | −0.925 | −0.259 | 0.298 |
| NPDS | −0.020 | 0.007 | 0.022 | −0.470 | −0.471 * | −0.422 * | −0.073 | −0.181 | −0.159 | 0.063 | 0.063 | 0.026 | 0.185 | 0.239 | 0.366 * |
| AHDS | −0.146 | −0.095* | −0.076 | −0.394 | −0.445 ** | −0.498 *** | −0.294 | −0.116 | −0.040 | −0.254 | −0.230 * | −0.196 * | −0.299 | −0.236 | −0.061 |
| TCDS | −0.118 | −0.035 | −0.024 | −0.167 | −0.087 | −0.019 | 0.689 | 0.310 *** | 0.127 | 0.109 | 0.024 | −0.059 | 0.153 | −0.022 | −0.161 |
| ρ/λ | - | 0.804 | 0.892 | - | 0.444 | 0.518 | - | 0.838 | 0.865 | - | 0.492 | 0.612 | - | 0.651 | 0.769 |
| LogL | 20.423 | 37.78 | 34.930 | 6.776 | 9.107 | 9.214 | −1.831 | 15.6459 | 13.402 | 17.130 | 20.071 | 20.803 | 1.437 | 6.459 | 8.908 |
| R² | 0.626 | 0.939 | 0.934 | 0.464 | 0.589 | 0.603 | 0.267 | 0.888 | 0.870 | 0.363 | 0.544 | 0.595 | 0.222 | 0.572 | 0.688 |
| LMLAG | 17.899 *** | - | - | 5.071 *** | - | - | 24.8916 *** | - | - | 6.275 ** | - | - | 8.994 *** | - | - |
| R-LMLAG | 18.772 *** | - | - | 1.295 | - | - | 18.4914 *** | - | - | 2.561 | - | - | 3.749 * | - | - |
| LMERR | 2.983 ** | - | - | 3.810 * | - | - | 12.1336 *** | - | - | 4.095 ** | - | - | 6.452 | - | - |
| R-LMERR | 3.855 ** | - | - | 0.033 | - | - | 5.7334 ** | - | - | 0.381 | - | - | 1.207 | - | - |
© 2019 by the authors. Licensee MDPI, Basel, Switzerland. This article is an open access article distributed under the terms and conditions of the Creative Commons Attribution (CC BY) license (http://creativecommons.org/licenses/by/4.0/).
Share and Cite
Shi, H.; Shi, T.; Han, F.; Liu, Q.; Wang, Z.; Zhao, H. Conservation Value of World Natural Heritage Sites’ Outstanding Universal Value via Multiple Techniques—Bogda, Xinjiang Tianshan. Sustainability 2019, 11, 5953. https://doi.org/10.3390/su11215953
Shi H, Shi T, Han F, Liu Q, Wang Z, Zhao H. Conservation Value of World Natural Heritage Sites’ Outstanding Universal Value via Multiple Techniques—Bogda, Xinjiang Tianshan. Sustainability. 2019; 11(21):5953. https://doi.org/10.3390/su11215953
Chicago/Turabian StyleShi, Hui, Tiange Shi, Fang Han, Qin Liu, Zhi Wang, and Hulan Zhao. 2019. "Conservation Value of World Natural Heritage Sites’ Outstanding Universal Value via Multiple Techniques—Bogda, Xinjiang Tianshan" Sustainability 11, no. 21: 5953. https://doi.org/10.3390/su11215953