A Simulation Study on the Potential of Moving Urban Freight by a Cross-City Railway Line


Engineering and Applied Sciences Department, Aston University, Birmingham B4 7ET, UK
*
Author to whom correspondence should be addressed.
Sustainability 2019, 11(21), 6088; https://doi.org/10.3390/su11216088
Submission received: 9 August 2019
/
Revised: 11 October 2019
/
Accepted: 21 October 2019
/
Published: 1 November 2019
(This article belongs to the Special Issue Sustainable Urban Logistics)
Abstract
:This paper analyses the scope for moving urban freight through rail by evaluating the utilisation levels of the Cross-City railway line in The United Kingdom (UK), running between Lichfield Trent Valley and Birmingham New Street. A simulation model of the railway system was built and implemented using SIMUL8 computer software. The results from the simulation model suggest that the railway line is being under-utilised. These low utilisation levels of the line presented a case to propose three scenarios that has the potential to carry urban freight by rail through Lichfield Trent Valley to Birmingham New Street Station. The total number of services operated on the line is varied between different scenarios. The proposed three scenarios could not only exploit the existing railway infrastructure by improving the utilisation levels of the currently operating railway line, but also proved to reduce an amount of green-house gases (GHGs) emissions that are caused by heavy goods vehicles (HGVs) moving on the road. After simulating all the proposed scenarios in the SIMUL8 simulation software and analysing the results, scenario number 3 seemed to be the best replacement to the actual system as it presents a case to increase the number of train services running per day by in the line by 108 and causing a drastic improvement in the utilisation levels by an increase of 341.71% to that of the actual system. This proposed system has the potential to eliminate 5400 HGVs moving on the road per day that causes a reduction of CO2 gas by approximately 5.4%. All the scenarios presented in the study assures a sustainable method to move the urban freight by rail that has the potential to reduce congestion and emissions in the West Midlands region of the United Kingdom (UK).
Keywords:
urban freight; rail; simulation; SIMUL8; utilisation levels; HGVs; congestion; emission; sustainable1. Introduction
The freight movement through heavy good vehicles (HGVs) is expected to grow by 22% each year until 2050 in the United Kingdom [1]. The increase in HGVs number causes more congestion on the roads and also increases the emission of green-house gases into the atmosphere. However, on the other side, the UK has legally committed to reduce the carbon emissions by 80% by the year 2050 to that of the current number in 2016 [1]. The forecasts that are showing an increase in the usage of motor vehicles for freight transport does not seem promising as the transport sector is already being accounted for 17% of the UK’s total domestic GHG emissions [2]. Adapting to movement of urban freight by rail seems to present a greater opportunity to overcome the emission issues as well as the road congestion problem as the region under study possesses a high value and demand for freight movement. Apart from this, providing a greener option to move goods, this method actually has the capacity to match up the trade-off between the utilisation levels and capital costs, as the organisations running the rail services largely invest in spending on the infrastructure. This situation was the motivation to evaluate the utilisation levels of the Cross-City railway line in the West Midlands County in England and come up with cases to accommodate to move urban freight by rail in one of the busiest industrial hubs of the country.
There are three main objectives for this paper: Firstly, to analyse the current Cross-City railway line and evaluate the utilisation levels of the line using the timetable as a reference. This is achieved by replicating the system in the simulation model using SIMUL8 software; secondly, to propose suitable scenarios by identifying gaps in the evaluated system so that it presents with a case to improve the current utilisation levels of the system; finally, to evaluate the proposed scenarios if they are feasible to operate and generate the expected utilisation levels. This also includes studying and analysing the performance of those proposed systems and concluding by suggesting the best fit system among them to replace the currently operating system.
This paper employs a systems approach: Firstly, problem formulation that is achieved by understanding the freight transport scenario in the UK and identifying the need for Urban freight movement by rail in a robust manner; secondly, evaluating the Cross-City railway line to study the utilisation levels by developing a model that replicates the existing railway line accurately using SIMUL8 software; thirdly, devising solutions to propose a replacement to the current system that has the ability to move freight between Lichfield Trent Valley and Birmingham New Street station by rail; finally, evaluating and comparing the proposed models and obtained results and suggest the best suitable scenario.
This paper is organised as follows. Section 2 illustrates the literature review regarding urban logistics freight movement and the trend followed by several countries in the world in using rail to move urban freight. Section 3 holds the discussion for the state of practice of the region under the study and provides an overview of the Cross-City railway line. Section 4 provides description of the proposed system. A brief introduction to the fundamentals and characteristics of SIMUL8 are addressed in Section 5. In Section 6, the simulation layout of the railway line and the computed utilisation levels for different scenarios have been illustrated and the results obtained from the simulation model were analysed and the best suitable scenario was presented. Section 7 concludes and addresses the future scope of research work, followed by references in Section 8.
2. Literature Review
Ref. [3] has classified urban logistics as an organic system that comprises of logistics enterprises, logistics nodes and logistics infrastructure. The key set of activities such as transportation, storage, loading and unloading, distribution processing and packaging sum up to form the logistics enterprise. The logistics node can be understood as the structural main body that undertakes the city logistics function, including the logistics park, the logistics centre and the distribution centre. The basis for the functioning of the whole logistics system is the integrated transport system. This might include airports, railways, highways and ports. The utilisation of existing rail networks and metro systems for urban freight movement pose a sound opportunity to achieve green and sustainable logistics, while roadways continue to be the dominant method of transporting freight within the UK. In 2015, 76% of all the goods moved were by road, whereas 15% and 9% of the goods were moved by waterways and railways, respectively [4].
Green-house gas (GHG) emissions caused by the transport sector accounted for 17% of the total GHG emissions in the United Kingdom [2]. The heavy good vehicles (HGVs) and light good vehicles (LGVs) account for 31% of the total GHG emissions that are caused from the transport sector [2]. It is evident from the facts presented that there is a need to reduce the magnitude of emissions and other GHGs from the transport sector by minimising the use of HGVs and LGVs for urban freight movement. Furthermore, these trucks cause a high-level of nuisance on the roads such as noise, emissions, traffic, etc.
In 2003, Entsorgung Recycling Zurich (ERZ) implemented the use of trams for collecting and disposing of the waste in Zurich City. The cargo trams operated in eight stations across Zurich and collected the waste from households along with industrial waste and disposed of in the dumping region. Through this project, ERZ achieved a reduction of 37,500 L of diesel annually [5]. Ref. [6] analysed freight transport through rail and proposed several systems to transport freight using rail. This paper evaluated the feasibility of novel systems such as using high speed rail to move freight, trucks on rails, double stack freight cars. They studied the capability of rail to service flows of freight traffic into and between urban areas using underground metro services. Through the prognoses presented, a formula has been provided for the rail freight system of the future. Ref. [7] studied the use of small sized electric vehicles for urban logistics and compared them with the use of diesel vans for city logistics. They proposed that these electric vehicles are feasible and have the potential to satisfy the needs of all the stakeholders. Ref. [8] studied the potential for electric cargo bikes as a substitute for cars for inner-city courier services. They concluded that 20–50% of logistics carried out by vehicles with combustion engines could be replaced by electric cargo bikes. Ref. [9] investigated the viability of cargo cycles for urban freight transport and identified and discussed several perception and awareness issues. They proposed a framework to achieve sustainable city logistics using the cargo cycles for urban freight transport. That work also argued that the local authorities need to take steps and create incentives such that large Multi-National Corporations (MNC’s) integrate the cargo cycles into their supply chain that further paves the way for a long-term modal shift.
Use of Urban Rail for Freight Movement
As road transport has a limited capacity and considering the impact caused by the HGVs or other motor vehicles, railways offer a cleaner alternative to move the freight. It dates back to Ref. [10] who studied the possibility of sharing a passenger bus for urban freight movement. In that study, they analysed the urban passenger and freight flows and proposed to use the leftover/spare capacity of a passenger bus to transport goods from the bus depots to various bus stops inside the city. However, in the new age of rising Metro services all over the world, there is better connectivity to various parts of the city and improved frequency to move the urban freight within. Several investigations have been carried out focusing on urban freight transportation using the passenger rail network. In 2013, Ref. [11] tested whether the concept of urban freight by rail was viable. They evaluated the idea of using existing urban and sub-urban railway networks or distributing and delivering goods in cities. For the purpose of their study, they discussed six possible cases which were the best viable options. Out of the six cities under study, this concept has already been implemented in four cities that are Amsterdam, Dresden, Paris and Zurich. They proposed and analysed several solutions to achieve the aim such as the truck-train. They concluded that it is feasible to implement in the other cities as well, because it brings several advantages such as reducing congestion, emission and traffic in cities. Ref. [12] proposed an optimisation model for freight transport using the urban rail transit system. They worked to develop a decision supported framework that has the potential to solve the problem of urban freight transportation through rail by presenting the mathematical methods for the optimal distribution of the goods. Ref. [13] developed a metro based underground logistics system (M-ULS) for Beijing and simulated the system for 28 years. Their study assessed the environmental and social benefits of the proposed underground system for different scenarios. Their results suggest that, if the proposed hypothetical M-ULS project manages to receive higher funding and capacity, it would result in a drastic reduction of traffic congestion, air pollution and accidents. Ref. [14] developed a system for the urban freight movement using the Tyne and Wear Metro in Newcastle upon Tyne. In that work, they analysed the feasibility and potential for implementation of the proposed metro-based freight transport system. Through that work, they concluded that a modal shift would be necessary and a system with such high potential to reduce emissions should be seriously considered. Ref. [15] developed several innovative interior designs for urban freight distribution using light rail systems. After a thorough evaluation of all the designs with respect to the Tyne and Wear Metro scenario, they concluded that the design with a configurable carriage concept that allows the internal design to be used for freight and passenger services with quick changes as the best suitable design without the need for large changes to existing infrastructure of the Tyne and Wear Metro system.
Analytical modelling and simulation modelling are widely used techniques to analyse and evaluate a system’s performance. Analytical models have proved to provide a brisk insight into the performance of a system under the study and this does not demand any specific amount of data to be collected and processed [16]. Ref. [17] presented analytical and simulation methods to assess the robustness of a single railway line. Their analytical method estimated the robustness of a timetable by means of the primary and secondary delay that a disruption causes. They developed a disruption simulator tool that assesses the robustness of a timetable by introducing random incidents into it and performing a re-scheduling process that evaluates the cause of primary and secondary delays. They concluded that the analytical model of evaluation is suitable and efficient for assessing light robustness in single line railway tables.
Ref. [18] made an attempt to evaluate the train time table and a Data Envelopment Analysis (DEA) was proposed. They developed a relative train path efficiency index by considering the path of the train as a production unit and each unit consumes transport resources and produces some feedback output. They justified their analysis by verifying it with the actual timetables and checked if it reflects the even distribution of stops. This demonstrates that the analytical method is the best fit for analysing the quality, and can check if it corroborates with the actual system, but it does not help in identifying the gaps in the system and potential alternatives are recommended.
However, instances of adapting to analytical modelling in order to evaluate the performance of a system suggest that it does not provide the flexibility, and they represent disorderliness existing in an actual system as they are more restrictive than simulation techniques. Ref. [19] used the Discrete Time Simulation (DTS) to study the rail system performance based on the speed profile and stated that the timetable of Beijing Yizhuang Metro Line is not sufficiently robust. By using a simulation, they were able to identify that large dwell times in peak hours significantly increase system delay and energy consumption. Ref. [20] created an event-driven dynamic simulator to be implemented to study the multi-line metro systems in the Chile metro rail network. They further discussed its practical application for studying different operating strategies within the actual railway network. Simulations have frequently been employed in the study of railway systems as they allow a more detailed analysis and precise evaluation to be obtained. They also provide flexibility to run through different scenarios and gain an insight into various aspects [21].
Some simulation software, in practice, to evaluate the performance of a flow system are SIMUL8 and ARENA. Ref. [22] used ARENA to develop an event-based simulation method to understand and explore the merits achieved by moving urban freight by rail. They demonstrated through the paper that rail is a viable option and can be efficient to move urban freight. Ref. [23] conducted simulation modelling using ARENA to evaluate the utilisation levels of different sections along a train route that operated in Eastern Spain. They developed a discrete event-based simulation model to study the sections of the route and reported that the level of utilisation was insignificant. They proposed scenarios where the number of train services running were varied and concluded that it was a viable alternative option to improve the utilisation levels.
SIMUL8 is widely popular to conduct such research and has been used previously to evaluate the rail system design and analyse the delays and propose mitigation tactics in the case of Tyne and Wear Metro [24]. By using SIMUL8, they created a replica of Tyne and Wear Metro system in the computer and several sets of simulations were run using the data collected with respect to the delays and arrivals of the trains. They concluded by recommending a set of mitigation strategies to avoid further delays and early arrivals in the system. Ref. [25] evaluated and studied the utilisation levels of a railway line in the Glasgow Metro using the SIMUL8 simulation modelling package. They generated the utilisation levels and after analysing the system, they concluded that additional train services to move freight can be introduced into the system without disturbing the existing time tables such that it could enhance the utilisation levels. Ref. [26] using SIMUL8 developed a decomposition approach to carry out a mesoscopic simulation of a railway network. The decomposition approach segregates a rail network into several components such as rail lines, rail yards, rail stations, rai terminals and junctions. This approach helps to evaluate the entire system into individual segment that provides a robust analysis of the whole system.
According to Office of Rail and Road, the total freight moved in 2018–2019 increased by just 2% i.e., from 4.30 billion tonne kilo metres to 4.33 billion tonne kilo metres. As noted earlier, it constitutes only 9–14% of the total freight moved by various means. This clearly indicates an opportunity to increase the freight movement through railways that has the potential to provide a green and sustainable method to transport the freight via improving the utilisation levels of the existing system. This paper proposes a method to transport urban freight using heavy rail. SIMUL8 was chosen to replicate and simulate the actual system in the computer to analyse and evaluate the utilisation levels and performance of the system. The literature review shows the evidence that SIMUL8 provides more robustness to study and evaluate the rail networks.
3. Description of the City and Train System in the Research
West Midlands Metropolitan region has a population of 2.8 million and has 66,000 individual businesses of varying sizes. This region is served by a complex network of freight and logistics movements. West Midlands being at the heart of the UK, is the centre for motorway and railway networks. Transport for West Midlands in 2016 reported that 90% of UK’s business population is located within a four-hour road travel time from West Midlands. This comes with a cost that the transport networks must carry large volumes of traffic to the other regions of the country. According to report published by Transport for West Midlands in 2016, the transport networks in the West Midlands region creates road congestion, that costs the region an economy of £2.3bn per year. The road freight movements in total represent just 6% of all the trips in the region, that accounts for £600 million per year. The freight movement through HGVs is forecast to grow by 22% each year until 2050.Freight transport through LGVs has seen growth of over 20% in the last 10 years and is expected to grow by 50% over the next 20 years. This massive growth in the use of HGVs or LGVs for freight movement results in higher levels of emission of green-house gases that has the potential to pollute the atmosphere and present thriving conditions for the future generations. In order to avoid this situation from arising, the UK has legally committed to reduce carbon emissions by 34% by 2020 and 80% by 2050 under the Climate Change Act of 2009. However, the observed rate of growth of vehicles being used for freight movement does not seem to be promising as the transport sector in 2013 accounted for 23% of all the UK’s domestic GHG emissions. This is the third largest sector for the source of UK GHG emissions. After an in-depth investigation, the road freight sector contributes 34% to the total emissions [1].
These facts suggest that efficient, economic, safe, sustainable freight movement is absolutely essential in order to reach the target of the UK government’s 80% reduction in GHG emissions by 2050. This paper attempts to present a sustainable system to transport urban freight using heavy rail in the heart of the West Midlands region. This new approach to manage and move urban freight offers huge benefits to the local communities and businesses.
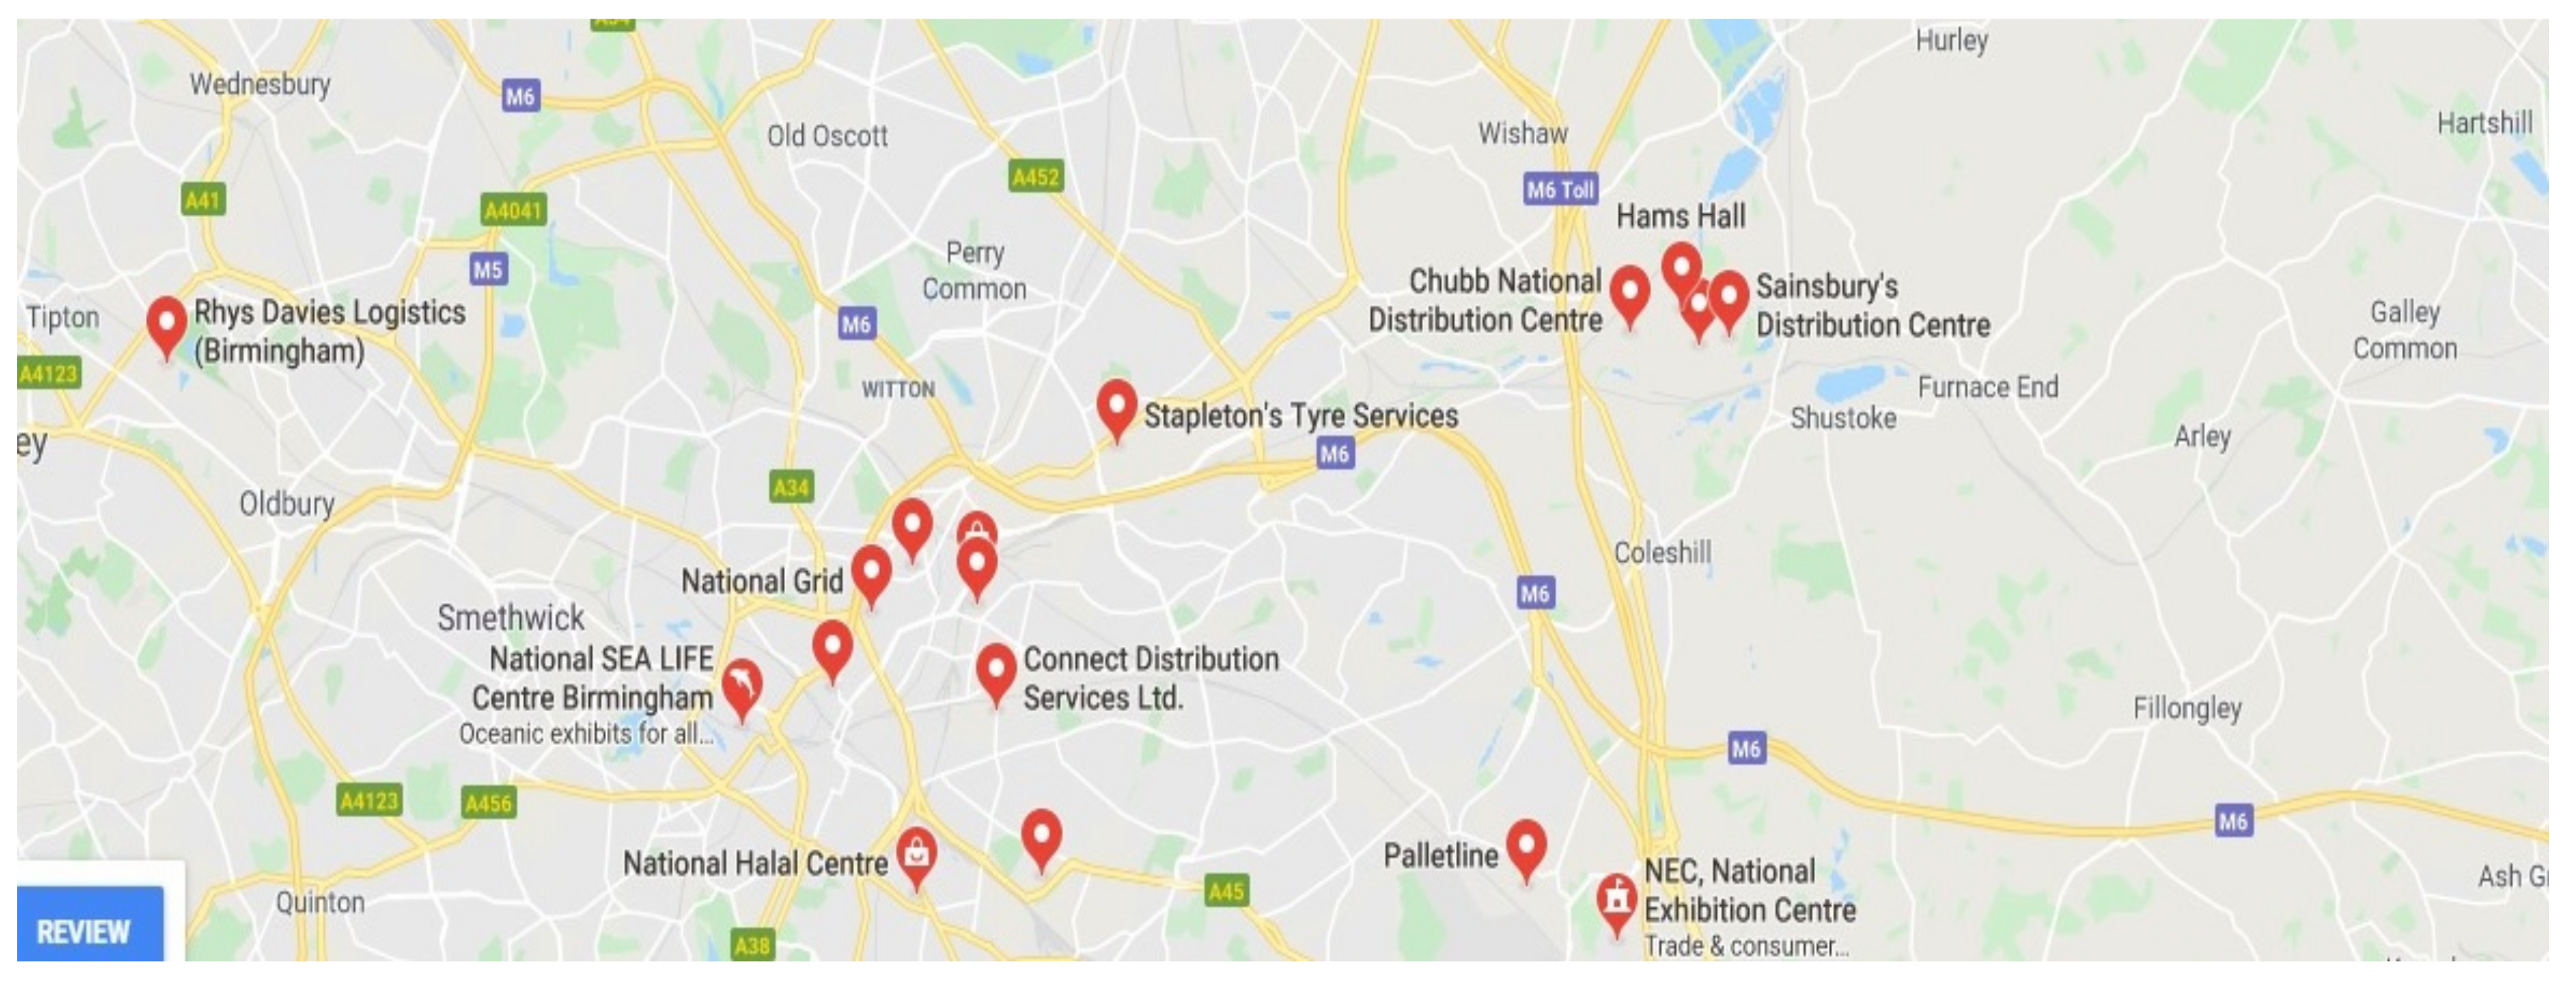
Due to the significance of its location, West Midlands is considered as the first choice for large retailers and other companies to establish their national distribution centres (NDCs) in this region. The NDCs are the hubs from where all the finished goods move to different parts of the country that needs to go into their retail outlets. Several big players in retail businesses such as Asda, Tesco, Sainsbury’s, Argos have their NDCs located in the Midlands region. Figure 1 shows the concentration of NDCs of various companies in and around the West Midlands Metropolitan area.
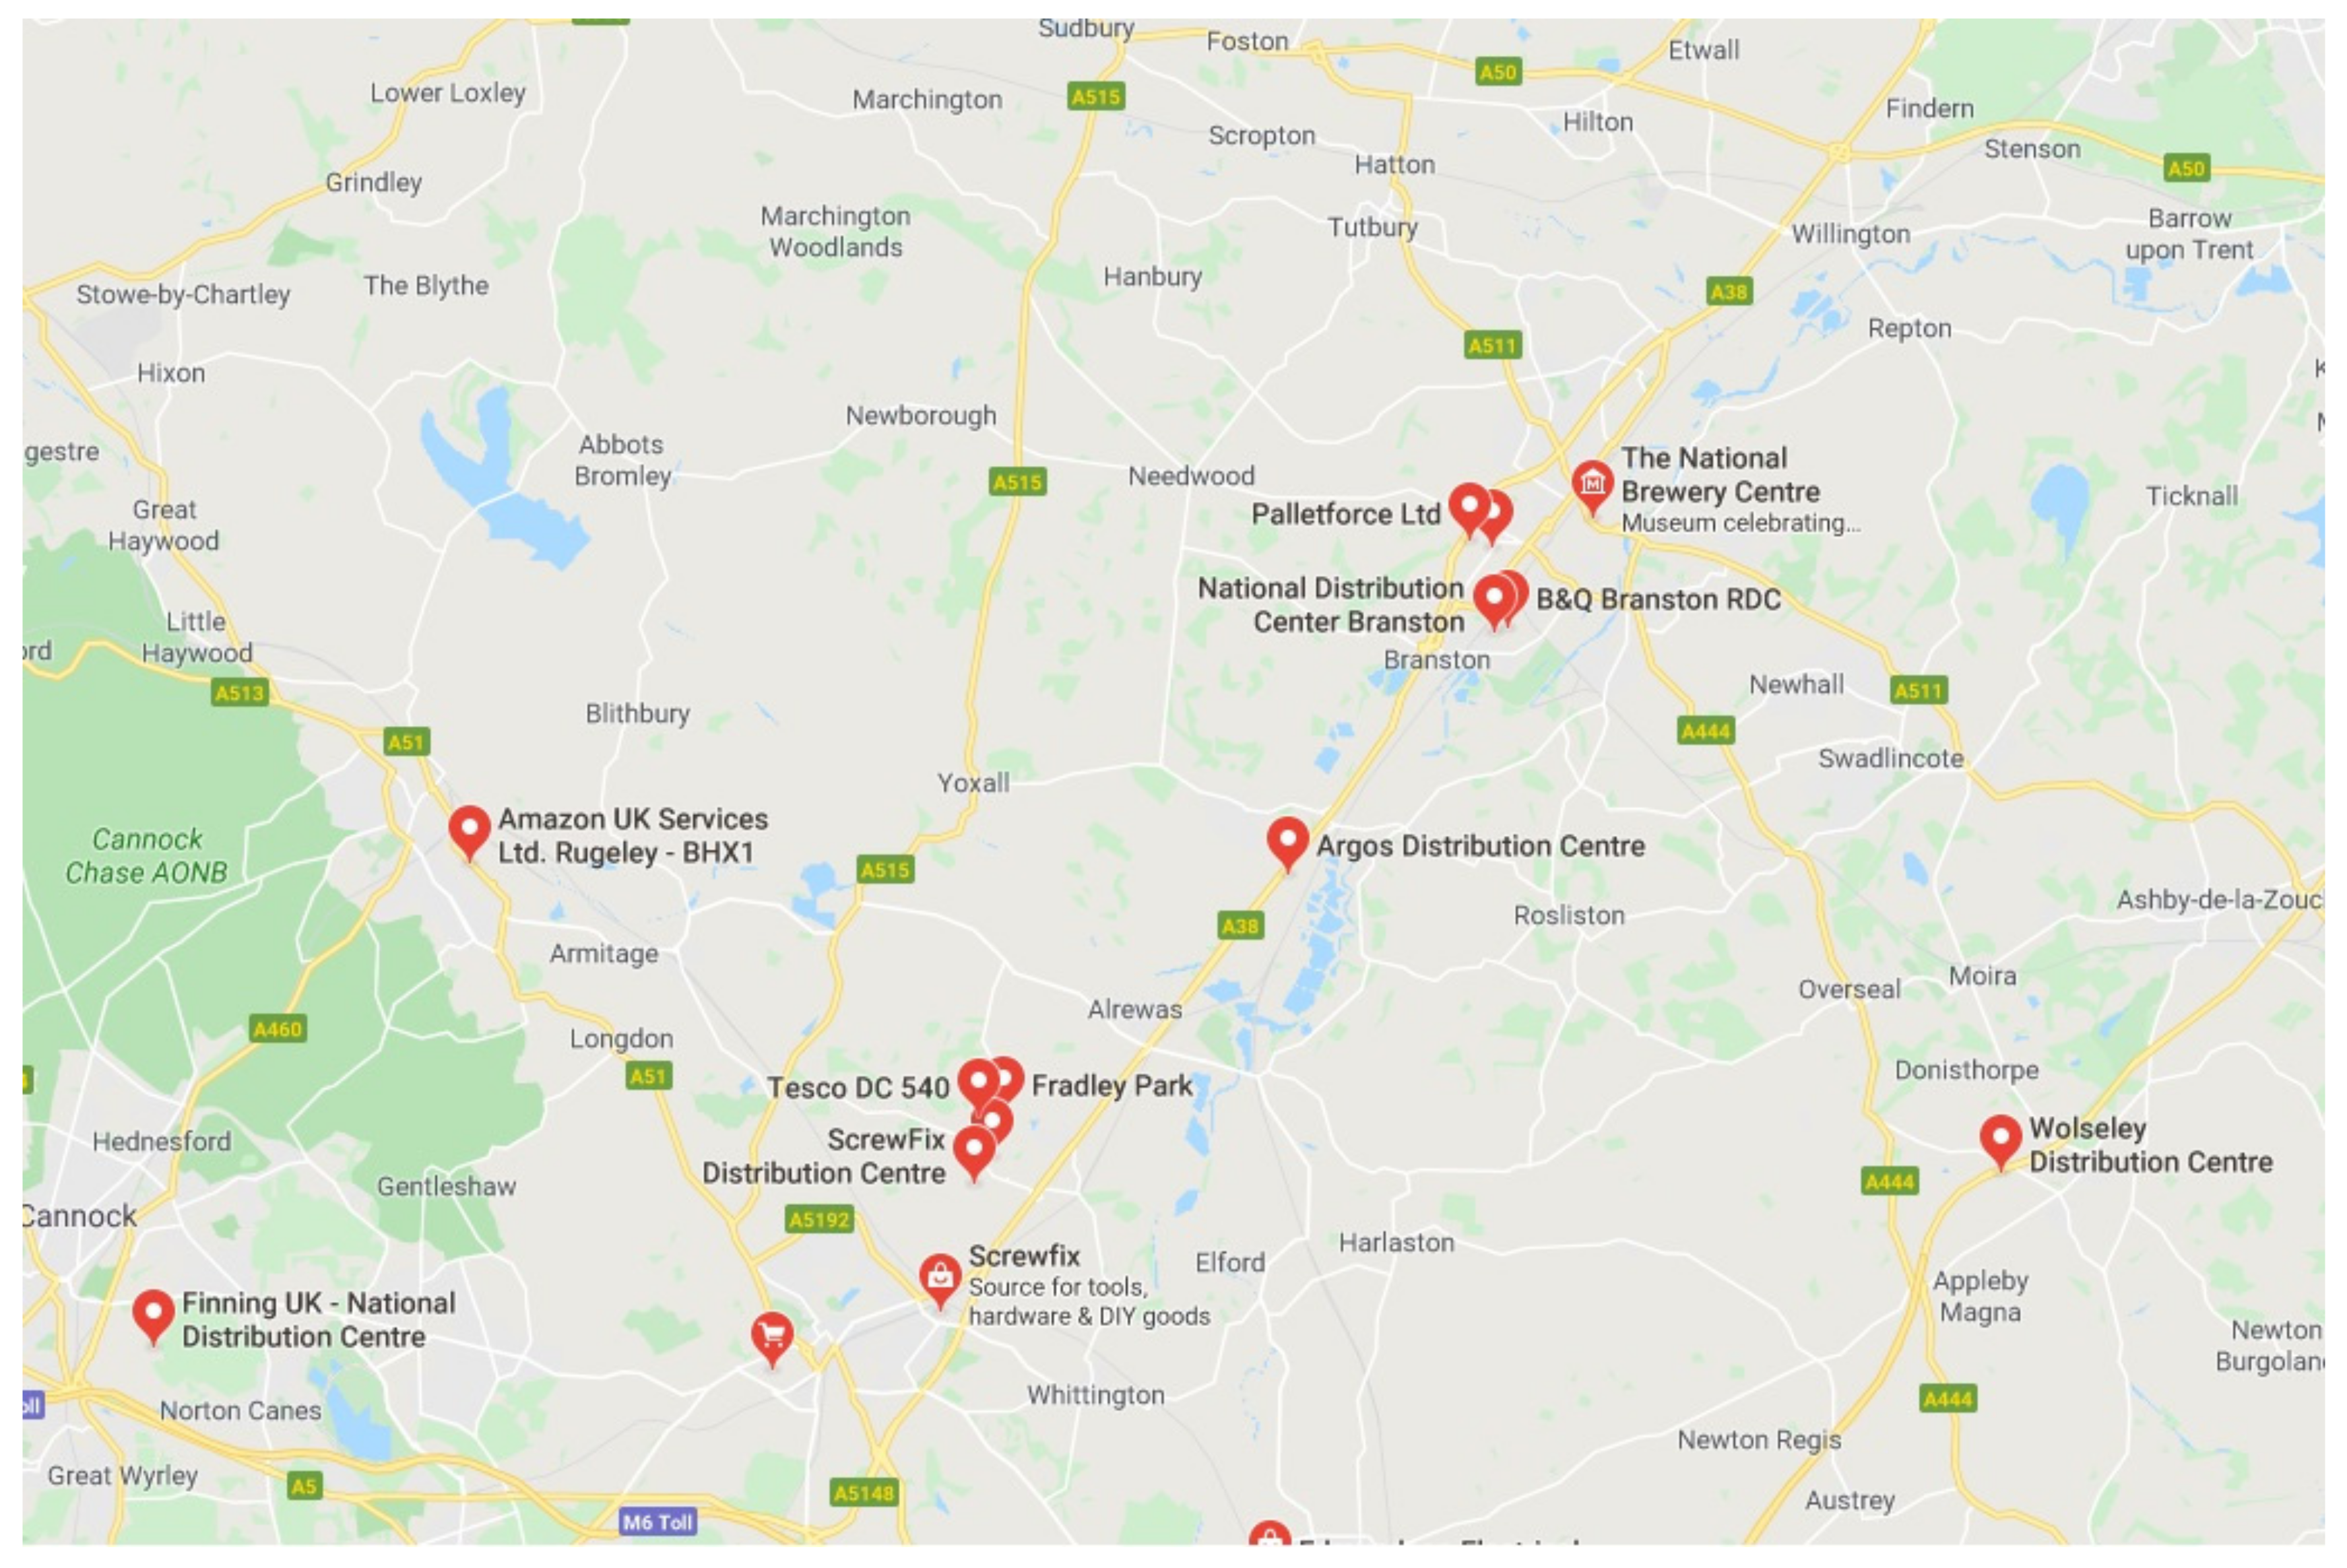
In this paper, a new system is proposed that involves freight movement through rail, in order to reduce the GHG emission into the atmosphere. For the purpose of our study, one such area in the West Midlands region that has significant freight traffic has been identified. Lichfield is identified to be the region that has a decent number of such distribution centres. Lichfield is located 18.2 miles from Birmingham. Figure 2 represents the major NDCs present in Lichfield area. For the businesses to transport their goods from their distribution centres to their outlets either in Birmingham City or various other parts of the country, this National Rail line between Lichfield to Birmingham is of key importance. National Rail runs the cross-city line services daily from Lichfield to Birmingham New Street as a part of the Lichfield-Birmingham-Longbridge-Redditch line.
In the current scenario, businesses transport their goods using roads on their own or via the third-party logistics services. Therefore, the utilisation of the existing train line from Lichfield to Birmingham would be a sustainable way to move the freight. This results in a drastic reduction of usage in HGVs or LGVs for freight movement that eventually reduces the GHG emissions.
This work proposes to introduce new and dedicated train services to carry freight along the Lichfield-Birmingham line. This is achieved by thoroughly studying the existing line, observing the timetable and creating an entire new system that is suitable for freight movement. This decision to bring in freight into Birmingham New Street station could be justified as the freight brought into Birmingham can be easily transported to various retail outlets/hubs present in Birmingham or in any other part of the UK as Birmingham is well connected with the country through the National Rail line and Chiltern Rail line whose services operate from Birmingham New street and Birmingham Moor Street stations respectively.
Due to the business density and significance of the region, Birmingham and Lichfield are chosen as the representative case for this study. The facts mentioned above justify the choice as this corridor records a major share of freight movement in the entire country and is well connected with the rail network and pledges to bridge the gap to adapt to sustainable modes of freight movement [1]. Hence, through this paper, Birmingham New Street is further made the intermediate hub to transport the freight either to the retail outlets present in the Birmingham city or smaller hubs present in any other part of the UK.
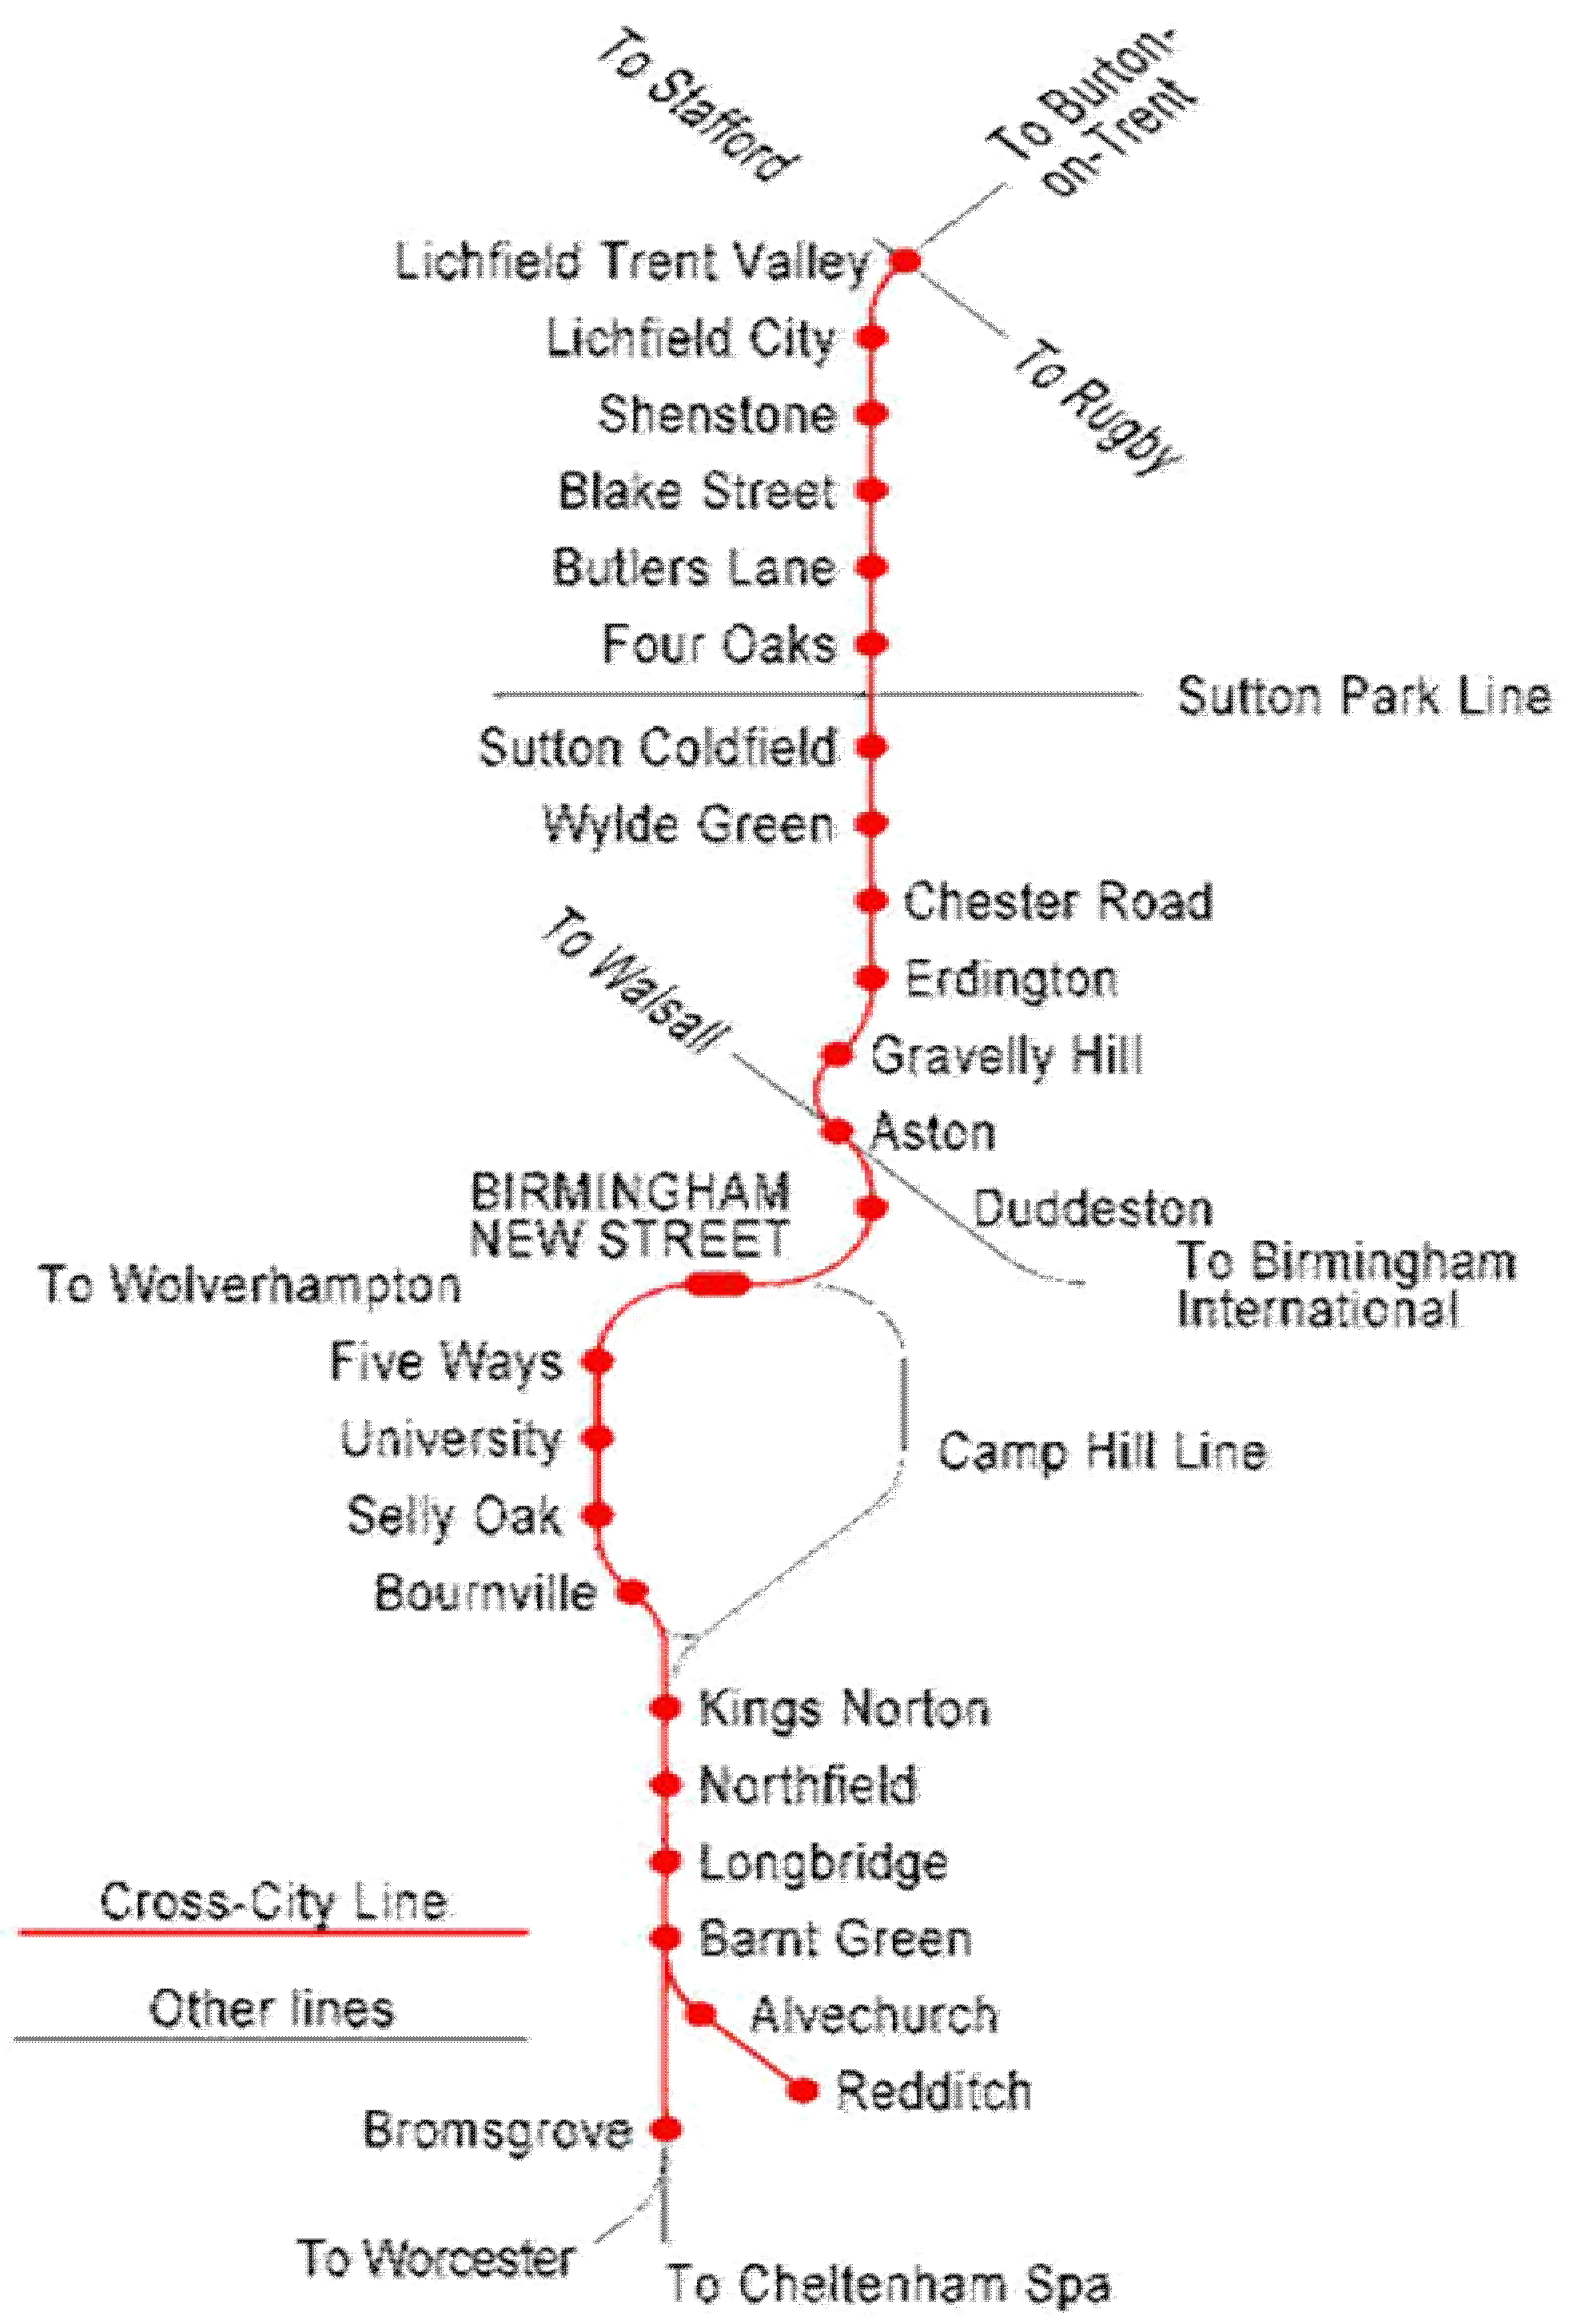
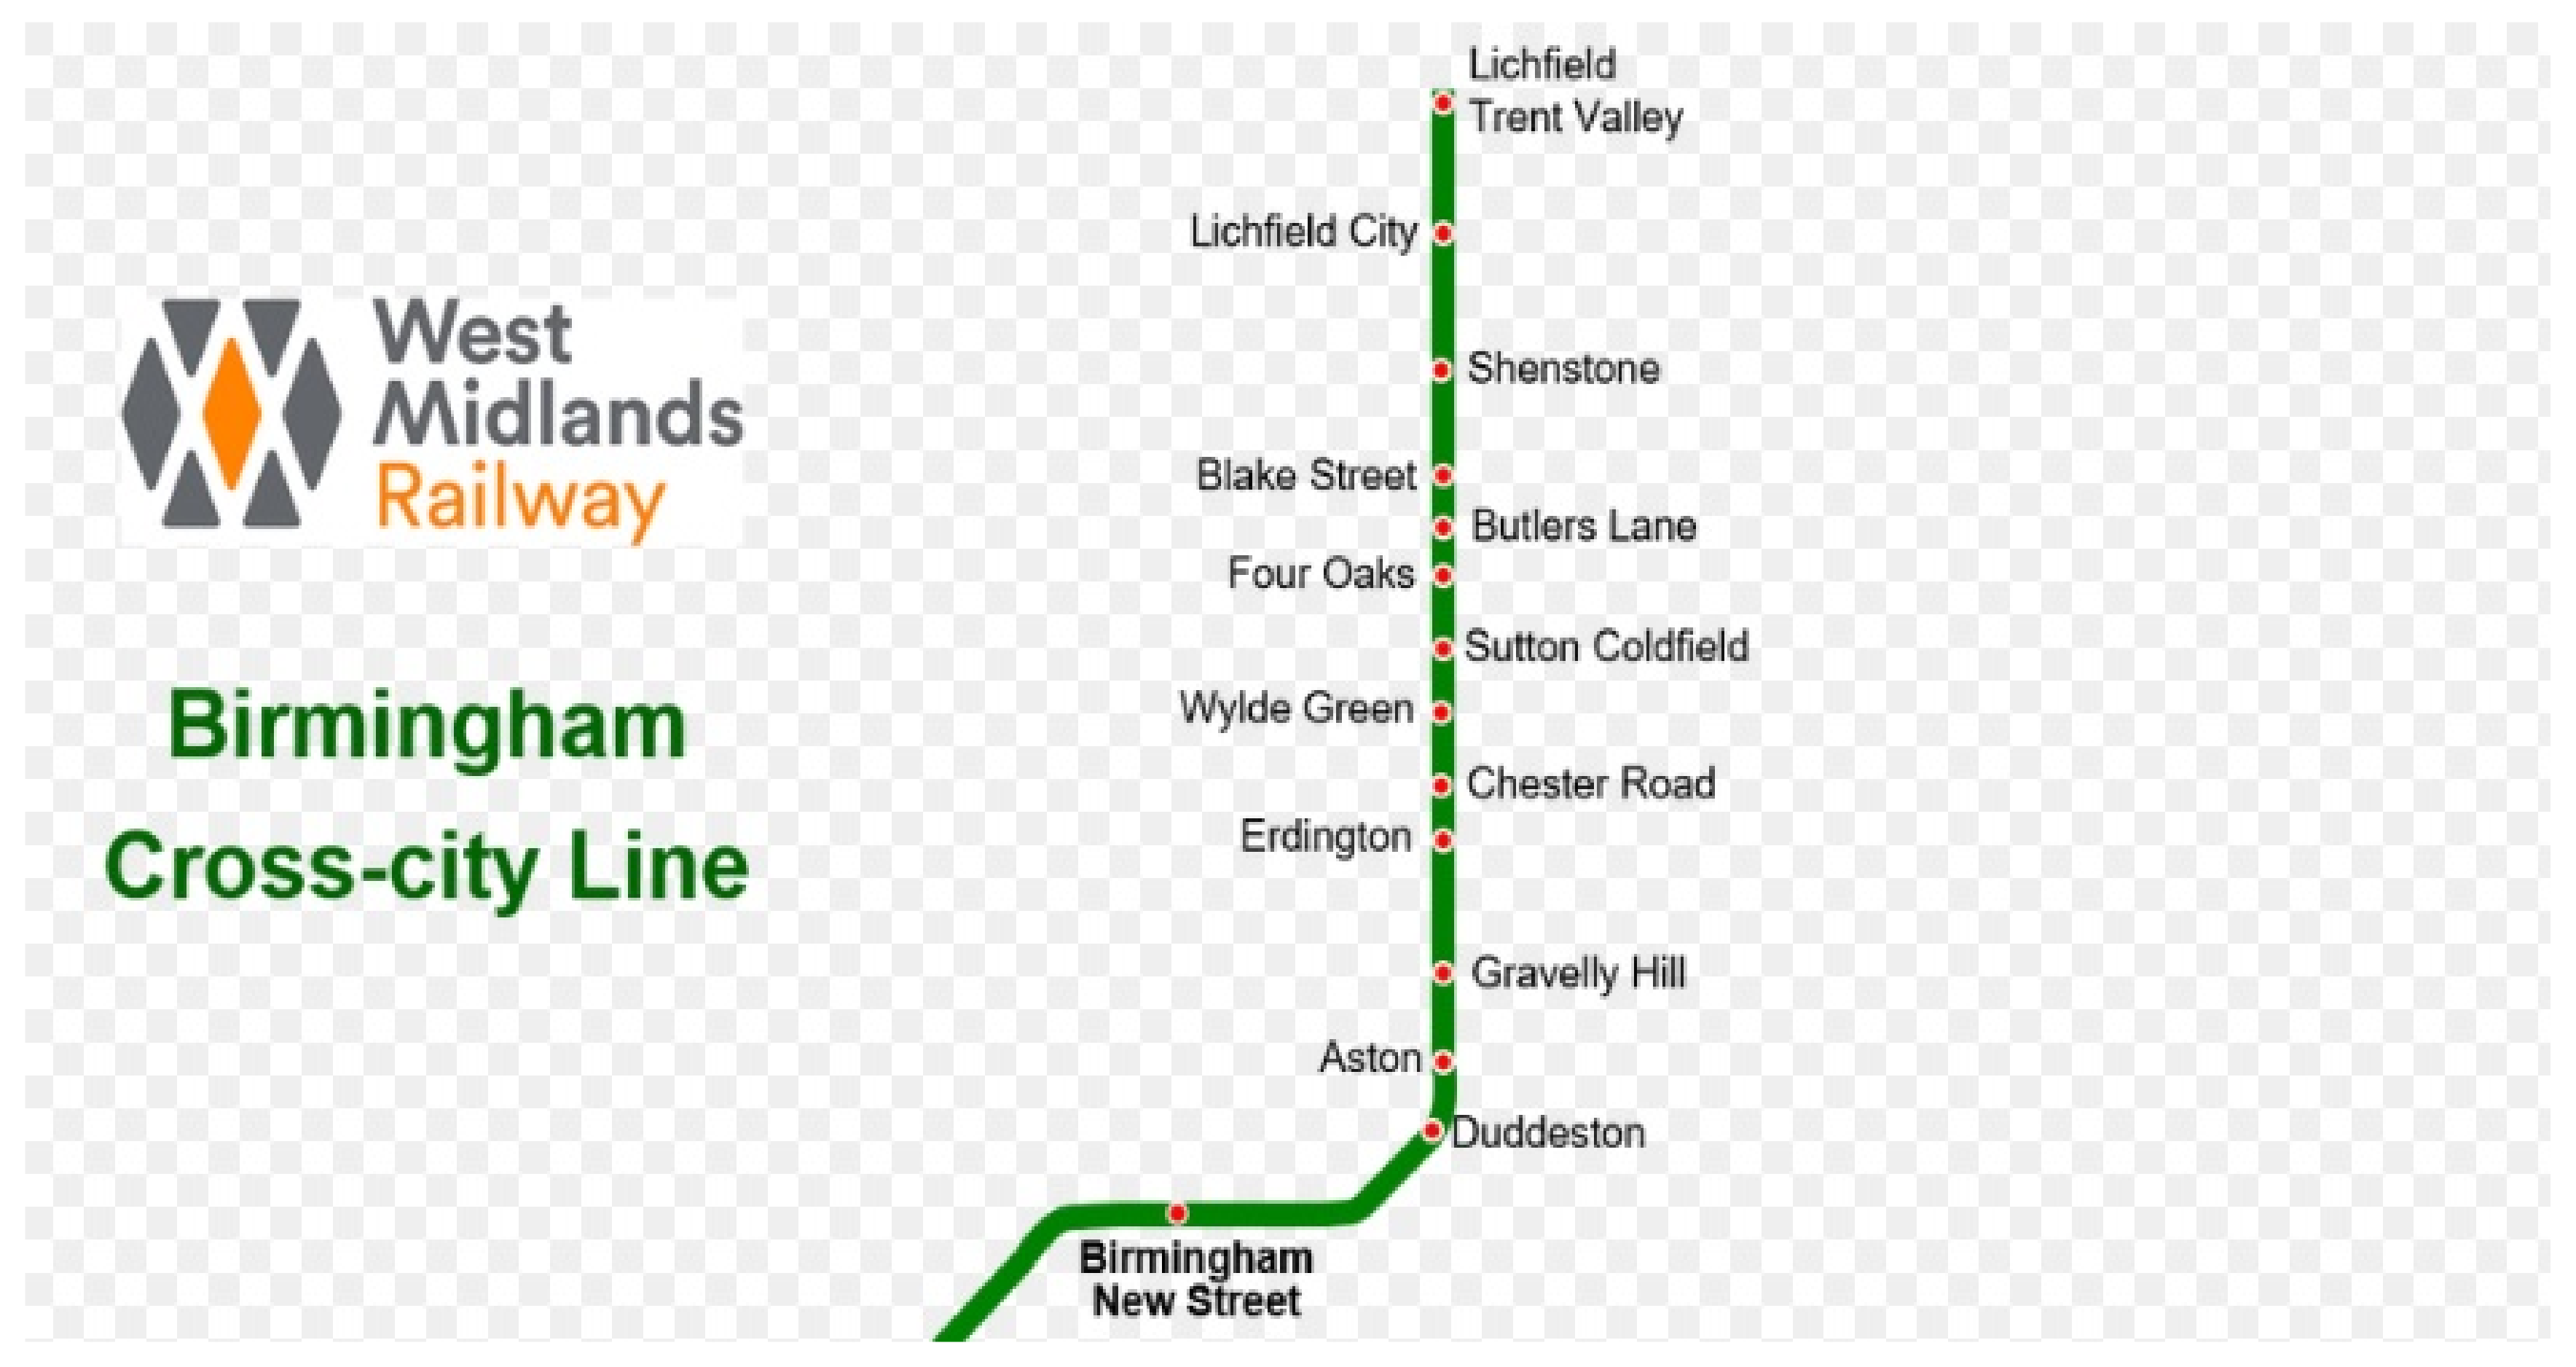
Lichfield and Birmingham New Street are connected by the Cross-City line and this service is operated by the National Rail system. It is the local and sub-urban service within the West Midlands county in England. The cross-city line connects Lichfield and Redditch via Birmingham New Street and Longbridge. Tis service is locally operated by West Midlands Trains. This line runs for 32 miles (52 km), but the distance between Lichfield and Birmingham New Street is 18.2 miles. It takes 40 min for the train to travel from Lichfield Trent valley to Birmingham New Street. There are total of 25 stations in this line from Lichfield Trent Valley station to Redditch (Figure 3). However, the line in focus of the study for this paper has 14 stations between Lichfield Trent Valley and Birmingham New Street (Figure 4). The Cross-City line is operational for passengers from 06:08 h to 23:41 h on regular week days.
In 2018, the services were extended to Bromsgrove, which was added as a second southern terminus of the line. This heavy rail line uses 1435 mm standard gauge and electrified by 25 kV AC overhead electrical line. The cross-city line opened in 1978 and is owned by Network Rail. West Midlands Trains uses 26 British Rail Class 323 vehicles to run the services through this line. The stations in the cross-city line from Lichfield Trent Valley to Birmingham New Street has seen a growth of 62% increase in the annual passenger volume in the past 15 years, hitting 51.317 million passengers. However, the passenger volume of the Birmingham New Street station alone has reached to 42.367 million in 2016–17, which constitutes to 82.55% passenger volume of all the stations in the line of our study [27]. The Birmingham New Street is the largest and busiest of all the railway stations in West Midlands region. It is the central hub of the British Railway system. It is a major destination for Virgin Train services that connects London Euston, Glasgow Central and Edinburgh Waverly via the West Coast Line. It is also the National hub to the Cross-Country line which is the UK’s longest direct rail service from Aberdeen in the North-East of Scotland to Penzance in the south-west of England. This clearly exhibits the importance of the Birmingham New Street station and this justifies the decision to move the freight into Birmingham New Street through the Cross-City line.
4. System Proposed
Through this paper, a simulation model of the Cross-City line is to be built using SIMUL8 software. The existing line between Lichfield Trent Valley and Birmingham New Street would be exactly replicated using the SIMUL8. Once the model of the train line has been replicated and studied, the extended services to carry Urban freight between Lichfield Trent Valley and Birmingham New Street are introduced into the system and run. The whole utilisation levels of the system before adding freight train services and after including freight train services are to be compared. Due to the addition of new services into the existing line, not only the utilisation levels of the stations in the line would increase, but also it provides a green and sustainable way to move freight from one point to another point. By adding these services to the existing line in suitable times, the urban freight present in several warehouses, NDCs in Lichfield, get access to reach their business centres/outlets present in Birmingham or any other part of UK within a reduced time as railways have less congestion compared to that of roadways. Figure 5 represents a flow-chart that provides an understanding of the system. It exactly depicts the proposed path for the movement of urban freight present in Lichfield region. The utilisation levels of the existing cross-country line is to be evaluated using the timetable of the line. The timetable helps in generating the utilisation levels of the train stations in the line. The obtained utilisation levels help in identifying the gap in the system, which further plays a role in making decisions in addition to services for trains to carry freight. This is important because the organisations responsible for running these train services invest largely into buying new vehicles. Generally, the trade-off between the capital costs and utilisation levels do not match up. To achieve this balance, it is important that this sort of service that transports freight using rail is a best sought alternative.
Several businesses in the UK have adapted to urban freight by rail and have been practicing for decades. Asda, in partnership with the Malcom group, started to use rail in 2001, and provided a daily service connecting the Asda National Distribution Centre at Magna Park to the Asda Regional Distribution Centre in Grangemouth which is located at a distance of 550 km.
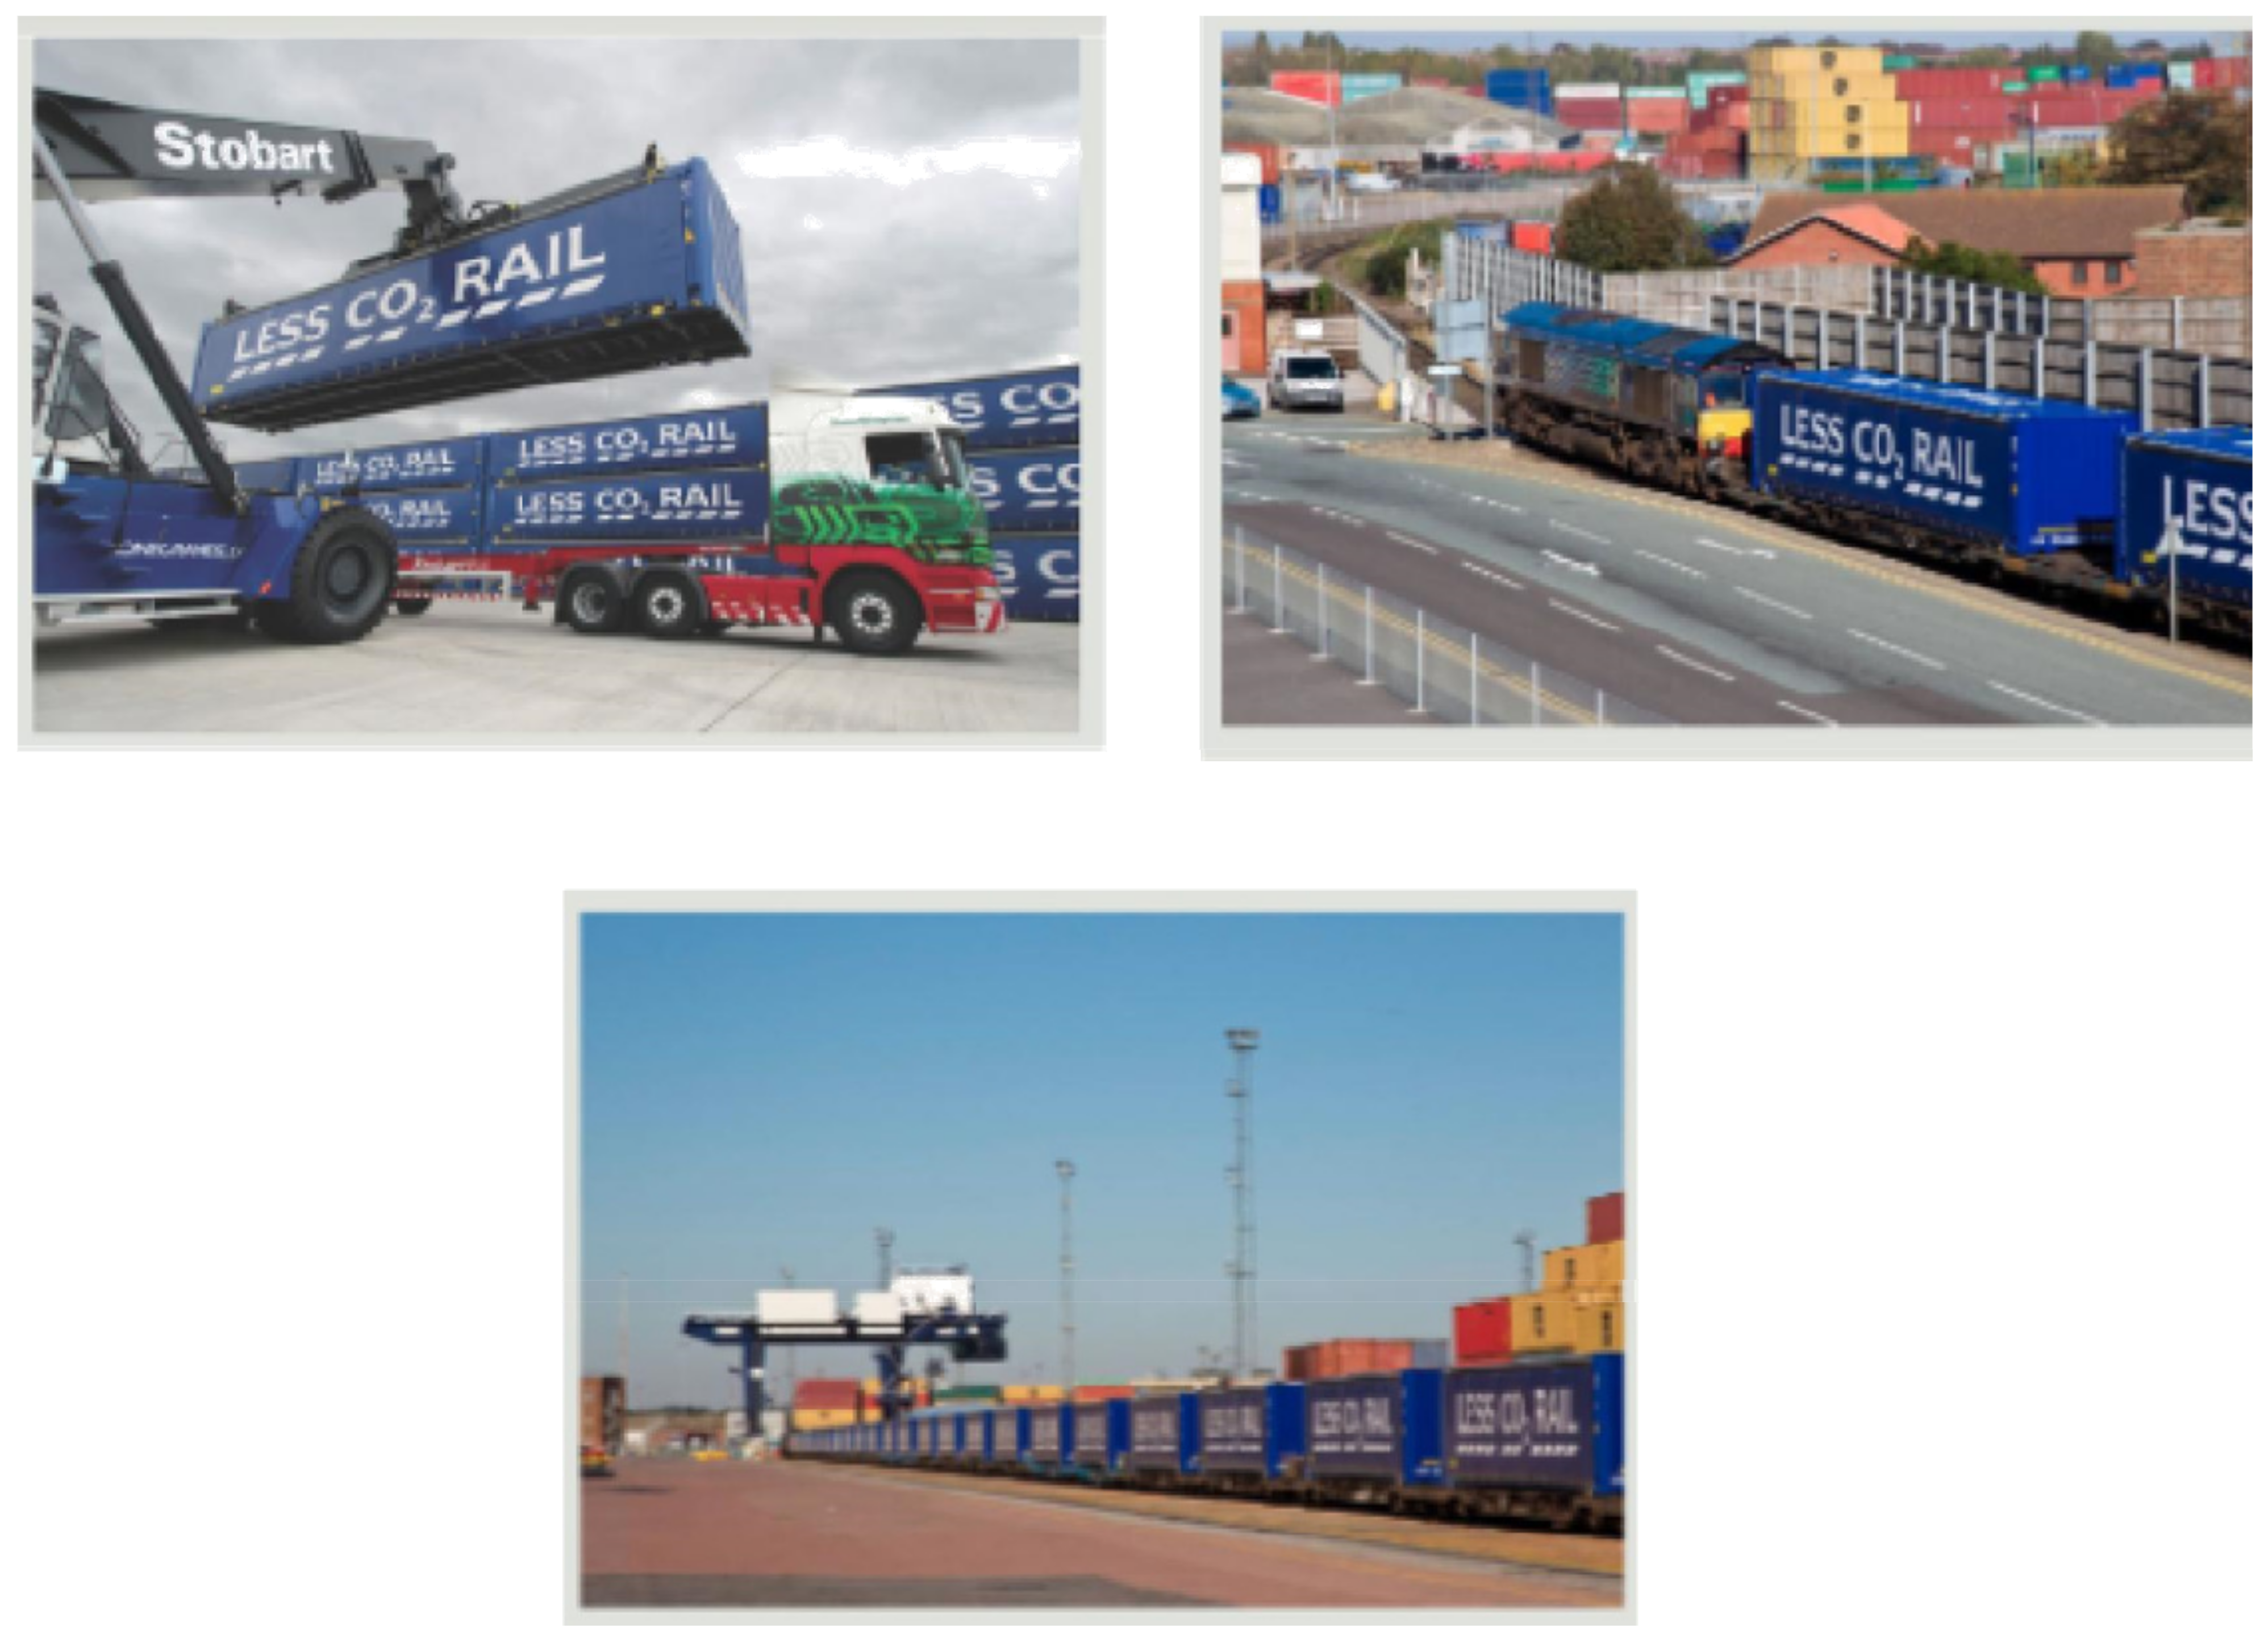
Tesco, in collaboration with DRS and Stobart Rail, developed a tailor-made solution to meet their requirements by combining their rail and road capabilities. This has provided them with a highly efficient distribution across the UK from its Daventry Depot. They have named it as LESS CO2 Rail as a part of their Zero Carbon by 2050 campaign. They estimated that this intermodal delivery solution has the capability to save 26,000,000 lorry miles every year. Furthermore, they have stated that each of their rail journey removes 77 HGVs off the UK’s already congested roads. As the result of their intermodal services, Tesco claims to reduce CO2 emission by 80% depending on the route. Figure 6 shows Tesco’s LESS CO2 Rail operations.
Freightliner intermodal is a train that carries a variety of supermarket food cargoes ranging from meat, avocado, chicken products, milk products, clothes and other general products to various destinations. Super markets are considering to move their freight using rail because of its economic benefits as well. An average freight train can remove 60 long distance HGVs from the roads, which shows the capability of the rail freight. Moving freight using rail is also considered as a safe option as the chances of fatal accidents are less compared to that of road. From the presented studies and facts, it is evident that rail freight’s contribution to the society and economy is commendable.
5. Simulation Using SIMUL8
5.1. Basics of SIMUL8
SIMUL8 is a computer modelling package used for simulating systems that involves processing of discrete entities and discrete times. This software is a tool that can be used to for designing, planning, optimisation and re-engineering of real manufacturing, logistics or service provision systems. SIMUL8 enables the creation of a computer model of a real system by considering original capacities, real life constraints, shift patterns and other parameters that effect the performance of the real system. It enables the user to understand, explore and experiment a real system in a virtual environment. SIMUL8 allows the user to simulate an existing system by varying several parameters that affect the performance of the system such as, carrying out extreme load tests.
By creating different scenarios, SIMUL8 helps to identify gaps in the system and formulate judgements by choosing an optimal solution. SIMUL8 represents a process in one event at a time. All the interactions occurring in the real process are shown graphically on the computer screen. It is a best fit for a scenario that involves the process flow. SIMUL8’s ability to accurately mirror the volatility that is seen in the real world is its greatest strength. This makes SIMUL8 an ideal choice to understand and experiment on the arrival patterns and service times between the stages of any network. As it is not dependent on any analytical formula, it is not limited by restrictive modelling assumptions. The majority of the simulation process involved in SIMUL8 revolves around handling of the work items. The basic fundamental components of the SIMUL8 package includes Work Item, Activity, Entrance, Exit, Queue, Route and Resource.
5.2. Characteristics
In order to analyse the utilisation levels of the existing Cross-City line, the official timetable of the line has been taken as the basis for evaluation. To assess the rail track infrastructure, [26] concepts of modelling have been considered. The physical track can be divided into segments as track segments and railway stations. This division into segments stimulates the study of the railway line. The travel time of each track segment has been depicted from the time-table. To evaluate the utilisation levels of the line under study, the computer model has to reproduce the best possible flow of the trains around the system. To achieve this, it is crucial to build a similar system that consists of all the interactions between the trains and system throughout the network. For this, all the stations existing in the Cross-City line (i.e., 14 stations) are needed to be reproduced in the simulation system. This arises for a need to create an entry point that provides input for the trains coming into the system and an exit point that lets the trains to leave the system. This means that trains come into the system through a start point, then passes through several activities such as imitating stations, queues, lines and then exit the railway line through an end point. This study considered that there is no interaction between clock-wise and anti-clock-wise streams of travel in the system. This makes sure that the trains are moving always in opposite lines, which in turn averts any potential blockages.
Once the original Cross-City line for passenger services is recreated using the SIMUL8 computer software, it is to be evaluated to attain the utilisation levels of the total system. These utilisation levels provide suggestions on the future steps to be taken, such as, increasing the number of services to improve the utilisation levels of the system by adding freight trains during a suitable part of the day when the system is being under-utilised.
5.3. Activities
An activity is a place where work takes place on work items. The work being done at an activity usually consumes time and occasionally it requires the availability of some resources. In this system, the activity module enables the user to create the stations where the train stops within. The activity module in this case is constrained by allowing only one train (unit) in a platform (activity) at a time. The work centre is the waiting time at each activity that is fed to the software as the average waiting time at each station that is gathered from the timetable. There are two activities developed between any two stations. One activity represents the service time at every station, i.e., the time between arrival and departure of the train. The other activity represents the travel time between any two stations. After the work is done at a particular activity, the work item then is sent to another simulation object depending on the routing rules specified.
5.4. Queues
A queue is a place where work to be done can wait until the appropriate resources or activities are available. A queue is known to be an elementary object that constructs the structure of a simulation. Work Items can be assigned a certain amount of time to stay in the queue before they enter the activity. In the case of this study, the queue module is used to limit the capacity of the line between any two stations. Queues are set to have a maximum capacity of one, which means that only one train is allowed to be in each section of the line at a time. This also enables meeting the headway allowance in the railway network by making sure that there is always a particular distance between adjacent trains to prevent collisions and interrupt services.
5.5. Start Point and End Modules
A start point is a place where work to be done appears in the simulation. Start points enable the user to feed in work using different statistical distributions. The start point helps to feed in different work item types into the system. The trains (work items) coming into the system are generated through this module. The arrival times of the trains can be composed to a random or a fixed schedule. In this study, the start points adapt to a fixed schedule and further follow the similar arrival patterns that have been arbitrated in the timetable of the Cross-City Line. In this study, the Lichfield Trent Valley is the start point where the train services start from.
The completed work item leaves the simulation through this end point. The end point records some important information, while a work item is leaving the system, such as, the total time spent by the work item in the system since it has entered through the start point. Trains leaving the system are facilitated by the end module. In this study, Birmingham New Street is the end module, where the services terminate.
5.6. Simulation of the Actual System
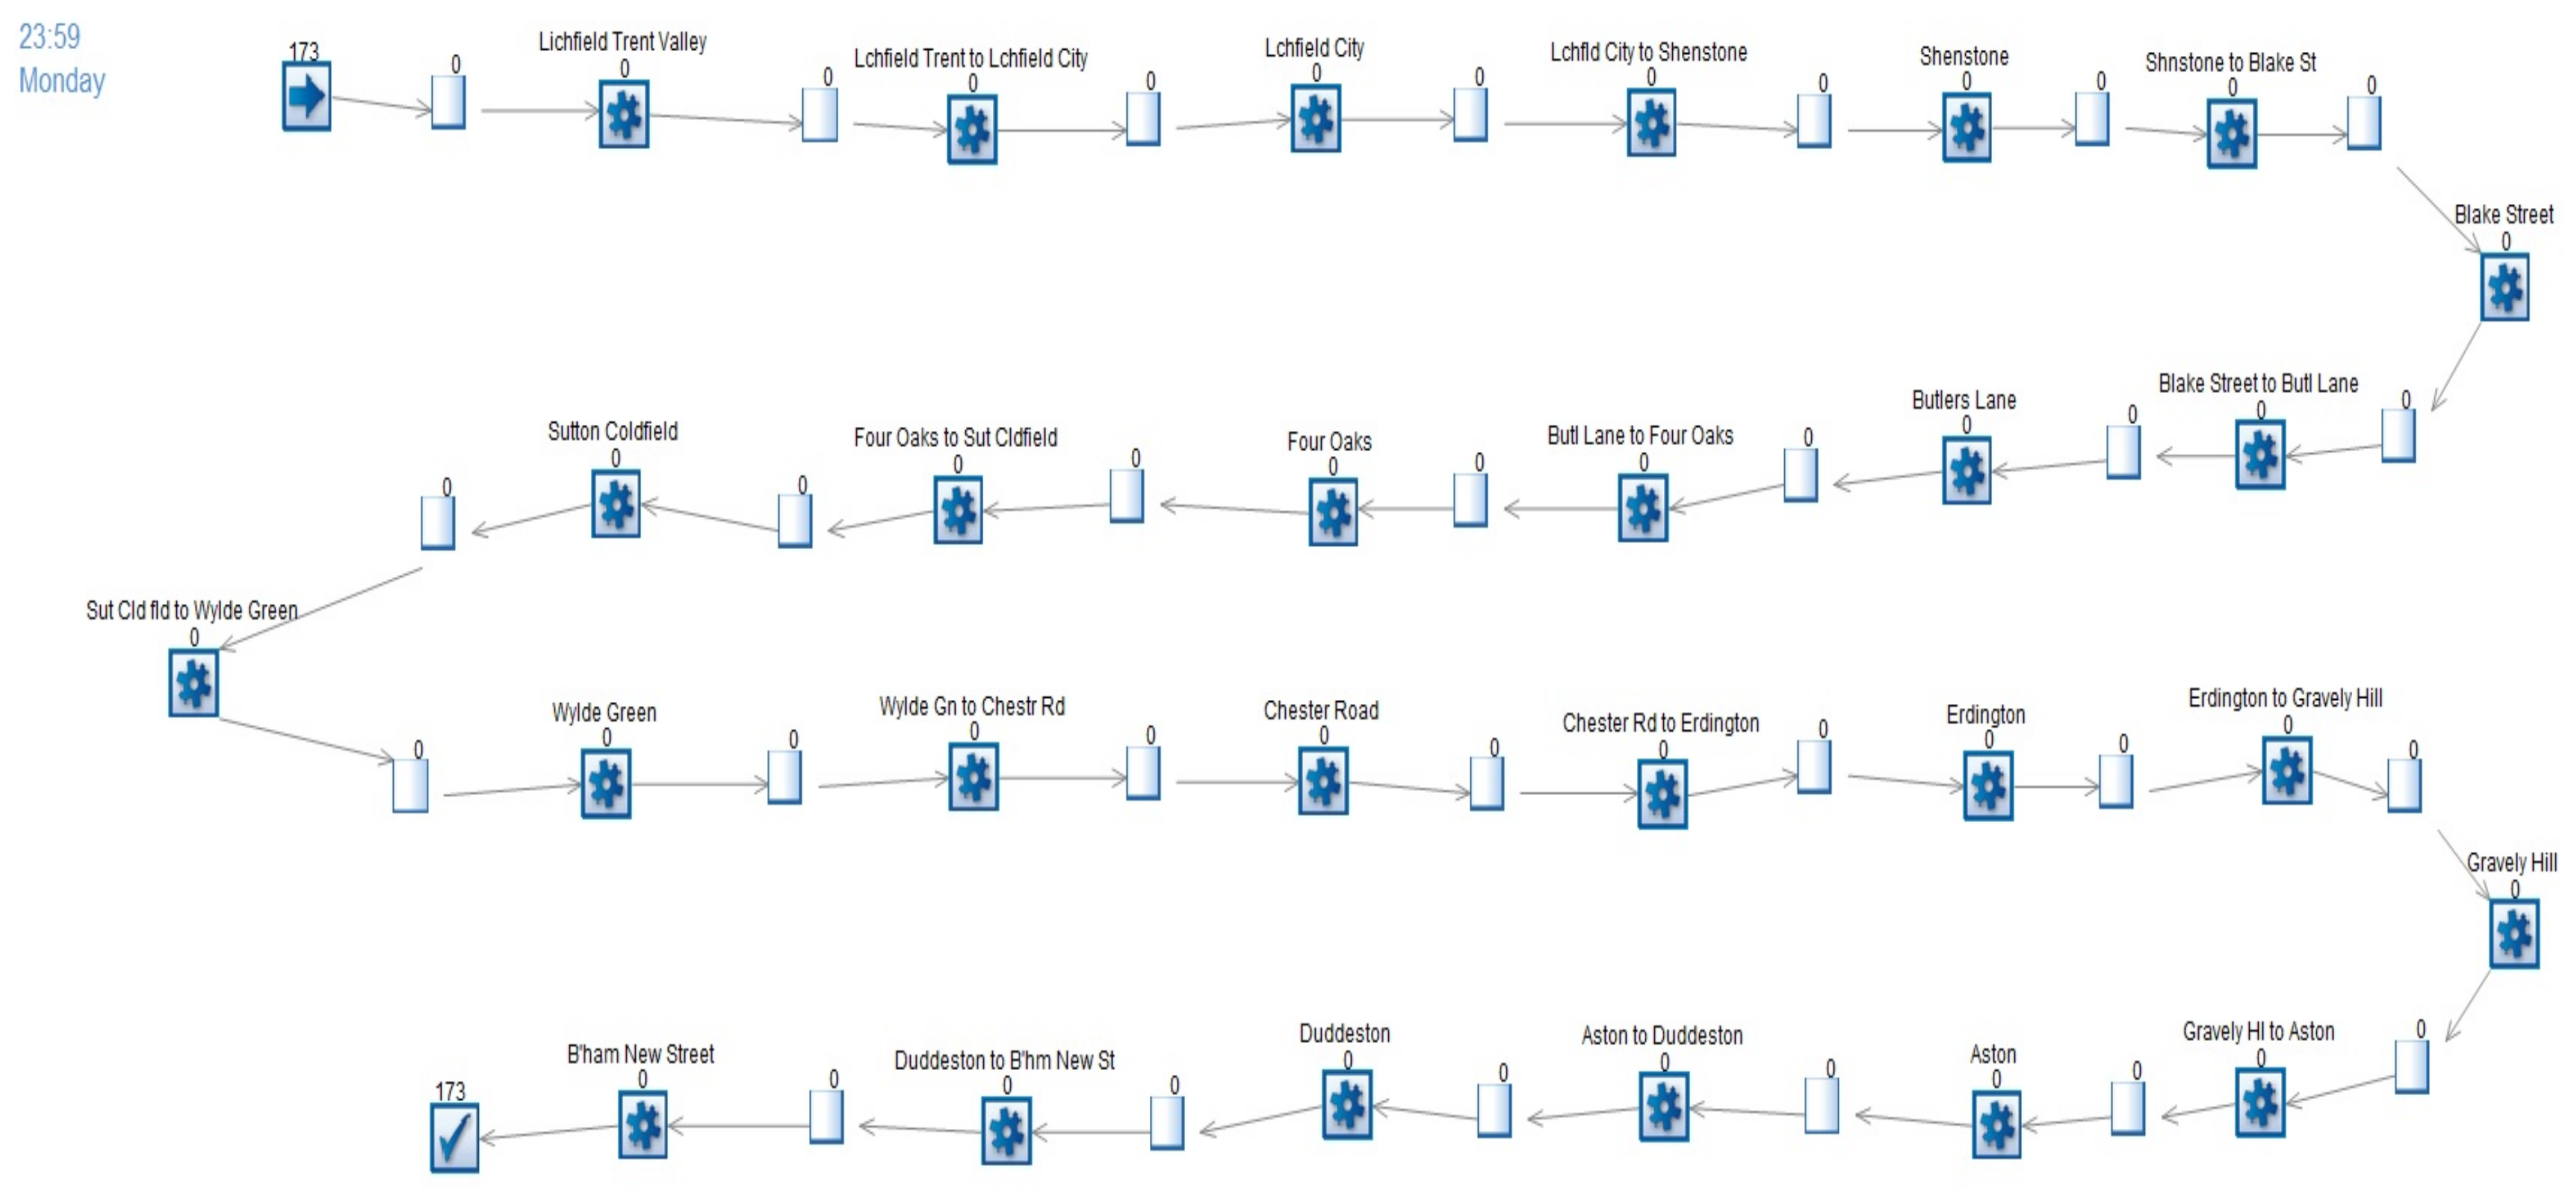
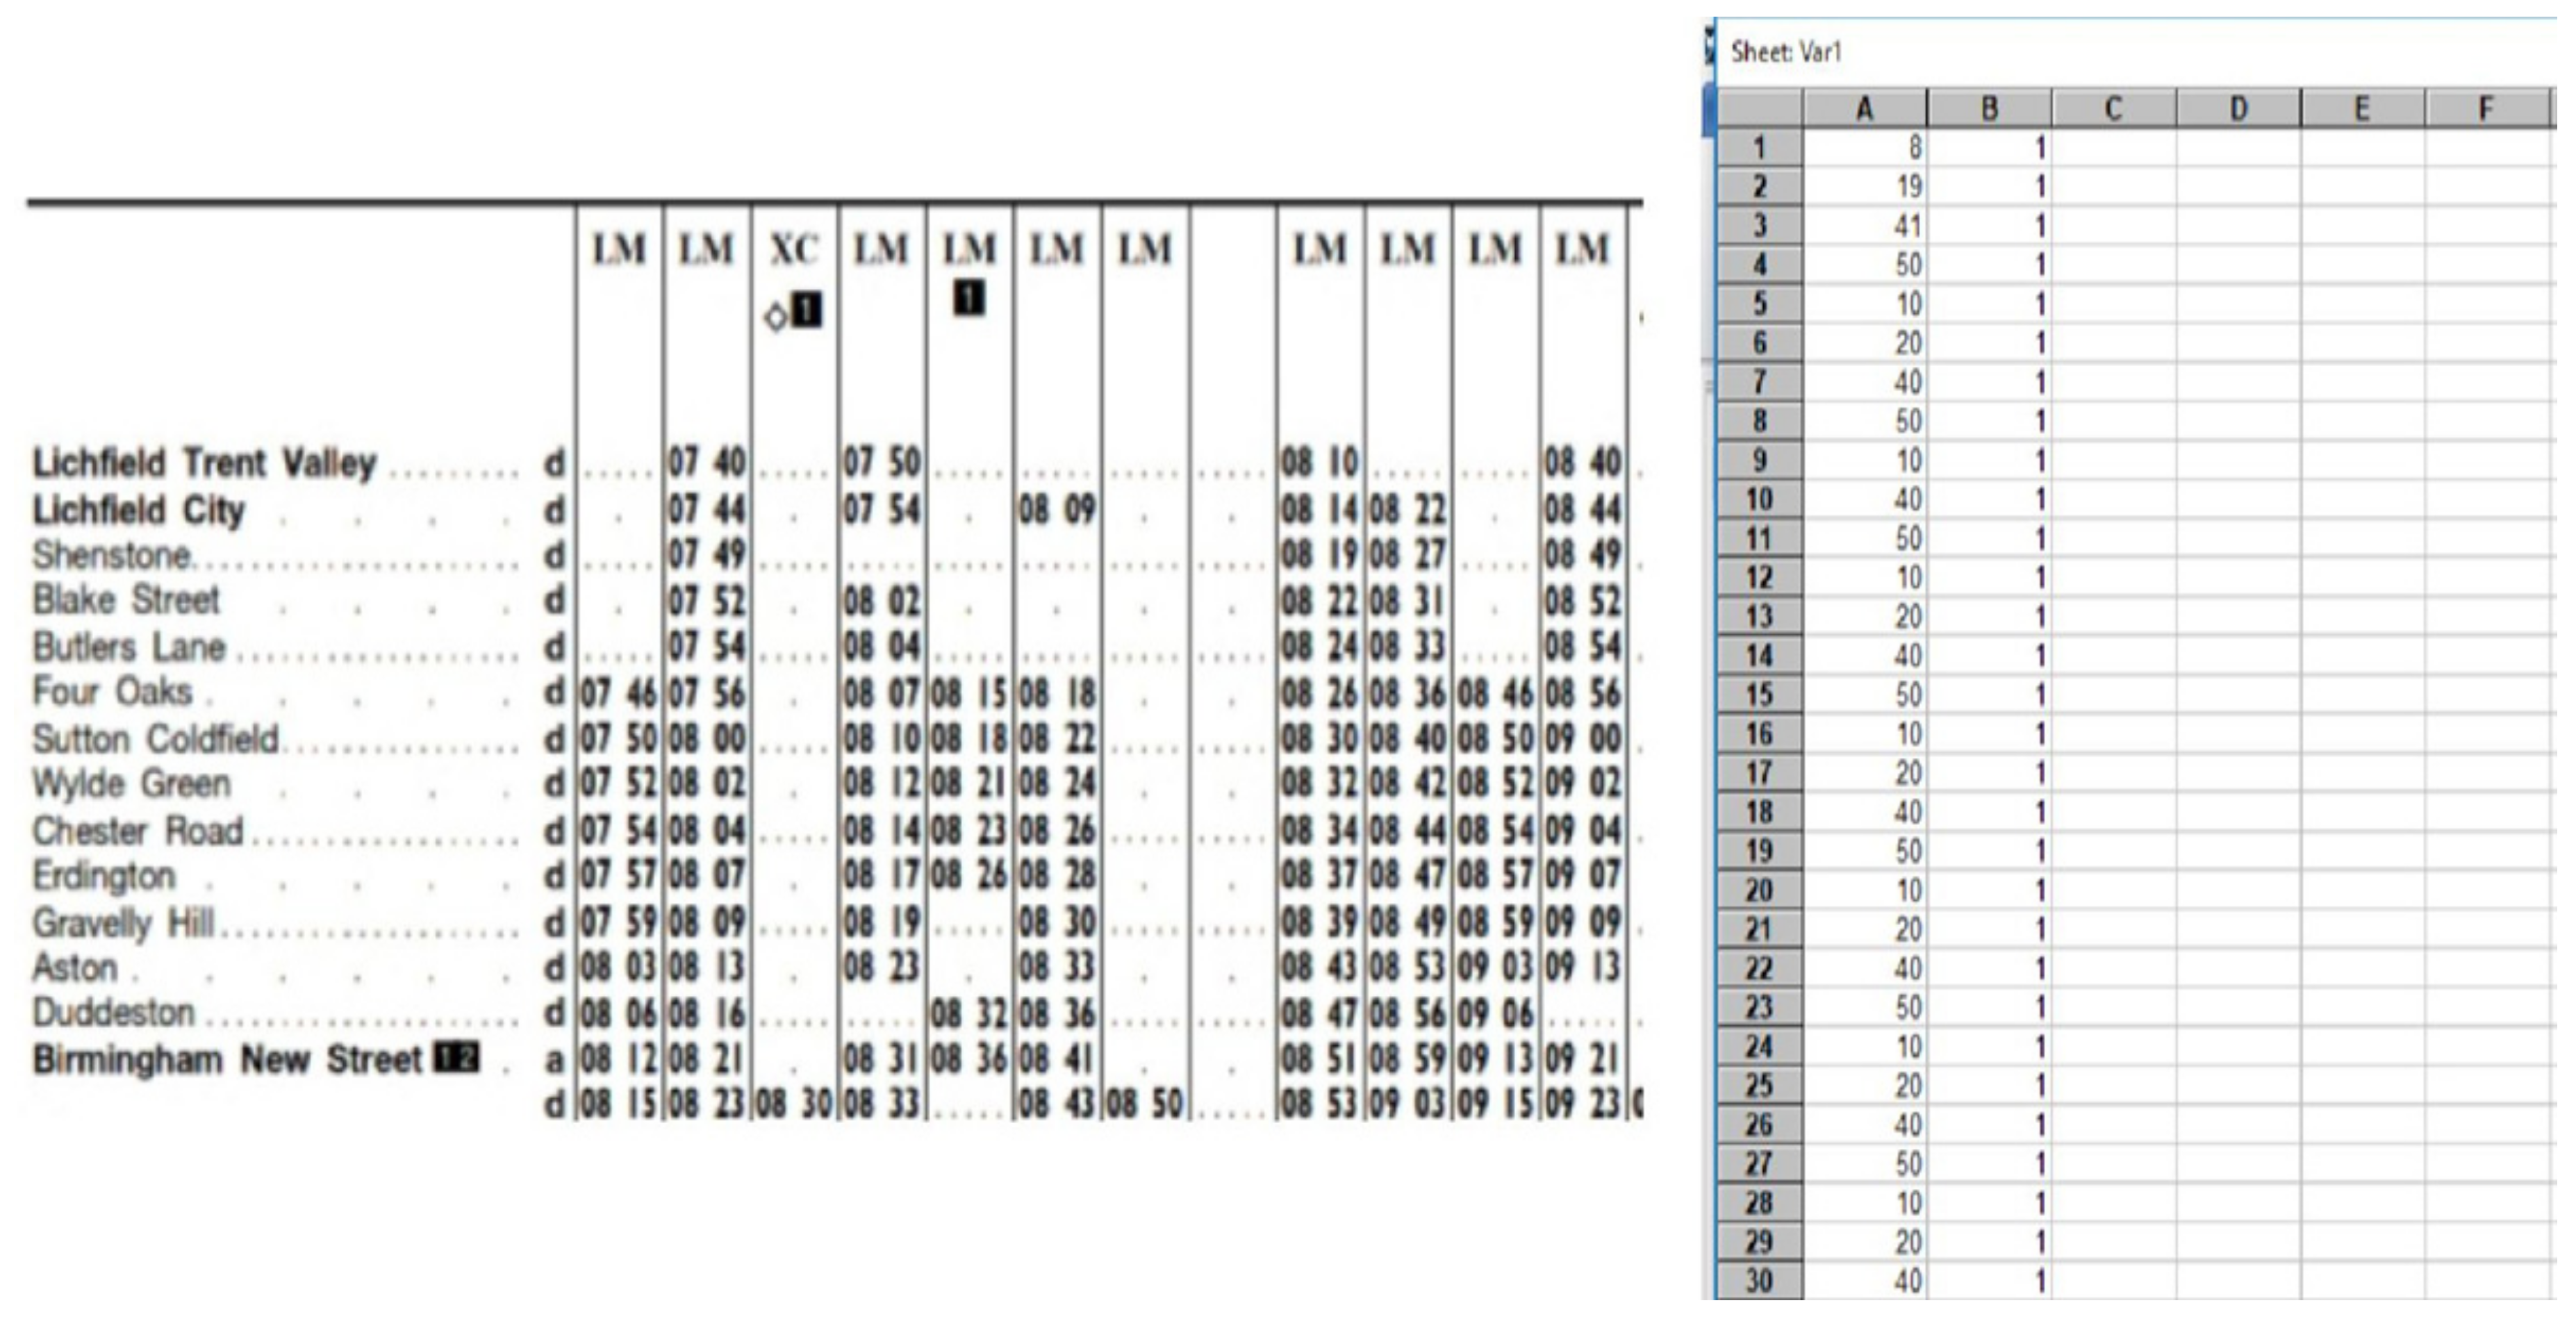
The actual system under consideration has 14 stations in total from Lichfield Trent Valley to Birmingham New Street. This system was created using the start point, activity, queue and end modules. Joining all these attributes together exactly gives the replicated Cross-City line in the simulation software as shown in Figure 7. The data at the start point to be fed, such as the number of trains coming in to the system during a particular time frame, was extracted from the timetable provided by the West Midlands Rail Authority for the Cross-City line. This data was uploaded into a spreadsheet in such a way that the start point module follows the trend and frequencies existing in the spreadsheet to feed the trains into the system.
The spreadsheet created here resembles the original timetable of the Cross-City line (Figure 8). For evaluating the utilisation levels of the actual system, the line has been simulated for a whole day, i.e., from 06:08—23:41 h. The service runs for more than 18 h in a day. The other variables involved in creating the model, such as the mean travel time between two stations, service time at each station were acquired from the time-table. This helps in generating the average waiting time and average working time of each activity centre i.e., each station along the railway line. These results further help in evaluating the overall utilisation levels of the system.
6. Utilisation Scenarios and Its Resulting Implications
6.1. Current Utilisation Levels
The section of the Cross-City line under study has Lichfield Trent Valley and Birmingham New Street as the terminal stations. As the only line operating in this direction is considered for this study, Lichfield Trent Valley is the start point and Birmingham New Street is the end point. The utilisation levels computed are presented in Table 1. Five trails were run using the software for a period of one day. Considering the situation and need presented by most of the organisations operating rail services, a two-hour maintenance period (i.e.,04:00–06:00 h) for the line was allotted, during which no trains were expected to be operating in the line. During this period, the utilisation of the line was considered to be 100%, as the maintenance work done was considered to be completely useful and required.
The overall utilisation level of the actual Cross-City Line under study from Lichfield Trent Valley to Birmingham New Street was computed to be 12.19%. The overall utilisation of the system was computed using the Formula:
The utilisation levels of the 12 stations in between the terminal stations were observed to be similar. After analysing the obtained results, it is understood that the cross-city line under study is being under-utilised. Some of the reasons might be due to a lesser number of services being run throughout the day, and the other may be due to the operation of services for only 20 h in a 24-h day. It is clear that working during the remaining four hours after midnight is 0%. This can be overcome if the number of services all over the day are increased. However, the services for passengers depends highly on the demand for these services. The demand might be fluctuating and the operators might not want to risk in such a case. Hence, this provides a gap in the system and a potential for alternative opportunities to enhance the utilisation levels of the current system. The evaluation suggests that there is an opportunity in the timetable to increase the number of services. The utilisation levels of the train stations along the line are shallow. The addition of new services can improve the utilisation of stations along the line.
6.2. Proposed Scenarios
This is an ideal situation to introduce new services that move freight along the line. It is understood that Lichfield, being a hub for distribution centres for several retailers, presents an opportunity to use rail to transport their freight into Birmingham New Street, from where the freight can be moved into outlets in Birmingham City or to the other locations in the United Kingdom. This provides a green and sustainable way to move goods instead of using HGVs which were previously used. However, it is also known to be a pricy affair, but nonetheless, it also presents a solution to improve the utilisation levels of the current railway line from Lichfield Trent Valley to Birmingham New Street.
In order to tackle this problem, three different scenarios were proposed. Each scenario presents with a case to increase the number of train services to the existing system. These newly added services are to be used to move freight from Lichfield Trent Valley to Birmingham New Street.
Scenario 1:
48 additional services to move freight during the midnight
Scenario 2:
72 additional services to move freight during the midnight and non-peak hours
Scenario 3:
108 additional services to move freight during the midnight and non-peak hours.
Evaluating the actual system and the low utilisation levels points to an opportunity to improve the utilisation levels of the railway line. The three scenarios discussed in the paper were proposed to bridge the gap in the actual system that makes the whole line more efficient.
Scenario 1
This scenario proposes to add an additional 48 freight train services between Lichfield Trent Valley and Birmingham New Street. These 48 trains are to be added during the current non-operational hours of the line i.e., from 23:40–04:00 h. These trains would run at a frequency of one train in every five minutes from 00:00 h to 04:00 h. Further, this increases the total number of services running from Lichfield Trent Valley to Birmingham New Street to 113. The utilisation levels computed are presented in Table 2. Five trails were run using the software for a time period of one day. The utilisation levels of the 12 stations in between the terminal stations were observed to be similar.
The overall utilisation level is 38.05%. This includes the two-hour maintenance slot allotted where the utilisation of the system is noted to be 100%. The addition of new freight services caused an increase of 212.1% in utilisation levels of the system to that of the actual case. The percentage increase was computed using the Formula:
Scenario 2
In order to test this scenario, an additional 72 services were added to the original system. Of the 72 trains, 48 trains would run from 00:00 h to 04:00 h at a frequency of one train for every five minutes, and the other 24 services would run during the passenger operational hours of the line. This combination was achieved by including three services per hour during the non-peak hours of the day. This would increase the total number of services running from Lichfield Trent Valley City to Birmingham New Street to 137. The utilisation levels computed are presented in Table 3. Five trails were run using the software for a time period of one day. The utilisation levels of the 12 stations in between the terminal stations were observed to be similar.
The overall utilisation level is 44.37%, which includes the two-hour maintenance slot allotted where the utilisation of the system is noted to be 100%. The addition of new freight services caused an increase of 263.96% in the utilisation levels of the system to that of the actual case.
Scenario 3
In this case, an additional 108 services were added to the original system. From the 108 trains, 48 trains would run from 00:00 h to 04:00 h at a frequency of one train for every five minutes, and the other 60 services would run during the operational hours of the line where passengers also simultaneously use the line. This was achieved by including three to four services per hour during the non-peak hours during the day. This would increase the total number of series running from Lichfield Trent Valley City to Birmingham New Street to 173. The utilisation levels computed are presented in Table 4.
The overall utilisation level for this scenario was found to be 53.84%. This includes the two-hour maintenance slot allotted where the utilisation of the system was noted to be 100%. The addition of new freight services caused an increase of 341.71% in utilisation levels of the system to that of the actual case
6.3. Results
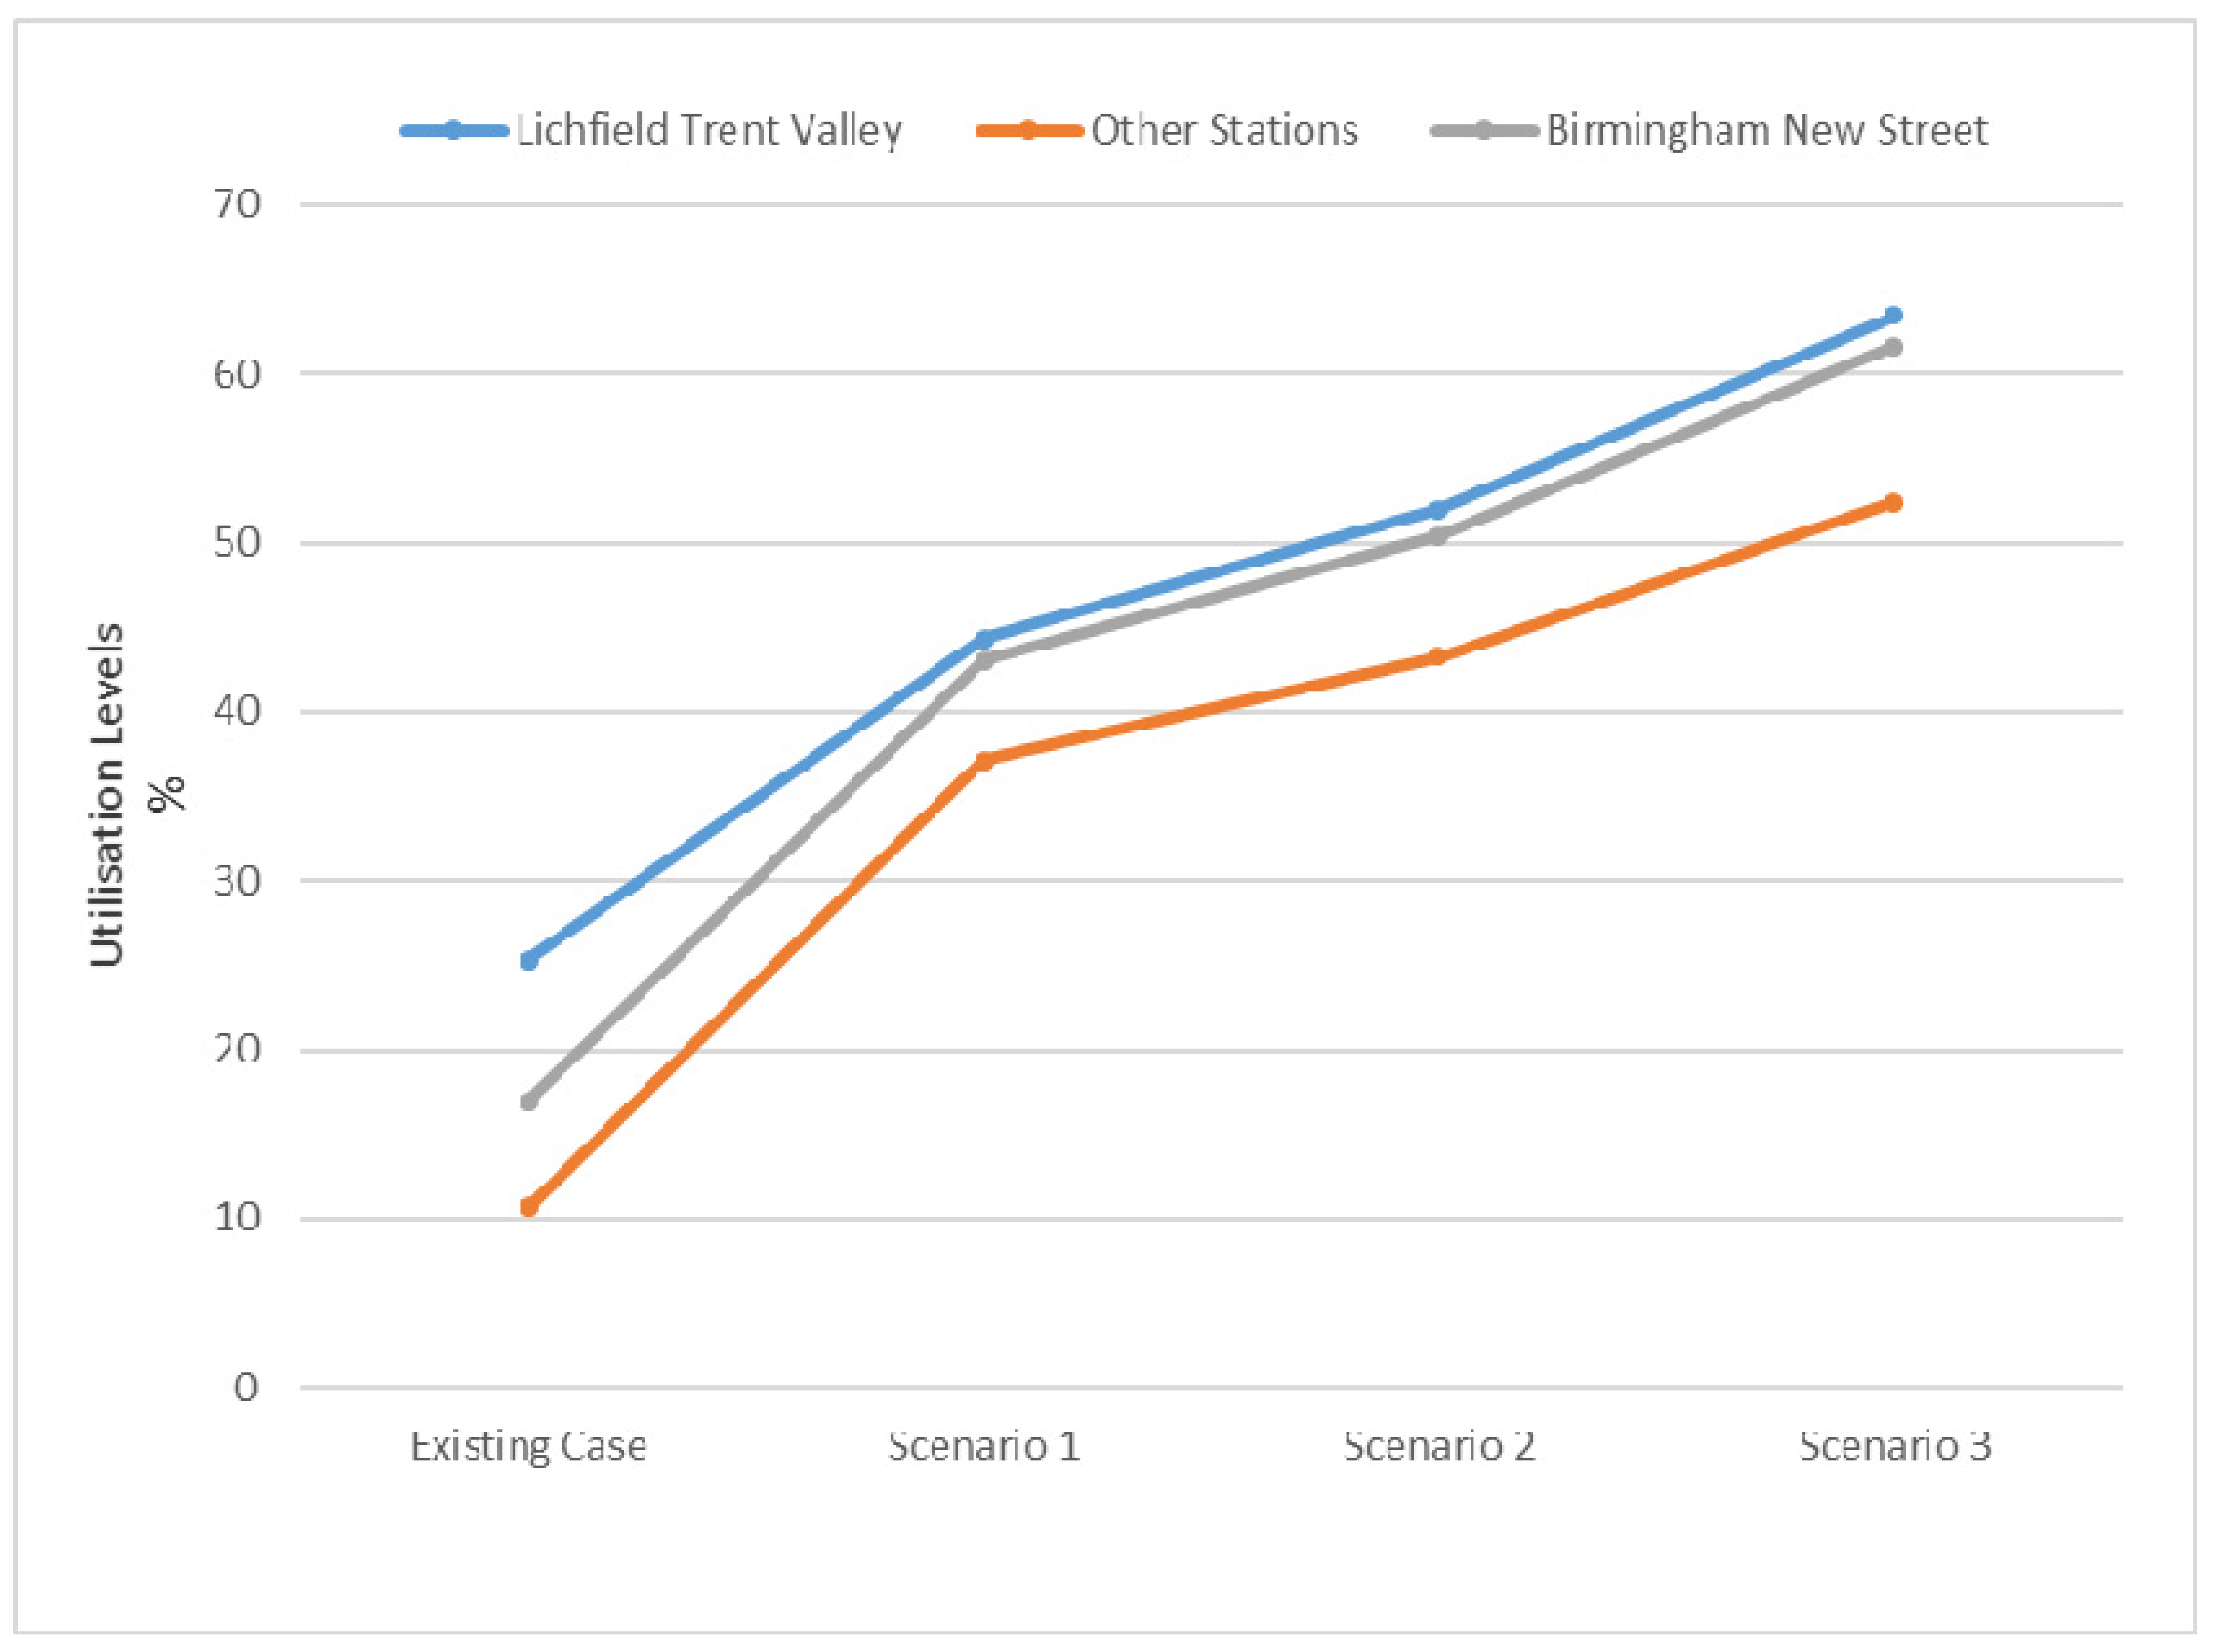
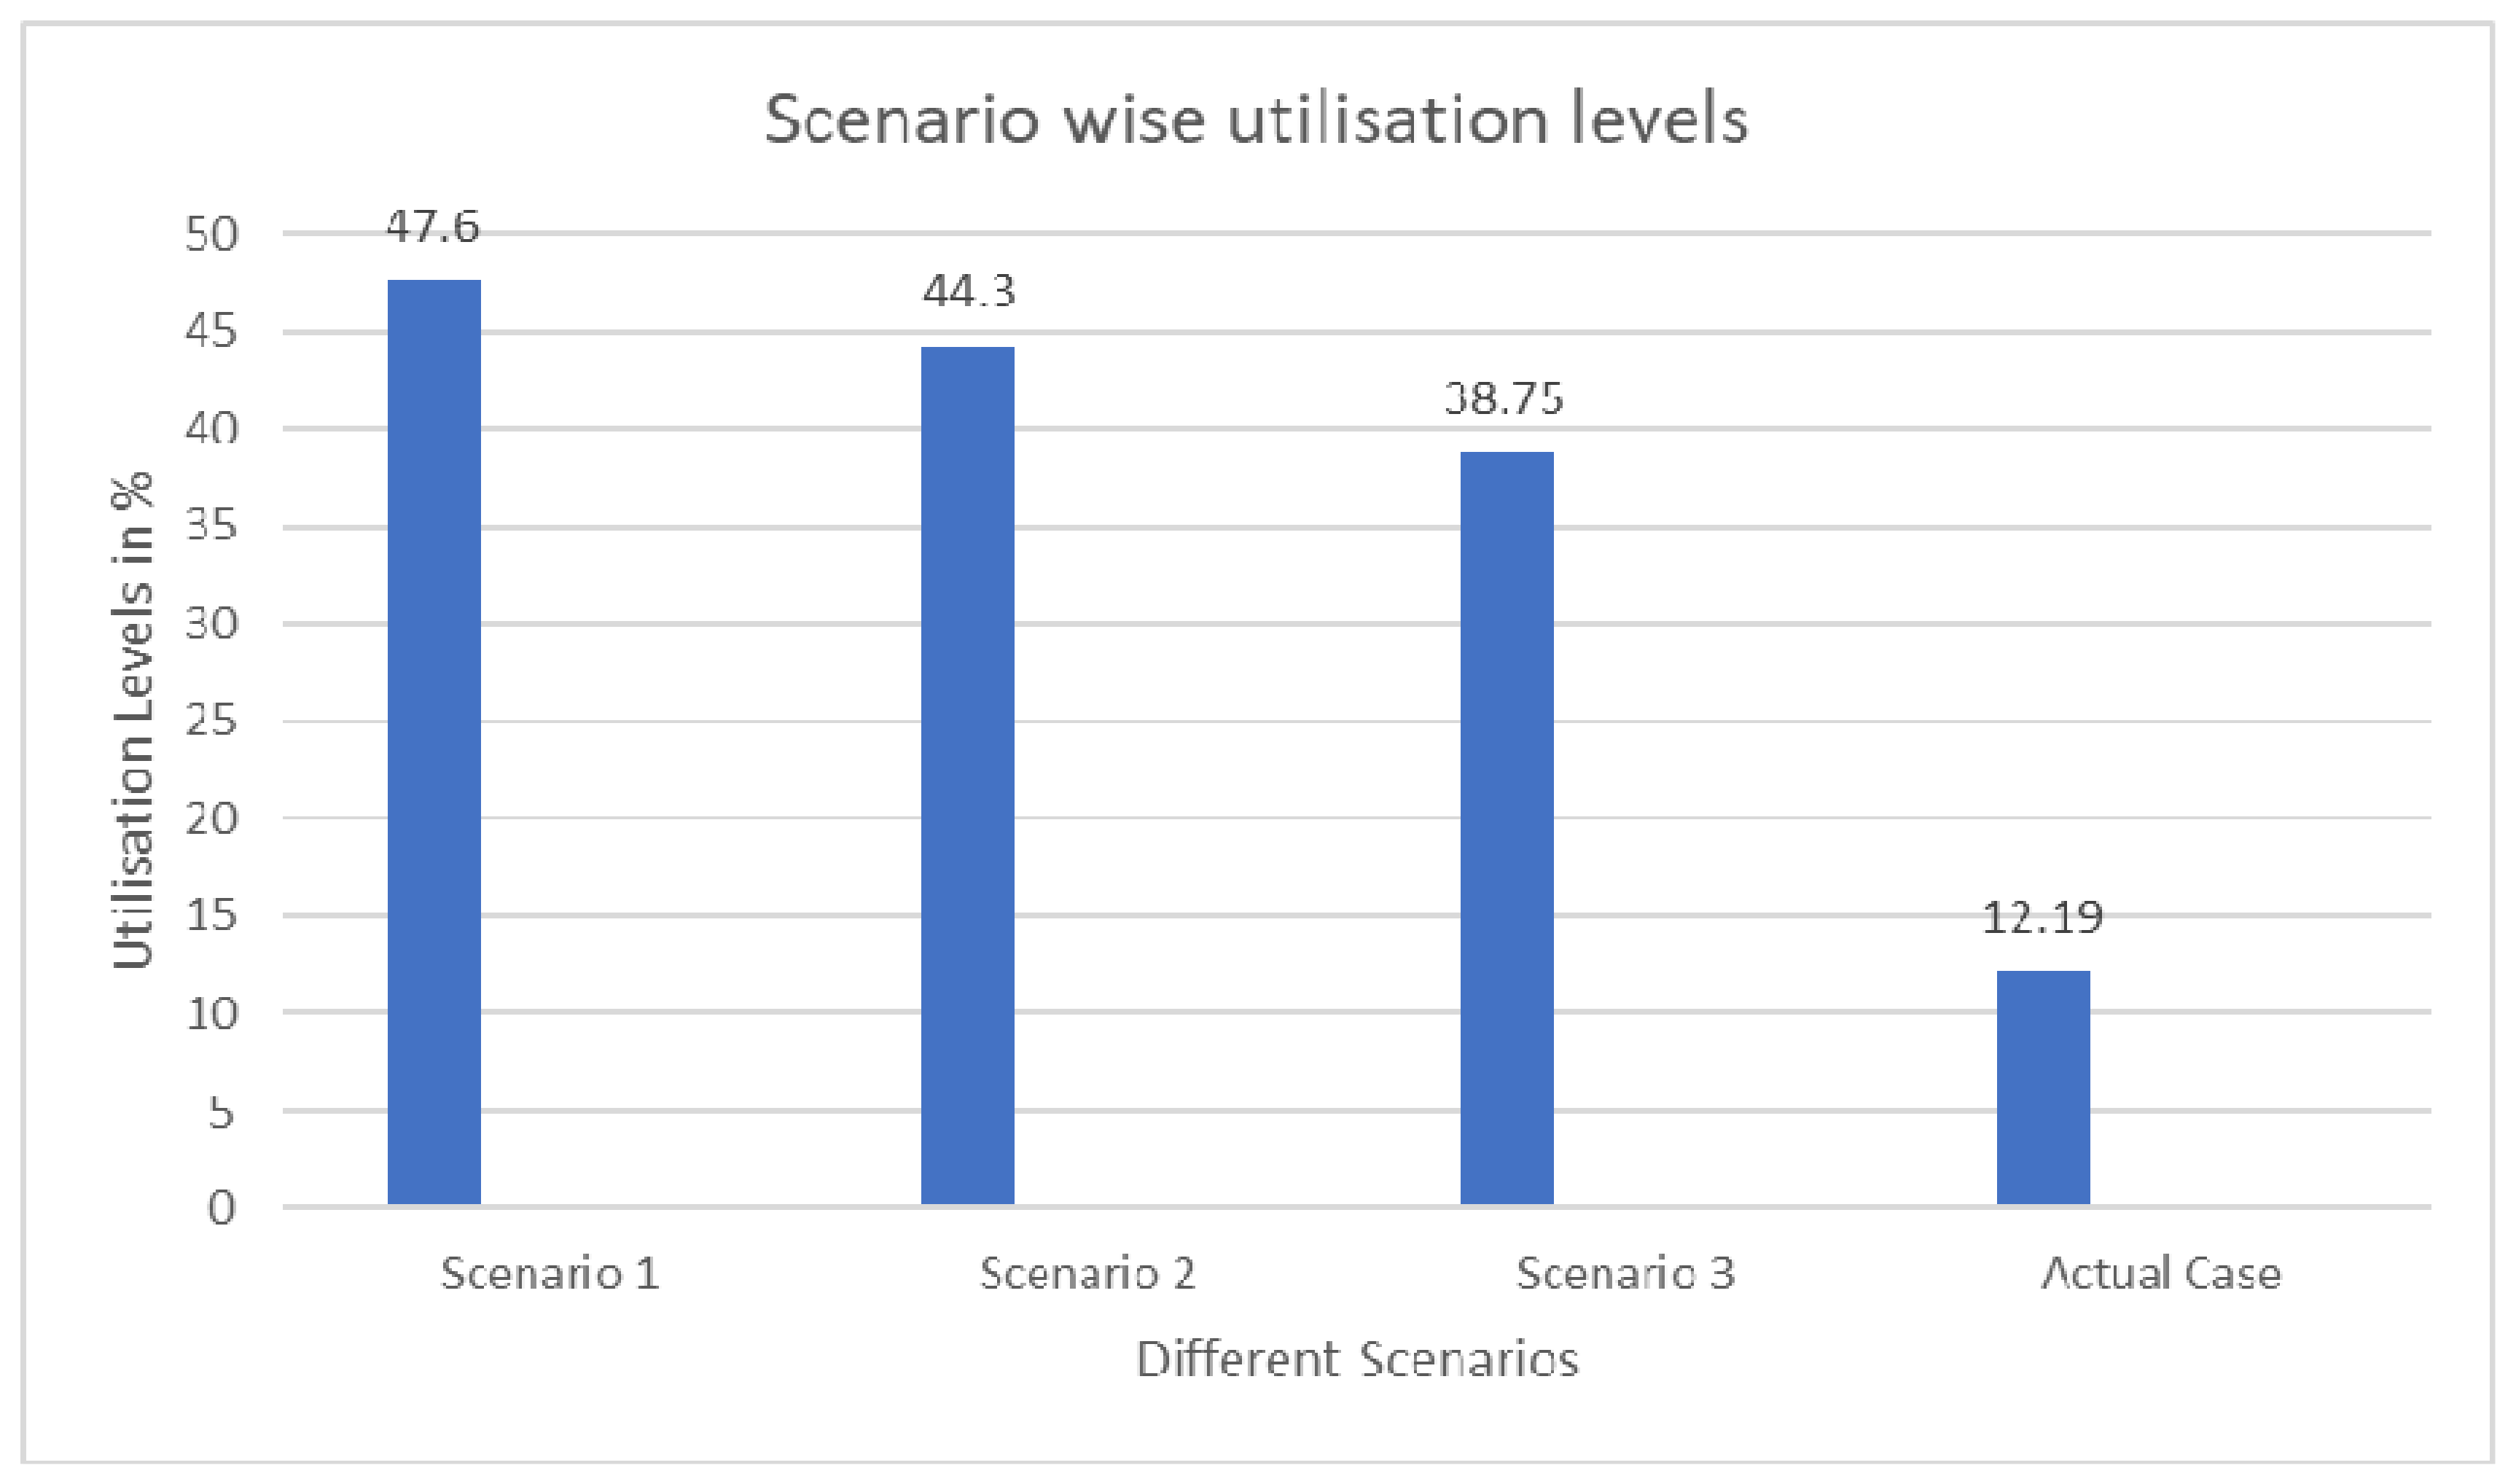
The results of the simulations carried out suggests a drastic increase in the utilisation levels of the system when the two presented scenarios were tested. The overall utilisation of the original Cross-City line was evaluated to be 12.19%. Whereas, there was an increase of 212.1%, 263.96% and 341.71% in utilisation for scenario 1, 2 and 3 respectively. The proposed systems clearly show that the utilisation levels of the entire system, including the way stations and that of the line in the entire route, are subject to increase. Figure 9 represents and compares the station-wise utilisation levels for the different scenarios discussed in the study.
The utilisation levels at the terminal stations were observed to be higher compared to the stations in between as the freight was only being loaded and unloaded at the terminal stations, which requires an additional time.
Figure 10 shows the graphical representation of the utilisation levels for the four cases that were studied using SIMUL8. The results suggested that the proposed scenario 3 would be the best fit to achieve higher utilisation levels of the railway line as well as provide a sustainable means to move the urban freight. Apart from benefitting the environment, the improved utilisation levels help to achieve the trade-off between the investments made by the rail operating organisations and returns received.
Table 5 shows the comparison between the three proposed scenarios. An average freight train can remove 50 HGVs on Britain’s congested roads [27]. As the second scenario proposes to add 108 freight trains into the system, it has the potential to remove 5400 HGVs from the British roads per day in that route. This is equivalent to 21,600 cars per day. An average HGV can carry 30 tonnes maximum weight. The proposed scenario has the potential to carry 162,000 kg per day and reduce NOx emissions by 27%, particulates by 18.9% and CO2, nationally, by 5.4%. These figures have been estimated by the data provided by Office of Rail and Road in 2019 [27].
7. Concluding Remarks
An event-based simulation model was developed to evaluate the current utilisation levels of the Cross-Country line running from Lichfield Trent Valley to Birmingham New Street in the United Kingdom (UK), and the performance of the railway line has been studied. The model was implemented in the SIMUL8 simulation software and the timetable was used as a reference to various attributes in the simulation model.
The overall utilisation level of the Cross-Country line from Lichfield Trent Valley to Birmingham New Street was found out to be 12.19%. It is evident that the system is being under-utilised and there is a potential to improve the utilisation levels of the line by introducing new services that carry urban freight.
The three scenarios that propose to increase the number of train services running in the line, by adding additional 48, 72 and 108 new services that carry urban freight from Lichfield Trent Valley to Birmingham New Street. All the scenarios were analysed and evaluated using SIMUL8 software. The three scenarios presented were reported to be viable to be included into the current system. Scenario-3 proved to be the best fit solution by having the capacity to improve the utilisation level of the system by 341.71%. The increase in the levels of utilisation results in reduced costs to the organisations running the train services. It not only addresses the issue of energy efficiency by enhancing the performance of the system, but also provides a solution for the increasing pollution existing in the world today by providing a case to move goods in a sustainable manner that has the capacity to reduce emission levels to a greater extent. The impact of the proposed system on the environment was understood by the evaluation for the estimation of the reduction in CO2 and other green-house gas emission levels.
The utilisation levels for the Cross-City line run by National Rail were evaluated and analysed to study the performance of the system. The inclusion of the proposed rail freight services along the line were evaluated. It would be beneficial to research further the transshipment process required to load and unload the freight into the trains that eliminates the need to build any new terminal in the stations. Exploring the use of technology to reduce costs would be worth studying.
There are many industrial estates and business parks situated in the West Midlands region in the UK. Over time, a system that incorporates the movement of the entire freight in the region would be of great value for further study. This requires collaboration between separate businesses and Transport for West Midlands. Before this, it would be necessary to contact the businesses and gather detailed information about their freight movement, current choice of transport and the frequency with which they would use any proposed scheme in the future. On this regard, it would be of importance to conduct market research to identify potential stakeholders for moving urban freight by rail in this area.
More importantly, there is scope for further research for utilising the West Midlands railway line to transport non-time dependent goods, such as waste, from the businesses concentrated along the railway line and dispose of them off at recycling centres. These services would be quite beneficial as they have the ability to create new business, improve the current utilisation levels and also contribute to the sustainable urban logistics of the whole region that eventually reduces congestion, emission and traffic.
Author Contributions
P.P. created and presented the published work including writing of the initial draft and substantive translation. P.P. visualized and verified the outcome as a part of the activity of overall replication of experiments and other research outputs. M.M. formulated research goals, aims, preparation and creation of the published work from the original research group. M.M. was instrumental for critical review, commentary and revision for pre and post publication stages. E.S. had oversight and leadership responsibility for the research activity including planning, execution and external mentorship to the core team.
Funding
This research received no external funding.
Conflicts of Interest
The authors declare no conflicts of interest.
References
- Transport for West Midlands. West Midlands Freight Strategy. 2016. Available online: https://www.tfwm.org.uk/ media/1207/west-midlands-freight-strategy.pdf (accessed on 5 August 2019).
- Department for Transport, Freight Carbon Review. 2017. Available online: https//assets.publishing.service.gov.uk/government/uploads/system/uploads/attachment_data/file/590922/freight-carbon-review-2017.pdf (accessed on 26 July 2019).
- He, M.; Shen, J.; Wu, X.; Luo, J. Logistics Space: A Literature Review from the Sustainability Perspective. Sustainability 2018, 10, 2815. [Google Scholar] [CrossRef]
- Department for Transport, Domestic Road Freight Statistics. 2016. Available online: https://assets.publishing.service.gov.uk/government/uploads/system/uploads/attachment_data/file/627597/domestic-road-freight-statistics-2016.pdf (accessed on 28 July 2019).
- Cargo Tram Zurich. 2005. Available online: http://www.bestufs.net/download/conferences/Amsterdam_Jun05/BESTUFS_Amsterdam_June05_Neuhold_ERZ.pdf (accessed on 27 July 2019).
- Marinov, M.; White, T. Rail Freight System: What Future? 2009. Available online: http://worldtransportjournal.com/wp-content/uploads/2015/02/wtpp15.2.pdf (accessed on 15 July 2019).
- Sandra, M.; Baptista, P.; Costa, A. Comparing the use of small sized electric vehicles with diesel vans on city logistics. Procedia Soc. Behav. Sci. 2014, 111, 350–359. [Google Scholar]
- Gruber, J.; Kihm, A.; Lenz, B. A new vehicle for urban freight? An ex-ante evaluation of electric cargo bikes in courier services. Res. Transp. Bus. Manag. 2014, 11, 53–62. [Google Scholar] [CrossRef] [Green Version]
- Schliwa, G.; Armitage, R.; Aziz, S.; Evans, J.; Rhoades, J. Sustainable city logistics — Making cargo cycles viable for urban freight transport. Res. Transp. Business Manag. 2015, 15, 50–57. [Google Scholar] [CrossRef]
- Trentini, A.; Malhene, N. Flow management of passengers and goods coexisting in the urban environment: Conceptual and operational points of view. Procedia Soc. Behav. Sci. 2012, 39, 807–817. [Google Scholar] [CrossRef]
- Marinov, M.; Giubilei, F.; Gerhardt, M.; Özkan, T.; Stergiou, E.; Papadopol, M.; Cabecinha, L. Urban freight movement by rail. J. Transp. Lit. 2013, 7, 87–116. [Google Scholar] [CrossRef] [Green Version]
- Ozturk, O.; Patrick, J. An optimization model for freight transport using urban rail transit. Eur. J. Oper. Res. 2018, 267, 1110–1112. [Google Scholar] [CrossRef]
- Wanjie, H.; Jianjun, D.; Gang, H.B. Simulation on the External Benefits and Development of Metro-Based Underground Logistics System: A System Dynamics Approach. 2019. Available online: https://ssrn.com/abstract=3405729 (accessed on 2 July 2019).
- Dampier, A.; Marinov, M. A Study of the Feasibility and Potential Implementation of Metro-Based Freight Transportation in Newcastle upon Tyne. Urban Rail Transit 2015, 1, 164–182. [Google Scholar] [CrossRef] [Green Version]
- Kelly, J.; Marinov, M. Innovative Interior Designs for Urban Freight Distribution Using Light Rail Systems. Urban Rail Transit 2017, 3, 238–254. [Google Scholar] [CrossRef] [Green Version]
- Marinov, M.; Mortimer, P.; Zunder, T.; Islam, D. A steady state analysis for yard performances. J. Transp. Literature 2011, 5, 33–49. [Google Scholar]
- Salido, M.A.; Barber, F.; Ingolotti, L. Robustness for a single railway line: Analytical and simulation methods. Expert Syst. Appl. 2012, 39, 13305–13327. [Google Scholar] [CrossRef] [Green Version]
- Feng, J.; Yu, D.; Ni, S.Q. An Objective Train Timetabling Quality Evaluation Method. Math. Probl. Eng. 2017, 2017, 3047963. [Google Scholar]
- Huang, H.; Li, K.; Wang, Y. A simulation method for analysing and evaluating rail system performance based on Speed Profile. Syst. Sci. Syst. Eng. 2018, 27, 810–834. [Google Scholar] [CrossRef]
- Grube, P.; Nunez, F.; Cipriano, A. An Event driven simulator multiline metro systems and its application to Santiago de Chile metropolitan rail network. Simul. Model. Pract. Theory 2010, 19, 393–405. [Google Scholar] [CrossRef]
- Tan, W.; Chai, Y.; Liu, Y. A message-driving formalism for modelling and simulation of multi-agent supply chain systems. J. Syst. Sci. Syst. Eng. 2011, 20, 385–399. [Google Scholar] [CrossRef]
- Mortaghi, A.; Marinov, M. Analysis of urban freight by rail using event based simulation. Simul. Model. Pract. Theory 2012, 25, 73–89. [Google Scholar]
- Woroniuk, C.; Marinov, M. Simulation modelling to analyse the current level of utilisation of sections along a rail route. J. Transp. Lit. 2013, 7, 235–252. [Google Scholar] [CrossRef] [Green Version]
- Wales, J.; Marinov, M. Analysis of delays and delay mitigation on a metropolitan railway network using event based simulation. Simul. Model. Pract. Theory 2015, 52, 55–57. [Google Scholar] [CrossRef]
- Singhania, V.; Marinov, M. An event based simulation model for analysing the utilisation levels of a railway line in urban area. Promet 2016, 29, 521–528. [Google Scholar] [CrossRef]
- Marinov, M.; Viegas, J. A mesoscopic simulation modelling methodology for analysing and evaluating freight train operations in a rail network. Simul. Model. Pract. Theory 2011, 19, 516–539. [Google Scholar] [CrossRef]
- Office of Road and Rail. Freight Rail Usage. 2019. Available online: https://dataportal.orr.gov.uk/statistics/usage/freight-rail-usage/ (accessed on 6 August 2019).
Figure 1.
National Distribution Centres (NDCs) present in and around Birmingham metropolitan.

Figure 2.
NDCs present around Lichfield.

Figure 3.
The complete Cross-City.

Figure 4.
Part of the railway line under study line.

Figure 5.
Illustration of the proposed system.

Figure 6.
Tesco’s LESS CO2 Rail in action for moving freight.

Figure 7.
Simulation layout of the original line.

Figure 8.
Timetable replicated in a spreadsheet.

Figure 9.
Station-wise utilisation levels.

Figure 10.
Overall utilisation levels of various systems in different scenarios.


Table 1.
The actual total operating and waiting times of the stations along the line.
| Station | Operating Time (in Minutes) | Waiting Time (in Minutes) | Operating % | Waiting % |
|---|---|---|---|---|
| Lichfield Trent Valley | 369.648 | 1070.352 | 25.27 | 74.73 |
| Other Stations in the line | 154.08 | 1285.92 | 10.70 | 89.30 |
| Birmingham New Street | 243.963 | 1196.064 | 16.94 | 83.06 |
| Overall Utilisation % | 12.19% |
Table 2.
The total operating and waiting times of the stations along the line for Scenario 1.
| Station | Operating Time (in Minutes) | Waiting Time (in Minutes) | Operating % | Waiting % |
|---|---|---|---|---|
| Lichfield Trent Valley | 638.06 | 801.93 | 44.31 | 55.69 |
| Other stations in the line | 534.53 | 905.47 | 37.12 | 62.88 |
| Birmingham New Street | 619.63 | 820.37 | 43.03 | 56.97 |
| Overall Utilisation % | 38.05% |
Table 3.
The total operating and waiting times of the stations along the line for Scenario 2.
| Station | Operating Time (in Minutes) | Waiting Time (in Minutes) | Operating % | Waiting % |
|---|---|---|---|---|
| Lichfield Trent Valley | 748.22 | 691.78 | 51.96 | 48.04 |
| Other Stations in the line | 622.51 | 817.49 | 43.23 | 56.77 |
| Birmingham New Street | 725.90 | 714.10 | 50.41 | 49.59 |
| Overall Utilisation % | 44.37% |
Table 4.
The total operating and waiting times of the stations along the line for Scenario 3.
| Station | Operating Time (in Minutes) | Waiting Time (in Minutes) | Operating % | Waiting % |
|---|---|---|---|---|
| Lichfield Trent Valley | 913.25 | 526.75 | 63.42 | 36.58 |
| Other Stations in the line | 754.56 | 685.44 | 52.4 | 47.6 |
| Birmingham New Street | 887.61 | 552.384 | 61.64 | 38.36 |
| Overall Utilisation % | 53.84% |
Table 5.
Impact comparison of all the scenarios under study.
| Scenario 1 | Scenario 2 | Scenario 3 | |
|---|---|---|---|
| No. of services increased | 48 | 72 | 108 |
| Overall Utilisation Level (%) | 38.05% | 44.37 | 53.84 |
| % Increase in Utilisation Level | 212.1% | 263.96% | 341.71% |
| Number of HGV’s removed per day | 2400 | 3600 | 5400 |
| Total weight carrying capacity | 72,000 kg | 108,000 kg | 162,000 kg |
| CO2% reduced (equivalent) | 2.4 | 3.6 | 5.4 |
© 2019 by the authors. Licensee MDPI, Basel, Switzerland. This article is an open access article distributed under the terms and conditions of the Creative Commons Attribution (CC BY) license (http://creativecommons.org/licenses/by/4.0/).
Share and Cite
MDPI and ACS Style
Potti, P.; Marinov, M.; Sweeney, E. A Simulation Study on the Potential of Moving Urban Freight by a Cross-City Railway Line. Sustainability 2019, 11, 6088. https://doi.org/10.3390/su11216088
AMA Style
Potti P, Marinov M, Sweeney E. A Simulation Study on the Potential of Moving Urban Freight by a Cross-City Railway Line. Sustainability. 2019; 11(21):6088. https://doi.org/10.3390/su11216088
Chicago/Turabian StylePotti, Praful, Marin Marinov, and Edward Sweeney. 2019. "A Simulation Study on the Potential of Moving Urban Freight by a Cross-City Railway Line" Sustainability 11, no. 21: 6088. https://doi.org/10.3390/su11216088
Note that from the first issue of 2016, this journal uses article numbers instead of page numbers. See further details here.