A Hierarchical Multilevel Approach in Assessing Factors Explaining Country-Level Climate Change Vulnerability


1
Laboratory of Operations Research, Department of Economics, University of Thessaly, 38333 Volos, Greece
2
Department of the Environment, University of the Aegean, 81132 Mytilene Lesvos, Greece
3
Operations & Information Management Department, Aston Business School, Birmingham Β4 7ΕΤ, UK
4
Department of Land Economy, University of Cambridge, Cambridge CB3 9EP, UK
*
Author to whom correspondence should be addressed.
Sustainability 2020, 12(11), 4438; https://doi.org/10.3390/su12114438
Submission received: 29 April 2020
/
Revised: 20 May 2020
/
Accepted: 27 May 2020
/
Published: 29 May 2020
(This article belongs to the Section Air, Climate Change and Sustainability)
Abstract
:Assessing vulnerability is key in the planning of climate change adaptation policies and, more importantly, in determining actions increasing resilience across different locations. This study presents the results of a hierarchical linear multilevel modeling approach that utilizes as dependent variable the Notre Dame Global Adaptation Initiative (ND-GAIN) Climate Change Vulnerability Index and explores the relative impact of a number of macro-level characteristics on vulnerability, including GDP, public debt, population, agricultural coverage and sociopolitical and institutional conditions. A 1995–2016 annual time series that yields a panel dataset of 192 countries is employed. Findings suggest that country-level climate change vulnerability is responding (strongly) to the majority of the explanatory variables considered. Findings also confirm that less-developed countries demonstrate increased vulnerability compared to the developed ones and those in transition stages. While these results indeed warrant further attention, they provide a background for a more nuanced understanding of aspects defining country-level patterns of climate vulnerability.
1. Introduction—Rationale for the Study
It is now widely accepted that scientists and practitioners need to focus on the improvement of adaptation initiatives in order to tackle climate change both through short and long-term policy measures [1]. Adaptation should focus on increasing resilience across different sectors [2] including agriculture [3], biodiversity conservation [4] and water resources [5], targeting different impacts of climate change such as flooding [6] and heat waves [7].
The decision on the type of policies that need to be developed and the urgency with which they need to be implemented are strongly dependent on a number of factors. One of the most important is the level of vulnerability [2,8]. Vulnerability refers to “the propensity or predisposition to be adversely affected. [It] encompasses a variety of concepts including sensitivity or susceptibility to harm and lack of capacity to cope and adapt” [9]. Vulnerability refers both to the ecological [10,11] and the human systems [12,13]; for example, to what extent an ecosystem is vulnerable due to changes in species’ distribution or to what extent a local community is exposed to flooding.
Assessing vulnerability is key in the planning of climate change adaptation policies [14] and, more importantly, in determining actions increasing resilience across different locations [15]. In order to facilitate the planning and decision-making process, several vulnerability indices have been proposed in the literature [16]. These indices capture vulnerability on different scales—local, regional or national [17,18,19] and also across different systems such as local communities [20], national economies [21] and coastal biophysical systems [22].
Despite the increase of proposed indices on vulnerability and the need to identify key factors influencing it [23], the majority of the literature in this research field focuses only on one sector’s influence on vulnerability (e.g., the impact of population, governance and agriculture on vulnerability). However, it is equally important to explore which are the key indicators influencing vulnerability to climate change by adopting a multi-dimensional approach. In particular, it is crucial to explore vulnerability across different sectors, taking into consideration a number of factors reflecting ecological, economic and human capital dimensions.
A significant starting point is the role of agriculture in determining vulnerability levels. This is because agro-forestry systems are severely impacted by climate change [24] and are expected to play an important role in reducing vulnerability levels. Several studies have highlighted that agriculture practices will need to change [25] towards a more sustainable path [26] through systemic-structural changes and the diversification of current production systems [27]. Only through such changes will it be possible to increase adaptation and resilience to climate change in agriculture-dependent areas [16,28,29].
In relation to the economic system, it is widely accepted that poorer communities are the most vulnerable due to living conditions as they are more exposed to weather changes [30,31,32]. Climate change results in additional financial burdens for such communities and nations due to an increased need for adaptation investments. For this reason, countries with higher debt levels are considered more vulnerable to climate change [33,34], and there are increased calls to find a balance between investments and reducing national debt [35].
In terms of the political system, several scholars underline that the institutions in place will also have a significant impact on the efficiency of climate change adaptation policies [36]. Unstable political environments [37] and lack of effective formal institutions managing natural resources [38] are often the most important barriers in climate change adaptation and tackling vulnerability levels. There is a need for continuous support from governmental actors [39,40] and stronger collaboration across different entities and layers of governance [41,42] in order to reduce vulnerability.
Finally, although the social system is often the least researched, it is equally important. A number of studies underline the role of the human population in climate change adaptation, referring both to the size of households [43] and, more importantly, the density [44] and proximity to dangerous inevitable natural events [45]. Higher population density, especially in urban areas, may provide enabling conditions that increase adaptation [44] together with external interventions [46], but there is still conflicting evidence as to whether higher density in large conurbations does actually increase vulnerability [47,48,49,50].
Along these lines, Younus and Kabir [51] assess household vulnerability along with sustainable livelihoods in Bangladesh by relying on 22 effective variables and with vulnerability functioned by three mainstream components, namely exposure, sensitivity and adaptive capacity. Similarly, Shvidenko et al. [52] consider the effects of expected climate change on the vulnerability of Ukrainian forests by relying on global and regional climatic models (RCM). In all these, Oh et al. [53] develop a Korean climate change vulnerability assessment tool, the Vulnerability Assessment Tool to build Climate Change Adaptation Plan (VESTAP).
Based on the above evidence, this study aims to explore the effect of different macro-level characteristics on national climate change vulnerability. We employ as dependent variable the Notre Dame Global Adaptation Initiative (ND-GAIN) Climate Change Vulnerability Index (CVI), a metric used in order to inform decision-making and facilitate adaptation planning [14]. We then explore how country-level indices influence the level of vulnerability on a national level. Influenced by the literature mentioned above, we explore the impact of a number of indicators on vulnerability including GDP, public debt, population, agricultural coverage and sociopolitical and institutional conditions.
The rest of the paper is structured as follows. Next, our model specifications and variables employed in the assessment are outlined. The following section presents the findings in terms of descriptive statistics and the hierarchical linear multilevel model we opted for to examine the effects of the explanatory variables on country-level climate vulnerability. The paper concludes with research and policy implications. Table 1 provides a list of the dependent and independent variables.
2. Material and Methods
2.1. Variable Selection
We employ a 1995–2016 annual time series, which yields a panel dataset of 192 countries. We use data on country-level Climate Vulnerability Index (CVI) scores retrieved from the Notre Dame Global Adaptation Initiative (ND-GAIN) scaled 0–1. From the World Bank, we retrieve data on GDP per capita (GDPc) based on purchasing power parity (PPP; US$), long term external debt (EDLT; US$), historical public debt (PD; Debt to GDP ratio), net official development assistance per capita (NODAc; US$), total population (POP), urban population (UPOP) and population density (POPD; thousands of people/km2). Data on agricultural area (AGR; km2) and forest area (FOR; km²) are retrieved from FAOSTAT and mean years of schooling (MYS) were drawn from the United Nations Development Programme database. From the World Governance Indicators project, we take data on government effectiveness (GE), political stability (PS) and regulatory quality (RQ) (estimates range from approximately −2.5 to 2.5, with higher values corresponding to better performance), which serve as proxies of institutional conditions affecting governance on climate adaptation. In this respect, we also test institutions using political rights (PR) as well as civil liberties (CL) indicators (measured on a 1–7 scale, with lower scores suggesting more democratic characteristics) obtained from the Freedom House reports.
2.2. Model Specification
For the assessment of the effects of the explanatory variables on country-level climate vulnerability (which is proxied by the ND-GAIN index), a 3-level hierarchical linear multilevel (HLM) model is utilized [54]. Our data constitute a typical example of the HLM class of models, which belong to the family of Ordinary Least Squares (OLS) models and are typically utilized when the predictor variables vary at more than one level [55]. We fit models that explicitly take into consideration the nested structure of the data, as presented by the HLM model formulation. In this way the within variable correlations are effectively taken into account, resulting in more efficient and valid estimates in comparison to typical OLS regression, where independence in the data is assumed [54]. For our dataset, the annual scores on the vulnerability index are nested within the (J = 192) countries. In the following equations, the framework of the 3-level HLM model is analytically described. Suppose there are annual () estimations nested within each of the countries. In addition, there are measurements of a total of 15 explanatory variables nested within the countries. Then, the mathematical expression of the fitted HLM model(s) is:
Level 1:
where denotes the continuous estimation variable of vulnerability, the level 1 predictors are denoted as , and is the error term. As level 1 predictors, we hypothesize the covariates of GDPC, EDLT, PD, NODAC, POP, PD, UPOP, AGR, FOR, MYS, PS, GE, RQ, PR and CL.
Level 2:
The b -coefficients of the level 1 covariates are then treated as response variables through the following equation:
where is the level 2 predictor of country, and .
Level 3:
Finally, the level 3 equation is written as:
with being the covariate of year effects.
For the categorical predictor variable of country, we have assigned the reference category of “COUNTRY=Developing” and compared the latter with other two levels, i.e., “Transition economies” and “Developed countries”.
In our model formulation we are assuming that the “Year” variable is a random effects covariate, where all remaining covariates constitute the fixed effects of the model. To measure the random effects of “year” variable, we calculate its variance partition coefficient (VPC), as given by:
where denotes the variance of and are the variances of the yearly random effects.
In order to assess model fit, we take a model comparison approach, starting by fitting a null model (denoted as Model 1), including as predictors only the grand mean and the random effects of “year” and subsequently adding one block of new predictor variables each time to perform the comparison between the two nested models. Model 2 adds the “country” fixed effects, whereas Model 3 incorporates variables of macroeconomic stability. In Model 4, we add variables explaining population and area dynamics, while Model 5 is our ‘complete’ model, including variables of institutional maturity and efficiency. The significance of the models is tested using the likelihood ratio test (LRT). Thus, each time, the initially fitted model (null model) is compared with the alternative model including the additional parameters via LRT [54]. Subsequently, Model 3 is tested against the Model 2, etc.
3. Results
3.1. Descriptive Statistics
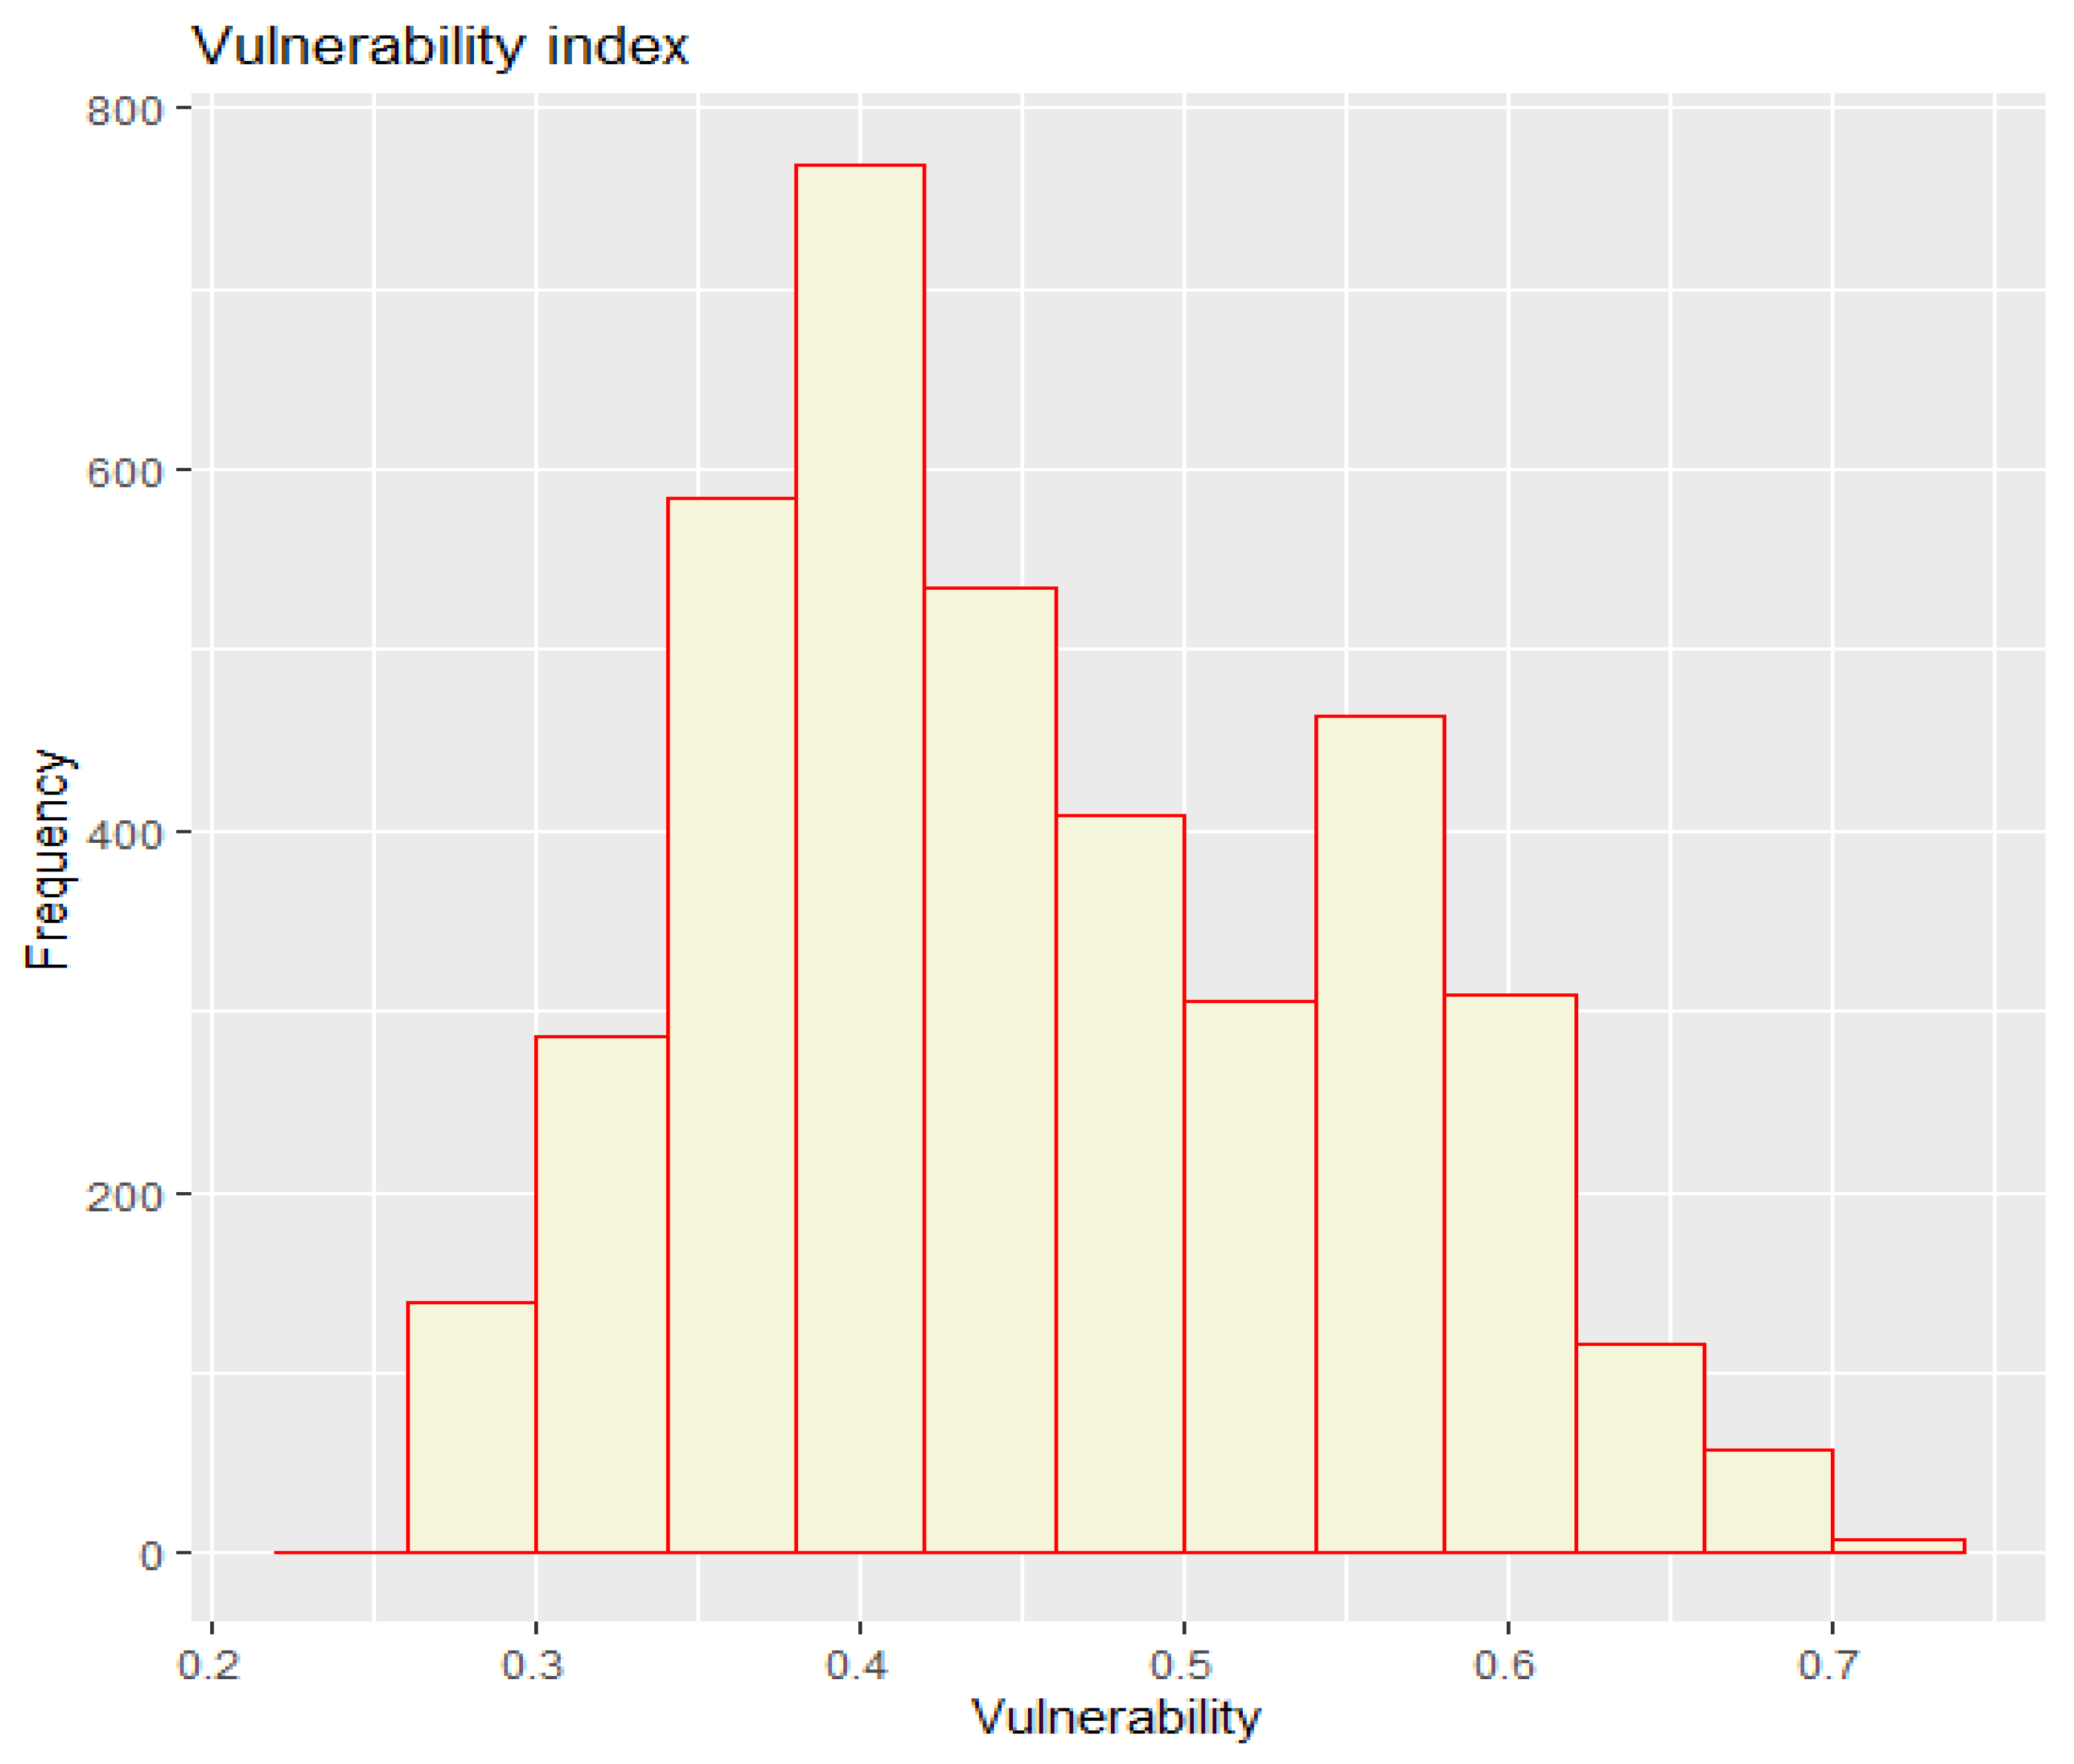
Prior to fitting the data through HLM and examining associations between the response variable of the vulnerability index and the previously described covariates, the normality of the response variable of vulnerability is checked to ensure the robustness and validity of results obtained by fitting the hierarchical linear model. Figure 2 is the histogram plot of the vulnerability values, indicating the resemblance of data to a Gaussian distribution.
The Kolmogorov-Smirnov test for normality, conducted in R software, indicated that the variable of vulnerability is normally distributed (D = 0.607; p-value < 0.001). Hence, the choice of a hierarchical linear model approach is deemed suitable for carrying out the analysis. Descriptive statistics in terms of mean, median and minimum and maximum values for the response and the explanatory variables are presented in Table 2. Correlations for the variables included in the empirical analysis are presented in Table 3.
3.2. HLM Model Fit Results
Table 4 shows the results for model comparisons between the nested models. The likelihood ratio test (LRT) indicated that each subsequent model is statistically significant in comparison to the previous model. Model 5, including all initially selected covariates, is statistically significant at the 5% significance level; hence, upon selection of the latter model we additionally perform covariate selection based on a backward elimination algorithm.
The finally selected significant covariates along with parameter estimates and corresponding 95% confidence intervals are presented in Table 5.
The results reveal that developing countries positively affect the vulnerability performance in comparison to the “transition economies” (beta = −0.023; p-value < 0.05) and the “developed” groups of countries (beta = −0.112; p-value < 0.05). GDPC, UPOP, MYS, PS, GE and RQ show a negative effect on the level of vulnerability; hence, higher levels of these variables result in reduced vulnerability. In contrast, by observing the results of the final best selected HLM model, we see that PD has a positive effect on the CVI (beta = 0.0054; p-value < 0.05). Similar positive effects are found for NODAC (beta = 0.0071; p-value < 0.05), POP (beta = 0.000106; p-value < 0.05), POPD (beta = 0.0034; p-value < 0.05) and AGR (beta = 0.0012; p-value < 0.05).
With respect to the effects of the random term of the “year” covariate, estimated is only 5.13%, an indication that the year to year variation is not an important factor that explains variability in the CVI.
4. Concluding Remarks
Despite the policy and governance literature on country-level climate change vulnerability offering actionable insights on impact and possible courses of action, an examination of underlying key explanatory parameters is still thin on the ground. In this paper, we attempt to take this debate forward with a particular focus on revisiting critical socioeconomic and institutional factors determining how vulnerable countries are to climate change impacts. In this respect, relying on well-established metrics of macro-level performance, we provide novel knowledge on a research strand where little evidence is available both in terms of cross-country comparisons and time series data analysis.
By employing a 3-level hierarchical linear multilevel model we find that country-level climate change vulnerability is responding (strongly) to most of the variables considered. Specifically, economic growth (GDPc), demographic transition from rural to urban areas (UPOP), human capital development in terms of educational attainment (MYS) as well as formal institutional arrangements (PS, GE and RQ) all contribute to reduced vulnerability to climate change. The results suggest that the variables of institutional maturity and efficiency are critically important in reducing vulnerability levels. In contrast, public debt accumulation (PD), official development assistance (NODAc) total population (POP) and population density (POPD) as well area dynamics in terms of agricultural land use (AGR), all lead to increased vulnerability levels. Findings also confirm that less-developed nations demonstrate increased climate change vulnerability levels compared to the developed ones and those in transition stages. While these results indeed warrant further attention, they provide a background for a more nuanced understanding of aspects defining country-level patterns of climate vulnerability.
Developing countries are really vulnerable as they rely on sectors that are sensitive (like agriculture, forestry and fishery industries) and have poor health systems, vast population density increases due to high urbanization and unsafe protection from unexpected weather events. At the same time these countries face also poverty issues together with various forms of environmental degradation in the form of pollution, biodiversity loss etc.
- Climate change may be a complexifying factor in coping with poverty. According to UNEP [58], some basic criteria to identify the main vulnerabilities are the timing and magnitude of the effects, the persistence and reversibility, the potential for adaptation and the estimates of the likelihood of effects and vulnerability together with the distributional aspects of these effects.
- Vulnerability is more multifaceted than risk. The magnitude of the effects is verified by its scale, that is, by the number of people or the area influenced and its intensity in terms of the degradation caused. Obviously, timing is crucial in such cases, and it makes an event more severe if an event is going to occur sooner rather than later in the future. At the same time, a deteriorating effect on ecosystems and biodiversity is more rigorous if it is irreversible and persistent. The former may affect many future generations, changing regional or global landscapes and biochemical cycles [59] with, among others, extinctions of species [60] and loss of unique cultures [61].
- The potential for adaptation is also important, with lower feasibility for effective adaptation characterizing the main vulnerability effects. Potential adaptation may alleviate global warming effects in a different way between and within regions and sectors [62], raising serious issues of equity and distribution effects that influence income, gender and age, among others, differently.
- Future research can focus on regional patterns of vulnerability by employing locally contextual metrics and variables describing intrinsic characteristics of country groups. Introducing a wider spectrum of proxies for cross-border interactions, technological advancement, stocks of social capital, health estimates and/or informal institutions such as national culture traits may yield more comprehensive outlooks of leverage points affecting transnational, national and/or subnational climate change vulnerability.
- Crucially, it could be of interest to further investigate the phenomenon from diverse perspectives, utilizing appropriate variables at the various levels of analysis and exploring interactions occurring between levels (e.g., from the regional to the national level). In this regard, qualitative studies performed in vulnerability “hotspots” may offer supplementary supporting evidence on subtle national characteristics that may explain climate vulnerability and undermine pathways to building resilience. Resilience is a substantial concept when researching vulnerability as it refers to the ability of the system to absorb any byproducts and be reorganized. While the work described in this research note is preliminary, we believe it could spark discussion and allow for better insights into the mobilization of policy-making and future research incorporating the complex perspective on how national traits may influence national adaptation capacities as well as responses.
Author Contributions
Conceptualization, A.S., G.H. and C.M.; methodology, C.M., G.H. and A.S.; investigation, C.M., G.H.; data gathering and analysis and curation, C.M., G.H. and A.S.; writing—original draft preparation, A.S., C.M. and N.J.; writing—review and editing, G.H., A.S. and C.M.; supervision, G.H. and A.S.; project administration, G.H. and A.S. All authors have read and agreed to the published version of the manuscript.
Funding
This research received no external funding.
Conflicts of Interest
The authors declare no conflict of interest.
References
- IPCC. Global Warming of 1.5 °C. An IPCC Special Report on the Impacts of Global Warming Of 1.5 °C Above Pre-Industrial Levels and Related Global Greenhouse Gas Emission Pathways, in The Context of Strengthening the Global Response to the Threat of Climate Change, Sustainable Development, and Efforts to Eradicate Poverty; Intergovernmental Panel on Climate Change: Geneva, Switzerland, 2018. [Google Scholar]
- Adger, W.N. Vulnerability. Glob. Environ. Chang. 2006, 16, 268–281. [Google Scholar] [CrossRef]
- Iglesias, A.; Garrote, L. Adaptation strategies for agricultural water management under climate change in Europe. Agric. Water Manag. 2015, 155, 113–124. [Google Scholar] [CrossRef] [Green Version]
- Felton, A.; Gustafsson, L.; Roberge, J.M.; Ranius, T.; Hjältén, J.; Rudolphi, J.; Lindbladh, M.; Weslien, J.; Rist, L.; Brunet, J.; et al. How climate change adaptation and mitigation strategies can threaten or enhance the biodiversity of production forests: Insights from Sweden. Biol. Conserv. 2016, 194, 11–20. [Google Scholar] [CrossRef]
- Gohari, A.; Mirchi, A.; Madani, K. System Dynamics evaluation of climate change adaptation strategies for water resources management in central Iran. Water Resour. Manag. 2017, 31, 1413–1434. [Google Scholar] [CrossRef] [Green Version]
- Marfai, A.; Sekaranom, A.B.; Ward, P. Community responses and adaptation strategies toward flood hazard in Jakarta, Indonesia. Nat. Hazards 2014, 75, 1127–1144. [Google Scholar] [CrossRef]
- Magoni, M.; Munoz, C.M. Climate Change and Heat Waves in Colombia. Possible Effects and Adaptation Strategies. In Sustainable Urban Development and Globalization; Petrillo, A., Bellaviti, P., Eds.; Springer: Cham, Switzerland, 2018. [Google Scholar]
- European Environment Agency. Vulnerability and Adaptation to Climate Change in Europe. EEA Technical Report, no7/2005, Copenhagen. 2006. Available online: https://www.eea.europa.eu/publications/technical_report_2005_1207_144937 (accessed on 15 May 2020).
- IPCC. Fifth Assessment Report–Impacts, Adaptation and Vulnerability; Intergovernmental Panel on Climate Change: Geneva, Switzerland, 2014. [Google Scholar]
- Pacifi, M.; Foden, W.B.; Visconti, P.; Watson, J.E.M.; Butchart, S.H.M.; Kovacs, K.M.; Scheffers, B.R.; Hole, D.G.; Martin, T.G.; Akcakaya, H.T.; et al. Assessing species vulnerability to climate change. Nat. Clim. Chang. 2015, 5, 215–224. [Google Scholar] [CrossRef]
- Osland, M.J.; Enwright, N.M.; Day, R.H.; Gabler, C.A.; Stagg, C.L.; Grace, J.B. Beyond just sea-level rise: Considering macroclimatic drivers within coastal wetland vulnerability assessments to climate change. Glob. Chang. Biol. 2016, 22, 1–11. [Google Scholar] [CrossRef]
- Abid, M.; Schilling, J.; Scheffran, J.; Zulfiqar, F. Climate change vulnerability, adaptation and risk perceptions at farm level in Punjab, Pakistan. Sci. Total Environ. 2016, 547, 447–460. [Google Scholar] [CrossRef]
- Brzoska, M.; Fröhlich, C. Climate change, migration and violent conflict: Vulnerabilities, pathways and adaptation strategies. Migr. Dev. 2016, 5, 190–210. [Google Scholar] [CrossRef]
- Young, B.E.; Dubois, N.S.; Rowland, E.L. Using the climate change vulnerability index to inform adaptation planning: Lessons, innovations and next steps. Wildl. Soc. 2014, 39, 174–181. [Google Scholar] [CrossRef]
- Maru, Y.T.; Smith, M.S.; Sparrow, A.; Pinho, P.F.; Dube, O.P. A linked vulnerability and resilience framework for adaptation pathways in remote disadvantaged communities. Glob. Environ. Chang. 2014, 28, 337–350. [Google Scholar] [CrossRef]
- Nguyen, T.X.; Bonetti, J.; Rogers, K.; Woodroffe, C.D. Indicator-based assessment of climate-change impacts on coasts: A review of concepts, methodological approaches and vulnerability indices. Ocean Coast. Manag. 2016, 123, 18–43. [Google Scholar] [CrossRef] [Green Version]
- O’Brien, K.L.; Sygna, L.; Haugen, J.E. Resilient of vulnerable? A multi-assessment of climate impacts and vulnerability in Norway. Clim. Chang. 2004, 64, 193–225. [Google Scholar] [CrossRef]
- Zanetti, V.B.; Cabral De Sousa Junior, W.; de Freitas, D.M. A climate change vulnerability index and case study in Brazilian coastal city. Sustainability 2016, 8, 811. [Google Scholar] [CrossRef] [Green Version]
- Stennett-Brown, R.K.; Stephenson, T.S.; Taylor, M.A. Caribbean climate change vulnerability: Lessons from an aggregate index approach. PLoS ONE 2019. [Google Scholar] [CrossRef] [PubMed] [Green Version]
- Vincent, K. Creating an index of social vulnerability to climate change for Africa. Tyndall Centre Clim. Chang. Res. Work. Pap. 2004, 56, 1–50. [Google Scholar]
- Allison, E.H.; Perry, A.L.; Badjeck, M.-C.; Adger, W.N.; Brown, K.; Conway, D.; Halls, A.S.; Pilling, G.M.; Reynolds, J.D.; Andrew, N.L.; et al. Vulnerability of national economies to the impacts of climate change on fisheries. Fish Fish. 2009, 10, 173–196. [Google Scholar] [CrossRef] [Green Version]
- Balica, S.F.; Wright, N.G.; van der Meulen, F. A flood vulnerability index for coastal cities and its use in assessing climate change impacts. Nat. Hazards 2012, 64, 73–105. [Google Scholar] [CrossRef] [Green Version]
- Bohle, H.G.; Downing, T.E.; Watts, M.J. Climate change and social vulnerability: Toward a sociology and geography of food insecurity. Glob. Environ. Chang. 1994, 4, 37–48. [Google Scholar] [CrossRef]
- Fischer, G.; Shah, M.M.; van Velthuizen, H.T. Climate Change and Agricultural Vulnerability; IIASA: Laxenburg, Austria, 2002. [Google Scholar]
- Reidsma, P.; Ewert, F. Regional farm diversity can reduce vulnerability of food production to climate change. Ecol. Soc. 2008, 13, 1–16. [Google Scholar] [CrossRef] [Green Version]
- Ching, L.L. The Case for Sustainable Agriculture: Meeting Productivity and Climate Challenges; Third World Network (TWN): Penang, Malaysia, 2009. [Google Scholar]
- Howden, S.M.; Soussana, J.-F.; Tubiello, F.N.; Chhetri, N.; Dunlop, M.; Meinke, H. Adapting agrilcute to climate change. PNAS 2007, 104, 19691–19696. [Google Scholar] [CrossRef] [PubMed] [Green Version]
- Harrison, M.T.; Cullen, B.R.; Rawnsley, R.P. Modelling the sensitivity of agricultural systems to climate change and extreme climatic events. Agric. Syst. 2016, 148, 135–148. [Google Scholar] [CrossRef]
- Locatelli, B.; Pavageau, C.; Pramova, E.; Di Gregorio, M. Integrating climate change mitigation and adaptation in agriculture and forestry: Opportunities and trade-offs. Wiley Interdiscip. Rev. Clim. Chang. 2015, 6, 585–598. [Google Scholar] [CrossRef]
- Tol, R.S.; Downing, T.E.; Kuik, O.J.; Smith, J.B. Distributional aspects of climate change impacts. Glob. Environ. Chang. 2004, 14, 259–272. [Google Scholar] [CrossRef]
- United Nations. The World Economic and Social Survey 2016: Climate Change Resilience—An Opportunity for Reducing Inequalities; Department of Economic and Social Affairs, United Nations Secretariat: New York, NY, USA, 2016. [Google Scholar]
- Abeygunawardena, P.; Vyas, Y.; Knill, P.; Foy, T.; Harrold, M.; Steele, P.; Tanner, T.; Hirsch, D.; Oosterman, M.; Rooimans, J.; et al. Poverty and Climate Change: Reducing the Vulnerability of the Poor Through Adaptation (English); World Bank: Washington, DC, USA, 2009. [Google Scholar]
- Kling, G.; Lo, Y.C.; Murinde, V.; Volz, U. Climate Vulnerability and the Cost of Debt. Available online: https://ssrn.com/abstract=3198093 (accessed on 18 June 2018).
- Bowen, A.; Cochrane, S.; Fankhauser, S. Climate change, adaptation and economic growth. Clim. Chang. 2012, 113, 95–106. [Google Scholar] [CrossRef] [Green Version]
- Development Finance International. Debt Relief to Combat Climate Change; Government of Guyana, Chair of Commonwealth Ministerial Debt Sustainability Forum (CMDSF): New York, NY, USA, 2009.
- Grothmann, T.; Grecksch, K.; Winges, M.; Siebenhüner, B. Assessing institutional capacities to adapt to climate change: Integrating psychological dimensions in the Adaptive Capacity Wheel. Nat. Hazards Earth Syst. Sci. 2013, 13, 3369. [Google Scholar] [CrossRef] [Green Version]
- Miranda, M.L.; Hastings, D.A.; Aldy, J.E.; Schlesinger, W.H. The Environmental Justice Dimensions of Climate Change. Environ. Justice 2011, 4, 17–25. [Google Scholar] [CrossRef] [Green Version]
- Barnett, J.; Evans, L.S.; Gross, C.; Kiem, A.S.; Kingsford, R.T.; Palutikof, J.P.; Pickering, C.M.; Smithers, S.G. From barriers to limits to climate change adaptation: Path dependency and the speed of change. Ecol. Soc. 2015, 20, 5. [Google Scholar] [CrossRef] [Green Version]
- Abass, R.; Mensah, A.M.; Fosu-Mensah, B.Y. The Role of Formal and Informal Institutions in Smallholder Agricultural Adaptation: The Case of Lawra and Nandom Districts, Ghana. West Afr. J. Appl. Ecol. 2018, 26, 56–72. [Google Scholar]
- Hein, W.; Wilson, C.; Lee, B.; Rajapaksa, D.; Moel, H.; Athukorala, W.; Managi, S. Climate Change and Natural Disasters: Government Mitigation Activities and Public Property Demand Response. Land Use Policy 2019, 82, 436–443. [Google Scholar] [CrossRef]
- Glaas, E.; Jonsson, A.; Hjerpe, M.; Andersson-Sköld, Y. Managing climate change vulnerabilities: Formal institutions and knowledge use as determinants of adaptive capacity at the local level in Sweden. Local Environ. 2010, 15, 525–539. [Google Scholar] [CrossRef]
- Nordgren, J.; Stults, M.; Meerow, S. Supporting local climate change adaptation: Where we are and where we need to go. Environ. Sci. Policy 2016, 66, 344–352. [Google Scholar] [CrossRef]
- Baur, A.H.; Thess, M.; Kleinschmit, B.; Creutzig, F. Urban climate change mitigation in Europe: Looking at and beyond the role of population density. J. Urban Plann. Dev. 2014, 140, 04013003. [Google Scholar] [CrossRef] [Green Version]
- Güneralp, B.; Zhou, Y.; Ürge-Vorsatz, D.; Gupta, M.; Yu, S.; Patel, P.L.; Fragkias, M.; Li, X.; Seto, K.C. Global scenarios of urban density and its impacts on building energy use through 2050. Proc. Natl. Acad. Sci. USA 2017, 114, 8945–8950. [Google Scholar] [CrossRef] [PubMed] [Green Version]
- Athukorala, W.; Martin, W.; Wilson, C.; Rajapaksa, D. Valuing bushfire risk to homeowners: Hedonic property values study in Queensland, Australia. Econ. Anal. Policy 2019, 63, 44–56. [Google Scholar] [CrossRef]
- Jawid, A.; Khadjavi, M. Adaptation to climate change in Afghanistan: Evidence on the impact of external interventions. Econ. Anal. Policy 2019, 64, 64–82. [Google Scholar] [CrossRef]
- Dodman, D. Urban Density and Climate Change. Paper 1. United Nations Population Fund (UNFPA) Analytical Review of the Interation Between Urban Growth Trends and Environmental Changes. Available online: https://www.uncclearn.org/sites/default/files/inventory/unfpa14.pdf (accessed on 15 May 2009).
- Stone, B.; Hess, J.J.; Frumkin, H. Urban form and extreme heat events: Are sprawling cities more vulnerable to climate change than compact cities? Environ. Health Perspect. 2010, 118, 1425–1428. [Google Scholar] [CrossRef] [Green Version]
- Hochrainer-Stigler, S.; Linnerooth-Bayer, J.; Mochizuki, J. Flood Proofing Low-Income Houses in India: An Application of Climate-Sensitive Probabilistic Benefit-Cost Analysis. Econ. Disaster Clim. Chang. 2019, 3, 23–38. [Google Scholar] [CrossRef] [Green Version]
- Pavel, T.; Mozumder, P. Household Preferences for Managing Coastal Vulnerability: State vs. Federal Adaptation Fund. Econ. Disaster Clim. Chang. 2019, 3, 281–304. [Google Scholar] [CrossRef]
- Younus, M.A.F.; Kabir, M.A. Climate Change Vulnerability Assessment and Adaptation of Bangladesh: Mechanisms, Notions and Solutions. Sustainability 2018, 10, 4286. [Google Scholar] [CrossRef] [Green Version]
- Shvidenko, A.; Buksha, I.; Krakovska, S.; Lakyda, P. Vulnerability of Ukrainian Forests to Climate Change. Sustainability 2017, 9, 1152. [Google Scholar] [CrossRef] [Green Version]
- Oh, K.-Y.; Lee, M.-J.; Jeon, S.-W. Development of the Korean Climate Change Vulnerability Assessment Tool (VESTAP)—Centered on Health Vulnerability to Heat Waves. Sustainability 2017, 9, 1103. [Google Scholar] [CrossRef] [Green Version]
- Raundebush, S.; Bryk, A. Hierarchical Linear Models, 2nd ed.; Sage Publications: Thousand Oaks, CA, USA, 2002. [Google Scholar]
- Raudenbush, S.W.; Bryk, A.S. Hierarchical Linear Models: Applications and Data Analysis Methods, 2nd ed.; Sage Publications: Thousand Oaks, CA, USA, 2002; ISBN 978-0-7619-1904-9. [Google Scholar]
- R Core Team. R: A Language and Environment for Statistical Computing; R Foundation for Statistical Computing: Vienna, Austria, 2012. [Google Scholar]
- Bates, D.M.; Maechler, M.; Bolker, B. Lme4: Linear mixed-effects models using S4 classes. R package version 0.999999-0. Open J. Mod. Linguist. 2012. [Google Scholar] [CrossRef] [Green Version]
- UNEP. Climate Change: Impacts, Adaptation and Vulnerability. Working Group II Contribution to the 4th Assessment Report of the Intergovernmental Panel on Climate Change; Cambridge University Press: Cambridge, UK, 2007. [Google Scholar]
- Menon, S.; Denman, K.L.; Brasseur, G.; Chidthaisong, A.; Ciais, P.; Cox, P.M.; Dickinson, R.E.; Hauglustaine, D.; Heinze, C.; Holland, E.; et al. Couplings between changes in the climate system and biogeochemistry. In Climate Change 2007: The Physical Science Basis. Contribution of Working Group I to the Fourth Assessment Report of the Intergovernmental Panel on Climate Change; Solomon, S., Qin, D., Manning, M., Chen, Z., Eds.; Cambridge University Press: Cambridge, UK, 2007; pp. 499–587. [Google Scholar]
- Lovejoy, T.E.; Hannab, L. (Eds.) Climate Change and Biodiversity; Yale University Press: New Haven, CT, USA, 2005; p. 440. [Google Scholar]
- Barnett, J.; Adger, W.N. Climate dangers and atoll countries. Clim. Chang. 2003, 61, 321–337. [Google Scholar] [CrossRef]
- O’Brien, K.; Leichenko, R.; Kelkar, U.; Venema, H.; Aandahl, G.; Tompkins, H.; Javed, A.; Bhadwal, S.; Barg, S.; Nygaard, L.; et al. Mapping vulnerability to multiple stressors: Climate change and globalization in India. Glob. Environ. Chang. 2004, 14, 303–313. [Google Scholar] [CrossRef]
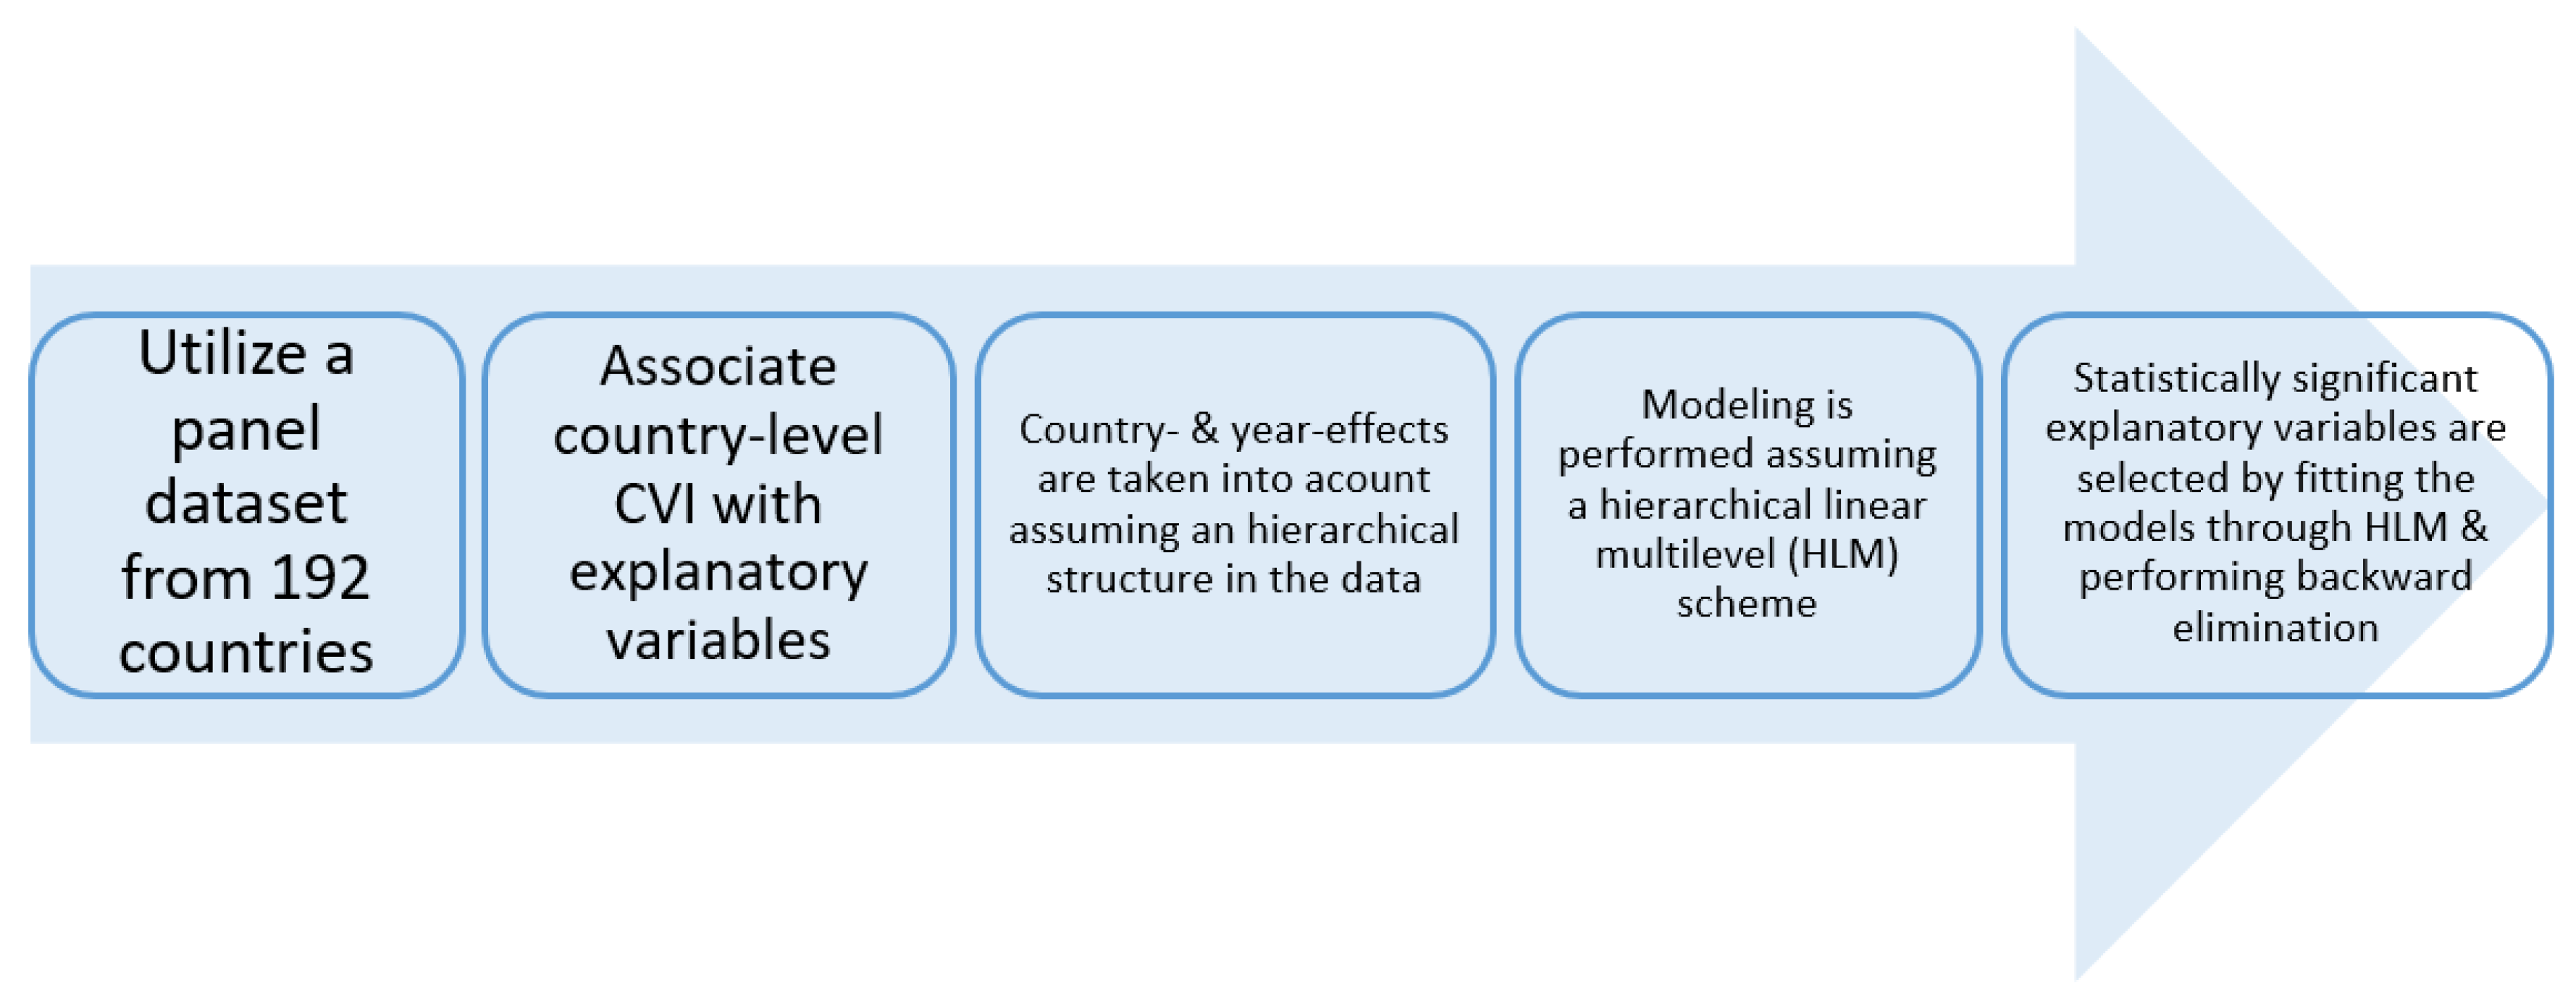
Figure 1.
Step-by-step description of methodology followed in the study.

Figure 2.
Histogram plot for the vulnerability index values.


Table 1.
Definitions of variables.
| Variable | Abbreviation | Definition |
|---|---|---|
| Climate Vulnerability Index | CVI | Measures the propensity or predisposition of human societies to be negatively impacted by climate hazards. The Notre Dame Global Adaptation Initiative (ND-GAIN) Country Index assesses the vulnerability of a country by considering 6 life-supporting sectors: food, water, health, ecosystem services, human habitat and infrastructure. CVI is scaled 0–1, where a higher score means higher vulnerability (Climate Change Adaptation Program, University of Notre Dame Environmental Change Initiative). |
| GDP per capita (PPP) | GDPc | The sum of gross value added by all resident producers in the economy plus any product taxes and minus any subsidies not included in the value of the products ($/World Bank). |
| External debt, long term | EDLT | Long-term debt is debt that has an original or extended maturity of more than one year (US dollars/World Bank). |
| Historical public debt | PD | Includes domestic and foreign liabilities such as currency and money deposits, securities other than shares and loans. It is the gross amount of government liabilities reduced by the amount of equity and financial derivatives held by the government (% of GDP/World Bank). |
| Net official development assistance per capita | NODAc | Consists of disbursements of loans made on concessional terms (net of repayments of principal) and grants by official agencies of the members of the Development Assistance Committee (DAC), by multilateral institutions, and by non-DAC countries to promote economic development and welfare in countries and territories in the DAC list of ODA recipients ($/World Bank). |
| Total population | POP | Based on the de facto definition of population, which counts all residents regardless of legal status or citizenship - except for refugees not permanently settled in the country of asylum, who are generally considered part of the population of their country of origin (World Bank). |
| Urban population | UPOP | Refers to people living in urban areas as defined by national statistical offices. It is calculated using population estimates and urban ratios from the United Nations World Urbanization Prospects (World Bank). |
| Population density | POPD | Midyear population divided by land area in square kilometers (World Bank). |
| Agricultural area | AGR | Refers to the share of land area that is arable, under permanent crops and under permanent pastures (km²/FAO). |
| Forest area | FOR | Forest area is land under natural or planted stands of trees of at least 5 m in situ, whether productive or not, and excludes tree stands in agricultural production systems (km²/FAO). |
| Mean years of schooling | MYS | Average number of years of education received by people aged 25 and older, converted from education attainment levels using official durations of each level (United Nations Development Programme). |
| Government effectiveness | GE | Reflects perceptions of the quality of public services, the quality of the civil service and the degree of its independence from political pressures, the quality of policy formulation and implementation, and the credibility of the government’s commitment to such policies. Estimates range from approximately –2.5 (weak) to 2.5 (strong) governance performance (World Bank/Worldwide Governance Indicators project). |
| Political stability | PS | Measures perceptions of the likelihood of political instability and/or politically motivated violence. Estimates range from approximately −2.5 (weak) to 2.5 (strong) governance performance (World Bank/Worldwide Governance Indicators project). |
| Regulatory quality | RQ | Reflects perceptions of the ability of the government to formulate and implement sound policies and regulations that permit and promote private sector development. Estimates range from approximately −2.5 (weak) to 2.5 (strong) governance performance (World Bank/Worldwide Governance Indicators project). |
| Political rights | PR | The political rights indicator assesses electoral process, political pluralism and participation and functioning of government. The civil liberties indicator assesses freedom of expression and belief, associational and organizational rights, rule of law and personal autonomy and individual rights. Each rating ranges from 1 to 7, with 1 representing the greatest degree of freedom and 7 the smallest degree of freedom (Freedom House - Freedom in the World). |
| Civil liberties | CL |
Table 2.
Descriptive statistics for the vulnerability index and explanatory variables.
| Variable | Mean | Median | Min | Max |
|---|---|---|---|---|
| CVI | 0.452 | 0.433 | 0.259 | 0.713 |
| GDPC | 1350.4 | 7316.2 | 272.3 | 129,349 |
| EDLT | 22,182,392,000 | 3,667,001,000 | 0 | 618,675,469,000 |
| PD | 60.08 | 48.69 | 0.318 | 523.38 |
| NODAC | 120.71 | 40.88 | −133.56 | 8249 |
| POP | 3,435,821 | 71,995,500 | 9203 | 1,378,665,000 |
| POPD | 25.9034 | 73.568 | 1.479 | 21,389.1 |
| UPOP | 168,183,21 | 33,764,47 | 4058 | 7,827,784,14 |
| AGRI | 258,625 | 40,299 | 4 | 5,278,330 |
| FOR | 211,824 | 25,792 | 0 | 8,151,356 |
| MYS | 7.554 | 7.8 | 0.7 | 13.4 |
| PS | −0.048 | 0.04 | −3.31 | 1.76 |
| GE | −0.063 | −0.23 | −2.45 | 2.44 |
| RQ | −0.07 | −0.2 | −2.65 | 2.26 |
| PR | 3.391 | 3 | 1 | 7 |
| CL | 3.364 | 3 | 1 | 7 |
Table 3.
Correlation coefficient matrix.
| Variable | (1) | (2) | (3) | (4) | (5) | (6) | (7) | (8) | (9) | (10) | (11) | (12) | (13) | (14) | (15) | (16) |
|---|---|---|---|---|---|---|---|---|---|---|---|---|---|---|---|---|
| (1) CVI | 1 | - | - | - | - | - | - | - | - | - | - | - | - | - | - | - |
| (2) GDPC | −0.591 ** | 1 | - | - | - | - | - | - | - | - | - | - | - | - | - | - |
| (3) EDLT | −0.330 ** | 0.420 ** | 1 | - | - | - | - | - | - | - | - | - | - | - | - | - |
| (4) PD | 0.216 ** | −0.140 ** | −0.120 ** | 1 | - | - | - | - | - | - | - | - | - | - | - | - |
| (5) NODAC | 0.191 ** | n.s. | −0.190 ** | n.s. | 1 | - | - | - | - | - | - | - | - | - | - | - |
| (6) POP | n.s. | −0.043 ** | 0.547 ** | n.s. | −0.079 ** | 1 | - | - | - | - | - | - | - | - | - | - |
| (7) POPD | −0.036 * | 0.219 ** | n.s. | 0.049 ** | 0.107 ** | n.s. | 1 | - | - | - | - | - | - | - | - | - |
| (8) UPOP | −0.121 ** | n.s. | 0.668 ** | n.s. | −0.085 ** | 0.945 ** | n.s. | 1 | - | - | - | - | - | - | - | - |
| (9) AGRI | −0.126 ** | 0.041 * | 0.653 ** | −0.074 ** | −0.120 ** | 0.626 ** | −0.080 ** | 0.723 ** | 1 | - | - | - | - | - | - | - |
| (10) FOR | −0.141 ** | 0.035 * | 0.642 ** | n.s. | −0.089 ** | 0.298 ** | −0.066 ** | 0.433 ** | 0.573 ** | 1 | - | - | - | - | - | - |
| (11) MYS | −0.805 ** | 0.520 ** | 0.206 ** | −0.211 ** | 0.159 ** | −0.047 ** | 0.067 ** | 0.040 * | 0.069 ** | 0.101 ** | 1 | - | - | - | - | - |
| (12) PS | −0.487 ** | 0.477 ** | −0.081 ** | −0.111 ** | 0.310 ** | −0.154 ** | 0.114 ** | −0.119 ** | −0.099 ** | −0.080 ** | 0.522 ** | 1 | - | - | - | - |
| (13) GE | −0.716 ** | 0.668 ** | 0.235 ** | −0.053 ** | n.s. | n.s. | 0.210 ** | 0.074 ** | 0.048 ** | 0.040 * | 0.675 ** | 0.683 ** | 1 | - | - | - |
| (14) RQ | −0.678 ** | 0.630 ** | 0.176 ** | −0.091 ** | −0.055 ** | n.s. | 0.198 ** | 0.037 * | n.s. | 0.042 * | 0.640 ** | 0.637 ** | 0.933 ** | 1 | - | - |
| (15) PR | 0.440 ** | −0.195 ** | −0.044 * | n.s. | −0.274 ** | 0.064 ** | −0.047 ** | 0.033 * | 0.068 ** | n.s. | −0.490 ** | −0.578 ** | −0.623 ** | −0.654 ** | 1 | - |
| (16) CL | 0.476 ** | −0.247 ** | n.s. | 0.062 ** | −0.305 ** | 0.089 ** | −0.092 ** | 0.052 ** | 0.070 ** | n.s. | −0.542 ** | −0.650 ** | −0.674 ** | −0.709 ** | 0.934 ** | 1 |
** Correlation is significant at the 1% level of significance; * Correlation is significant at the 5% level of significance; n.s.: non-significance.
Table 4.
Model selection for the candidate models through the likelihood ratio test.
| Model | Variables | LRT | p-Value |
|---|---|---|---|
| 1 | year | −3696.4 | - |
| 2 | Year, country | −3879.4 | <0.001 |
| 3 | Year, country, GDPC, EDLT, PD, NODAC | −5493 | <0.001 |
| 4 | Year, country, GDPC, EDLT, PD, NODAC, POP, POPD, UPOP, AGR, FOR | −5556.9 | <0.001 |
| 5 | Year, country, GDPC, EDLT, PD, NODAC, POP, POPD, UPOP, AGR, FOR, MYS, PS, GE, RQ, PR, CL | −6113.1 | <0.001 |
Table 5.
Parameter estimates along with the 95% confidence intervals for the significant covariates of the best selected hierarchical linear multilevel (HLM) model.
Table 5.
Parameter estimates along with the 95% confidence intervals for the significant covariates of the best selected hierarchical linear multilevel (HLM) model.
| Independent Variable | Parameter Estimate | 95% Confidence Interval |
|---|---|---|
| Country Group (Reference Category: Developing) | ||
| Country = Transition economies | −0.023 | (−0.317, −0.164) |
| Country = Developed | −0.112 | (−0.197, −0.213) |
| GDPC | −0.007 | (−0.008, −0.0071) |
| PD | 0.0054 | (0.0089, 0.0097) |
| NODAC | 0.0071 | (0.0044, 0.0098) |
| POP | 0.000106 | (0.000607, 0.000156) |
| POPD | 0.0034 | (0.0023, 0.0047) |
| UPOP | −0.00043 | (−0.00058, −0.0003) |
| AGR | 0.0012 | (0.00055, 0.0018) |
| MYS | −0.012 | (−0.134, −0.113) |
| PS | −0.0033 | (−0.0065, −0.00023) |
| GE | −0.0077 | (−0.014, −0.0043) |
| RQ | −0.0087 | (−0.014, −0.0025) |
© 2020 by the authors. Licensee MDPI, Basel, Switzerland. This article is an open access article distributed under the terms and conditions of the Creative Commons Attribution (CC BY) license (http://creativecommons.org/licenses/by/4.0/).
Share and Cite
MDPI and ACS Style
Halkos, G.; Skouloudis, A.; Malesios, C.; Jones, N. A Hierarchical Multilevel Approach in Assessing Factors Explaining Country-Level Climate Change Vulnerability. Sustainability 2020, 12, 4438. https://doi.org/10.3390/su12114438
AMA Style
Halkos G, Skouloudis A, Malesios C, Jones N. A Hierarchical Multilevel Approach in Assessing Factors Explaining Country-Level Climate Change Vulnerability. Sustainability. 2020; 12(11):4438. https://doi.org/10.3390/su12114438
Chicago/Turabian StyleHalkos, George, Antonis Skouloudis, Chrisovalantis Malesios, and Nikoleta Jones. 2020. "A Hierarchical Multilevel Approach in Assessing Factors Explaining Country-Level Climate Change Vulnerability" Sustainability 12, no. 11: 4438. https://doi.org/10.3390/su12114438
Note that from the first issue of 2016, this journal uses article numbers instead of page numbers. See further details here.